Abstract
The Rice–Fish Symbiotic System in the Longxian village is the first Globally Important Agricultural Heritage System (GIAHS) in Asia. This paper examined the value transformation mechanism of the Longxian Rice–Fish Symbiotic System from the micro perspective of material cycle and energy flow and quantified its economic value using the gross ecosystem product (GEP). Using the InVEST model and ArcGIS tools, the GEP was estimated to be approximately CNY 116.51 million (approx. CNY 252,624 per hectare per year). The ecosystem regulating service value occupied more than 80% of the GEP. Within the regulating ecosystem services, the climate regulation value was the highest (CNY 55.72 million) followed by flood storage value (CNY 32.77 million). These two categories contributed 94.44% of the total value of regulating ecosystem services. The paper recommends employing GEP to evaluate the value of commodities and services provided by an ecosystem. The methodology and approach of the research can serve as an important reference for other GIAHS programs and provides a scientific and rigorous framework for accessing the economic value of agricultural heritage systems.
1. Introduction
Fish farming on wet rice fields holds importance in the history of Asia. In May 2005, the Food and Agriculture Organization (FAO) selected Globally Important Agricultural Heritage Systems (GIAHSs) around the world for the first time. The Rice–Fish Symbiotic System in Longxian village in Zhejiang province in China, which has more than 1200 years of farming history, was the only project selected in Asia. GIAHSs are critical in fighting against climate change, desertification, food security, and other common global issues. Understanding the ecological heritage of a system from an ecosystem perspective contributes to the development of new sustainable agriculture and aquaculture [1]. Exploring agricultural values, particularly ecological values, not only effectively promotes regional development and improves farmers’ living standards in heritage sites, but can also produce good ecological, economic, and social benefits, which is conducive both to exploring new methods of sustainable development in world agriculture and to realizing the inheritance of world agricultural cultural heritage.
It has been widely acknowledged in recent years that the development of economic growth, social welfare, environmental sustainability, and their related ecosystems should be incorporated into decision-making. This requires policymakers and organizations to consider not only the short-term benefits and costs of a decision but also its long-term consequences [2]. Therefore, scholars have proposed the concept of GEP, derived from ecosystem service valuation and natural capital accounting [3,4]. The International Union for Conservation of Nature (IUCN, 2012) [5] defined GEP as the total economic value of products and services that reflect the sum of ecosystem products, services, and existing natural assets which can be used to measure the impact of human activities on nature. In the early 2000s, the Millennium Ecosystem Assessment (MA) adopted the concept and categorized ecosystem services into four broad categories: provisioning, including the production of food and water; regulating, including the control of climate and disease; supporting, including nutrient cycles and oxygen production; and cultural services, including spiritual and recreational benefits [6]. Ouyang considered that supporting services may be redundant with regulating services; therefore, he grouped ecosystem services into three parts, namely provisioning ecosystem services, regulating ecosystem services, and cultural ecosystem services. Provisioning ecosystem services are any type of thing that humans can acquire from the ecosystem and exchange for goods on the market. Regulating ecosystem services are the benefits that the ecosystem provides to improve human survival and the living environment. Cultural ecosystem services are non-material benefits that human beings receive from the ecosystem through spiritual feelings, knowledge acquisition, leisure entertainment, and aesthetic experience, mainly including leisure tourism and landscape value [3].
Many researchers have evaluated ecosystem services, which have helped people gain an understanding of ecosystems and their service energy by building the theoretical framework and accounting evaluation methods [7,8,9,10,11]. According to a study by Loc et al., the average estimated value of ecosystem services offered by the shrimp and rice rotational crops in Vietnam were determined to be USD 1300 per hectare per year, accounting for 38.1% and 59.4% of the average economic revenue and net benefit, respectively [12]. Liu used the DPSIR (driver, pressure, state, impact, and response) model to examine the value of rice–fish coculture systems in Ruyuan County, Guangdong Province, China. They discovered that the ecosystem service value of rice–fish coculture ecosystems was 37.9% greater than that of rice monoculture, and the ecosystem service value was at least 6.74 times greater than the direct economic value of rice monoculture [13]. Similar studies, such as those conducted by Mathé and Rey-Valette (2015), Ondiek et al. (2016), and Weitzman (2019) have investigated the ecosystem services provided by aquaculture and rice-field ecosystems [14,15,16].
Researchers have developed models such as the Global Unified Metamodel of the BiOsphere (GUMBO) [17], Natural Assets Information System (NAIS) [18], Artificial Intelligence for Ecosystem Services (ARIES) [19,20], Online Wetland Ecosystem Services Model (EcoServ) [21], Social Values for Ecosystem Services (SolVES) [22], Ecosystem Portfolio Model (EPM) [23], Multiscale Integrated Model of Ecosystem Services (MIMES) [17], Ecosystem Services Review (ESR) [24], and Ecosystem Services Valuation (ESV) [25]. These models provide a profound understanding of the benefits humans derive from ecosystems. Nevertheless, some models lack the capacity to calculate complex data, while others require additional validation to ensure their validity or credibility. InVEST, a model system co-developed by Stanford University, the Nature Conservancy (TNC), and the World Wide Fund for Nature (WWF), is a specialized visualization tool capable of quantitatively assessing ecosystem services under different scenarios, which can measure multiple ecosystem services such as water yield, water quality, soil retention, carbon storage, biodiversity, etc., and integrates and weighs multiple ecosystem services to provide a basis for decision-making [26,27,28,29]. The model has been validated by Piyathilake et al., 2021 [30], and it has been used to determine changes in spatial planning, biodiversity, carbon stocks, water production, soil conservation, etc. [31,32,33,34]. In recent years, researchers have integrated the model with Geographic Information System (GIS) technology to evaluate ecosystem services in cities, river basins, islands, nature reserves, plateaus, etc. [35,36,37]. The use of GIS technology enables accurate and precise data collection and analysis, which contributes to the increase in accuracy and the reduction of errors.
In the modern world, agricultural ecosystems provide not only production functions, but also essential ecosystem services for human survival and development [38]. However, many of the external economic benefits of these ecosystem services are not often reflected in the market [39,40]. With rapid urbanization and industrialization, non-farm employment and non-farm incomes have increased, and labor in mountainous regions has migrated extensively [41,42,43]. It is difficult to incentivize farmers to maintain GIAHS sustainability. The purpose of this study was to explore the sustainable development of the Rice–Fish Symbiosis System in Longxian village from the perspective of exploring the value of ecological products, and to provide a valuable reference for other GIAHS projects. This study focused on two areas: (1) analysis of the value-realization mechanism of ecological products in the Rice–Fish Symbiotic System, and (2) calculation of the GEP of the Rice–Fish Symbiotic System in Longxian village. This paper posits that the methodology and scientific approach of this research can serve as an effective framework for evaluating the economic value of a cultural heritage system, leading to a more effective analysis of current and future GIAHS programs.
2. Material and Method
2.1. Study Site and Description
Longxian village is in the southwest of Qingtian County, Lishui City, Zhejiang Province, China, at 120°17′00″–120°17′00″ E and 27°59′00″–28°00′00″ N, with an average elevation of about 300 m and a land area of 461.2 hectares. It is at the heart of the Rice–Fish Symbiotic System and the GIAHS protected area. As a regional ecosystem, Longxian village has diversified subsystems, including forest ecosystems, cultivated-land ecosystems, urban ecosystems, garden ecosystems, sparse forest ecosystems, shrub ecosystems, and wetland ecosystems (see Figure 1; Scheme 1). Among them, the forest is the largest ecological subsystem. In addition to the forest system, the cultivated-land ecosystem—specifically, the Rice–Fish Symbiotic System—is the core industrial system in Longxian village.
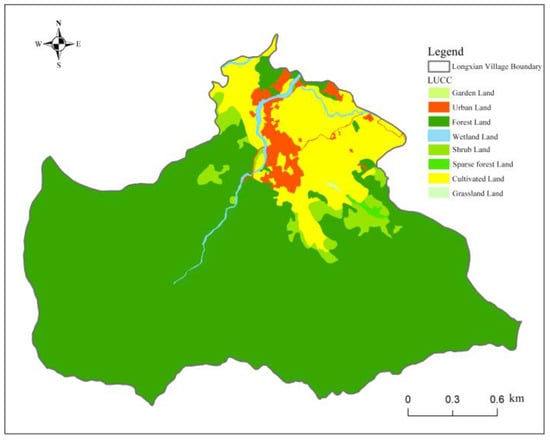
Figure 1.
Ecosystem distribution in Longxian village.
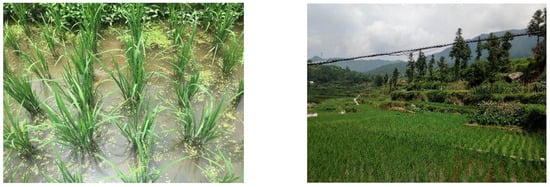
Scheme 1.
Field pictures of the Rice–Fish Symbiotic System in Longxian village.
2.2. The Rice–Fish Symbiotic System in Longxian Village
The Longxian Rice–Fish Symbiotic System is an example of how to employ a new method to benefit the environment, economy, and society through the promotion of ecological energy. Rice provides a healthy environment for the growth, development, foraging, and habitat of the fish; fish provide fertilizer to rice, regulate micro-climatic conditions, soften the soil, disturb the water, and eat larvae and weeds in the flooded fields. Additionally, local farmers and the environment benefit from the co-ecosystems’ many products and ecological services. Fish and rice are nutrient-dense foods that contribute to the farmers’ nutritional and lifestyle standards. The cost and labor reduction increases the ecosystem’s economic efficiency. In addition, by reducing the use of chemical fertilizers, pesticides, and herbicides, this ecosystem can also reduce its agricultural non-point source pollution, which helps in agro-biological conservation and field environmental protection [44].
The Rice–Fish Symbiotic System consists of animals (e.g., fish, insects, and benthic animals), plants (e.g., rice, weeds, and phytoplankton), and microorganisms (e.g., bacteria and phytoplankton). The energy flow and material circulation in the Rice–Fish Symbiotic System proceeds along the food chain and food web: rice, weeds, and phytoplankton absorb solar energy, carbon dioxide, water, and various inorganic nutrients, and produce organic matter through photosynthesis. This provides food for fish, zooplankton, benthic animals, and human beings. Fish consume phytoplankton, zooplankton, and other aquatic organisms, and their feces are decomposed by microorganisms and used as fertilizer for phytoplankton, weeds, and rice. A well-functioning Rice–Fish Symbiotic System converts straw, rice bran, and fish excrement into food throughout the system cycle, allowing for material recycling and multi-stage energy utilization while maximizing growth and output (see Figure 2).
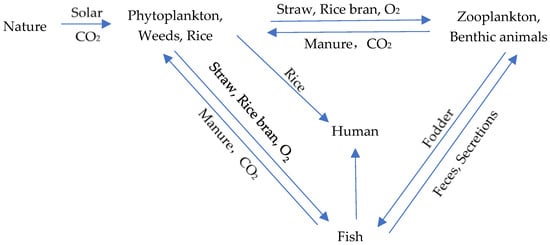
Figure 2.
Material circulation and energy flow of a Rice–Fish Symbiotic System.
2.3. Data Collection
In this study, provisioning services include rice and fish, while cultural services include rural tourism. Data were gathered through field research, which involved conducting surveys, interviews, and direct observation.
Regulating ecosystem services consisted of eight categories: water conservation, soil conservation, flood storage, climate regulation, carbon sequestration, oxygen release, water environment purification, and air purification. Regulating ecosystem service data was collected via multiple sources, including China Meteorological Data Service Centre “https://data.cma.cn/en (accessed on 10 March 2021)”, Ministry of Ecology and Environment “https://english.mee.gov.cn (accessed on 10 March 2021)”, Ministry of Water Resources of the People’s Republic of China “http://www.mwr.gov.cn (accessed on 10 March 2021), Ministry of Natural Resources of the People’s Republic of China “https://www.mnr.gov.cn (accessed on 20 March 2021)”, United States Geological Survey “https://www.usgs.gov (accessed on 20 March 2021)”, and the Chinese Academy of Sciences “https://english.cas.cn (accessed on 20 March 2021)” (see Figure 3).
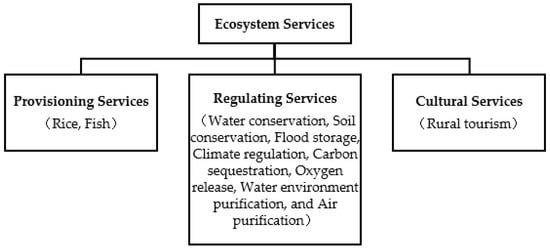
Figure 3.
The Structure of ecosystem services of the Longxian Rice–Fish Symbiotic System.
2.4. Gross Ecosystem Product Accounting Method
In this study, the GEP is a summary of provisioning ecosystem service value (PEV), regulating ecosystem service value (REV), and culture ecosystem service value (CEV). The technical specification of GEP calculation for terrestrial ecosystems (DB33/T 2274-2020) was used in this study. The following calculation formulas were used:
with the subcomponents defined as follows:
stands for the output of category i ecosystem product; is the price of category i product; is the quantity of category j ecosystem regulating service energy; is the price of category j ecosystem regulating service energy; is the quantity of category k ecosystem cultural service energy; and is the price of category k ecosystem cultural service energy.
InVEST and ArcGIS10.8 were used to assess the value of the eight categories of regulating ecosystem services. A unit price list for regulating ecosystem services in the Longxian village was included in Appendix A. Descriptions and calculation formulas were provided as follows:
- (1)
- Water Conservation
Water conservation is the calculation of the difference between precipitation input, surface runoff, and water consumption of the ecosystem itself. The shadow-price method was used to calculate the value of water conservation by selecting the water use method with higher added value in the market. The calculation formula used is as follows:
where is the total value of water conservation (CNY/year); is the total water conservation (m3/year); is the market water price; is the premium coefficient; is the area (m2) of ecosystem, = 1,2…, n; is runoff rainfall (mm/year); is surface runoff (mm/year); and is evaporation (mm/year);
- (2)
- Soil Conservation
Ecosystems help reduce the risk of droughts and floods by maintaining soil and reducing sediment deposition in reservoirs, rivers, and lakes. According to the amount of soil and water conservation and the amount of siltation, the alternative cost method was used to calculate the value of sediment reduction. The calculation formula used is as follows:
where is the total amount of soil and water conservation [t/(hm2·year)]; R is the rainfall erosivity factor [MJ·mm/(hm2·hour·year)]; K is the soil erodibility factor [t·hm2·h/ (hm2·MJ·mm)]; L is the slope length factor; S is the slope factor; and C is the vegetation cover factor; is the coefficient of sedimentation; is the soil bulk density (t/m3); and is the unit reservoir dredging project cost (CNY/m3);
- (3)
- Flood Storage
Flood regulation and storage capacity (forest, shrub, grassland, and lake) and flood retention capacity (swamp) are used to represent the flood regulation and storage function of the ecosystem. We calculated the economic value of mitigating flood threat and used the Shadow engineering method to calculate the value of the ecosystem flood regulation and storage. The calculation formula used is as follows:
where is total flood storage value (CNY/year); is total amount of flood regulation and storage (m3/year); is total flood storage (m3/year); is the engineering cost of unit storage capacity of the reservoir [CNY/(m3·year)]; is flood regulation and storage of forest, shrub, and grassland (m3/year); is lake flood storage capacity (m3/year); is the amount of stagnant swamp flood water (m3/year); is rainstorm rainfall (mm/year); is rainstorm runoff (mm/year); and is the area (km2) of category ecosystem, where = 1,2,…;
- (4)
- Water Environment Purification
Under the circumstances that pollutant discharge exceeds the environmental capacity, the purification amount was assessed by ecosystem self-purification capacity. The alternative cost method (the cost of water pollutant treatment or the cost of water treatment reduced by the use of clean water provided by the ecosystem) was used to calculate the value of the ecosystem’s water purification function. The calculation formula used is as follows:
where is the total value of water purification (CNY/year); is the purification capacity of class i pollutant (t/year); is unit treatment cost of class i water pollutant (CNY/t), = 1,2,…; is the total purification amount of water pollutants (t/year); is the purification amount per unit area of class i water pollutant (t/(km2·year)), = 1,2,…; and is the area of water wetland (km2);
- (5)
- Air Purification
The alternative cost method (the cost of air pollution treatment by industry or the reduced cost of air environmental treatment due to the use of fresh air provided by the ecosystem) was used to calculate the value of ecosystem air purification:
where is the total value of air purification (CNY/year); is the purification of the j air pollutant in i ecosystem (t/year), = 1,2,…; is the treatment cost of j air pollutant (CNY/t), = 1,2,…;
- (6)
- Carbon Sequestration
Natural terrestrial ecosystems can absorb carbon dioxide from the atmosphere and synthesize organic matter, trapping carbon in plants or soil. The calculation formula used is as follows:
where is the total carbon sequestration value (CNY/year); total fixed amount of carbon dioxide in terrestrial ecosystems (t/year); is the carbon sequestration cost of forest restoration or carbon trading price (CNY/t); the ratio of molecular weight of to , equal to 44/12; is net ecosystem productivity (t/year); is net primary productivity (t/year); α is the conversion coefficient of and ; and is the conversion coefficient of dry matter to , which is 72/162;
- (7)
- Oxygen Release
Using oxygen productivity as qualitative variation and based on the estimation of carbon sequestration rate, the calculation formula used is as follows:
where is total value of oxygen production (CNY/year); is the total amount of oxygen released by the ecosystem (t/year); is the cost of forest restoration to produce oxygen or the price of industrial oxygen (CNY/t); and is the total fixed amount of carbon dioxide in terrestrial ecosystems (t/year);
- (8)
- Climate Regulation
Natural ecosystems absorb solar energy through transpiration of vegetation and evaporation of the water surface, which can reduce summer temperature and increase air humidity, thus improving the comfort degree of the living environment. The energy consumed by ecosystem evaporation was used as the evaluation index, and the calculation formula used is as follows:
where is the total value of climate regulation (CNY/year); is the vegetation transpiration energy (kWh/year); is the evaporation from water surface energy (kWh/year); is the electricity price (CNY/kWh); is the heat transpiration consumption per unit area in the ecosystem [kJ/(m2·day)]; is the area of ecosystem (km3), = 1, 2,…, n; is the air conditioning energy efficiency ratio ( = 3.0); is air conditioning working days ( = 86 days); is the water surface evaporation (m3/year); is the water density ( = 1 g/m3); is the latent heat of volatilization ( = 2432 J/g); and is the power consumption needed to convert 1 cubic meter of water into steam ( = 120 kWh/m3).
3. Results
3.1. Value Realization Mechanism of Ecosystem Products in the Rice–Fish Symbiotic System
The ecosystem service value of the Rice–Fish Symbiotic System was identified through a process of transformation and realization (see Table 1). There were two identified features: (1) the process of ecosystem value transformation, which includes the regulation of ecological systems, material circulation, and energy flow in nature; and (2) the process of realizing ecosystem economic value—mainly, the process of realizing economic value from the use value of material products and the process of transforming ecosystem value from service products into economic value.

Table 1.
Ecosystem service value of the Rice–Fish Symbiotic System.
The value of provisioning ecosystem services (such as rice and fish) can be obtained by exchanging them on the market. The value of provisioning ecosystem services was endogenous.
The benefit of regulating ecosystem services (such as climate management and flood storage) can be realized through natural environmental regulatory functions. These environmental advantages are considered “ecological resources.” The process of recognizing the ecological worth of the system requires government leadership. These “ecological resources” could be converted into “ecological assets” and “ecological capital,” and then into quantifiable “ecological products” via non-transaction channels such as the government’s special transfer payment, ecological protection compensation, and government investment or purchasing. Natural processes such as circulation and energy flow can have a significant impact on the value of cultural services such as tourism by creating opportunities for economic and social development in a community. In this natural setting, a variety of tourist services, including sightseeing, tourism, catering, and lodging are offered. The economic value of these service products can be realized through market transactions or non-market transactions such as government investment, government supervision, and tax regulation. Both the regulating service value and the cultural service value were exogenous.
3.2. GEP of the Rice–Fish Symbiotic System in Longxian Village
According to the findings, the GEP of the Longxian Rice–Fish Symbiotic System was approximately CNY 116.51 million. On a total land area of 461.2 hectares, the annual average price per hectare was CNY 252,624. The regulating ecosystem service value was about CNY 93.71 million, followed by the provisioning ecosystem service value (CNY 12.8 million) and the cultural ecosystem service value (CNY 10 million). More than 80% of the GEP was contributed by the regulating ecosystem services (see Table 2). Within the regulating ecosystem services, the climate regulation was the highest (CNY 55.72 million), followed by flood storage (CNY 32.77 million). These two categories contributed 94.44% of the total value of regulating ecosystem services (see Table 3).
Table 2.
Gross Ecosystem Product of the Longxian Rice–Fish Symbiotic System.
Table 3.
Economic value of Regulating Ecosystem Services in the Longxian Rice–Fish Symbiotic System.
4. Discussion and Implementation
4.1. Transformation and Realization Mechanism of Ecosystem Services
Understanding the transformation and realization mechanisms of regulating and supporting services can provide valuable insights into the complex relationship between ecosystems and the services they provide, allowing us to better manage and protect these vital resources for future generations. There are few references to the terms “endogenous value” and “exogenous value” in the field of ecology or ecosystem sciences. However, in ecology, “endogenous” typically refers to factors or processes that originate within an ecosystem, whereas “value” refers to the benefits or significance ecosystems provide to humans and other organisms. Consequently, combining these concepts yields the notion of “endogenous value in ecosystem,” which may be comprehended as the intrinsic or inherent value or advantages that emanate from the internal mechanisms and operations of an ecosystem. Alternatively, “exogenous value” refers to a non-biological or external value associated with an ecological system or its components. The ecosystem value provided by the Longxian Rice–Fish Symbiotic System was divided into two classes: endogenous (biological value) and exogenous (economic value).
Endogenous ecological product value reflects the biological value, which can transform the ecological environment value, ecological resource value, and ecological technology value into ecological economic value through biological transformation. The value of ecosystem products is realized in the material cycle and energy flow, which is embodied in the economic value by green agricultural products. Through this systematic cycle, the waste can be changed into food. The system realizes material cycling and regeneration and realizes multi-stage utilization of energy.
Due to a lack of cultivable land, the supply of green agricultural goods in the Longxian village is restricted. There are two approaches that can be used to improve the provisioning services. First, increasing agricultural productivity should be promoted, which includes soil management, irrigation, pest and disease management, improved crop types, and adoption of technology. A combination of these methods can improve resource usage, conserve soil health, decrease environmental contamination, and enhance food security. Second, branding agricultural products with cultural and historical importance should also be undertaken, to boost their perceived worth and differentiate them from other items on the market. By establishing a strong connection between the product and the cultural heritage and customs of the region or community, farmers can attract consumers who are interested in supporting local communities and conserving cultural traditions and are prepared to pay a premium for such products.
Exogenous ecological product value refers to the resources and products that are produced by natural ecosystems and have economic value. The value of tourism is typically considered as exogenous because it is generated by factors which are external to the destination being visited. This means that the value of tourism is determined not only by the resources and services available at the destination, but also by the choices, expectations, and actions of tourists. On the one hand, tourists may be drawn to a location by its natural or cultural attractions. On the other hand, the value of these attractions depends on how tourists perceive their quality and significance, which can be influenced by a range of factors, such as cultural background and personal preferences. Thus, expanding rural tourism to increase exogenous value could be in the form of implementing sustainable and ecologically non-damaging tourism programs. Additionally, the Longxian village has abundant natural resources, which could be utilized as assets for economic development, through strategies such as the sale of carbon credits, ecotourism, and sustainable forestry techniques.
The Rice–Fish Symbiotic System uses the biotransformation process to its fullest to produce the most ecological products. The Rice–Fish Symbiotic System is a typical resource-saving and environmentally friendly agricultural system. It meets human physical needs by providing nutritious rice and fish, while also meeting people’s environmental needs by providing clean water, fresh air, and a beautiful environment.
In summary, in addition to the provisioning ecosystem service value, the Rice–Fish Symbiotic System also contains ecological value, ecological resource value, ecological technology value, and ecological cultural value. The transformation and realization of ecosystem services is the process through which these hidden ecological values are converted into economic values.
4.2. Composition of Gross Ecosystem Product
The ecological environment is an essential component of the Longxian village’s economic growth and prosperity, providing a variety of benefits and services to the community. According to the GEP accounting of the Rice–Fish Symbiotic System, its regulating service value embodied more than 80% of the total value. The results support Costanza et al.’s suggestion that GDP fails to capture nature’s contribution to economic benefits [45]. Results echo Liu et al.’s study that natural resources in regulating ecosystem services play a significant part in GIAHS systems that should be addressed [13].
In addition, the Longxian village Rice-Fish Symbiotic System was found to provide an average ecosystem service value of CNY 203,178 per hm2/year. The result is comparable to that of the Ruyuan county (CNY 255,529 per hm2/year), but significantly higher than Qingtian county (CNY 21,000 per hm2/year) and the Haney terraces (CNY 33,100 per hm 2/year) [13,46,47]. Both Longxian village and Ruyuan county’s research used various evaluation techniques, such as the direct market method, the alternative market method, and the cost method, to determine the value of each category of regulating ecosystem services. The study also applied GIS technology to capture the spatial distribution of ecosystem services, such as carbon sequestration, water purification, and habitat provision, thereby expanding the scope of the study’s findings. Therefore, the results are a more accurate representation of the Longxian Rice–Fish Symbiotic System.
Climate regulation and flood storage make up the majority contribution to the regulating ecosystem service value. The forest in the Longxian region is the largest ecological component of the local ecosystem, followed by sparse forest, wetland, shrub, and grassland. Along with the cultural and historical significance of the Longxian Rice–Fish Symbiotic System, these resources are ideal for developing ecotourism centered on nature-based activities and experiences. By building trails, visitor centers, and other facilities, the local government can offer economic opportunities for the village while also conserving the forest. Ecotourism may contribute to the conservation and preservation of natural resources and ecosystems while also providing economic advantages to local communities. However, tourism can also lead to overexploitation, deterioration, and destruction of natural resources and ecosystems. Therefore, the local government should adopt sustainable tourism strategies that limit negative impacts and maximize positive impacts to the Rice-Fish Symbiotic System.
The value of provisioning ecosystem services was less than 11% of the total GEP in the Longxian village. The Rice–Fish Symbiotic System generates high-quality green agricultural products, but yields are modest due to its limited cultivation size. To increase the revenue generated from the products, farmers can improve product quantity and long-term sustainability by implementing new agricultural techniques and technology. The cultural and historical significance of the Longxian area can be leveraged as a marketing tactic to distinguish the native green agricultural products from alternatives. As the first GIAHS project in Asia, the Longxian Rice–Fish Symbiotic System’s marketing and branding features are unique. Incorporating cultural and historical significance to products not only helps to develop an emotional relationship with consumers and build brand loyalty, but also helps to conserve and promote local culture and tradition.
The Longxian village’s annual tourism revenue approaches CNY 10 million, which is around 9% of the village’s GEP. The rural tourism sector grew in accordance with the Rice-Fish Symbiotic System. The village is a model for urban tourist development in Zhejiang Province. Current tourism projects include sight-seeing, homestays, and farm entertainment. There is still a lot of potential for continuous development. The GIAHS recognized historical, biological environmental, and cultural features of the Longxian Rice–Fish Symbiotic System as a selling point for tourists [48]. Developing attractions based on cultural and historical events could enhance the visitor experience and provide a greater understanding of local culture and history (for example, festivals and events that highlight the local traditions, music, art, and cuisine) [49,50]. Cuisine is an approach to tourism not yet fully realized in this region. Tourists can obtain a greater appreciation for the culture of the region through exposure to ecologically significant ingredients through cooking workshops, culinary tours, and excursions to local markets.
5. Conclusions
This study analyzed the transformation and realization mechanisms of the ecological product value of the Rice–Fish Symbiotic System and quantified its economic value using the GEP. We found that regulating ecosystem services play a significant role in the Rice–Fish Symbiotic System, which are currently unaccounted for in GDP. Therefore, we recommend using GEP to determine the worth of the commodities and services supplied by an ecosystem. Furthermore, climate regulation and flood storage were two major contributors to the Longxian Rice–Fish Symbiotic System. The presence of forest vegetation and wetland habitats provides potential for developing ecotourism. However, the government should adopt sustainable tourism practices to balance tourism and the environment. The methodology and approach of the research can serve as an important reference for other GIAHS programs. It provides a scientific framework to assess the economic value of agricultural heritage systems.
Author Contributions
Funding acquisition, J.L.; investigation, J.L. and Y.L.; methodology, Q.Z.; resources, Y.L.; software, Q.Z.; supervision, Y.T.; visualization, Y.T.; writing—original draft, J.L.; writing—review & editing, Q.W. and Y.T. All authors have read and agreed to the published version of the manuscript.
Funding
This work was funded by Social Science Planning Project of Zhejiang Province (20NDFC330YB), Zhejiang Soft Science Research Program (2022C35011), and Shandong Technology and Business University’s Research Project (306455).
Institutional Review Board Statement
Not applicable.
Informed Consent Statement
Not applicable.
Data Availability Statement
In this study, the data were mainly obtained from government administrative departments, including meteorological monitoring, remote sensing monitoring, ecological monitoring, hydrological detection, environmental statistics, plot surveying data, and so on.
Conflicts of Interest
The authors state that they have no known competing financial interest or personal ties that could be perceived as having influenced the work disclosed in this study.
Appendix A
Table A1.
Unit pricing list of Regulating Ecosystem Services in the Longxian village.
Table A1.
Unit pricing list of Regulating Ecosystem Services in the Longxian village.
| Regulating Ecosystem Services | Items | Unit | Price |
|---|---|---|---|
| Water conservation | Water price | CNY/m3 | 1.00 |
| Soil conservation | Reservoir dredging project cost | CNY/m3 | 28.35 |
| Flood water storage | Engineering cost of unit storage capacity of reservoir | CNY/(m3·a) | 10.65 |
| Operating cost per unit of reservoir capacity | CNY/(m3·a) | 0.31 | |
| Total | CNY/(m3·a) | 10.96 | |
| Purification of water environment | Purified COD | CNY/t | 128,921.67 |
| Purified ammonia nitrogen | CNY/t | 151,640.60 | |
| Purified total phosphorus | CNY/t | 7000.00 | |
| Air purification | Purified sulfur dioxide | CNY/t | 6292.92 |
| Purifying nitrogen oxide | CNY/t | 9337.07 | |
| Carbon sequestration | Carbon trading price | CNY t | 30.80 |
| Oxygen release | Medical oxygen price | CNY/t | 2643.24 |
| Climate regulation | Electricity price | CNY/t | 0.56 |
Note: The data retrieved from the reports of the Zhejiang Development and Planning Institution. http://www.zdpi.org.cn/getsearch.php?skey=GEP (accessed on 9 March 2023).
References
- Zhang, K.; Peng, H.H.; Xia, Y.; Gong, W.B.; Li, Z.F.; Yu, E.M.; Tian, J.J.; Wang, G.J.; Xie, J. Evaluating ecological mechanisms and optimization strategy of rice–fish co–culture system by ecosystem approach. Aquaculture 2022, 560, 738561. [Google Scholar] [CrossRef]
- United Nations. The Millennium Development Goals Report 2015; United Nations: New York, NY, USA, 2015; Available online: https://www.un.org/millenniumgoals/2015_MDG_Report/pdf/MDG%202015%20rev%20(July%201).pdf (accessed on 9 March 2023).
- Ouyang, Z.Y.; Zhu, C.Q.; Yang, G.B.; Xu, W.H.; Zheng, H.; Zhang, Y.; Xiao, Y. Gross ecosystem product: Concept, accounting framework and case study. Acta Ecol. Sin. 2013, 33, 6747–6761. [Google Scholar] [CrossRef]
- Hao, C.H.; Wu, S.Y.; Zhang, W.T.; Chen, Y.Q.; Ren, Y.F.; Chen, X.; Wang, H.; Zhang, L.B. A critical review of gross ecosystem product accounting in China: Status quo, problems and future directions. J. Environ. Manag. 2022, 322, 115995. [Google Scholar] [CrossRef] [PubMed]
- Jin, D.; Bian, Z.F. The accounting of ecological civilization in Xuzhou based on energy and gross ecosystem production. China Land Sci. 2013, 10, 88–94. (In Chinese) [Google Scholar] [CrossRef]
- Millennium Ecosystem Assessment. Ecosystems and Human Well-Being: Synthesis; Island Press: Washington, DC, USA, 2005; Available online: https://www.millenniumassessment.org/documents/document.300.aspx.pdf (accessed on 9 March 2023).
- Ouyang, Z.Y.; Wang, X.K.; Miao, H. A primary study on Chinese terrestrial ecosystem services and their ecological-economic values. Acta Ecol. Sin. 1999, 19, 607–613. Available online: https://europepmc.org/article/cba/533458 (accessed on 9 March 2023).
- Watson, R.; Albon, S.; Aspinall, R.; Austen, M.; Bardgett, B.; Bateman, I.; Berry, P.; Bird, W.; Bradbury, R.; Brown, C.; et al. UK National Ecosystem Assessment: Understanding Nature’s Value to Society; UNEP-WCMC: Cambridge, UK, 2011; Available online: https://www.researchgate.net/publication/317236524_UK_National_Ecosystem_Assessment_understanding_nature’s_value_to_society_Synthesis_of_key_findings#fullTextFileContent (accessed on 9 March 2023).
- Eigenraam, M.; Chua, J.J.; Edwards, C. Empirical methods for determining a reserve price in conservation auctions. In Proceedings of the Australian Agricultural and Resource Economics Society 55th Annual Conference, Melbourne, Australia, 8–11 February 2011. [Google Scholar]
- Gary, S.; Andrew, K.; Mark, E.; David, B. Creating physical environmental asset accounts from markets for ecosystem conservation. Ecol. Econ. 2012, 82, 114–122. [Google Scholar] [CrossRef]
- Arowolo, A.O.; Deng, X.Z.; Olatunji, O.A.; Obayelu, A.E. Assessing changes in the value of ecosystem services in response to land-use/land-cover dynamics in Nigeria. Sci. Total Environ. 2018, 636, 597–609. [Google Scholar] [CrossRef] [PubMed]
- Loc, H.H.; Diep, N.T.H.; Can, N.T.; Kim, N.I.; Yoshihisa, S. Integrated evaluation of ecosystem services in prawn-rice rotational crops, Vietnam. Ecosyst. Serv. 2017, 26, 377–387. [Google Scholar] [CrossRef]
- Liu, D.; Tang, R.C.; Xie, J.; Tian, J.J.; Shi, R.; Zhang, K. Valuation of ecosystem services of rice–fish co-culture systems in Ruyuan county, China. Ecosyst. Serv. 2020, 41, 101054. [Google Scholar] [CrossRef]
- Mathé, S.; Rey-Valette, H. Local knowledge of pond fish-farming ecosystem services: Management implications of stakeholders’ perceptions in three different contexts (Brazil, France and Indonesia). Sustainability 2015, 7, 7644–7666. [Google Scholar] [CrossRef]
- Ondiek, R.A.; Kitaka, N.; Oduor, S.O. Assessment of provisioning and cultural ecosystem services in natural wetlands and rice fields in Kano floodplain, Kenya. Ecosyst. Serv. 2016, 21, 166–173. [Google Scholar] [CrossRef]
- Weitzman, J. Applying the ecosystem services concept to aquaculture: A review of approaches, definitions, and uses. Ecosyst. Serv. 2019, 35, 194–206. [Google Scholar] [CrossRef]
- Boumans, R.; Roman, J.; Altman, I.; Kaufman, L. The Multiscale Integrated Model of Ecosystem Services (MIMES): Simulating the interactions of coupled human and natural systems. Ecosyst. Serv. 2015, 12, 30–41. [Google Scholar] [CrossRef]
- Troy, A.; Wilson, M.A. Mapping ecosystem services: Practical challenges and opportunities in linking GIS and value transfer. Ecol. Econ. 2007, 60, 435–449. [Google Scholar] [CrossRef]
- Bagstad, K.J.; Villa, F.; Johnson, G.; Voigt, B. ARIES—Artificial Intelligence for Ecosystem Services: A Guide to Models and Data, Version 1.0. ARIES Report Series n.1. 2011. Available online: https://unstats.un.org/unsd/envaccounting/seeaRev/meeting2013/EG13-BG-7.pdf (accessed on 9 March 2023).
- Villa, F. Bridging scales and paradigms in natural systems modeling. In Proceedings of the Metadata and Semantic Research—4th International Conference: Communications in Computer and Information Science, Alcalá de Henares, Spain, 20–22 October 2010; Available online: https://link.springer.com/chapter/10.1007/978-3-642-16552-8_1 (accessed on 9 March 2023).
- Feng, M.; Liu, S.; Euliss, N.H., Jr.; Young, C.; Mushet, D.M. Prototyping an online wetland ecosystem services model using open model sharing standards. Environ. Model. Softw. 2011, 26, 458–468. [Google Scholar] [CrossRef]
- Sherrouse, B.C.; Clement, J.M.; Semmens, D.J. A GIS application for assessing, mapping, and quantifying the social values of ecosystem services. Appl. Geogr. 2011, 31, 748–760. [Google Scholar] [CrossRef]
- Labiosa, W.B.; Forney, W.M.; Esnard, A.M.; Mitsova-Boneva, D.; Bernknopf, R.; Hearn, P.; Hogan, D.; Pearlstine, L.; Strong, D.; Gladwin, H.; et al. An integrated multi-criteria scenario evaluation web tool for participatory land-use planning in urbanized areas: The ecosystem portfolio model. Environ. Model. Softw. 2013, 41, 210–222. [Google Scholar] [CrossRef]
- World Resources Institute (WRI). The Corporate Ecosystem Services Review: Guidelines for Identifying Business Risks and Opportunities Arising from Ecosystem Change, Version 2.0; World Resources Institute: Washington, DC, USA, 2012. [Google Scholar]
- Yang, Y.; Liu, G.Y.; Casazza, M.; Campbell, E.T.; Giannetti, B.F.; Brown, M.T. Development of a new framework for non-monetary accounting on ecosystem services valuation. Ecosyst. Serv. 2018, 34, 37–54. [Google Scholar] [CrossRef]
- Halpern, B.; Walbridge, S.; Selkoe, K.A.; Kappl, C.V.; Micheli, F.; D’Agrosa, C.; Bruno, J.F.; Casey, K.S.; Ebert, C.; Fox, H.E.; et al. A global map of human impact on marine ecosystems. Science 2008, 319, 948–952. [Google Scholar] [CrossRef]
- Daily, G.C.; Polasky, S.; Goldstein, J.; Kareiva, P.M.; Mooney, H.A.; Pejchar, L.; Ricketts, T.H.; Salzman, J.; Shallenberger, R. Ecosystem services in decision making: Time to deliver. Front. Ecol. Environ. 2009, 7, 21–28. [Google Scholar] [CrossRef]
- Nelson, E.; Mendoza, G.; Regetz, J.; Polasky, S.; Tallis, H.; Cameron, D.R.; Chan, K.M.A.; Daily, G.C.; Goldstein, J.; Kareiva, P.M.; et al. Modeling multiple ecosystem services, biodiversity conservation, commodity production, and tradeoffs at landscape scales. Front. Ecol. Environ. 2009, 7, 4–11. [Google Scholar] [CrossRef]
- Goldstein, J.H.; Caldarone, G.; Duarte, T.K.; Ennaanay, N.; Mendoza, G.; Polasky, S.; Wolny, S.; Daily, G.C. Integrating ecosystem-service tradeoffs into land-use decisions. Proc. Natl. Acad. Sci. USA 2012, 109, 7565–7570. [Google Scholar] [CrossRef] [PubMed]
- Piyathilake, I.D.U.H.; Udayakumara, E.P.N.; Ranaweera, L.V.; Gunatilake, S.K. Modeling predictive assessment of carbon storage using invest model in Uva province, Sri Lanka. Model. Earth Syst. Environ. 2021, 8, 2213–2223. [Google Scholar] [CrossRef]
- Mansoor, D.K.; Marty, D.M.; Eric, C.C.; Lanier, L.N. Quantifying and mapping multiple ecosystem services change in West Africa. Agric. Ecosyst. Environ. 2013, 165, 6–18. [Google Scholar] [CrossRef]
- Baral, H.; Keenan, R.J.; Sharma, S.K.; Stork, N.E.; Kasel, S. Spatial assessment and mapping of biodiversity and conservation priorities in a heavily modified and fragmented production landscape in north-central Victoria, Australia. Ecol. Indic. 2014, 36, 552–562. [Google Scholar] [CrossRef]
- Vergilio, M.; Fjosne, K.; Nistora, A.; Calado, H. Carbon stocks and biodiversity conservation on a small island: Pico (the Azores, Portugal). Land Use Policy 2016, 58, 196–207. [Google Scholar] [CrossRef]
- Caro, C.; Marques, J.C.; Cunha, P.P.; Teixeira, Z. Ecosystem services as a resilience descriptor in habitat risk assessment using the InVESTmodel. Ecol. Indic. 2020, 115, 106426. [Google Scholar] [CrossRef]
- Chen, Y.; Shao, Z.; Gui, F.; Zhao, S. Ecosystem services assessment of Zhoushan islands based on InVEST model. Territ. Nat. Resour. Study 2020, 4, 47–50. (In Chinese) [Google Scholar] [CrossRef]
- Wang, B.; Zhao, J.; Zhong, J.T. Spatiotemporal differentiation of ecosystem services in the Shiyang river basin from 2005 to 2015. Arid. Zone Res. 2019, 36, 474–485. (In Chinese) [Google Scholar] [CrossRef]
- Wang, Y.F.; Ye, A.Z.; Peng, D.Z.; Miao, C.Y.; Di, Z.H.; Gong, W. Spatiotemporal variations in water conservation function of the Tibetan Plateau under climate change based on InVEST model. Reg. Stud. 2022, 41, 101064. [Google Scholar] [CrossRef]
- Costanza, R.; Arge, R.; De, G.R.; Farber, S.; Grasso, M.; Hannon, B.; Limburg, K.; Naeem, S.; O’Neill, R.; Paruelo, J.; et al. The value of the world’s ecosystem services and natural capital. Nature 1997, 387, 253–260. [Google Scholar] [CrossRef]
- Esteban, A.; Abbona, E.A.; Sarandón, S.J.; Marasas, M.E.; Astier, M. Ecological sustainability evaluation of traditional management in different vineyard systems in Berisso, Argentina. Agriculture. Ecosyst. Environ. 2007, 119, 335–345. [Google Scholar] [CrossRef]
- Rist, S.; Chidambaranathan, M.; Escobar, C.; Wiesmann, U.; Zimmermann, A. Moving from sustainable management to sustainable governance of natural resources: The role of social learning processes in rural India, Bolivia and Mali. J. Rural. Stud. 2007, 23, 23–37. [Google Scholar] [CrossRef]
- Hou, D.; Meng, F.H.; Prishchepov, A.V. How is urbanization shaping agricultural land-use? Unraveling the nexus between farmland abandonment and urbanization in China. Landsc. Urban Plan. 2021, 214, 104170. [Google Scholar] [CrossRef]
- Wang, Y.H.; Li, X.B.; Xin, L.G.; Tan, M.H. Farmland marginalization and its drivers in mountainous areas of China. Sci. Total Environ. 2020, 719, 135132. [Google Scholar] [CrossRef] [PubMed]
- Zhou, H.; Yan, J.Z.; Lei, K.; Wu, Y.; Sun, L.X. Labor migration and the decoupling of the crop-livestock system in a rural mountainous area: Evidence from Chongqing, China. Land Use Policy 2020, 99, 105088. [Google Scholar] [CrossRef]
- Rice Fish Culture, China. Available online: https://www.fao.org/giahs/giahsaroundtheworld/designated-sites/asia-and-the-pacific/rice-fish-culture/en/ (accessed on 9 March 2023).
- Costanza, R.; Kubiszewski, I.; Giovannini, E.; Lovins, H.; McGlade, J.; Pickett, K.E.; Ragnarsdottir, K.; Roberts, D.; De Vogli, R.; Wilkinson, R. Development: Time to leave GDP behind. Nature 2014, 505, 283–285. [Google Scholar] [CrossRef] [PubMed]
- Liu, M.C.; Zhang, D.; Li, W.H. Evaluation of comprehensive benefit of rice–fish agriculture and rice mono-cropping-A case study of Qingtian county, Zhejiang province. Chin. J. Eco-Agric. 2010, 18, 164–169. (In Chinese) [Google Scholar] [CrossRef]
- Liu, Y.; Zhang, Y.J.; Jia, Q. Study on the methods of ecosystem services valuation. Environ. Prot. 2017, 17, 64–68. (In Chinese) [Google Scholar] [CrossRef]
- Yuta, U.; Yushi, T.; Hikaru, M.; Ryo, K. Expectations of residents and tourists of agriculture-related certification systems: Analysis of public perceptions. J. Ethn. Foods 2017, 4, 110–117. [Google Scholar] [CrossRef]
- Cudny, W.; Jolliffe, L.; Guz, A. Heritage event as tourist attraction: The case of Dymarki Swietokrzyskie, Poland. GeoJournal 2022, 87, 2975–2992. [Google Scholar] [CrossRef] [PubMed]
- Zhao, S.N.; Nyaupane, G.P.; Andereck, K.L. Exploring the differences between tourists visiting heritage sites and those visiting cultural events: A cognitive perspective. Travel Tour. Res. Assoc. Adv. Tour. Res. Glob. 2016, 54. Available online: https://scholarworks.umass.edu/cgi/viewcontent.cgi?article=1679&context=ttra (accessed on 9 March 2023).


Disclaimer/Publisher’s Note: The statements, opinions and data contained in all publications are solely those of the individual author(s) and contributor(s) and not of MDPI and/or the editor(s). MDPI and/or the editor(s) disclaim responsibility for any injury to people or property resulting from any ideas, methods, instructions or products referred to in the content. |
© 2023 by the authors. Licensee MDPI, Basel, Switzerland. This article is an open access article distributed under the terms and conditions of the Creative Commons Attribution (CC BY) license (https://creativecommons.org/licenses/by/4.0/).