Article

Research on the Fracture Propagation Law of Separate Layered Fracturing in Unconventional Sandstone Reservoirs

Research Institute of Petroleum Exploration and Development, No. 20 Xueyuan Road, Haidian District, Beijing 100083, China
*
Author to whom correspondence should be addressed.
Sustainability 2023, 15(13), 10444; https://doi.org/10.3390/su151310444
Submission received: 9 May 2023 / Revised: 26 June 2023 / Accepted: 27 June 2023 / Published: 3 July 2023
(This article belongs to the Special Issue Numerical Analysis of Rock Mechanics and Crack Propagation)

Abstract

:
The unconsolidated sandstone is a type of rock that has poor cementation, a low strength, a high porosity, and permeability. It is highly compressible under high stress and exhibits non-linear plastic deformation during hydraulic fracturing construction in its reservoir. In this study, the mechanical properties of unconsolidated sandstone with a different permeability were studied, and a three-dimensional hydraulic fracture propagation numerical model was established based on the modified traditional Cambridge model. This model was used to simulate the fracture propagation law of unconsolidated sandstone in separate layer fracturing under different construction conditions. During hydraulic fracturing construction, the fracturing fluid slowly invades the reservoir when the displacement of the fracturing fluid is small. The unconsolidated sandstone undergoes compaction and hardening, followed by shear expansion, and then complete destruction. A larger displacement will cause the reservoir rock to directly enter the state of destruction from compaction and hardening. This study found that several critical parameters are obtained for fracturing construction. When the displacement is greater than 5 m3/min, the fracturing fluid exceeds 100 mPa·s, or when the filtration coefficient exceeds 1.2 × 10⁻³ m/ s , the second and third layers will be penetrated. This study provides valuable insights into the mechanical properties of unconsolidated sandstone and reveals the critical parameters for the successful hydraulic fracturing construction in this type of reservoir.

1. Introduction

Unconsolidated sandstone has abundant oil and gas reserves, and its production occupies a very important position in the total crude oil production. The large-scale use of fracturing and sand control completion technology in unconsolidated sandstone reservoirs has achieved good sand control and production increase effects. Essentially, this technology uses end sand removal to allow sand-carrying fluid to remove sand at the end of the fracture, and then expand and fill the fracture to form short and wide high-conductivity seepage channels [1,2]. As the unconsolidated sandstone reservoir has an uneven longitudinal thickness distribution and overlaps with the other lithologic formations present, separate layer fracturing technology can be used to treat the target interval in a targeted manner to improve productivity, and more fractures and pore connections can be formed in the target interval to increase oil and gas mobility and enhance oil recovery. However, the characteristics of an unconsolidated sandstone determine that the fracturing fluid loss, formation failure characteristics, and formation permeability evolution during fracturing are significantly different from those of dense and low-permeability rocks. At present, research on the hydraulic fracturing principles and technologies mainly focus on hard, brittle, low-permeability, and dense rocks, while research on unconsolidated sandstones are few [3,4,5,6]. Different from low permeability reservoirs, long fractures need to be created, and unconsolidated sandstone reservoirs need to optimize fracturing parameters to generate short and wide fractures, effectively improve the seepage capacity in the near-wellbore area and achieve the purpose of increasing its production. Therefore, it is necessary to conduct research on the optimization technology of these separate layer fracturing parameters for the unconsolidated sandstone reservoir, clarify the expansion laws of hydraulic fractures in the three directions of length, width, and height in separate layer fracturing in unconsolidated sandstones, and reveal the effects of the relevant factors, such as fracturing fluid viscosity, injection displacement, and the filtration coefficient on the expansion laws of hydraulic fractures.
Sandstone, with a good degree of cementation, is generally regarded as an elastic or porous elastic medium, while weakly consolidated unconsolidated sandstone has a more complex fracture generation mechanism due to its poor degree of cementation, low strength, high porosity, and permeability. Therefore, the preliminary research mainly focused on laboratory experiments, and these laboratory experiments were considered as an effective means to define and understand the deformation and failure mechanisms of weakly consolidated and unconsolidated sandstone. Murdoch (1993) [7,8] was the first to conduct experimental research on hydraulic fracturing. He injected tracer glycerin into a partially saturated silt containing some clay and found that four zones could be distinguished from the initiation to the fracture front: the initiation zone, the more pronounced fracture zone, the “finger in” zone, and the forward fluid loss zone, respectively. Khodaverdian and Mcelfresh (2000) [9] used 200-mesh quartz sand to prepare unconsolidated sandstone samples, injected a crosslinked guar gum solution, and conducted a classic hydraulic fracturing experiment in a radial flow vessel. It was believed that due to the strong plasticity and high pore pressure, the rock is thereby prone to enter a shear failure state, resulting in a large number of discrete and discontinuous short fractures. These results differ significantly from the traditional single tensile fractures. Gil (2005) [10,11] previously applied the particle discrete element method to assess the fracture propagation law in unconsolidated sandstone formations. The mechanical and physical parameters of unconsolidated sandstone were measured through experimental methods, and a corresponding discrete element model of particle flow was established. The results showed that intergranular shear failure was more significant than tensile failure during fracture extension. Zhang (2013) [12], Li (2016) [13], and others have conducted similar studies, and generally obtained a consistent understanding of the fracture propagation law. However, their methods have obvious shortcomings in terms of their practical application—comparing the micromechanical parameters used in the model with the macroscopic parameters measured in actual experiments is difficult. Therefore, there is currently a lack of research on the deformation and failure mechanisms of weakly consolidated and unconsolidated sandstone under fluid injection conditions based on discontinuous mechanics, which are still in the exploration stage. Feng Kai (2012) [14] identified an appropriate formula based on the characteristics of natural cores in unconsolidated sandstone reservoirs and simulated and developed artificial cores of unconsolidated sandstones. The physical properties of unconsolidated sandstone cores were assessed using different loading methods. Khodaverdian and Sorop et al. (2010) [15] injected a shear-diluted polymer reagent into an unconsolidated sandstone sample, and their results showed that the net pressure was lower than in the previously completed low-viscosity fluid injection experiment. It has been believed that rock deformation and failure are mainly caused by the shear expansion of the rock in the fracture tip area, while the fracture morphology has been considered to be a tensile fracture surrounding the “subparallel” shear fracture band. Germanvich’s research team [16,17,18] at the Georgia Institute of Technology began studying fracture propagation in completely unconsolidated rocks composed of granular materials after 2000 years. They believed that the level of ground stress is an important factor affecting the initiation and elongation behavior, and that fracture morphology is controlled by various mechanical mechanisms (dilatancy, compaction, and tension). Fluid loss is closely related to the fracture tip behavior. Golovin and Jasarevic et al. [19,20,21] conducted numerous hydraulic fracturing experiments on weakly consolidated and unconsolidated sandstones in 2010 and 2011, respectively. The experimental results show that with changes in the rheology, injection rate, and in-situ stress level of the injected fluid, fracturing fractures mainly include four morphologies: seepage, cavity, single visible fracture, and complex bifurcation fracture. After fracture initiation, several small fractures with random directions are formed near the open hole initially, and then they extend along the horizontal maximum loading direction to form a single integrated fracture. The results have shown that increasing the proportion of solid particles and the difference in the ground stress level in the injected fluid promotes the formation of a single plane fracture. Higher injection rates result in more complex fractures. In 2011 and 2012, Hosseini and Olson [22,23] first used the method of an airbag to apply stress in all directions to the samples in the true triaxial fracturing equipment, and then injected Vaseline oil as the fracturing fluid into the weakly consolidated unconsolidated sandstone samples and observed the experimental results using slices. The results showed that tensile failure mainly occurs during fracture initiation, and bifurcated shear fracture bands may be generated during the extension process under different experimental conditions.
Experiments on rock mechanic parameters mainly involve loading and unloading experiments under different stress paths, with the most common ones being uniaxial and triaxial compression experiments. In the past, a significant number of experimental studies focused on the constitutive model of weakly consolidated or unconsolidated sandstones, primarily examining the rock’s dilatancy softening behavior, such as oil sand dilatancy under high temperature and differential stress [24]. The most commonly used failure criteria are the Moore Coulomb criterion, the Drucker Prager criterion, and their corresponding modified and derived models [25,26,27,28,29,30,31]. The Mohr Coulomb criterion has been widely used in rock mechanics as it only requires two parameters, being cohesion and the internal friction angle, which can be easily measured through conventional rock mechanic parameter experiments. The model is highly convenient and straightforward. However, the Mohr Coulomb criterion does not consider the influence of intermediate principal stress and is limited to describing the dilatancy behavior of the rock, thereby making it challenging to assess the shear compaction phenomena in the deformation and failure of weakly consolidated and unconsolidated sandstones. The Cambridge model and the modified Cambridge model as two constitutive models describing the elastoplastic behavior of weakly consolidated soils can well describe the shear-expansion behavior of rocks. The Cambridge model only needs to determine a few parameters, such as the elastic modulus and the shear-expansion modulus of the rock to describe the shear-expansion behavior of these rocks, while the modified Cambridge model introduces additional correction coefficients and parameters, such as initial shear-expansion, stress stiffness, etc., to describe the shear stress-strain response and the shear-expansion characteristics of rocks in more detail. In recent years, several studies [32,33,34,35,36,37,38,39,40,41,42,43,44] have started using the modified Cambridge model to conduct mechanical experiments on unconsolidated sandstones. The results demonstrated that the model effectively describes the dilatancy behavior of rocks under high-stress differences and confining pressures, while also considering the coupling relationship between the stress state and the elastic parameters. Unlike well-consolidated brittle rock, the strength of cement in weakly consolidated and unconsolidated sandstones is significantly lower than that of rock particles, and pore collapse is considered the main failure mode during compaction.
In this paper, unconsolidated sandstone mechanical properties were obtained, and modifications were made to the traditional Cambridge model. A three-dimensional fracture propagation model for the hydraulic fracturing of unconsolidated sandstones was established based on the modified model. The effects of viscosity, the filtration coefficient, and the injection displacement of the fracturing fluid on the three-dimensional fracture propagation of separately layered fracturing of unconsolidated sandstones were assessed. These research results have guiding significance for field fracturing construction.

2. Experimental Procedure

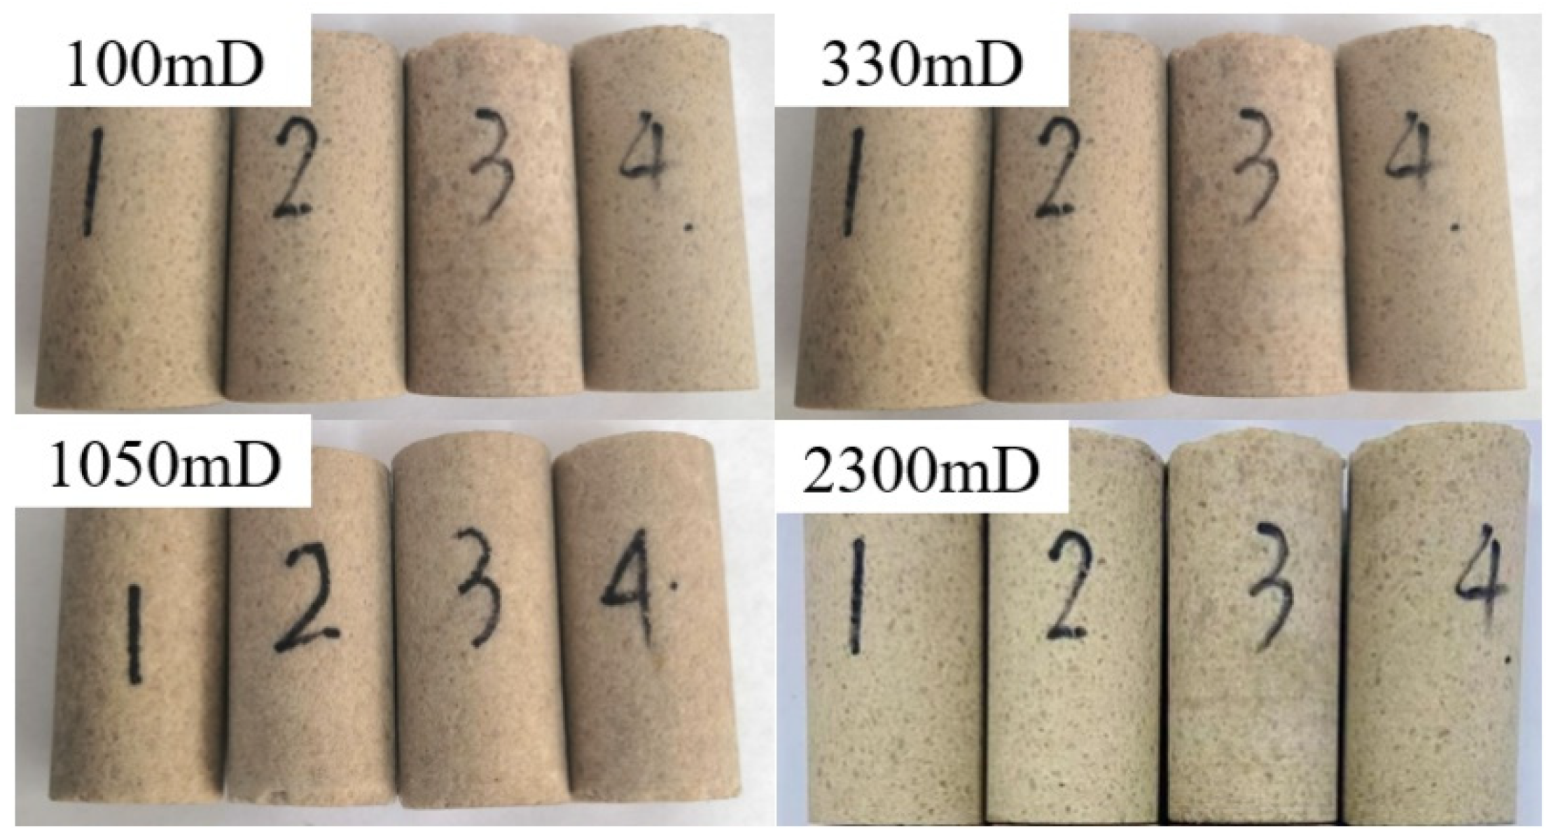
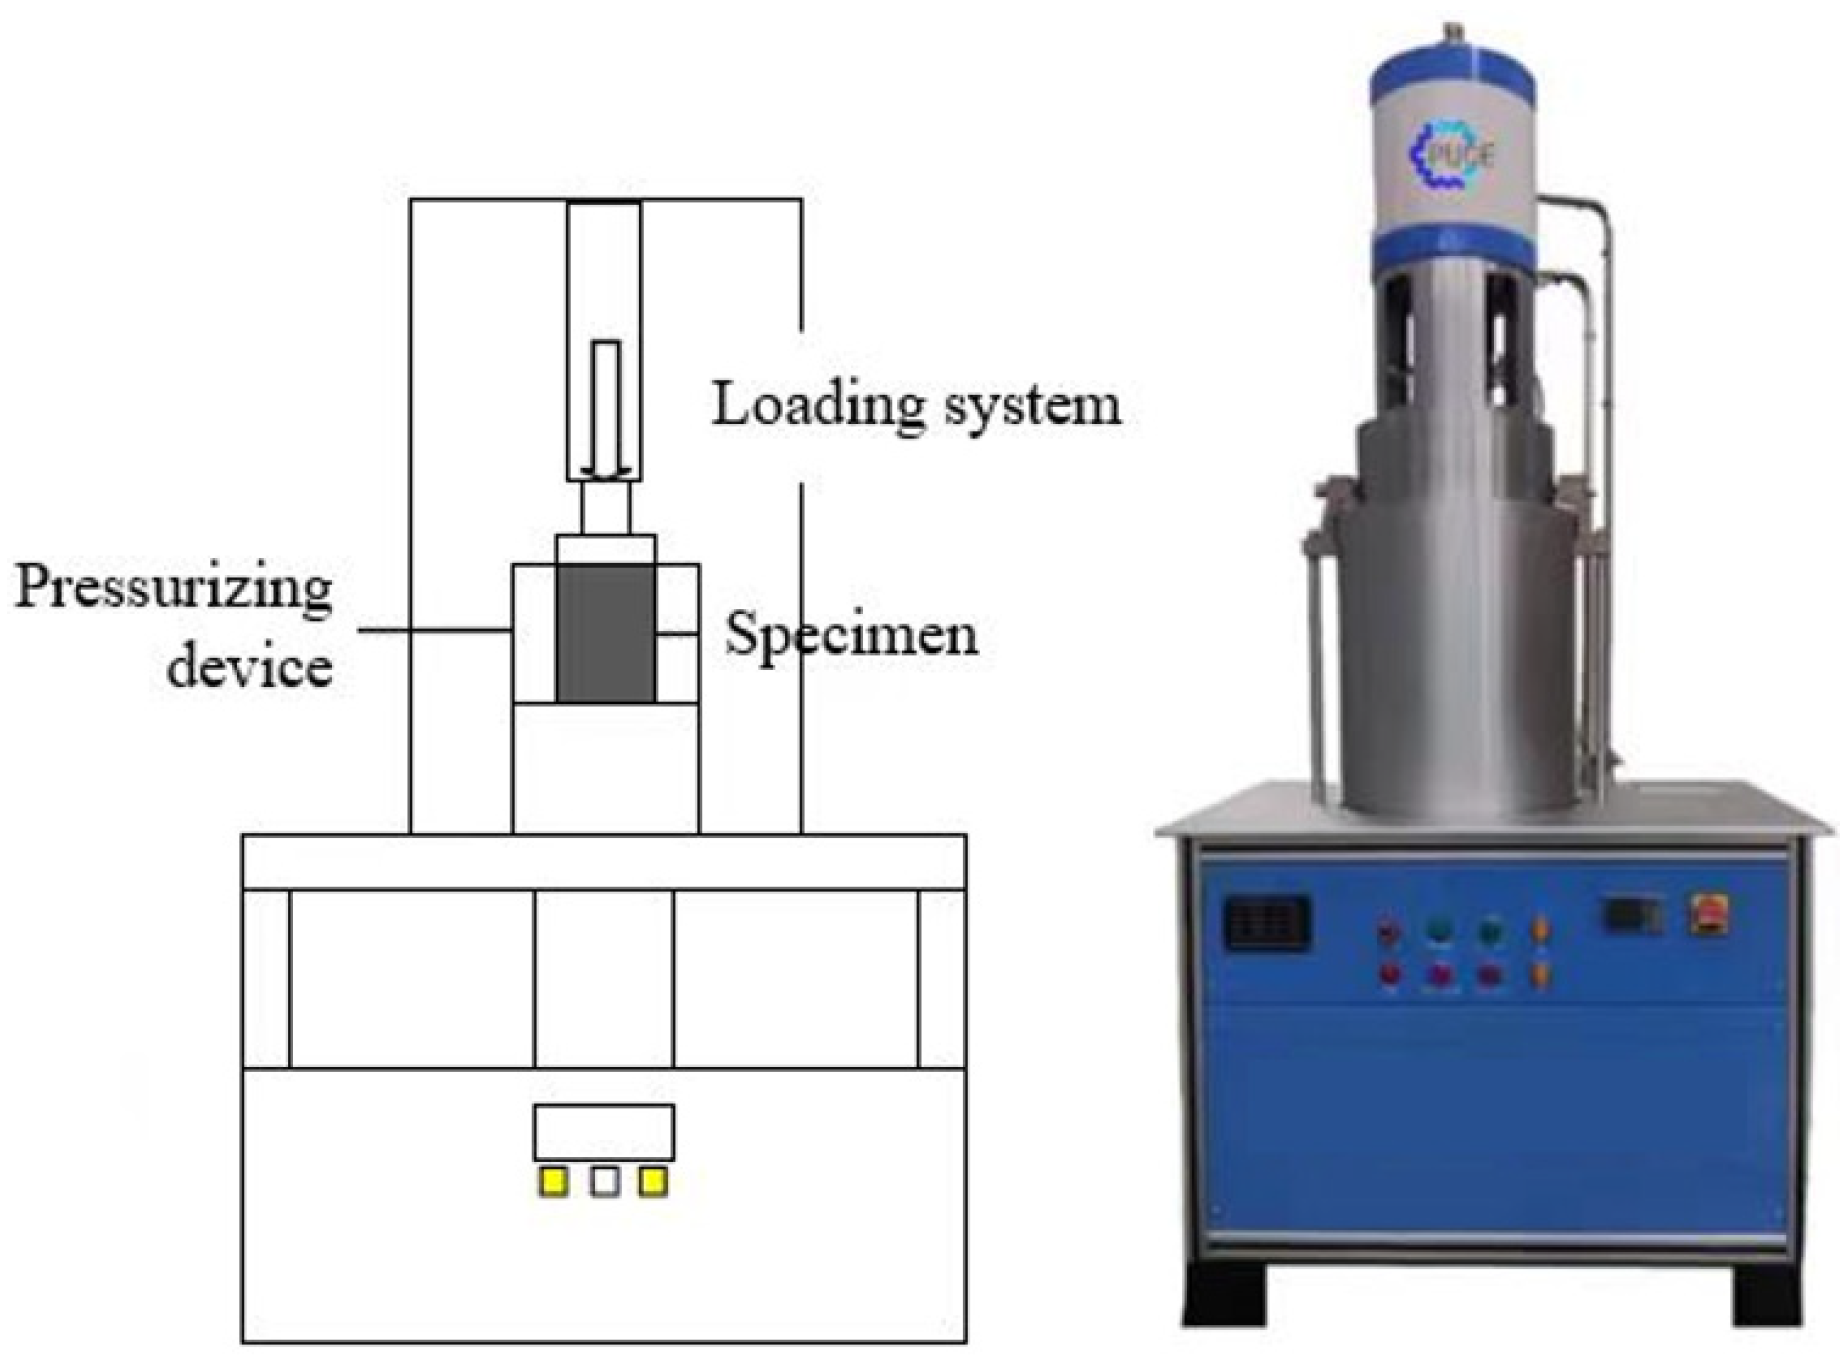
2.1. Experiment Preparation

In this paper, sandstones of different depths obtained from well X were selected as the experimental materials. Cylindrical rock samples with diameters of 25 mm and heights of 50 mm, respectively, were used as the rock samples. From the obtained cores, the core with no obvious damage and smooth surface was selected for the preparation of the standard samples. The specific length, diameter, mass, and other basic material parameters of the core were then measured. Four groups of cores with different permeabilities were selected in this experiment, which were 100 mD, 330 mD, 1050 mD, and 2300 mD, respectively. There are 4 samples in each group, totaling 16 cores (Figure 1).
The experimental instrument used in this study was the rock multi-field coupling triaxial test instrument produced by Changchun Praseoce Test Instrument Co., Ltd. (Changchun, China) (Figure 2). The experimental instrument mainly consists of an axial pressure system, a confining pressure system, and a water pressure system, which can directly measure the failure strength, elastic modulus, and other parameters of the sample in a single test. The loading rate was controlled at 0.5 mm/min until the sample is destroyed. During this period, the experimental curve was displayed through the system experiment, and the experimental data was automatically recorded. This instrument was then used to carry out the compressive test on the prepared core sample.

2.2. Experiment Results

The uniaxial compression test of the rock samples with different permeabilities was carried out using the triaxial tester. Based on the experimental data obtained directly from these uniaxial compression tests, the stress-strain curve of a typical unconsolidated sandstone specimen, as shown in Figure 3, was plotted. According to Figure 3, it can be seen that although the permeability is different, the stress-strain curve of the unconsolidated sandstone can be roughly divided into four stages: (1) initial stage: the trend of the axial strain of the unconsolidated sandstone specimen is steep as the load increases as the small cracks or pore throats inside the rock are slowly closed due to the actions of the external forces; (2) nearly elastic deformation stage: this stage of the unconsolidated sandstone is almost a proportional relationship, where there is a linear relationship between the displacement and the load. The elastic modulus is the tangent slope at the midpoint of this stage; (3) plastic deformation stage: this refers to the part of the unconsolidated sandstone that first enters the plastic stage with a low strength, which will lead to the development of new gaps inside the specimen. At the same time, the slightly higher strengthened part of the specimen also begins to enter the plastic stage. The previous cracks become more developed, and the curve of this stage does not continue according to the trend of the previous stage; and the (4) failure stage: where the specimen continues to bear the actions of axial shear stress after the plastic deformation stage. After being in the ultimate bearing stage, the cracks developed inside the rock gradually connect with each other to form visible large cracks. The overall unconsolidated sandstone thereby lacks bearing capacity.
For sandstone, the rock classification standard usually considers it as an unconsolidated sandstone if its uniaxial compressive strength (UCS) is less than 20 MPa. However, there are no unified conclusions on its strength for weakly cemented unconsolidated sandstone, and several studies believe that its UCS should be less than 5 MPa. When the UCS of an unconsolidated sandstone is less than 1 MPa, the rock will break under little pressure, and can be regarded as either uncemented or a pile of unconsolidated sand, which is not within the scope of research. Four unconsolidated samples with different permeabilities (S-1, S-2, S-3, and S-4, respectively) were selected for stress-strain comparison analysis, and the stress-strain curve comparison chart is displayed in Figure 3. By analyzing and comparing the graph, it can be concluded that the compressive strength of unconsolidated sandstone decreases with the increase in the permeability. Under the same stress conditions, unconsolidated sandstone with higher permeability inevitably has a higher strain. These uniaxial experimental test results found that the strength of the unconsolidated sandstone was low, with UCS value ranging from 3.4 to 4.5 MPa, respectively.

3. Constitutive Equations

Roscoe and his colleagues from the University of Cambridge (1958–1963) proposed the basic concept of the fully yield boundary surface, and established a representative soil elastic-plastic model, termed as the Cambridge clay model (hereafter referred to as the Cam model). The Cam model was developed based on a large number of isotropic consolidation and swelling tests on normally consolidated clay and weakly over-consolidated clay, as well as triaxial drained and undrained shear tests under different consolidation pressures. Later, it was also extended to strongly over-consolidated clay. This model adopts a hat yield surface, corresponding flow rules, and hardening parameters based on the plastic volume strain. The Cam model, also known as the critical state model, theoretically explains the characteristics of elastic-plastic deformation in the soil, marking the beginning of a new stage in the development of soil constitutive models, and has been widely accepted and applied internationally. In recent years, the extension of the modified Cam-clay model has been referred to as a double surface material constitutive model. The implementation of this version appears to give more accurate results [45,46]. This section introduces and modifies the Cambridge model.

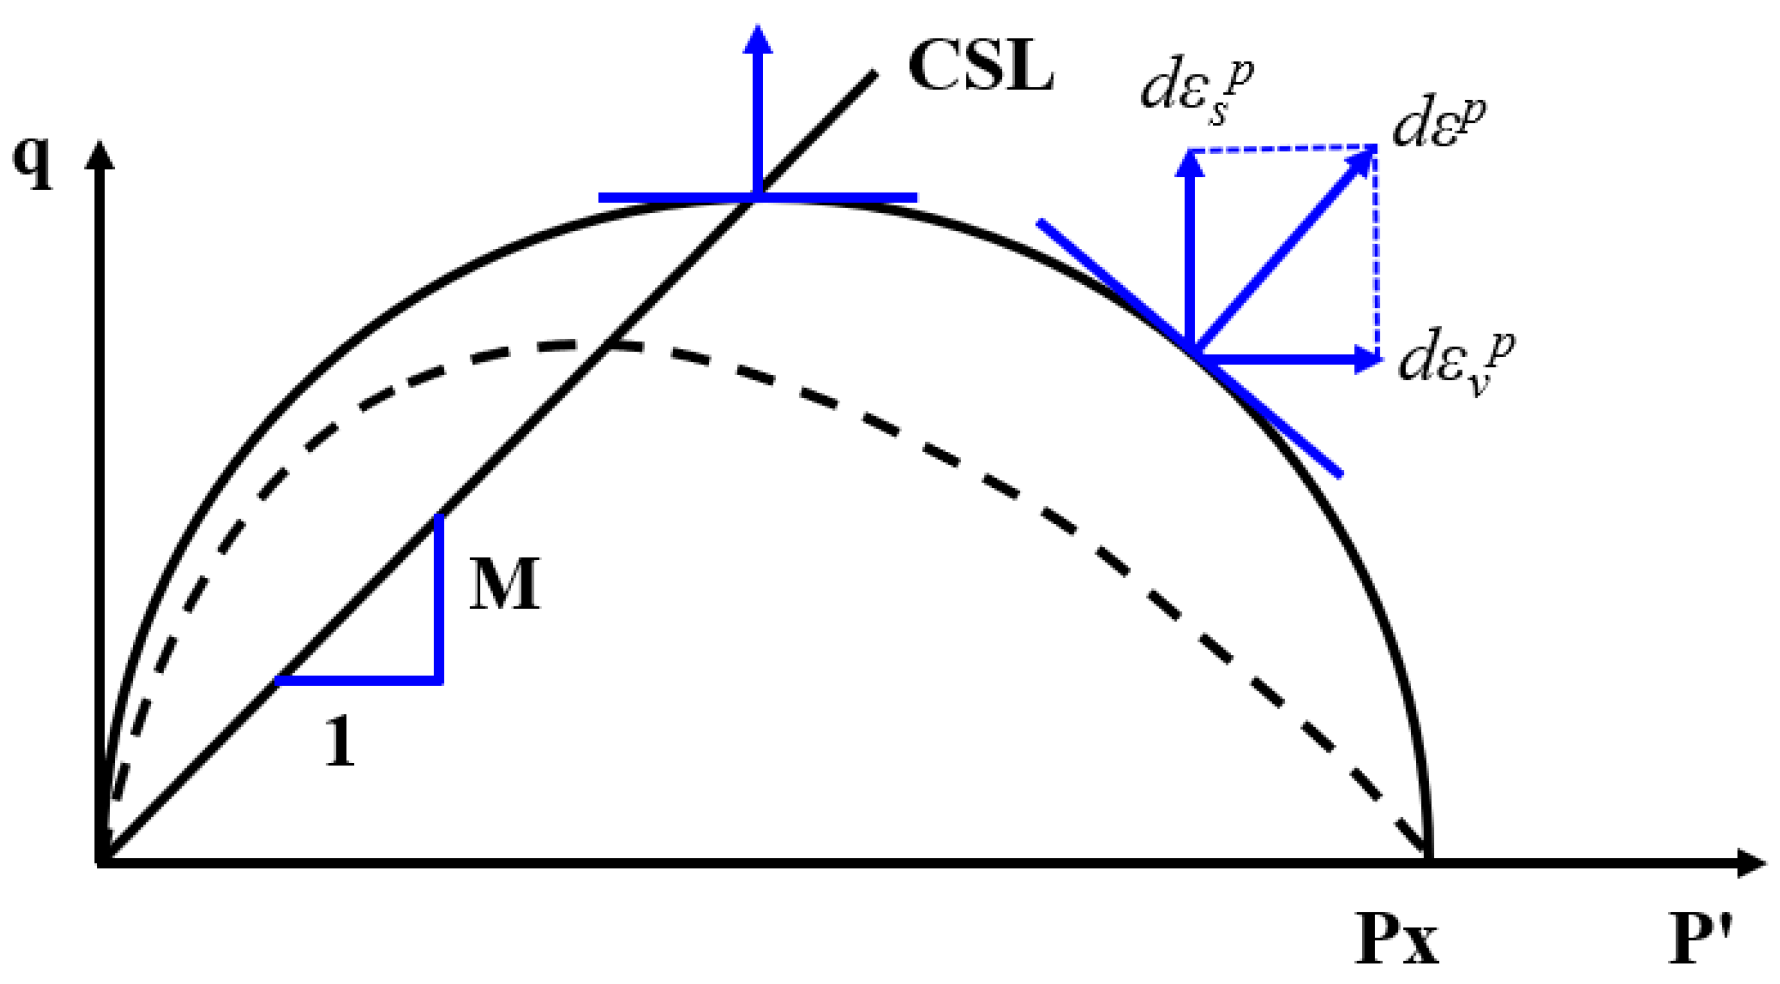
3.1. Basic Theory of the Cam Model

It has been proven that for normal consolidated clay and weakly consolidated saturated remodeled clay, there is a unique relationship between the pore ratio e and the external force p′, q, and it does not change with the stress path. This model attempts to describe the phenomenon observed in laboratory tests, that is, loading from an initial state to a critical state that maintains plastic constant volume deformation. Its basic composition is as follows:
(1)
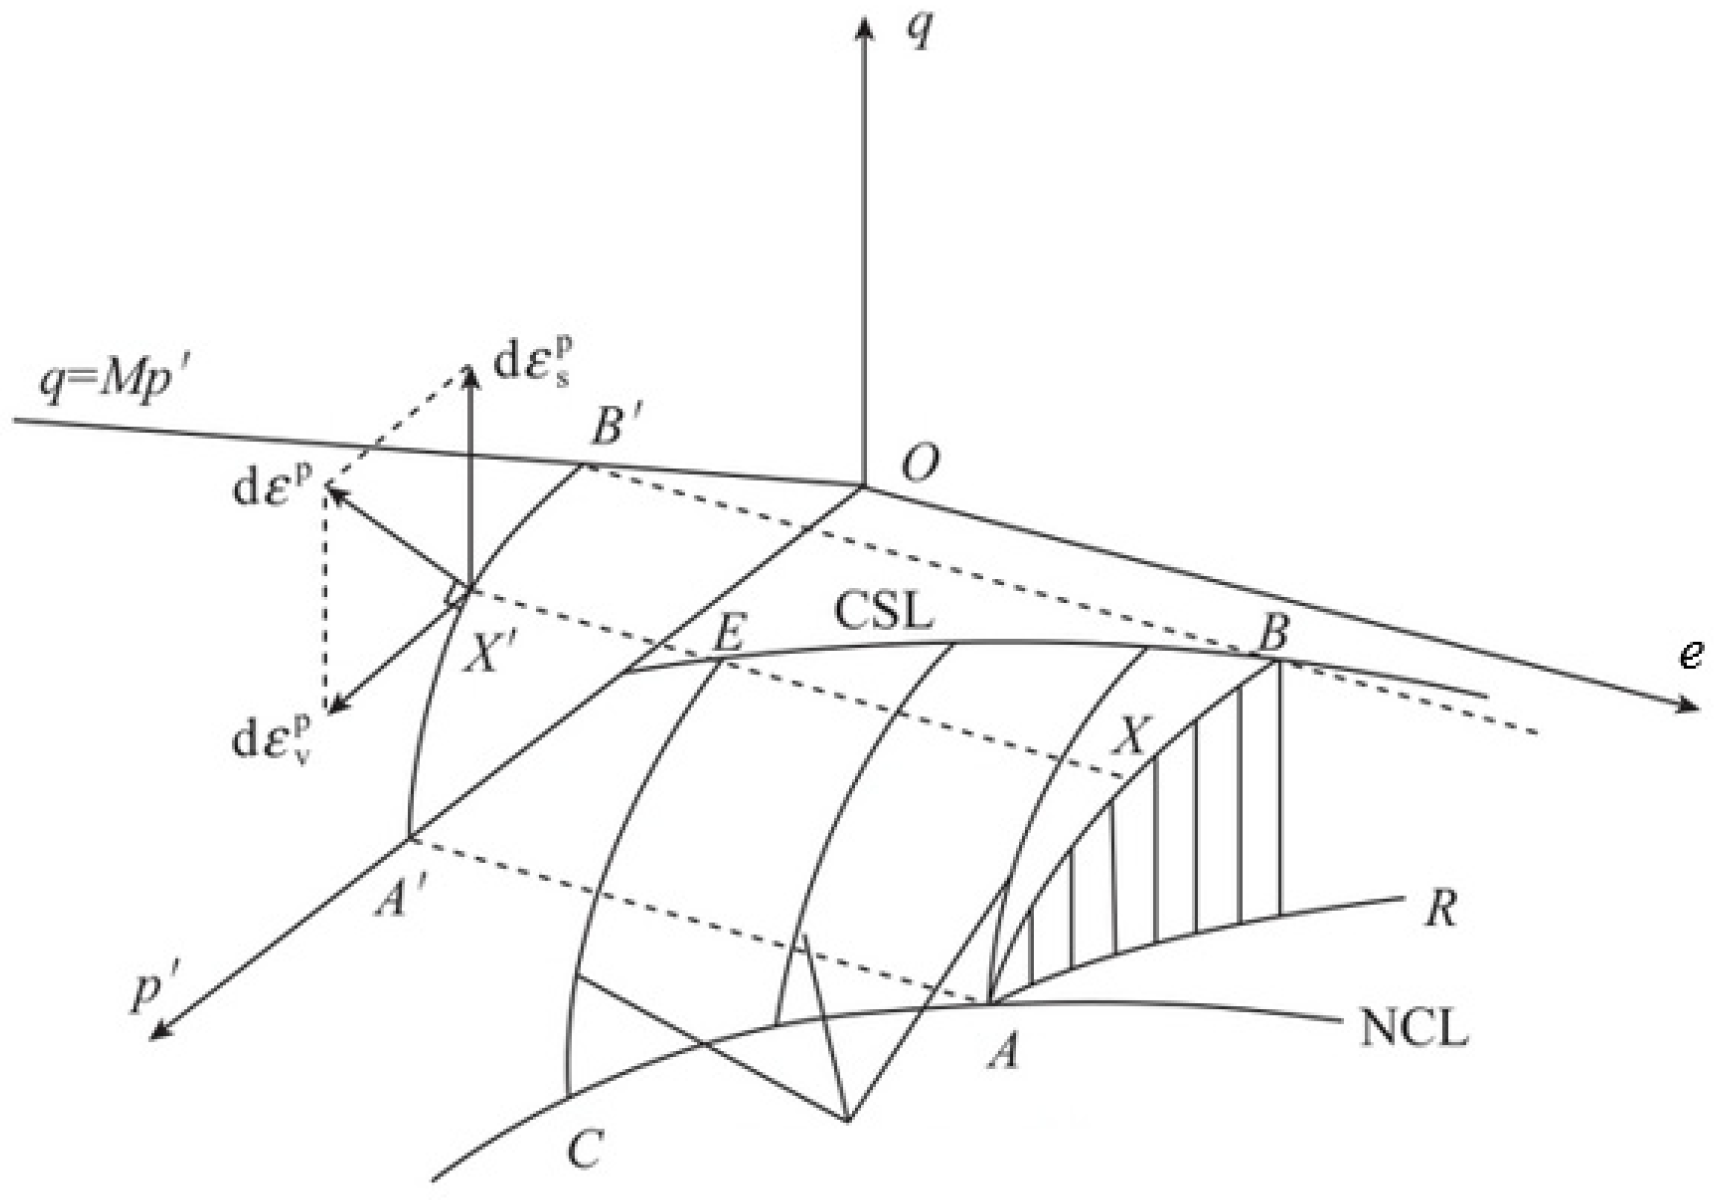
In the (e, p′) plane, a curve exists in that all stresses in the normally consolidated clay follow this path, which is called the normal consolidation line (NCL). This line provides volume hardening rules that can be generalized to general stress conditions;
(2)
There also exists a line in the (e, p′, q) space, and all residual states follow this path, regardless of the experiment class and the initial conditions. This line is parallel to the normal consolidation line in the (e, p′) plane, where shear deformation occurs without volume deformation;
(3)
The stress path obtained from the consolidated drainage and undrained experiments is located in a unique state surface, generally known as the Roscoe surface. In fact, in the undrained path, the soil hardens with the development of the plastic volume strain where the sum of the elastic and plastic strain increments of the volume strain remains constant. The value of the Roscoe surface lies in the fact that it provides a basis for selecting the type of the yield surface.
This model is based on the assumption of critical state line, yield surface, and the consolidation law of the correlated plasticity theory. This model assumes that: (1) the yield is only related to two stress components, the stress sphericity p′, and the stress eccentricity q, and has nothing to do with the third stress invariant; (2) the strain hardening law of the plastic body has been adopted, and H is used as the hardening parameter; (3) that the plastic deformation conforms to the associated flow law, that is, g(s) = f(s); and (4) that the work has been consumed by deformation, namely the plastic work, which is as follows:
d W p = M p d ε s p
where: M = q / p ; d ε s p is the increment of the plastic partial strain.

3.2. Constitutive Equation of the Cam Model

(1)
Energy equation
In order to obtain the yield function, Roscoe adopted the energy theory and established the energy equation. Under the conditions of octahedral stress p′ and q, there are stress increments dp′ and dq when loading, resulting in the formation of deformation increments, volume strain increments d ε v , and partial strain increments d ε q . The deformation energy increment is:
d W = p d ε v + q d ε q
The increment of deformation energy can be divided into the recoverable elastic deformation energy increment d W e and the unrecoverable plastic deformation energy increment d W p , namely:
d W = d W e + d W p
Among them:
d W e = p d ε v e + q d ε q e
d W p = p d ε v p + q d ε q p
In the Cam model, it has been assumed that the elastic volume strain can be obtained from the rebound curve of the isobaric consolidated sample,
d ε v e = d v e 1 + e = κ 1 + e · d p p
and it is also assumed that all shear strains are unrecoverable, d ε q e = 0 .
There is
d W e = p d ε v e + q d ε q e = κ d p 1 + e
In the Cam model, it is also assumed that the increment formula of plastic deformation energy is
d W p = M p d ε q p = M p d ε q
There is
d W = d W e + d W p = p d ε v + q d ε q = κ d p 1 + e + M p d ε q
(2)
Yield surface equation
The yield surface of the Cam model is the Roscoe state boundary surface. In this model, it is assumed that the soil is a work-hardened material, and the flow rule is adopted, that is, as the plastic potential surface coincides with the yield surface. In Figure 4, the stress and strain planes coincide, d ε p is the plastic strain increment, and d ε v p and d ε q p represent the plastic volume strain and plastic partial strain increments, respectively.
For any point X′ on the yield trajectory, the plastic strain increment d ε p coincides with the direction of the yield surface development at the point beyond X′:
q M p + ln p = ln C
where lnC is an integral constant, which can be determined by the boundary conditions.
In Figure 4, Equation (10) for the test point A′(p0, 0, e0) of the isotropic pressure, C = p0, substituted into Equation (10), and then the equation of the yield trajectory on the p′-q plane is
q p M ln p 0 p = 0
(3)
Stress-strain relationship
d v = ( λ κ M d η + λ p d p )
or
d ε v = λ κ 1 + e ( λ λ κ · d p p + d η M )
where η is the normal stress ratio, which can be obtained from the energy Equation (9)
κ 1 + e d p + M p d ε q = p d ε v + q d ε q
By substituting Equation (13) into Equation (14), we get
d ε q = λ κ 1 + e · p d η + M d p M p ( M η )
or
d ε q = λ κ 1 + e 1 M η · d p p + 1 M ( M η ) d η
According to Equations (13) and (14), if the stress increments dp′ and dq are known, the corresponding strain increment d ε v and d ε q sum can thus be obtained.

3.3. The Modified Cam-Clay Model

When the same plastic potential surface is hardened and unchanged, the plastic function g and the yield function f can be equivalently exchanged.
d ε v p = d λ f p
d ε s p = d λ f q
By substituting it into the dilatancy equation, the relation between plasticity and stress variation can be obtained:
d ε v p d ε s p = f p / f p p q = q p
By substituting it into the total differential of the yield function and then integrating it, the expression of the yield function f is as follows:
f = q p + M ln p C
The plastic work equation is written as follows:
d W p = M p d ε s p = p d ε v p 2 + q d ε v p 2 = p d ε v p 2 + M d ε v p 2
According to this correction, the corrected dilatancy equation can be obtained:
d ε v p d ε s p M 2 ( q / p ) 2 2 q / p = M 2 p 2 q 2 2 p q
The yield function can then obtained:
f = q 2 + M 2 p 2 C p
The modified yield function curve of the Cam model is shown as follows:
As shown in Figure 5, the modified yield function curve forms a semi-elliptic shape. When the shear stress is 0, the average effective stress is p = p x , which is the yield pressure of isotropic compression. p x , 0 substituted into the yield function yields:
C = M 2 p x
After substitution into Equation (22), we can then obtain:
q 2 + M 2 p 2 = M 2 p 2 p x p
The plastic strain expression of rock is:
ε v p = ε v ε v e = λ κ 1 + e 0 ln p x p 0
p 0 , e 0 represents the initial point of the normal consolidation line in Equation (25), which can be sorted as follows:
p x = p 0 exp ε v p c p
where c p = λ κ 1 + e 0 is the plastic stiffness of the unconsolidated sandstone.
Since unconsolidated sandstone will slowly harden in the process of compressive resistance, hardening parameters have been adopted in this study to describe the whole process of the unconsolidated sandstone’s compressive resistance change, and H has now been used to represent the hardening parameters. According to the characteristics of H on the same yield surface, that is, on the same yield function, the hardening parameter is constant, and is in direct proportion to p x . Therefore, the expression of the hardening parameter can be expressed as follows:
H = c p , q d ε v p
The new yield function is obtained as follows:
f = ln p p 0 + ln 1 + q 2 M 2 p 2 H = 0
Thus, the expression of plastic shear strain can be written as:
d ε s p = 1 c p , q 1 p 4 η 2 M 4 η 4 d q
The stress-strain curves of normally consolidated and over-consolidated rocks are very similar, except that the stiffness of the initial changes c p and the peak stress M f are different. The plastic shear strains of normally consolidated and over-consolidated rocks are as follows:
d ε s p = c p 1 p 4 η 2 M 4 η 4 d q
d ε s p = ρ 1 p 4 η 2 M f 4 η 4 d q
where ρ is the plastic stiffness of the over-consolidated rock, and M f is the peak stress ratio of the over-consolidated rock.
Following sorting, the expression of hardening parameters can be derived as follows:
H = 1 ρ M f 4 η 4 M 4 η 4 d ε v p
However, ρ in Equation (32) is unknown, which can be obtained through the plastic volume strain increment. The expression of the plastic volume strain is as follows:
d ε v p = Λ f p = ρ M 4 M f 4 d p x p
d ε v p = λ s κ 1 + e 0 d p x p
where ρ can thereby be obtained from Equations (33) and (34).
ρ = M 4 M f 4 λ s κ 1 + e 0
The hardening parameters were obtained by substituting Equation (35) into Equation (33).
H = 1 + e 0 λ s κ M 4 M f 4 M f 4 η 4 M 4 η 4 d ε v p
For the convenience of study, the plastic stiffness of normally consolidated rock c p was substituted into the above equation, and the hardening parameter thus became:
H = 1 c p λ κ λ s κ M 4 M f 4 M f 4 η 4 M 4 η 4 d ε v p
There must be a relationship between the peak stress ratio and the critical state ratio λ κ / λ s κ 1 , M 4 / M f 4 1 , and with previous studies having shown that λ κ / λ s κ and M 4 / M f 4 are of the same order of magnitude, the two can approximately cancel each other out, so the hardening parameter can thereby be simplified as:
H = 1 c p M f 4 η 4 M 4 η 4 d ε v p
Equation (38) is converted into a hardening parameter to represent the plastic volume strain of over-consolidated rock, which is as follows:
ε v p = c p M 4 η 4 M f 4 η 4 d H
The volume strain can be divided into the elastic volume strain and the plastic volume strain, meaning the expression of the volume strain is:
ε v = ε v e + ε v p = κ 1 + e 0 ln p x p 0 + c p M 4 η 4 M f 4 η 4 d H
The parameters calculated by the modified Cambridge model are shown in Table 1.

4. Numerical Simulation
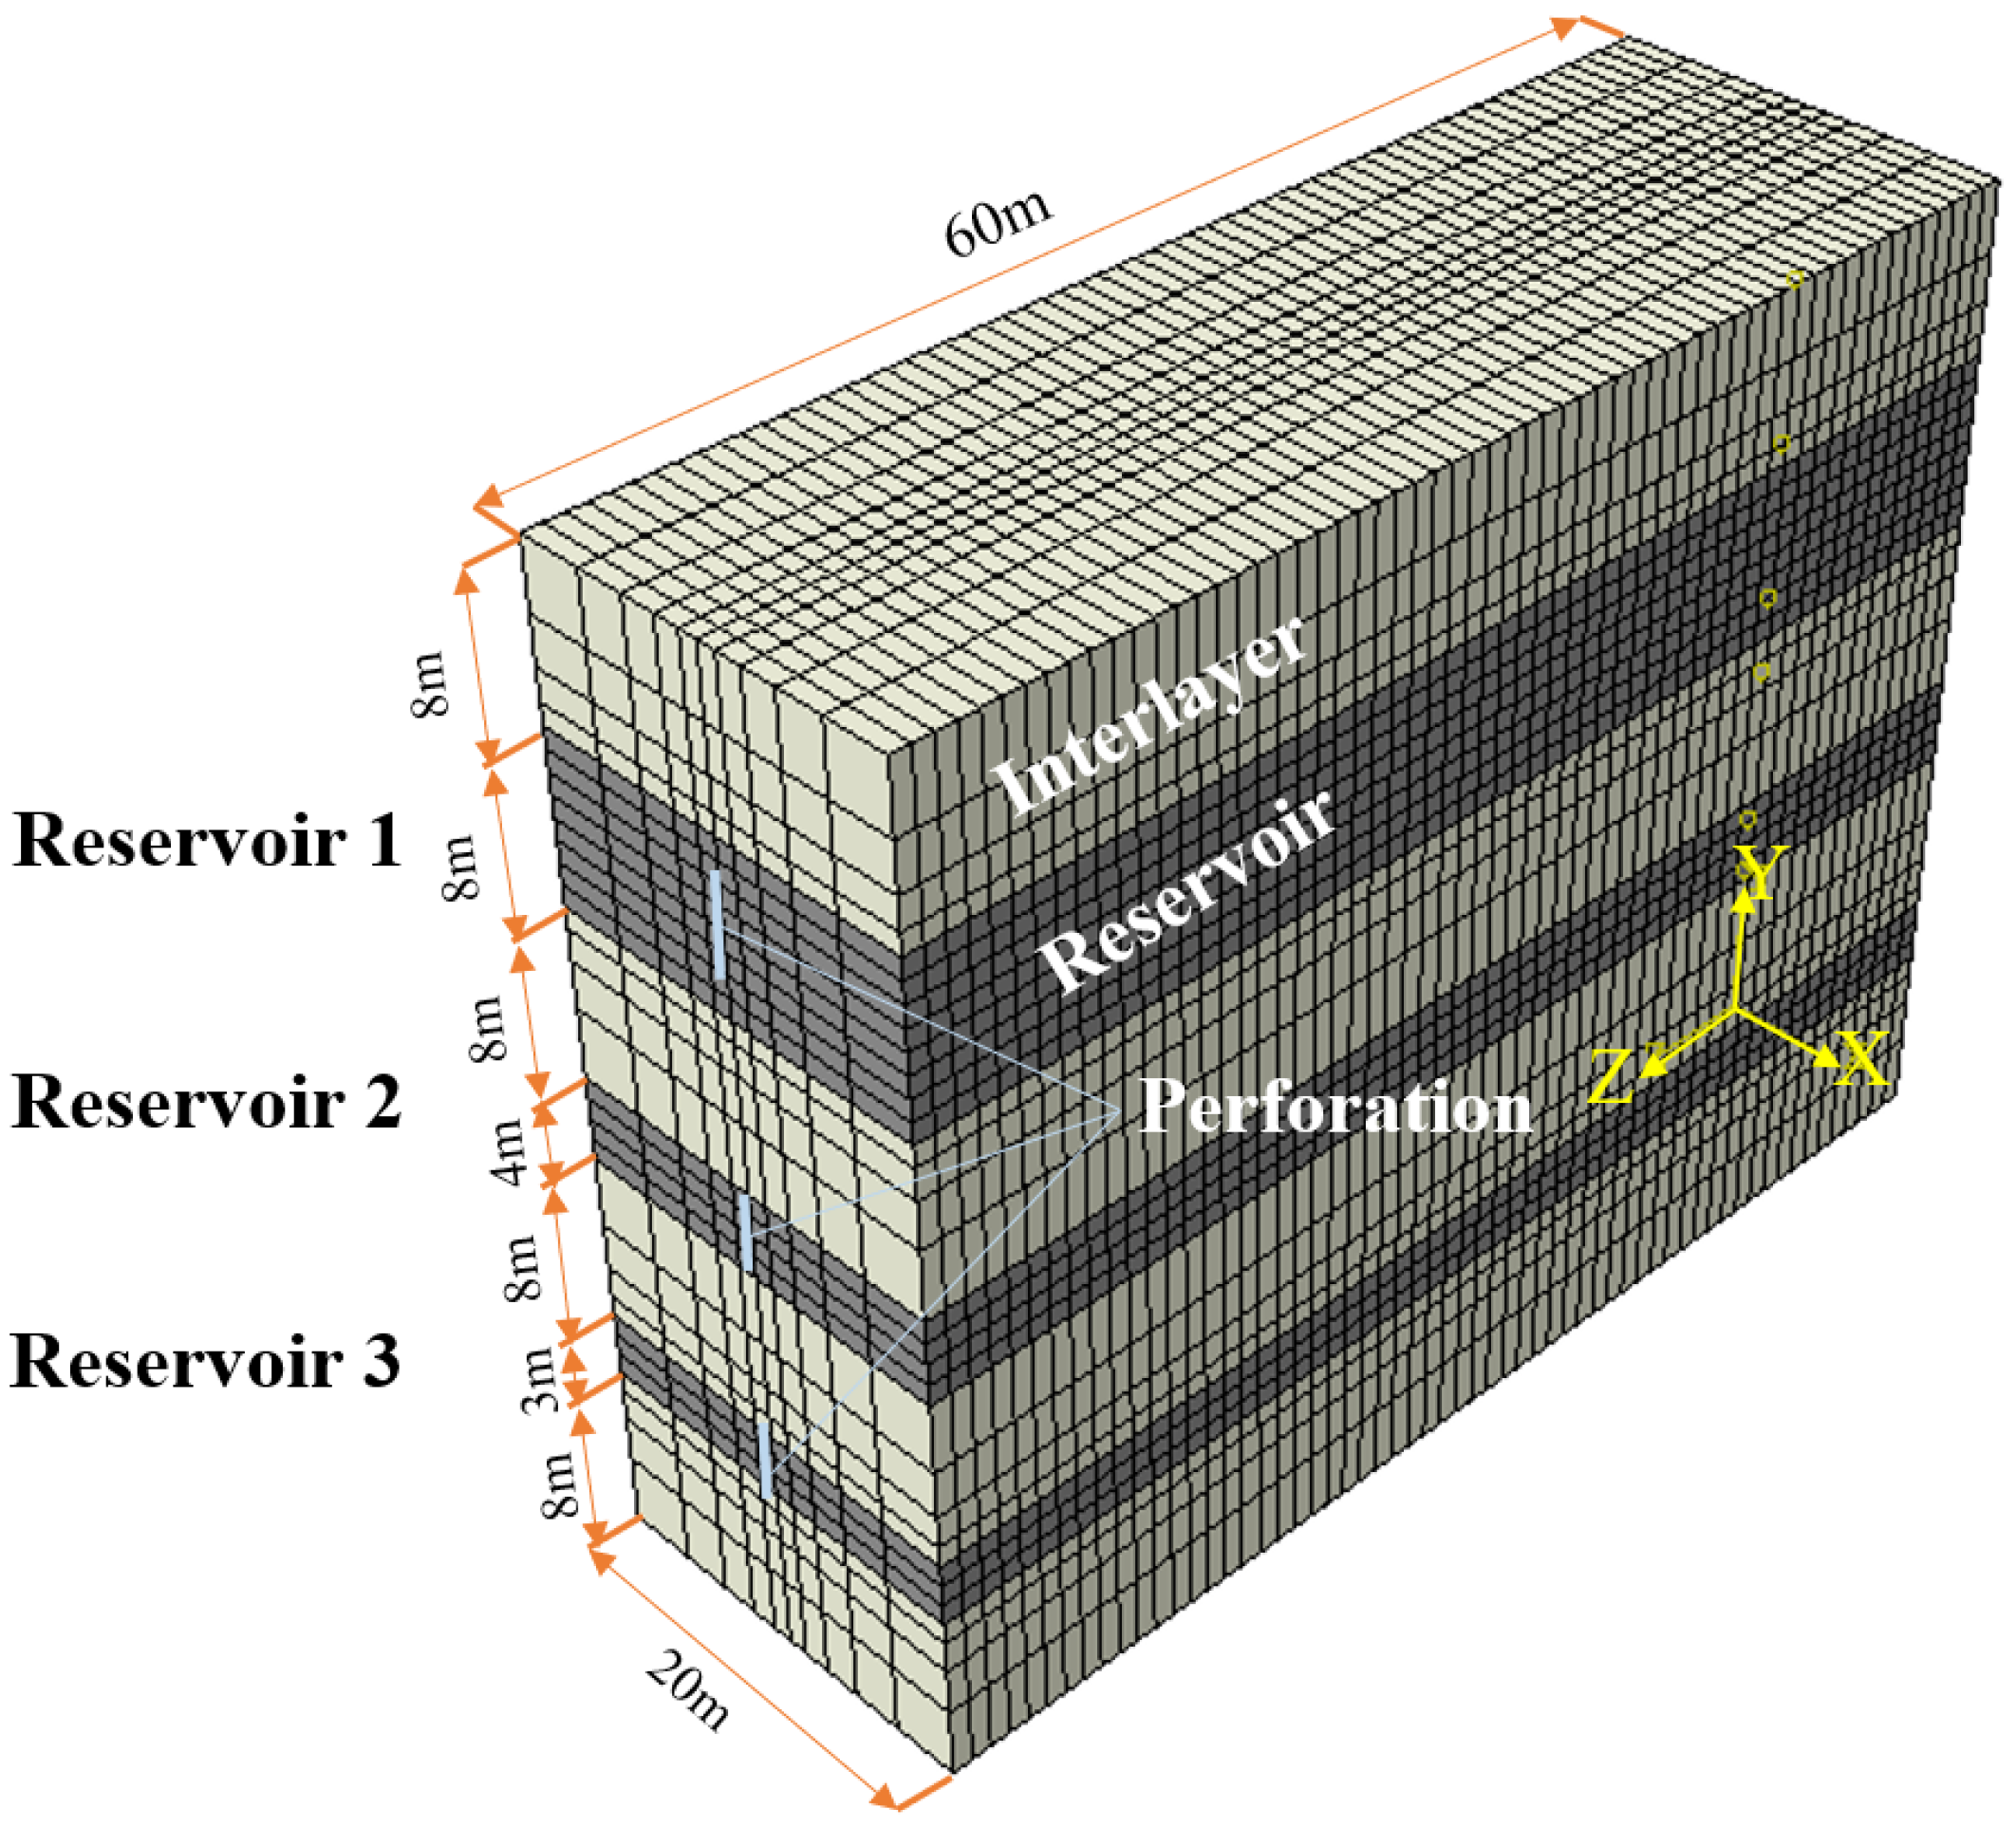
4.1. Model Building

As shown in Table 2, in the actual formation of well X, the reservoir and interlayer are superimposed on each other, and the thickness of the reservoir and spacer is not equal. Considering that fracturing requires multiple layers at a time to improve its construction efficiency, a three-dimensional numerical model incorporating separate layered fracturing has been established using software according to the reservoir parameters of well X (Table 3), and the influence of the construction factors and geological factors on fracture propagation under the mode of separate layered fracturing has been studied. The length, width, and height of the model are 60 m × 20 m × 47 m, respectively, among which the thickness of the interlayer was 8 m, and the thickness of the reservoir was 8 m, 4 m, and 3 m, respectively. In order to make the model run more convergently, and the calculation results more accurate and reliable, the model used an excessive mesh encryption for the fracture main expansion layer. The mesh property was designed as a pore fluid/stress attribute, and the mesh type was designed as a full three-dimensional quadrilateral mesh (C3D8P), as shown in Figure 6.

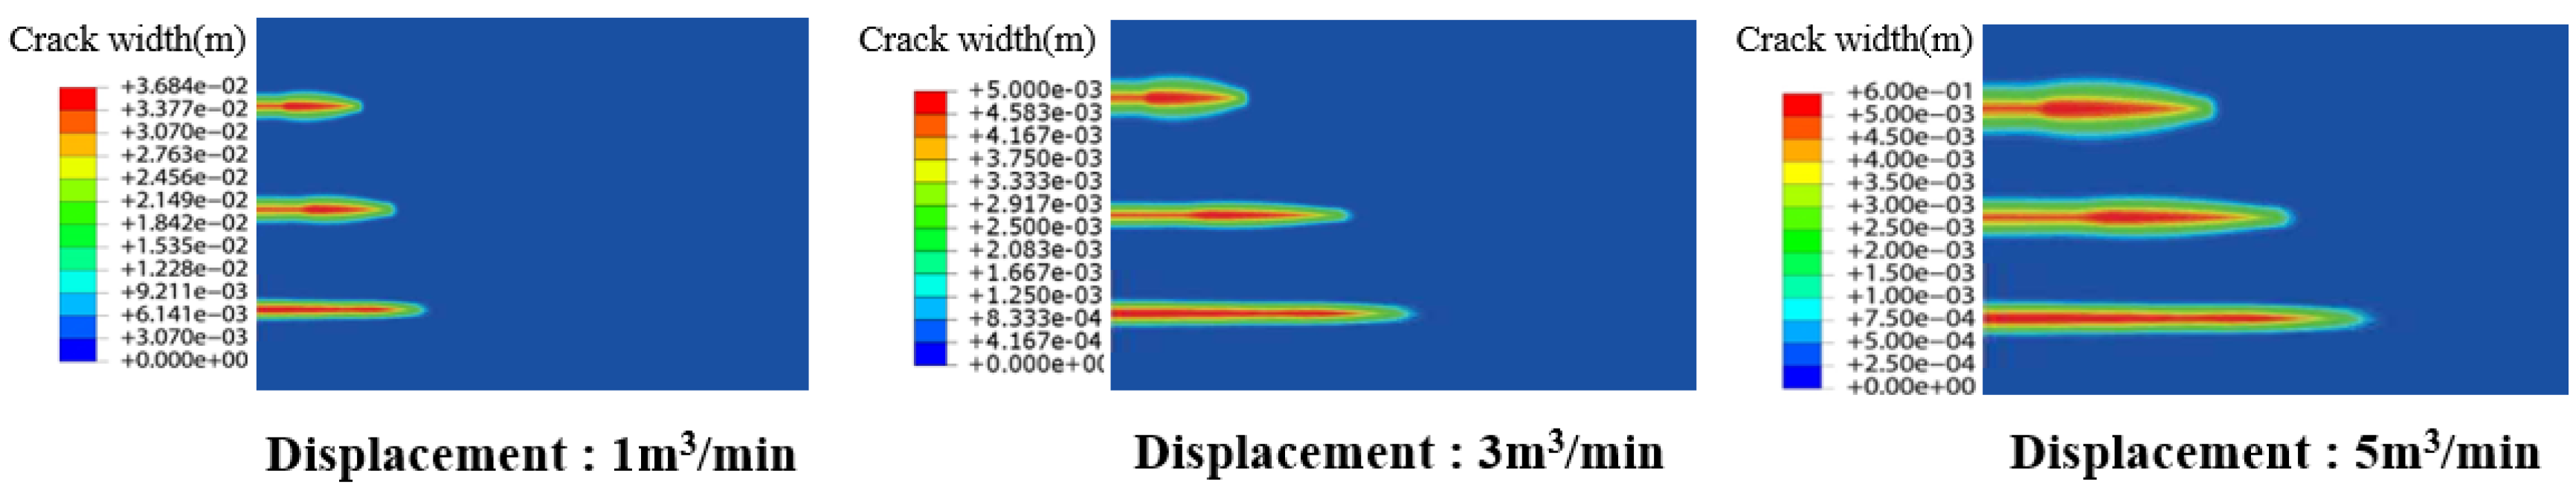
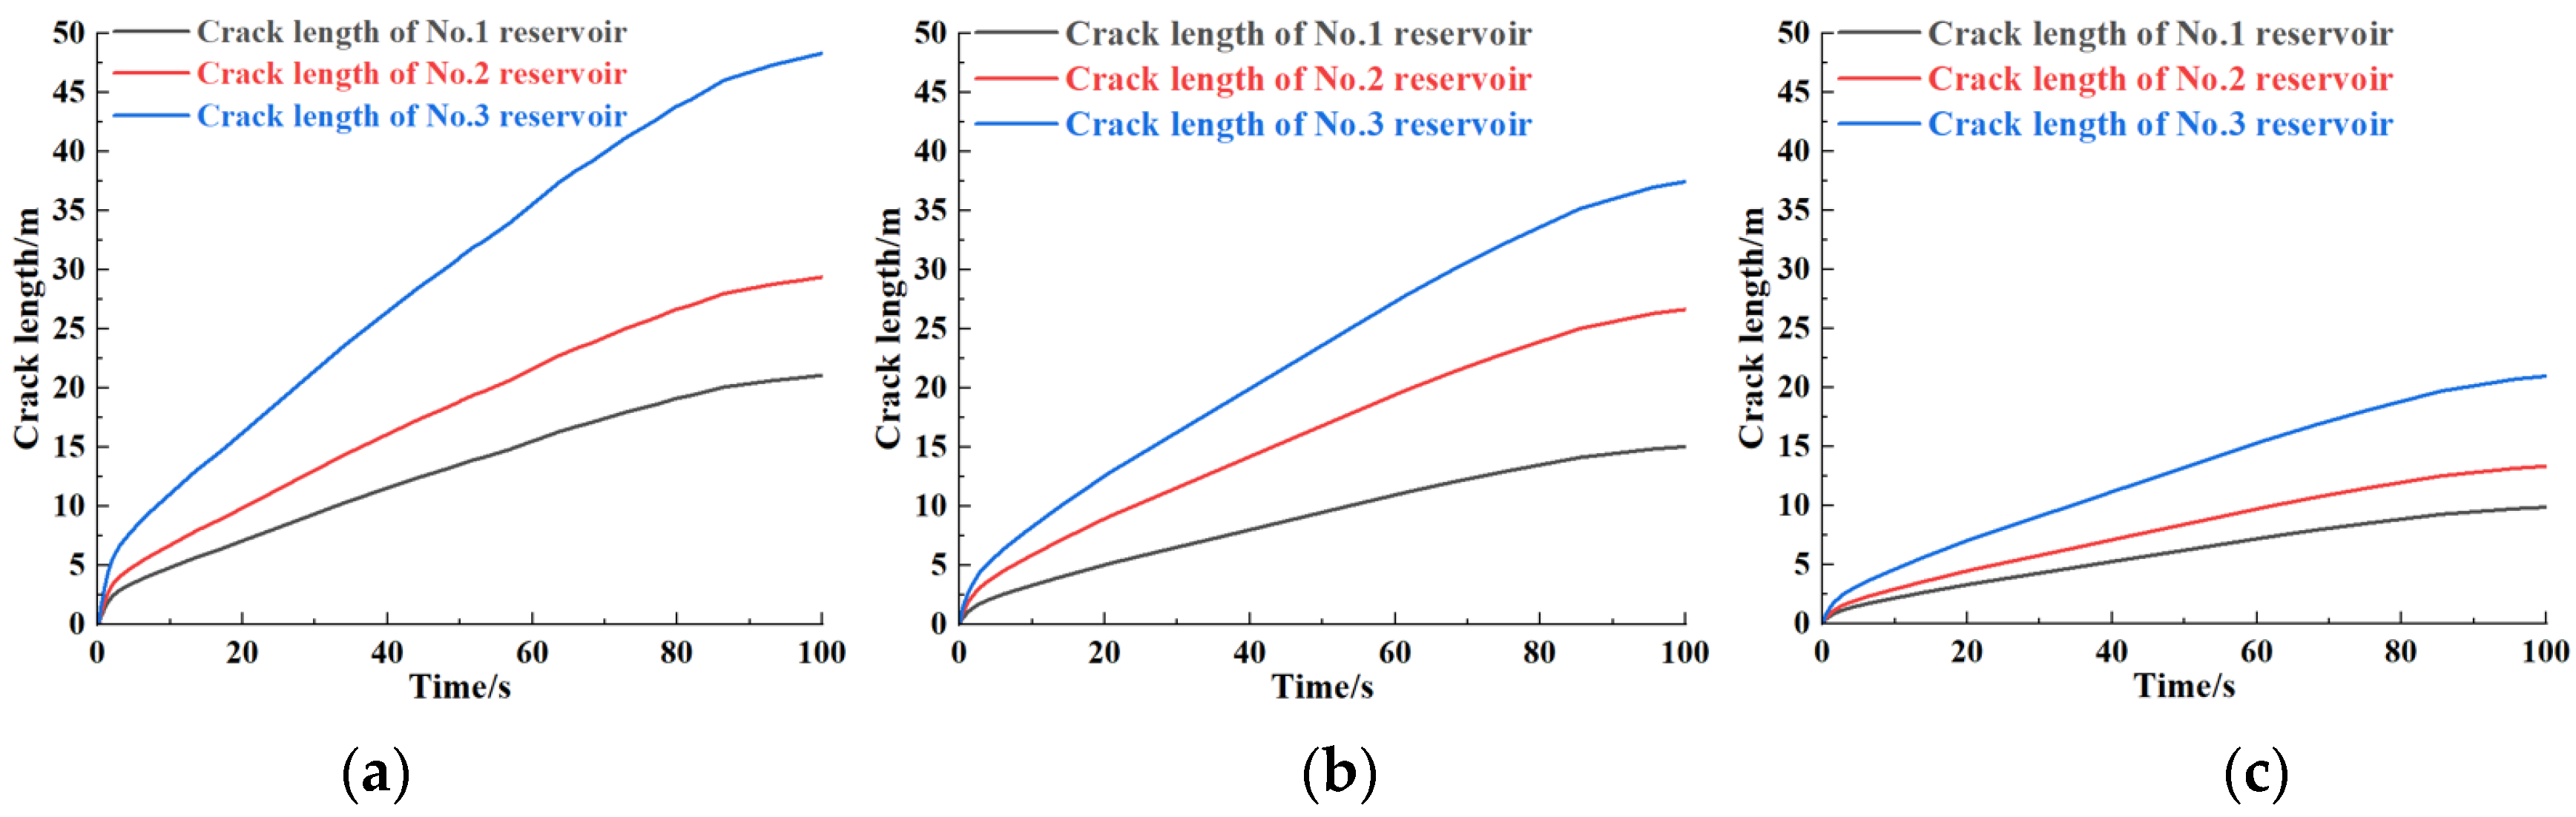
4.2. The Influence of the Different Displacements

Under the conditions of controlling the viscosity and filtration coefficient of the fracturing fluid to remain unchanged, Figure 7 displays a cross-sectional view of the layered fracturing operation completed. It is shown that as the injection displacement of the fracturing fluid increases, the fractures of the unconsolidated sandstone expand in the same direction as the displacement. The length and width of these fractures also gradually increase. Therefore, under the same injection to be perforated, the smaller the thickness of the reservoir, the longer the fracture length.
Figure 8 and Figure 9 show that the fracture length of the first layer in separate layer fracturing increased from 0.0336 m to 0.059 m, the height from 4.086 m to 7.9469 m, and the width from 12.4 m to 25.62 m, respectively. The fracture length, width, and height increased by 106.6%, 75.59%, and 94.49%, respectively. The fracture length of the second layer increased from 0.049 m to 0.0.085 m, the height from 3.63 m to 5.67 m, and the width from 16.6 m to 34.7 m, respectively. The corresponding fracture length, width, and height increased by 109%, 73.46%, and 56.24%, respectively. The fracture length of the third layer increased from 0.089 m to 0.116 m, the fracture height from 2.9516 m to 4.7681 m, and the fracture width from 22.56 m to 48.64 m, respectively, with the fracture length, width and height increasing by 115.6%, 30.33%, and 61.54%, respectively. It can be seen that displacement has a significant effect on fracture propagation. In the field fracturing construction, the pumping equipment and economic factors were comprehensively considered in order to obtain long fractures. Increasing the pumping displacement will be reasonably conducive to opening the formation and help the extension of the fractures in the unconsolidated sandstone formation. When the displacement is greater than 5 m3/min, the second and third reservoirs will be penetrated.

4.3. The Influence of the Different Viscosities

When the displacement of the fracturing fluid is constant, its viscosity increases, and its filtration performance deteriorates as a result. The force of the fracturing fluid on the tip of the fracture height will increase, far exceeding the fracture toughness of the tip of the fracture height. At this time, the fracture height will propagate in the vertical direction, meaning the fracture height will increase. The force of the fracturing fluid within the fracture will increase, causing the fracture to become wider. The pore pressure around the tip of the fracture increases at the same time, making it difficult for the fracture to spread forwards, resulting in the fracture length to decrease. The propagation results of fractures under different viscosities are shown in Figure 10.
As shown in Figure 11 and Figure 12, with the increase in the fracturing fluid’s viscosity, the length of the first layer decreased from 21.06 m to 9.91 m, the height increased from 3.4181 m to 9.6265 m, and the width from 0.048 m to 0.066 m, respectively. The fracture length of the first layer decreased by 52.9%, while the height and width increased by 181.63% and 37.5%, respectively. The length of the second layer also decreased from 29.34 m to 13.35 m, the height increased from 3.703 m to 6.512 m, and the width from 0.056 m to 0.093 m, respectively. The length was found to have reduced by 54.4%, with the width and height having increased by 66.07% and 75.85%, respectively. The length of the third layer decreased from 48.53 m to 21 m, the height increased from 2.56 m to 5.94 m, and the width from 0.078 m to 0.105 m, respectively. The length decreased by 56.7%, while the width and height increased by 34.61% and 132.03%, respectively. Therefore, it can be concluded that if the displacement of the fracturing fluid is constant and the viscosity increases, the filtration loss effect and the filtration loss amount will decrease as a result, and the force of the fracturing fluid on the fracture height tip will increase, far exceeding the fracture toughness of the fracture high tip, meaning the fracture height will increase. When the loss in filtration decreases, the force of the fracturing fluid on the fracture wall increases, causing the fracture width to also increase. As the fracturing fluid is injected, the pore pressure around the crack tip increases, making it difficult for the fracture to propagate forward, resulting in the fracture length to decrease. When the viscosity of the fracturing fluid exceeds 100 mPa·s, the second and third layer reservoirs will be penetrated.

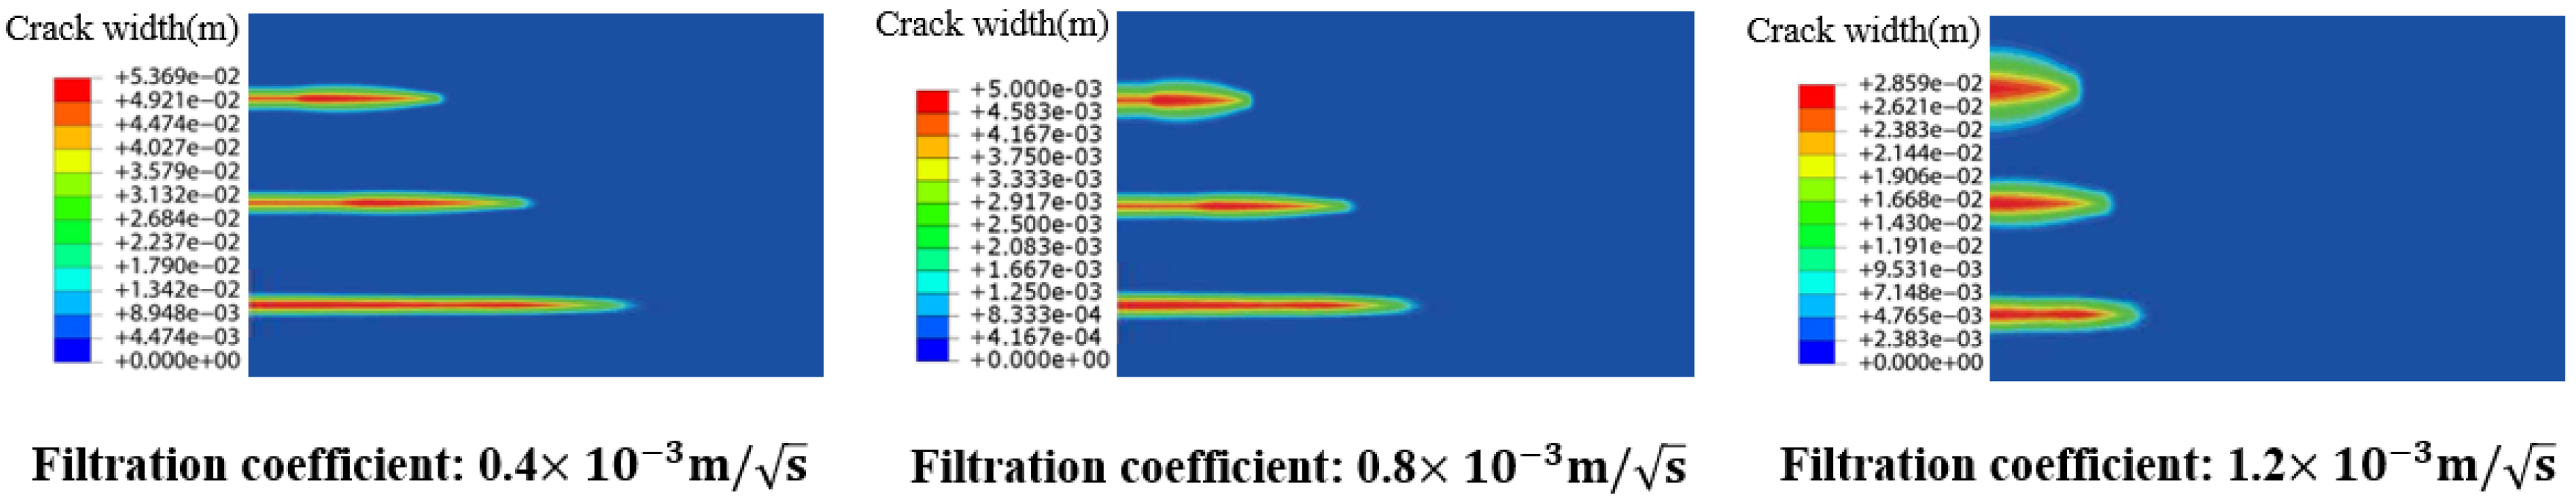
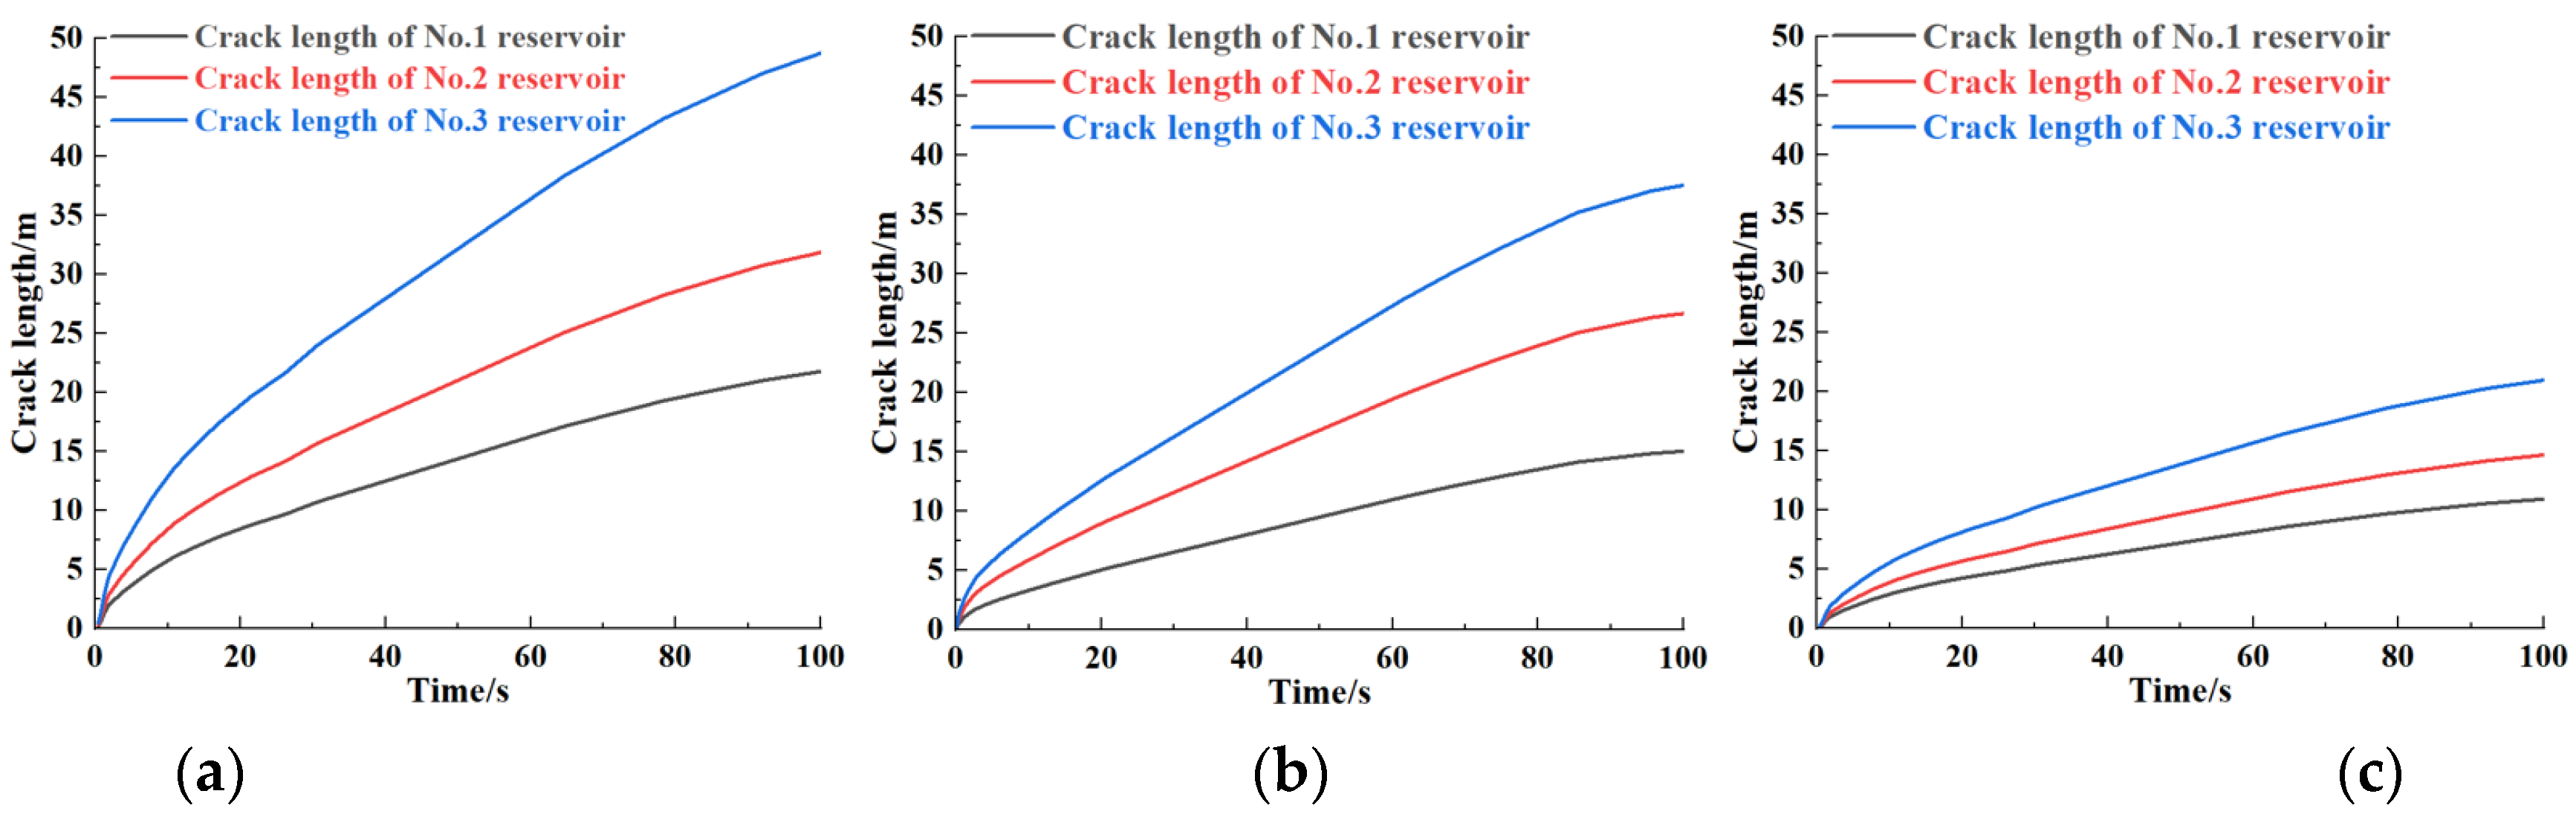
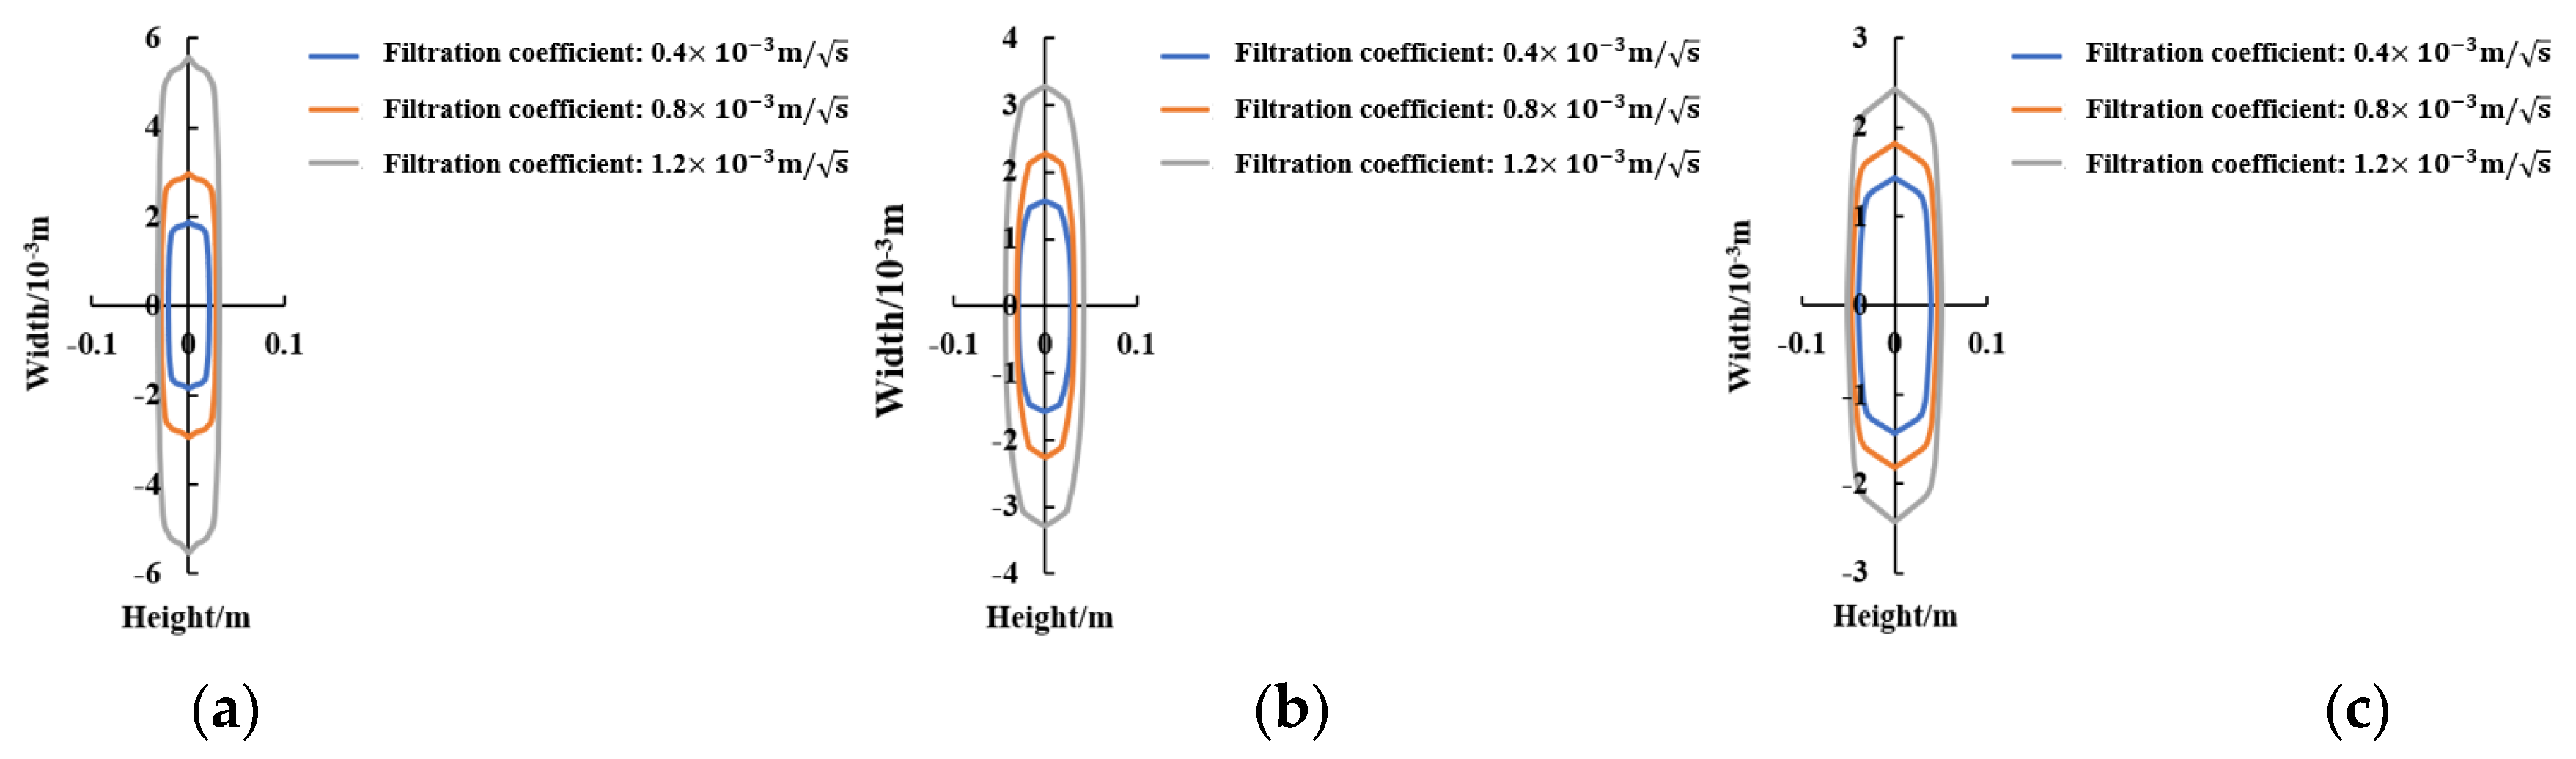
4.4. The Influence of the Different Filtration Coefficients

With the increasing filtration performance of the fracturing fluid, the fracture toughness of the high tip of the fracture thereby becomes smaller. Combined with the infiltration of the fracturing fluid, this makes it easier for the fracture height to expand upwards. At this point, the fracture width will also gradually increase as a result. As the fracturing fluid penetrates into the reservoir through the fracture, the force of the fracturing fluid on the tip of the fracture length decreases and the fracture is difficult to propagate, causing the fracture length to decrease. The propagation results of fractures under different filtration coefficients are shown in Figure 13.
As shown in Figure 14 and Figure 15, the fracture length of the first layer of the layered fracturing decreased from 21.8 m to 10.96 m, the height increased from 3.72 m to 11.1 m, and the width from 0.042 m to 0.063 m, respectively. Meanwhile, the fracture length decreased by 49.7%, and the height and width increased by 212.3% and 50%, respectively. The fracture length of the second layer decreased from 32 m to 14.64 m, the height increased from 3.15 m to 6.55 m, and the width from 0.056 m to 0.093 m, respectively. The fracture length decreased by 54.25%, and the width and height increased by 66.07% and 107.93%, respectively. The fracture length of the third layer decreased from 48.82 m to 20.94 m, the height increased from 2.86 m to 4.84 m, and the width from 0.078 m to 0.102 m, respectively. The fracture length of the third layer decreased by 57.1%, while the width and height increased by 30.76% and 69.23%, respectively. Therefore, it can be concluded that due to its own filtration performance in the process of fracture propagation, and due to the high permeability of the unconsolidated sandstone, liquid will flow into the unconsolidated sandstone, resulting in a greatly reduced fracture propagation speed. Therefore, the higher the filtration coefficient of the fracturing fluid, the shorter the fracture propagation length; conversely, the lower the filtration coefficient, the longer the fracture propagation length. Also, because of the filtration of the fracturing fluid and the penetration of the unconsolidated sandstone, coupled with the effect of the fracturing fluid on the fracture height, the height tip of the fracture will continue to expand, meaning that the higher the filtration coefficient, the further the fracture width and height will gradually increase. When the filtration coefficient is greater than 1.2 × 10⁻³ m/ s , the second and third reservoirs will be penetrated.

5. Discussion

Many scholars have carried out a lot of research on the technology and theory related to the fracturing of the unconsolidated sandstone. By conducting mechanical experiments in unconsolidated sandstone and establishing numerical models based on the modified Cambridge model for experimental research, we have a certain understanding of the mechanisms and laws of hydraulic fracture initiation and extension under layered fracturing. It is different from the fracturing results of the single-layer unconsolidated sandstone reservoirs [44,45]. Under the same layer and thicknesses of the reservoir, the viscosity of the fracturing fluid has a more significant effect on increasing the height and width of the cracks, and the displacement has a more significant effect on improving the length of the cracks. As the displacement of the fracturing fluid increases, the hydraulic fractures propagate in the same direction as the displacement, and the length and width of the fractures gradually increase. Under the same injection displacement, the thickness of the reservoir to be perforated decreases, and the length of the fractures increase. When the displacement of the fracturing fluid remains constant, the filtration performance will deteriorate as the viscosity increases. The filtration loss will decrease, and the seam height will expand vertically and horizontally, resulting in an increase in the seam height and width. The pore pressure around the crack tip will increase, making it difficult for the crack to expand forward, thus reducing the crack length. With the increasing filtration performance of the fracturing fluid, the fracture toughness at the top of the fracture height is smaller when the fracture propagates. With the penetration of the fracturing fluid, the fracture height is easier to expand upwards, and the fracture width will gradually increase. The force exerted by the fracturing fluid penetrating into the reservoir through the crack on the tip of the crack length subsequently decreases. Fractures are difficult to expand forward, and their length will decrease accordingly. However, there are still several issues which require further research:
(1)
The extension of cracks and the settlement law of proppant during the filling and sand removal stages.
The main stages of fracturing and filling completion in the unconsolidated sandstone include fracturing, filling, and sand removal. This paper mainly assessed the initiation and extension laws of fractures during the fracturing and filling stages of layered fracturing. Existing research has also rarely considered the changes in fracture extension, proppant settlement, and fracturing fluid filtration during the filling and sand removal stages. Therefore, further research is needed on the changes in these relevant parameters during the filling and sand removal stages of fracturing and filling completion in unconsolidated sandstones.
(2)
The extension direction of cracks under conditions such as different perforation orientations and in situ stresses.
The three-dimensional geological model established in this article was pre-configured with the cohesive element to simulate the initiation and extension of cracks, and these cracks can only crack along the cohesive element. The preset cohesive element in this paper was perpendicular to the minimum horizontal principal stress direction, which is consistent with the expected crack cracking direction, but the actual perforation orientation was not always along the minimum horizontal principal stress direction, meaning the problem of crack extension direction under the conditions of different perforation orientations and different crustal stress needs further study.

6. Conclusions

(1)
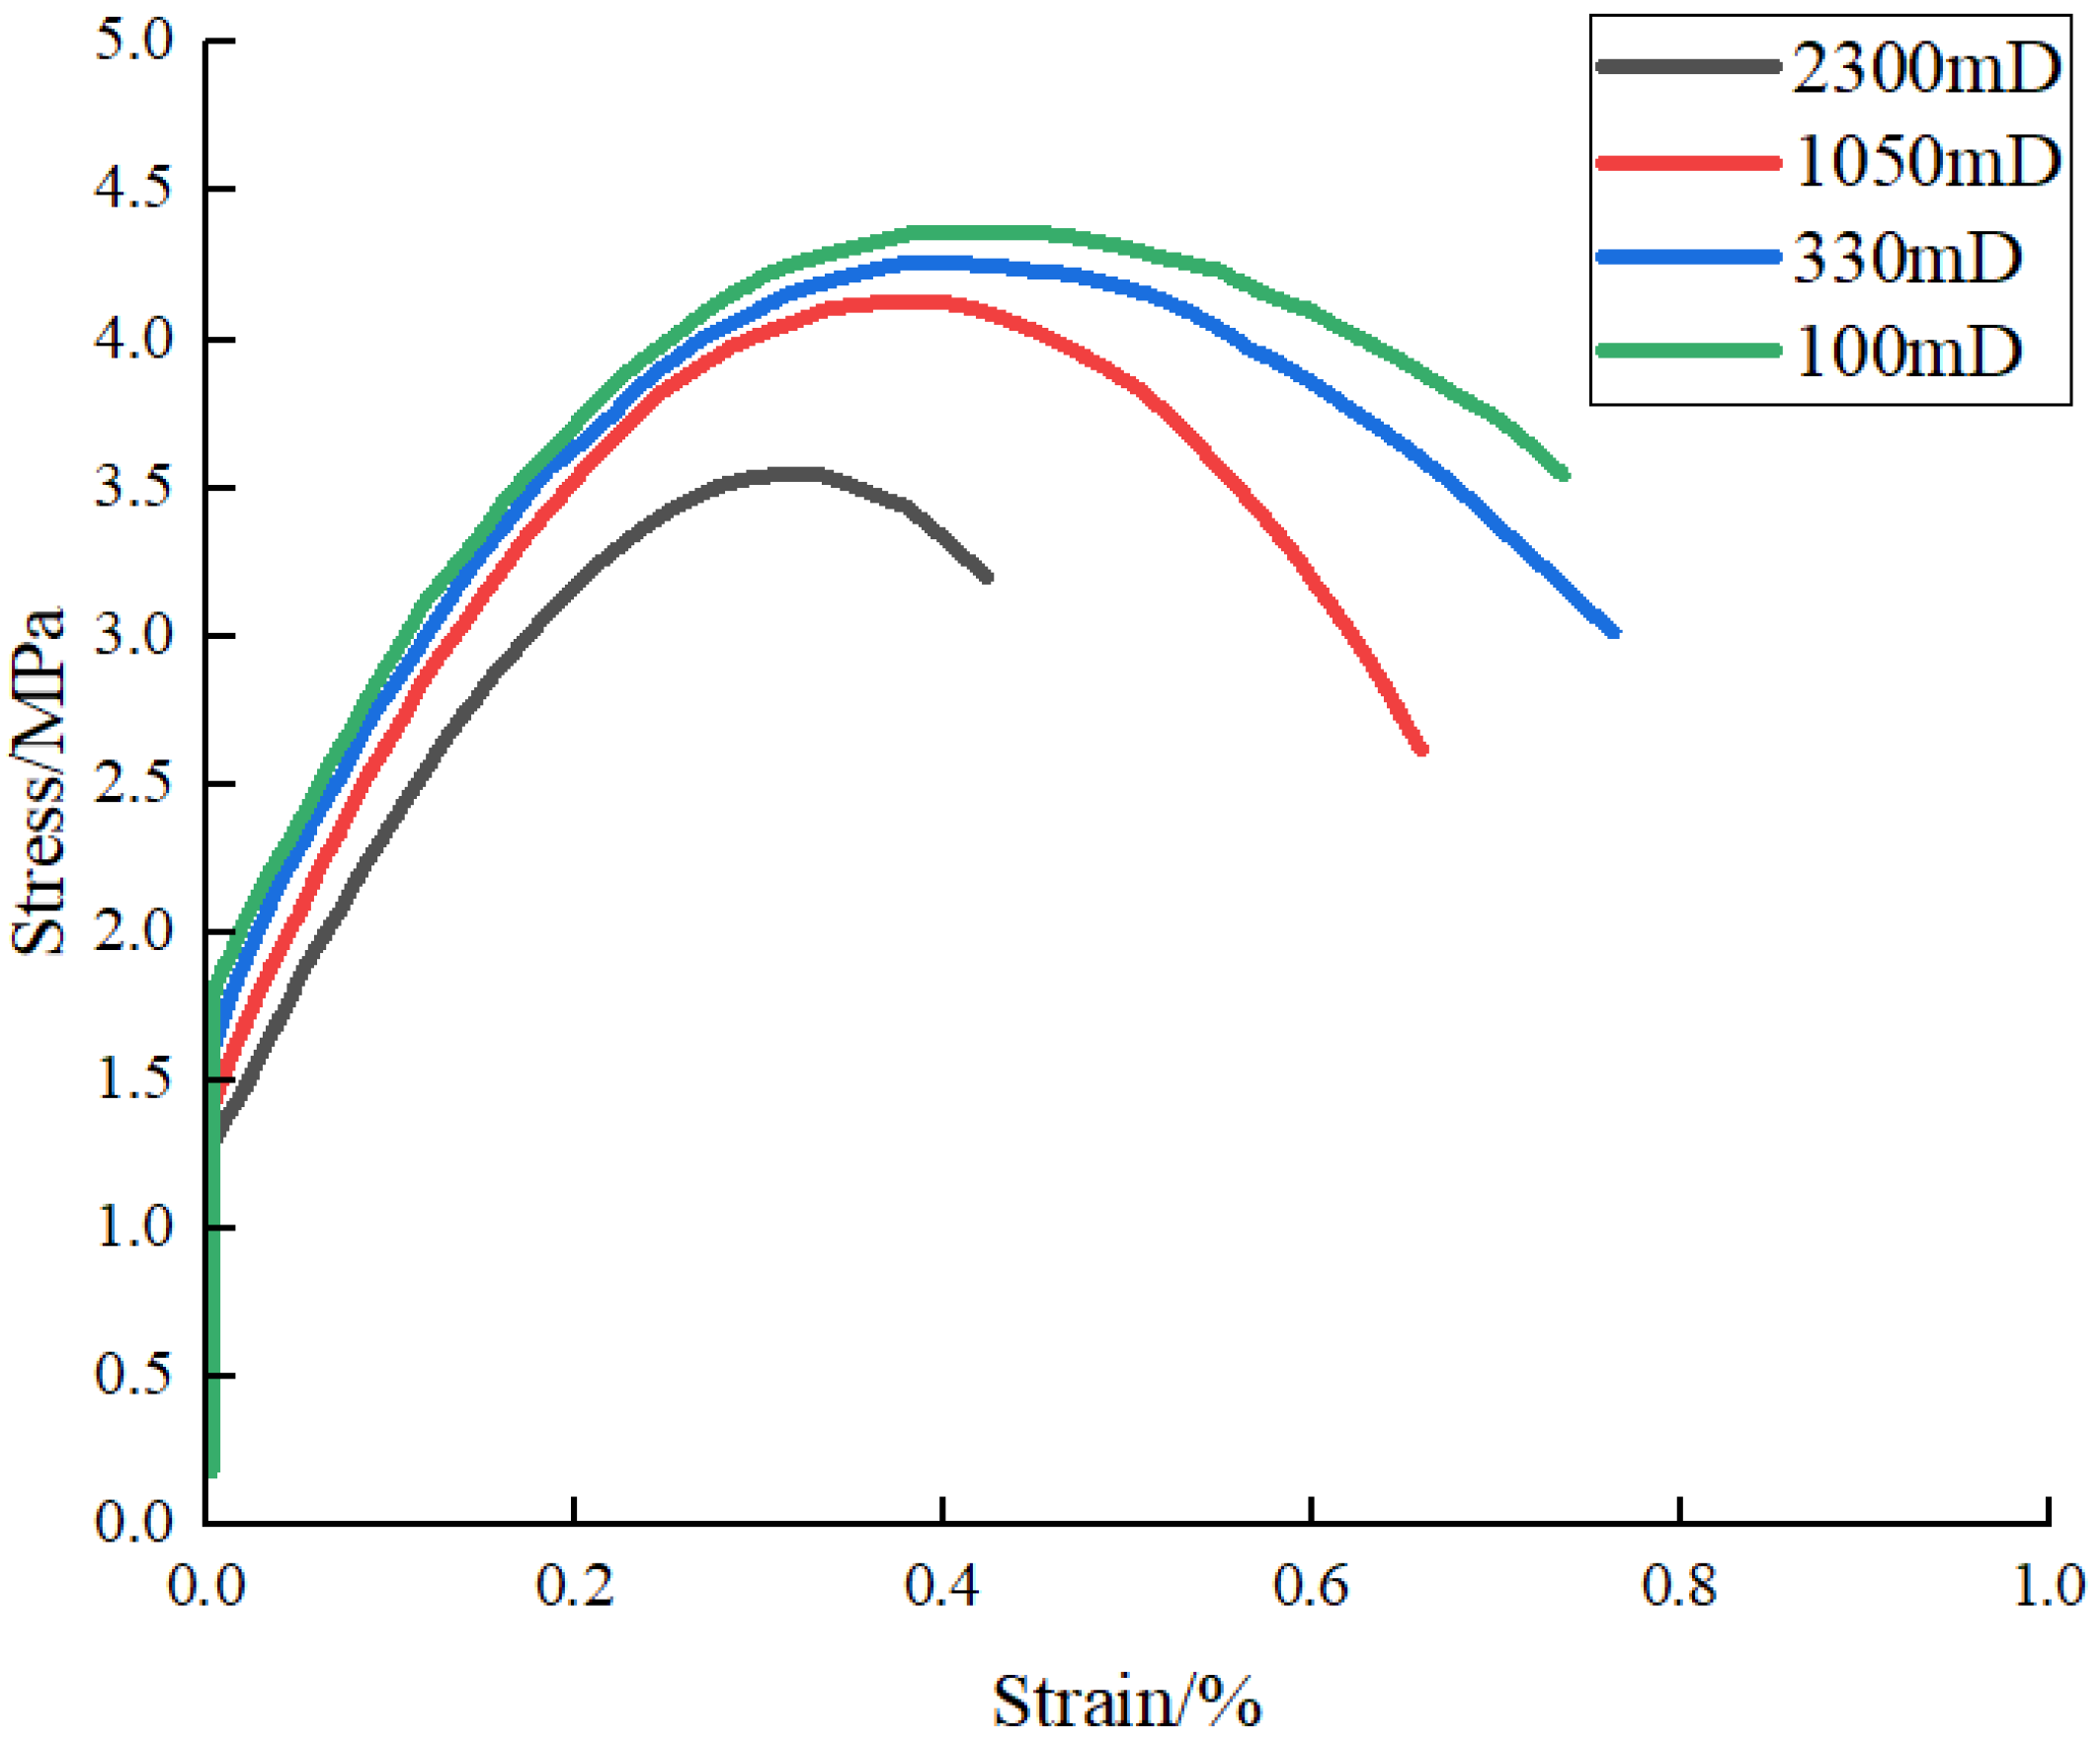
Under different permeability conditions, the compressive strength of the unconsolidated sandstone decreases with the increase in the permeability. Under the same stress conditions, unconsolidated sandstone with a high permeability has a greater strain before fracture pressure;
(2)
This Cambridge model is edited and correcting the error of the non-zero increase in the shear strain. The hardening parameters were used to represent the plastic volumetric strain when the shear stress was zero;
(3)
A three-dimensional numerical model for the separate layer fracturing of the unconsolidated sandstone was established through software. The impact of different construction conditions on hydraulic crack propagation was investigated. Maintaining a fixed fracturing fluid displacement and increasing the viscosity and filtration coefficient of the fracturing fluid, unconsolidated sandstone was found to be more likely to form short and wide cracks. Keeping the viscosity and filtration coefficient of the fracturing fluid unchanged and increasing the displacement resulted in unconsolidated sandstone to be more likely to form long and wide fractures.

Author Contributions

Conceptualization, X.Z.; Methodology, M.X.; Software, J.D.; Validation, D.R.; Investigation, R.L.; Writing—review & editing, Q.R. All authors have read and agreed to the published version of the manuscript.

Funding

This research was funded by the Key Core Technology Research Projects of PetroChina Company Limited grant number (2020B-4911). The APC was funded by the Research Institute of Petroleum Exploration and Development.

Data Availability Statement

The data that support the findings of this study are available from the corresponding author upon reasonable request.

Conflicts of Interest

The authors declare no conflict of interest.

References

  1. Qu, G.Z.; Qu, Z.Q.; Zhu, X.H. Optimal Design of Tip Screenout Fracturing Treatment. Sci. Technol. Eng. 2013, 13, 1602–1605. [Google Scholar]
  2. Zhang, Q.H.; Zhang, S.C.; Huang, X.D. Systemic design for tip screen out frac-pack sand control and its application in Sebei Gasfield. J. China Univ. Pet. (Ed. Nat. Sci.) 2007, 31, 55–59. [Google Scholar]
  3. Suo, Y.; Zhao, Y.J.; Fu, X.F.; He, W.-Y.; Pan, Z.-J. Mixed-mode fracture behavior in deep shale reservoirs under different loading rates and temperatures. Pet. Sci. 2023, in press. [CrossRef]
  4. Suo, Y.; Dong, M.Y.; Wang, Z.J.; Gao, J.H.; Fu, X.F.; Pan, Z.J.; Xie, K.; Qi, T.T.; Wang, G.Z. Characteristics of mixed-mode Ⅰ-Ⅱ fracture of bedding mud shale based on discrete element method. J. Pet. Sci. Eng. 2022, 219, 111135. [Google Scholar] [CrossRef]
  5. Suo, Y.; Su, X.H.; Wang, Z.J.; He, W.; Fu, X.F.; Feng, F.; Pan, Z.J.; Xie, K.; Wang, G.Z. A study of inter-stratum propagation of hydraulic fracture of sandstone-shale interbedded shale oil. Eng. Fract. Mech. 2022, 275, 108858. [Google Scholar] [CrossRef]
  6. Suo, Y.; Su, X.H.; Ye, Q.Y.; Chen, Z.; Feng, F.; Wang, X.; Xie, K. The investigation of impact of temperature on mixed-mode fracture toughness of shale by semi-circular bend test. J. Pet. Sci. Eng. 2022, 217, 110905. [Google Scholar] [CrossRef]
  7. Murdoch, L.C. Hydraulic fracturing of soil during laboratory experiments Part 2. Propagation. Geotechnique 1993, 43, 267–276. [Google Scholar] [CrossRef]
  8. Murdoch, L.C. Hydraulic fracturing of soil during laboratory experiments. Part 1. Methods and observations. Geotechnique 1993, 43, 255–265. [Google Scholar] [CrossRef]
  9. Khodaverdian, M.; Mcelfresh, P. Hydraulic fracturing stimulation in poorly consolidated sand: Mechanisms and consequence. In Proceedings of the SPE Annual Technical Conference, Dallas, TX, USA, 1–4 October 2000. [Google Scholar]
  10. Gil, I.R.; Hart, R.; Roegiers, J.C.; Shimizu, Y. Considerations On Hydraulic Fracturing of Unconsolidated Formations. In Proceedings of the ISRM International Symposium-EUROCK 2005, Brno, Czech Republic, 18–20 May 2005. [Google Scholar]
  11. Gil, I.R. Hydraulic Fracturing of Poorly Consolidated Formations: Considerations on Rock Properties and Failure Mechanisms; The University of Oklahoma: Norman, OK, USA, 2005. [Google Scholar]
  12. Zhang, F.; Damjanac, B.; Huang, H. Coupled discrete element modeling of fluid injection into dense granular media. J. Geophys. Res. Solid Earth 2013, 118, 2703–2722. [Google Scholar] [CrossRef]
  13. Li, W.; Soliman, M.; Han, Y. Microscopic numerical modeling of Thermo-Hydro-Mechanical mechanisms in fluid injection process in unconsolidated formation. J. Pet. Sci. Eng. 2016, 146, 959–970. [Google Scholar] [CrossRef]
  14. Feng, K. Experimental Study on Physical Properties of Unconsolidated Sandstone Reservoir under Different Compaction; Southwest Petroleum University: Chengdu, China, 2014. [Google Scholar]
  15. Khodaverdian, M.F.; Sorop, T.; Postif, J.; Van den Hoek, P. Polymer flooding in unconsolidated-sand formations: Fracturing and geomechanical considerations. SPE Prod. Oper. 2010, 25, 211–222. [Google Scholar] [CrossRef]
  16. Chang, H. Hydraulic Fracturing in Particulate Materials; Georgia Institute of Technology: Atlanta, GA, USA, 2004. [Google Scholar]
  17. Hurt, R.S.; Germanovich, L.N. Parameters Controlling Hydraulic Fracturing and Fracture Tip-Dominated-Leakoff in Unconsolidate Sands. In Proceedings of the SPE Annual Technical Conference and Exhibition, San Antonio, TX, USA, 8–10 October 2012. [Google Scholar]
  18. Germanovich, L.N.; Hurt, R.S.; Ayoub, J.A.; Siebrits, E.; Norman, W.D.; Ispas, I.; Montgomery, C. Experimental Study of Hydraulic Fracturing in Unconsolidated Materials. In Proceedings of the SPE International Symposium and Exhibition on Formation Damage Control, Lafayette, LA, USA, 15–17 February 2012. [Google Scholar]
  19. Golovin, E.; Jasarevic, H.; Chudnovsky, A.; Dudley, J.W.; Wong, G.K. Observation and characterization of hydraulic fracture in cohesionless sand. In Proceedings of the 44th US Rock Mechanics Symposium and 5th US-Canada Rock Mechanics Symposium, Salt Lake City, UT, USA, 27–30 June 2010. [Google Scholar]
  20. Jasarevic, H.; Golovin, E.; Chudnovsky, A.; Dudley, J.W.; Wong, G.K. Observation and modeling of hydraulic fracture initiation in cohesionless sand. In Proceedings of the 44th US Rock Mechanics Symposium and 5th US-Canada Rock Mechanics Symposium, Salt Lake City, UT, USA, 27–30 June 2010. [Google Scholar]
  21. Golovin, E.; Chudnovsky, A.; Dudley, J.W.; Wong, G.K. Injection rate effects on waterflooding mechanisms and injectivity in cohesionless sand. In Proceedings of the 45th US Rock Mechanics/Geomechanics Symposium, San Francisco, CA, USA, 26–29 June 2011. [Google Scholar]
  22. Olson, J.E.; Holder, J.; Hosseini, M. Soft rock fracturing geometry and failure mode in lab experiments. In Proceedings of the SPE Hydraulic Fracturing Technology Conference, The Woodlands, TX, USA, 24–26 January 2011. [Google Scholar]
  23. Hosseini, S.M. Hydraulic Fracture Mechanism in Unconsolidated Formations. Ph.D. Thesis, University of Texas, Austin, TX, USA, 2012. [Google Scholar]
  24. Wong, R.; Barr Kry, P. Stress-strain response of Cold Lake oil sands. Can. Geotech. J. 1993, 30, 220–235. [Google Scholar] [CrossRef]
  25. Wong, T.F.; Szeto, H.; Zhang, J. Effect of loading path and porosity on the failure mode of porous rocks. Appl. Mech. Rev. 1992, 45, 281–293. [Google Scholar] [CrossRef]
  26. Wong, T.F.; David, C.; Zhu, W. The transition from brittle faulting to cataclastic flow in porous sandstones: Mechanical deformation. J. Geophys. Res. Solid Earth 1997, 102, 3009–3025. [Google Scholar] [CrossRef]
  27. Fjar, E.; Holt, R.M.; Horsrud, P.; Raaen, A.M. Petroleum Related Rock Mechanics; Elsevier: Amsterdam, The Netherlands, 2008. [Google Scholar]
  28. Blyton, C.A.; Gala, D.P.; Sharma, M.M. A Comprehensive Study of Proppant Transport in a Hydraulic Fracture. In Proceedings of the SPE Annual Technical Conference and Exhibition, Houston, TX, USA, 28–30 September 2015. [Google Scholar]
  29. Holcomb, D.J.; Olsson, W.A. Compaction localization and fluid flow. J. Geophys. Res. Solid Earth 2003, 108. [Google Scholar] [CrossRef]
  30. Zoback, M.D. Reservoir Geomechanics; Cambridge University Press: Cambridge, UK, 2010. [Google Scholar]
  31. Charlez, P.A. Rock Mechanics, Volume 1: Theoretical Fundamentals; Editions Technip: Paris, France, 1991. [Google Scholar]
  32. Abou-Sayed, A.; Zaki, K.; Wang, G.; Fanhong, M.; Manoj, S. Fracture propagation and formation disturbance during injection and Frac-Pack operations in soft compacting rocks. In Proceedings of the SPE Annual Technical Conference and Exhibition, Houston, TX, USA, 26–29 September 2004. [Google Scholar]
  33. Cuss, R.J.; Rutter, E.H.; Holloway, R.F. The application of critical state soil mechanics to the mechanical behaviour of porous sandstones. Int. J. Rock Mech. Min. Sci. 2003, 40, 847–862. [Google Scholar] [CrossRef]
  34. Morris, J.P.; Lomov, I.N.; Glenn, L.A. Constitutive model for stress-induced permeability and porosity evolution of Berea sandstone. J. Geophys. Res. Solid Earth 2003, 108. [Google Scholar] [CrossRef]
  35. Crawford, B.R.; Yale, D.P. Constitutive modeling of deformation and permeability: Relationships between critical state and micromechanics. In Proceedings of the SPE/ISRM Rock Mechanics Conference, Irving, TX, USA, 20–23 October 2002. [Google Scholar]
  36. Crawford, B.R.; Gooch, M.J.; Webb, D.W. Textural Controls On Constitutive Behavior In Unconsolidated Sands: Micromechani And Cap Plasticity. In Proceedings of the Gulf Rocks 2004, the 6th North America Rock Mechanics Symposium (NARMS), Houston, TX, USA, 5–9 June 2004. [Google Scholar]
  37. Crawford, B.R.; Webb, D.W.; Searles, K.H. Plastic compaction and anisotropic permeability development in unconsolidated sands with implications for horizontal well performance. In Proceedings of the 42nd US Rock Mechanics Symposium (USRMS), San Francisco, CA, USA, 29 June–2 July 2008. [Google Scholar]
  38. Grueschow, E.R. Yield Cap Constitutive Models for Predicting Compaction Localization in High Porosity Sandstone. Ph.D. Thesis, Northwestern University, Evanston, IL, USA, 2005. [Google Scholar]
  39. Baud, P.; Vajdova, V.; Wong, T.F. Shear-enhanc compaction and strain localization: Inelastic deformation and constitutive modeling of four porous sandstones. J. Geophys. Res. Solid Earth 2006, 111. [Google Scholar] [CrossRef] [Green Version]
  40. Baud, P.; Reuschlé, T.; Ji, Y.; Cheung, C.S.; Wong, T.F. Mechanical compaction and strain localization in Bleurswiller sandstone. J. Geophys. Res. Solid Earth 2015, 120, 6501–6522. [Google Scholar] [CrossRef]
  41. Schofield, A.N.; Wroth, P. Critical State Soil Mechanics; McGraw-Hill: London, UK, 1968; Volume 310. [Google Scholar]
  42. Terzaghi, K. Theory of Consolidation; Wiley Online Library: New York, NY, USA, 1943. [Google Scholar]
  43. Das, M. Advanced Soil Mechanics; CRC Press: Boca Raton, FL, USA, 2013. [Google Scholar]
  44. Verruijt, A. Soil Mechanics; VSSD: Delft, The Netherlands, 2001. [Google Scholar]
  45. Kavvadas, M.; Amorosi, A. A constitutive model for structured soils. Géotechnique 2000, 50, 263–273. [Google Scholar] [CrossRef]
  46. Savvides, A.A.; Papadrakakis, M. A computational study on the uncertainty quantification of failure of clays with a Modified Cam Clay Yield Criterion. SN Appl. Sci. 2021, 3, 659. [Google Scholar] [CrossRef]
Figure 1. Core with different permeabilities.
Sustainability 15 10444 g001
Figure 2. Triaxial test equipment.
Sustainability 15 10444 g002
Figure 3. Stress-strain curves of unconsolidated sandstones with different permeabilities.
Sustainability 15 10444 g003
Figure 4. Undrained stress path.
Sustainability 15 10444 g004
Figure 5. Yield function curve of the modified Cam model.
Sustainability 15 10444 g005
Figure 6. Numerical model of separate layered fracturing.
Sustainability 15 10444 g006
Figure 7. Fracture propagation in separate layered fracturing under different displacements conditions.
Sustainability 15 10444 g007
Figure 8. Fracture length changes in the different reservoirs and different displacement conditions. (a) Displacement: 1 m3/min. (b) Displacement: 3 m3/min. (c) Displacement: 5 m3/min.
Sustainability 15 10444 g008
Figure 9. Fracture height and width changes in the different reservoirs and different displacement conditions. (a) Reservoir No. 1. (b) Reservoir No. 2. (c) Reservoir No. 3.
Sustainability 15 10444 g009
Figure 10. Fracture propagation in separate layered fracturing under different fracturing fluid viscosity conditions.
Sustainability 15 10444 g010
Figure 11. Fracture length changes in the different reservoirs and different viscosity conditions. (a) Viscosity: 20 mPa·s. (b) Viscosity: 100 mPa·s. (c) Viscosity: 200 mPa·s.
Sustainability 15 10444 g011
Figure 12. Fracture height and width changes in the different reservoirs and different viscosity conditions. (a) Reservoir No. 1. (b) Reservoir No. 2. (c) Reservoir No. 3.
Sustainability 15 10444 g012
Figure 13. Fracture propagation in layered fracturing under different filtration coefficient conditions.
Sustainability 15 10444 g013
Figure 14. Fracture length changes in the different reservoirs and different filtration coefficient conditions. (a) Filtration coefficient: 0.4 × 10⁻³ m/ s . (b) Filtration coefficient: 0.8 × 10⁻³ m/ s . (c) Filtration coefficient: 1.2 × 10⁻³ m/ s .
Sustainability 15 10444 g014
Figure 15. Fracture height and width changes in the different reservoirs and different filtration coefficient conditions. (a) Reservoir No. 1. (b) Reservoir No. 2. (c) Reservoir No. 3.
Sustainability 15 10444 g015
Table 1. Model correlation parameters.
Physical and Mechanical Properties of Rock
Rebound curve slope, κ 0.025Slope of isobaric consolidation curve, λ0.1
Slope of critical state line, M 1.2Poisson’s ratio0.25
Over consolidation ratio, OCR1.203Slope of recompression curve, λs0.03
Biot1Upper permeability limit, mD15,000
Table 2. Formation data of well X.
Layer PositionLayer NumberInterval Interpretation of Reservoir LocationThickness (m)Porosity (%)Permeability (10−3 μm2)Water Saturation (%)Argillaceous Content (%)LithologyResult of Interpretation
Top BoundaryBottom Boundary
S2258168248.035.54235.226.81.1\Heavy oil reservoir
S228831834.93.933.23659.344.51.4\Heavy oil reservoir
S230842844.82.833.93577.3361.3\Heavy oil reservoir
Table 3. Reservoir parameter values.
ParameterReservoirInterlayer
Elasticity modulus (Gpa)58
Poisson’s ratio0.250.3
Permeability (mD)15001000
Horizontal minimum principal stress (Mpa)1214
Horizontal maximum principal stress (Mpa)1717
Vertical stress (Mpa)2222
Pore ratio0.350.35
Tensile strength (Mpa)0.20.2
Fracture energy (J/m2)100300
Filtration   coefficient   ( 10 3 m / s )0.80.8
Fracturing fluid viscosity (mPa·s)20–200-
Displacement (m3/min)1–3-
Disclaimer/Publisher’s Note: The statements, opinions and data contained in all publications are solely those of the individual author(s) and contributor(s) and not of MDPI and/or the editor(s). MDPI and/or the editor(s) disclaim responsibility for any injury to people or property resulting from any ideas, methods, instructions or products referred to in the content.

