1. Introduction
Mathematical culture is an essential part of general culture. Kurina in [
1] explains the concept of mathematical culture as follows:
The term mathematical culture’ cannot be naturally defined; we will understand it in the same way as ‘good mathematics’ is understood by [
2], i.e., good ways of solving mathematical issues, good mathematical techniques, good mathematical applications and cultivating of mathematical insight, creativity and beauty of mathematics. Cultivation of a mathematical culture means teaching how to see the roots of mathematics in reality (in nature, in society, but also in mathematics itself), getting to know the world of mathematical concepts, understanding this world and being able to apply it in a cultivated and correct way when solving various problems.
Developing a mathematical culture means developing the ability to get oriented in mathematical concepts, to understand their essence and to see them and to be able to use them in mutual contexts. That means, to develop a mathematical way of thinking by using abstraction and generalization.
Mathematics as a school subject has long-term beneficial effects on the life of students, supporting long-term learning [
3] and positively impacting their socioeconomic status [
4]. It is, thus, of essence to promote increasingly efficient means of understanding mathematical concepts to perpetuate mathematical knowledge and thinking in an inclusive manner, helping those with weaker mathematical abilities [
5] and promoting discovery learning [
6] using digital tools to visualise mathematical proofs.
The article discusses a possible way of cultivating students’ mathematical thinking through increasing their understanding of mathematical proofs presented within the Graph Theory course. The text presents our research which explored the process of teaching mathematical proofs with a support of visual tools.
Based on the reviewed literature, we can clearly infer that mathematical culture is a vital part of “quality education”, which represent the fourth sustainable developmental goal (SDG), of the 17 SDGs set by UN to transform the world [
7].
2. Literature
2.1. Mathematical Proof
Mathematical proof has been considered an essential part of mathematical science. The strictly defined notion of mathematical proof clearly separates mathematics from the spectrum of other scientific disciplines. Mathematical proof, unlike proofs in other fields, is fundamentally unquestionable. [
8]
A mathematical proof can be understood and defined in the following ways:
‘A mathematical theorem is a proposition, a mathematical proof is clearly in some sense a collection or pattern of propositions’ [
9].
Kitcher [
10] gave the following definition:
We can define a proof as a sequence of statements such that every member of the sequence is either a basic a priori statement or a statement which follows from previous members of the sequence in accordance with some apriority-preserving rule of inference.
Hanna [
11] (p. 6) claimed:
A formal proof of a given sentence is a finite sequence of sentences such that the first sentence is an axiom, each of the following sentences is either an axiom or has been derived from preceding sentences by applying rules of inference, and the last sentence is the one to be proved.
‘A proof of a mathematical theorem is a sequence of steps which leads to the desired conclusion’ [
12].
2.2. Graph Theory Education
Biggs et al. [
13] (p. 1) described the origins of graph theory as follow:
The origins of graph theory are humble, even frivolous. Whereas many branches of mathematics were motivated by fundamental problems of calculation, motion and measurement, the problems which led to the development of graph theory were often a little more than puzzles, designed to test ingenuity rather than stimulate the imagination. However, despite the apparent triviality of such puzzles, they captured the interest of mathematicians, the result of which being that graph theory has become a subject rich in theoretical results of surprising variety and depth.
Teaching methods are always a subject of extensive discussions. Teachers look for different ways how to clarify a particular issue to students, see, e.g., recent papers by Morris and Rohs [
14], Fussell and Truong [
15] and Yohannes and Chen [
16].
Demonstration and visualization make the subject much clearer and more comprehensible [
17,
18,
19,
20,
21]. Teaching/learning model using suitable visual tools represents one of the sustainable trends to develop, pay attention and interest to [
22].
In subjects dealing with graph theory there is no problem in illustrating the needed concepts and algorithms using graphs. However, it is very important to prepare suitable illustrative graphs and also to have a tool which can highlight and emphasize properties of and relationships between the discussed concepts.
At our university, for several years we have been using as such a tool, the GrAlg program, which one of our students had created within the framework of the thesis [
23] in the Delphi 5 environment. The program reflected students’ needs and was designed on the script of the first author of this article. The program enables the user to create appropriate graphs, to work with them (moving, colouring vertices, edges, etc.) and to open more than one window so that more objects can be discussed and compared at one time. The program also enables a step-by-step visualization of the process of the presented graph algorithms on the created graphs, and it enables comparisons of differences between them. Teachers use the program as a suitable supplement in their lectures and in the process of preparing study materials for students; the program is available to students as a useful tool to practise a subject matter and prepare presentations of assigned tasks.
2.3. Visual Represantion of Proof
To enable students to come to in-depth understanding of a given problem and understanding of processes that solve the problem, it is necessary to pay close attention to the theory related to the problem, including a thorough analysis of the relevant theorems and their proofs. Senk claims that ‘proof writing has been perceived as one of the most difficult topics for students to learn’ [
24] (p. 448), and our experience has made us fully agree with this opinion. The issue of proving theorems is one of the scariest topics for our students. Proofs are perceived as a highly abstract issue; and our students attending the Graph Theory course have expressed their demands for better visual presentation of the proofs so that they can better and more deeply understand their concept.
The proof visualization, or in other words “proof without words”, appeared already in the deep past. A nice example of a static visual proof and also of evidence of a high level of mathematical culture achieved by the Greek civilization can be seen, for example, in the article The Binomial Theorem and a Silver Stater from Aegina [
25].
New technology development and subsequent introduction of computers into our learning environment resulted in creating new applications, visualization software and multimedia interactive tools enabling dynamic visualizations. Good experience with the GrAlg program and knowledge of the fact that ‘pictures often play a crucial role in logical demonstration’ [
26] (p. 1257), resulted in the authors of the article´s idea to create a similar visual tool to help students within the Graph Theory course to better understand the abstraction of the discussed process of mathematical proofs.
The impact and the effectiveness of visualization in teaching mathematical proofs has been of interest to many experts for numerous years. However, in the sphere of graph theory there is hardly any evidence of such a kind of research. This effect has been investigated mostly in geometry. The reason for this situation can be the existence of several kinds of dynamic geometry software suitable for conducting proofs in this field. A few pedagogical experiments related to teaching geometry are mentioned below.
Marrades and Gutierez [
27] dealt with teaching geometry at high schools, and investigated whether the use of dynamic geometry could facilitate students’ transition from experimental work with mathematical objects to formal deductive proof. Their study found that teaching geometry in a dynamic computer environment helped students to better understand the abstraction of the rationale of the discovered relationships.
Gawlick [
28] examined the effect of dynamic geometry on discovering, testing and proving hypotheses, and, on one hand, he found that students working with dynamic geometry did not perform better in terms of knowledge and skills, but, on the other hand, they were more successful in solving tasks on discovering relationships between geometric objects. He claimed that dynamic geometry supported developing hypotheses, but not their verification.
Baccaglini-Frank and Mariotti [
29] investigated students’ cognitive processes in solving open problems in the form of construction problems using dynamic geometry. Based on observations of students’ work and on interviews with them, they concluded that dynamic geometry supported inductive ways of thinking and developed students´ specific form of argumentation.
Erbas and Aydogan-Yenmez [
30] investigated the effects of using the DGE dynamic geometry environment with sixth-grade students. The performance of the students in the experimental group, who used DGE in geometry lessons, was better than the performance of the students in the control group, who did not use that environment. In addition, the students in the experimental group showed more interest in the subject matter, and their comments on and their interpretations of the problem were more accurate.
Two visualization tools were created with the purpose of supporting the formal expression of mathematical proofs of the theorems discussed during the teaching process. Then research was carried out to answer the research question whether the visual tools help to increase students´ understanding of proofs. This research is discussed in this paper.
3. Method
The purpose of the presented research is to explore the process of teaching mathematical proofs in the field of graph theory with help of visual tools and to answer the following research questions:
Might visual representation which supports the explanation of mathematical proofs within the course in graph theory increase students´ understanding of these proofs?
Might visual representation which supports the explanation of mathematical proofs within the course in graph theory improve the attitude to the perception of the importance of performing mathematical proofs?
The research was carried out during the period of 2016–2019 and focused on Czech university students attending the Graph Theory course. It was conducted as a quasi-experiment based on a pre-test, treatment and post-test design. The pre-test and post-test phases were carried out with the help of tests determining the level of mathematical logic knowledge. Visual application was applied in the treatment phase.
To investigate the impact of visual tools on the students’ understanding of theorems and of their proofs, qualitative and quantitative methods and the following research treatment were used:
Pre-test and post-test (see chapter Materials);
Students’ essay (see chapters Procedure and Projects and Significance of proofs);
Students’ projects (see chapters Procedure and Final projects and interviewing the students);
Students’ interview (see chapters Procedure and Final projects and interviewing the students).
4. Research Objectives
The objective of the research was to investigate and analyse the impact of visual tools on the level of understanding theorems and their proofs taught within the Graph Theory course and the impact on perception of their importance.
Sub-objectives were:
Quantitative analysis of study success in the field of predicate logic;
Quantitative analysis of mathematical proof comprehension;
Qualitative analysis of students’ perception of the proofs and of the proving process significance.
Considering the two first research sub-objectives, the following null hypotheses were proposed:
Hlogic: Study success in predicate logic does not depend on implementing visual tools in the teaching process.
Hproof: Study success in proofs does not depend on implementing visual tools in the teaching process.
Hlogic+proof: Study success in predicate logic + proofs does not depend on implementing visual tools in the teaching process.
The study success rate in each field was determined as the difference between the post-test and pre-test results.
5. Participants
The research participants were 201 students of information technology study programs at the Faculty of Informatics at University of Hradec Kralove enrolled in the Graph Theory course in academic years 2016/17 to 2018/19, i.e., in the years before COVID-19, when teaching was conducted in the traditional way in classrooms. The research was processed in line with the ethical code of the University of Hradec Kralove, Hradec Kralove, Czech Republic. Informed consent was obtained prior to the data collection from all the individuals involved.
6. Materials
Before starting the research, a pre-test and post-test was set up to determine the students’ level of knowledge of mathematical logic. The pre-test was based on those issues from the sphere of predicate logic which students were already aware of because they had studied them before (at high school and in courses dealing with the basics of mathematics in the first year of university). The post-test included questions related to the correct understanding of basic types of proofs (direct proofs, proofs by contraposition, proofs by contradiction, proofs by induction) and the procedures used in proving of theorems discussed in courses in graph theory. The overall structure of the tests (the number (16) and types of questions (see
Appendix A), the assessment (0–1)) was exactly the same. The questions in the pre-tests asked about the basics of mathematics, and the questions in the post-tests asked about the graph theory), see
Appendix A.
The content validity of the tests had been performed by competent experts. The reliability of the tests had been verified by the half-split method using the Spearman–Brown Formula (reliability coefficient of the pre-test rSB = 0.82, post-test rSB = 0.81).
The following visualization tools were created with the purpose of supporting the formal expression of mathematical proofs of the theorems discussed during the teaching process: In the first year of the research, GTPVis (Graph Theory Proofs Visualization) application was created by the authors of this text using MS PowerPoint. In the second year of the research, the Microsoft Visual Studio Code editor was used, and based on GTPVis application, a sophisticated multi-media application called GraProofVis was created to visualize individual proofs. GraProofVis application was designed by two senior students who had already completed the course in graph theory and had extensive experience in creating multimedia software. They added a modern user-friendly design appealing to the young generation. The applications are intended both for teachers (as a suitable supplement clearly illustrating the course of proofs discussed during their lectures) and for students (helping them to practise the discussed issues during their self-study).
7. GTPVis Application
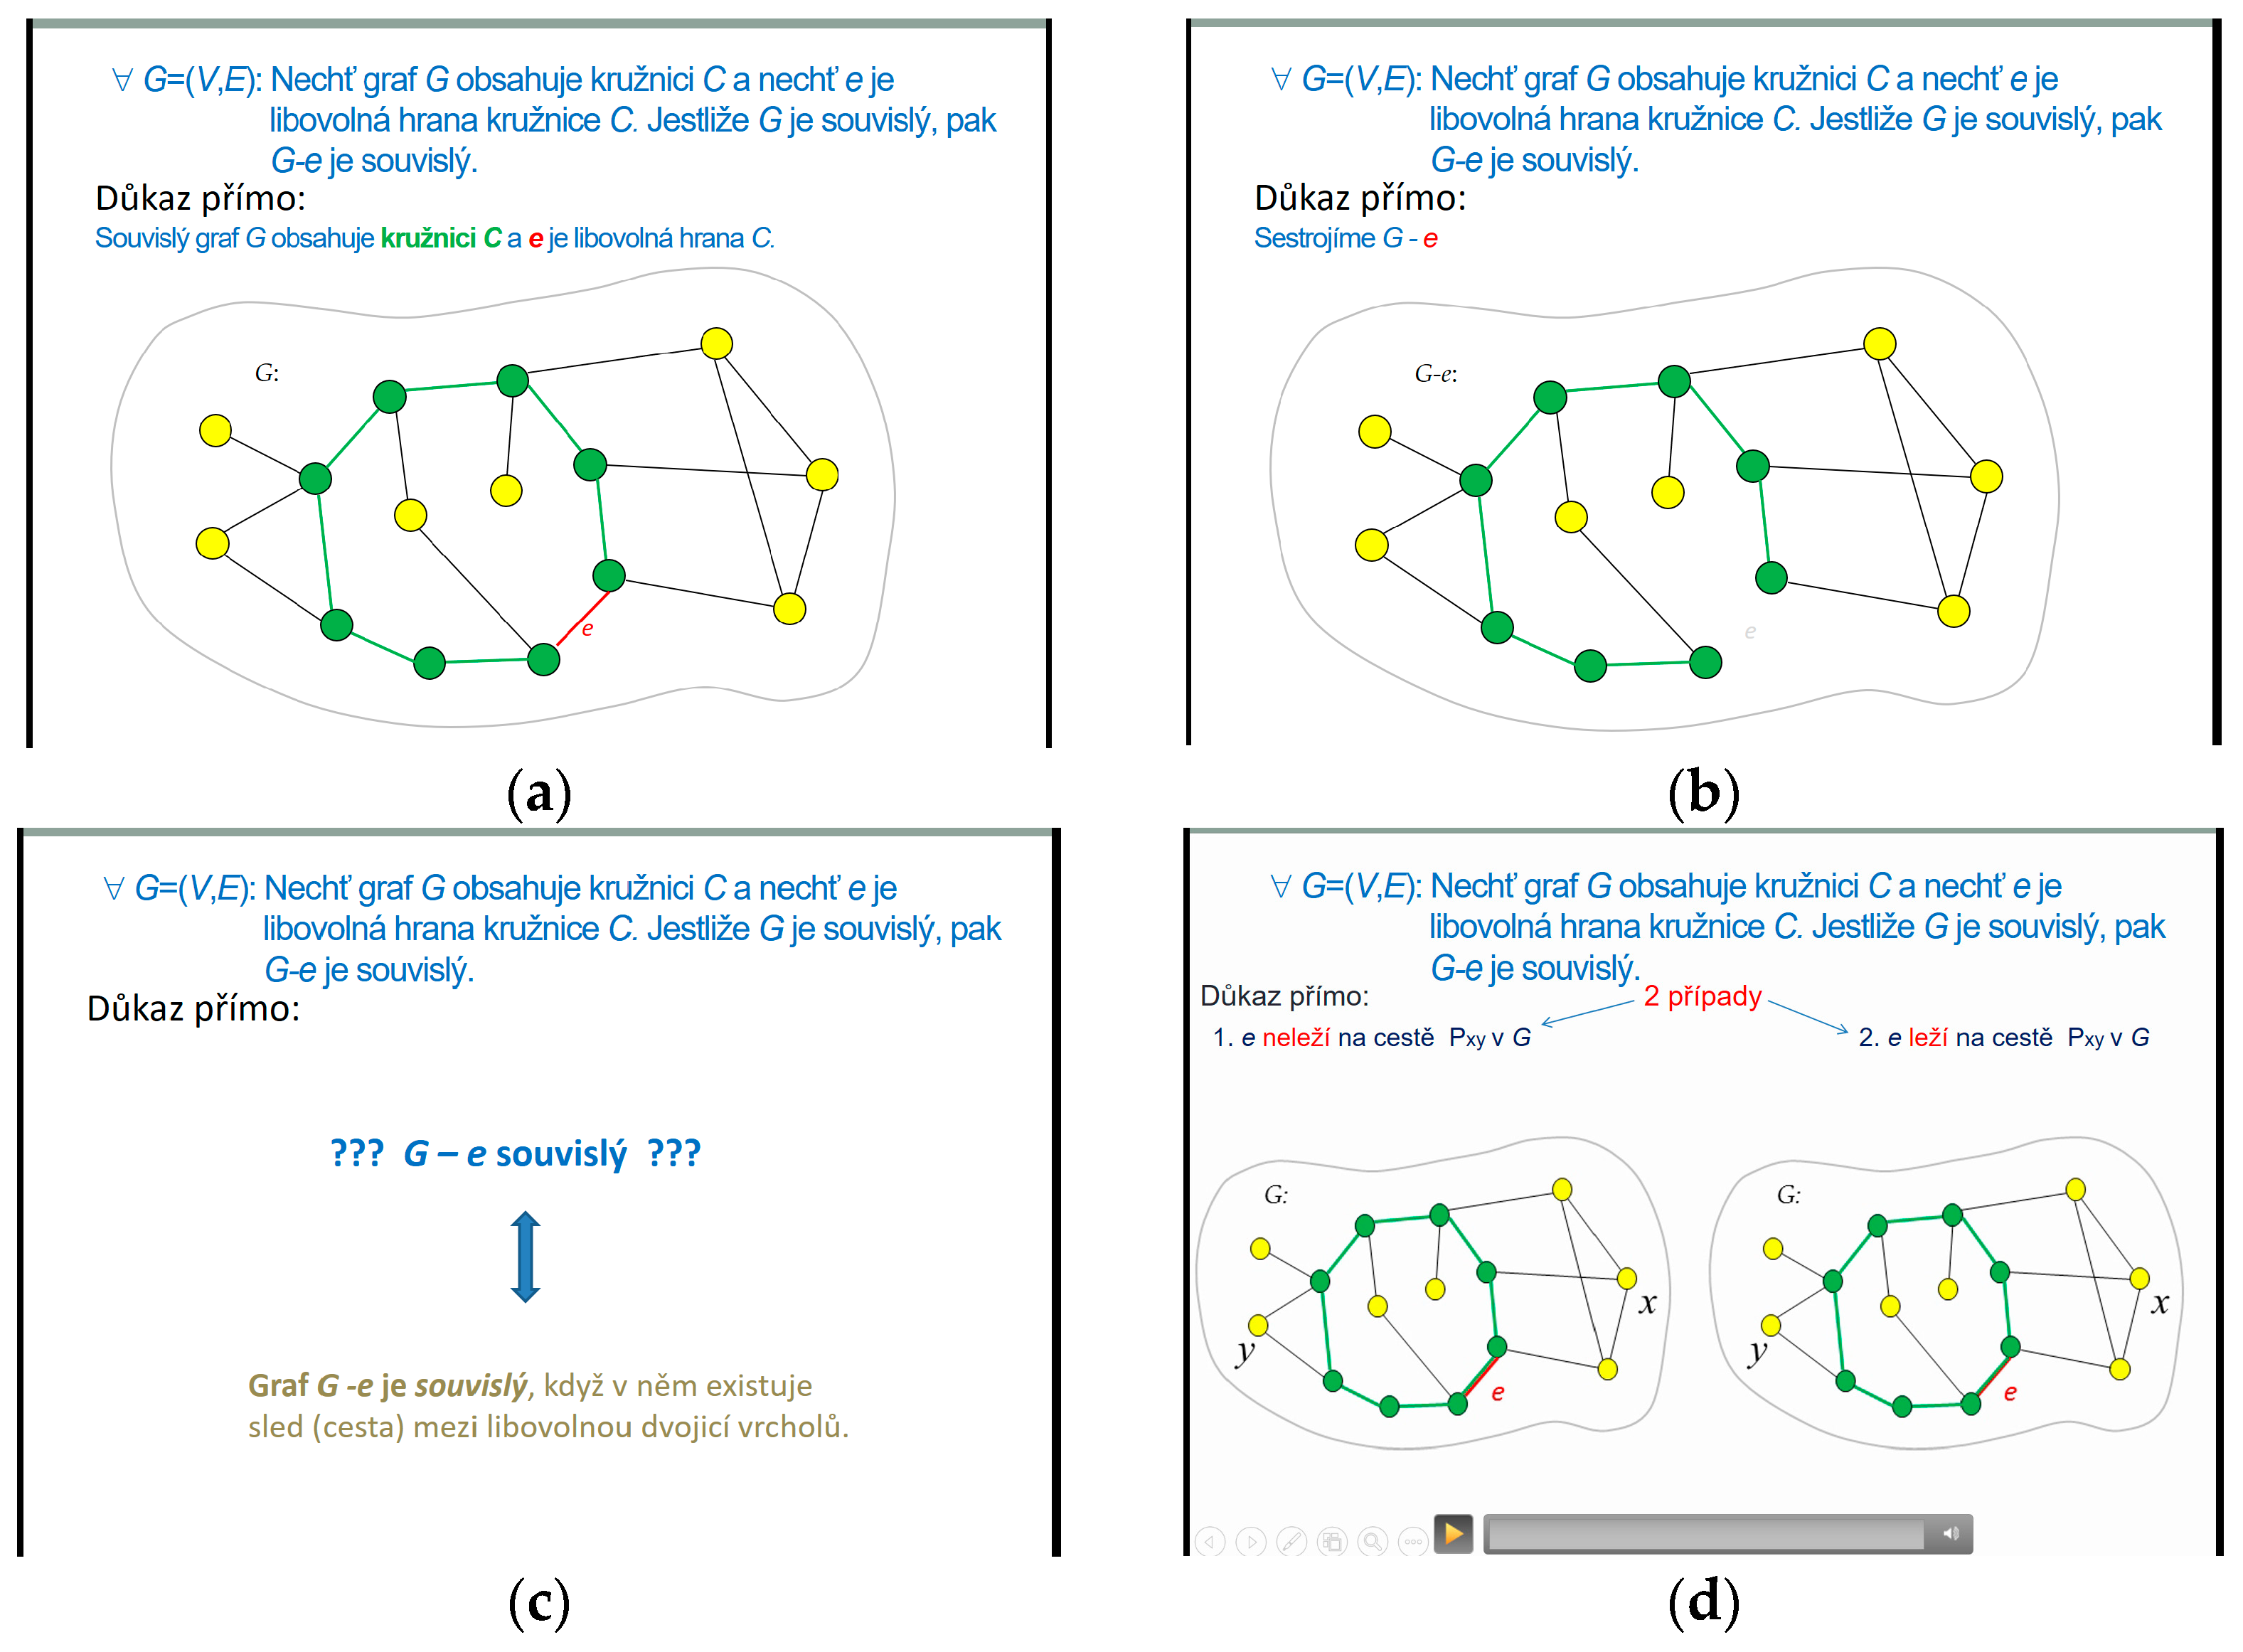
This application contains simple dynamic visualizations with the help of which the whole process of mathematical proofs of theorems discussed in the Graph Theory course is supported. Mutual relationships between the individual sequentially proven steps of the proof are highlighted using colours and arrows going from the already proven appropriate part of the proof to the part currently being proven. The individual steps of proving are usually accompanied by the visualization of the relevant graphic objects related to the step being proven. The dynamics of visualization is achieved by a quick projection of a series of static images or by using video recordings prepared in MS PowerPoint, see
Appendix B,
Figure A1.
8. GraProofVis Application
The essential element of the application is a window divided into two parts, see
Appendix B,
Figure A2. In the left part, a formal record of the proof is presented; in the right part, the individual steps of the proof are visualized. The whole course of the proof can be controlled by the toolbar button located below the visualization. If necessary, it is possible to go back, repeat a specific step of the animation. Or, conversely, it is possible to go faster through the obvious part of the proof. During the teaching process, the teacher can supplement the interpretation of the proof with drawing directly in the visualization with a pen; the teacher can also mark/emphasize/add other elements and then, if needed, delete them.
In the application, a window containing definitions of the given terms is available. Furthermore, a ‘Types of proofs’ menu is available. It contains an overview of the procedures used in each type of the proof (direct proof, proof by contraposition, proof by contradiction and proof by induction).
9. Procedure
The research was realized within the Graph Theory course. This course is a compulsory course scheduled in the summer semester of the second grade of the computer science study program. It is a 13-week long course. This course concurs the Basics of Mathematics course.
The students were divided into three groups (Phases), see
Table 1, according to the academic year in which they attended the course:
The research was conducted as a pedagogical experiment due to the fact that the presentation of proofs of theorems is conducted within the framework of lectures offered to all students. The teaching process was carried out in three phases, always under the guidance of the same teacher/lecturer and in the same scope and contents of the curriculum. The difference was only in the use or non-use of the above-mentioned visual aids.
Phase 1—teaching proofs presented in the traditional way without visual aids;
Phase 2—teaching proofs supported by GTPVis application;
Phase 3—teaching proofs supported by GraProofVis application.
In each phase, the students completed the pre-test in the 1st week of the semester, and the post-test in the 13th week of the semester.
The IBM SPSS Statistics Software and the MS Excel 2016 were used to statistically analyse the collected data.
The Kolmogorov–Smirnov test was used to test the normality. The Kruskal–Wallis test was used to test the hypotheses. To determine in which groups statistically significant differences appear, post hoc tests with Bonferonni correction were used.
In order to be able to analyse the students’ attitude to the significance of proofs and to the proving process, we asked the students to write essays at the end of the semester. In their essays, the students were required to write a few sentences concerning their approach to proofs and visualizations, make comments on the problems they had sorted out while working on their projects, and express their points of view concerning the importance of mathematical proofs. This essay writing was voluntary. Out of the total number of 201 students involved in the research, 145 students submitted essays (36 students in Phase 1, 49 students in Phase 2 and 60 students in Phase 3).
During the course, students in each phase were divided into groups of two to four members. Each group worked on their final project—a visualization of the proof of a simple proposition from the field of graph theory. The students chose the propositions to prove from those offered by the teacher who had elaborated them in advance. The final projects were presented and commented on by the teacher and other students in the 12th week of the semester.
After their presentations, the students were shortly interviewed by the teacher. They were asked whether they had enjoyed the work on the final projects, in which ways they participated in the process, and how the creation of the assigned presentation of the chosen proof was beneficial for them.
10. Research Results
Based on the Kolmogorov–Smirnov test (the significance level p < 0.05), it was revealed that not all the monitored data (pre-tests and study success rate in predicate logic, proofs, predicate logic + proofs) had a normal distribution in all three Phases. That is why the Kruskal–Wallis non-parametric test was used to process other results.
The Kruskal–Wallis test (
p < 0.05) results showed that the requirements for the entry condition had been met, i.e., the level of students´ knowledge in pre-tests was comparable in all research fields (predicate logic
p = 0.642, proofs
p = 0.743, predicate logic + proofs
p = 0.734), see
Table 2.
11. Hypothesis Testing
To test the monitored data, the Kruskal–Wallis test (non-parametric test because the data did not have a normal distribution in all three Phases) was used. According to the significance level
p < 0.05, the results of the Kruskal–Wallis test (
p = 0.001, see
Table 3) show that the study success rate in predicate logic in Phases 1 to 3 varies. From the post hoc Bonferroni correction test with the significance level
p < 0.05 (see
Table 4), it can be seen that there is a statistically significant difference between Phase 1 and Phase 2 (
p = 0.027) and between Phases 1 and Phase 3 (
p = 0.001). There is no statistically significant difference between Phase 2 and Phase 3 (
p = 0.886). Hence, students who had used visual tools in their courses (Phase 2 and Phase 3) achieved greater study success in the field of predicate logic than Phase 1 students who had not used them. Furthermore, the effectiveness of the teaching process in which GPTVis application was used (Phase 2) is comparable to that one in which the visual instruction supported by the GraProofVis application was used (Phase 3).
Similar results were found in the study success in mathematical proofs comprehension. Based on the results (
p < 0.001, see
Table 5) of the Kruskal–Wallis test with the significance level
p < 0.05, we can conclude that the results of the study success in mathematical proofs in Phase 1 differs from the results in Phase 2 and Phase 3. The post hoc Bonferroni correction test with the significance level
p < 0.05 reveals (see
Table 6) that that there is statistically significant difference between Phase 1 and Phase 2 (
p = 0.009) and between Phases 1 and Phase 3 (
p < 0.001). The same result as in the field of predicate logic was obtained also in the field of proof teaching in relation to the use of the application GPTVis in Phase 2 and GraProofVis application in Phase 3 (
p = 0.295, see
Table 6), therefore there is no statistically significant difference between Phase 2 and Phase 3. Hence, students in Phase 2 and Phase 3 achieved a higher study success in the domain of proof teaching compared to students in Phase 1.
Based on the previous two measurements, it was assumed that similar results would be achieved in the domain of predicate logic and mathematical proof comprehension. This assumption is supported by
Table 7 and
Table 8. Kruskal–Wallis test with the significance
p < 0.05 (
p < 0.001, see
Table 7) show that the study success rate in predicate logic in Phases 1 to 3 varies. In addition, the post hoc Bonferroni correction test with the significance level
p < 0.05 (see
Table 8) it can be seen that there is statistically significant difference between Phase 1 and Phase 2 (
p < 0.001) and between Phases 1 and Phase 3 (
p < 0.001). There is no statistically significant difference between Phase 2 and Phase 3 (
p = 0.203).
Hence, all the three null hypotheses Hlogic, Hproof and Hlogic+proof can be rejected. We could accept the alternative hypothesis that study success in predicate logic (proofs, predicate logic + proofs, respectively) depends on implementing visual tools in the teaching process.
12. Analysis of Errors Occurring in Tests
The most common errors that students made at all stages in the tests in the mathematical proofs section can be summarized as follows:
- (1)
When negating a statement involving “for every”, the students neglected to replace this phrase “for every” with “there exists” phrase, and vice versa.
- (2)
When negating a statement involving conjunction (logical AND), they neglected to replace conjunction with disjunction (logical OR), and vice versa.
- (3)
For the proof by contraposition, they formulated a logically equivalent contrapositive statement in such a way that they only negated the assumption and conclusion (i.e., logically equivalent contrapositive statement for the statement A ⇒ B formulated as ¬A ⇒ ¬B),
- (4)
Using the proof by contradiction, the students did not base their evidence on the dispute on the negated conclusion, but they based it on the assumption with which they were to get into the contradiction,
- (5)
Instead of demonstrating a general proof, they demonstrated the validity of the statement only on a specific example,
- (6)
For the proof by contraposition (by contradiction resp.), the students only formulated the logically equivalent contrapositive statement (negation of the statement resp.) and they did not continue in the proving process.
13. Perceiving the Significance of Proofs
The analysis of the essays on the students´ attitude to the significance of proofs and the proving process can be summarized as follows: According to the student’s opinion, the Graph Theory courses belong to the most interesting, but also to the most difficult ones, primarily due to the fact that thorough understanding of mathematical proofs explained within this field is demanding. The students are more aware of the significance of proofs after completing the Graph Theory course, yet most of them still feel the overall negative attitude having been gained at secondary school. Proofs are felt an inconvenient part in testing their knowledge.
14. Final Comments
Visual tools created within our research are beneficial for both teachers and students. Using them in their lectures, teachers present the whole process of a discussed mathematical proof with a modern and well-arranged design appealing to students. Furthermore, students have these tools available and, thus, they have possibilities to revise the performed procedure of the proof for as long and as many times as needed, and to study them thoroughly.
Our exploratory analysis indicated that the students using visual tools (Phases 2 and 3) achieved better results in comprehension and performing the proof being discussed in comparison with the Phase 1 students who did not have visual tools available. The obtained result thus confirmed our assumption (and the research results presented in [
27]) that, thanks to the detailed visualization of the individual procedures of the proof, students can better understand the abstraction of the reasoning of the proven relationships [
27].
No statistically significant differences were found between the Phase 2 and Phase 3 students. This probably resulted from the fact that individual steps of the proof are carefully analysed in both the applications. Referring to our research and to the authors of [
28], we can infer that thanks to the accompanying visualisations, students better understood relationships between steps being proven.
15. Final Projects and Interviewing the Students
During the course, students in each phase were divided into groups of two to four members. Each group worked on their final project—a visualization of the proof of a simple proposition from the field of graph theory, see the
Section 9.
The presented final projects give the clear evidence about the fact that the Phase 2 students and Phase 3 students were more accurate in commenting on and interpreting the proof. Our findings resulted in conclusion similar to those claimed by the authors of the above-mentioned research into geometry presented in [
29,
30].
After their presentations, the students were shortly interviewed by the teacher. They were asked whether they had enjoyed the work on the final projects, in which ways they participated in the process, and how the creation of the assigned presentation of the chosen proof was beneficial for them, see the
Section 9.
Assessing the final projects and interviewing the students, we found out that the students enjoyed preparing the presentations. The students stated that during their creating process of their own visualization they realized the essential principles of the proof and now they better understand the proof of theorems. As these students were Computer Science students, they tried to apply and demonstrate their programming skills in presentations. They invented interesting and original visualizations that will not only help their colleagues to better understand the proofs, but their originality and the involvement of music, sounds, animations and background will also help them to remember the procedures of proofs and then apply them [
31]. Through a joint consultation on each presentation, the students had the opportunity to once more revise the material presented during the course. From the aspect of pedagogical richness and a sustainability perspective, this approach is beneficial for a sustainable future.
16. Conclusions
The current mathematical culture based on stereotypes of succinctness in communication and use of written proofs in teaching, practices which may repel a large population, especially females, from studying mathematics, can be enriched by including visualisation of proofs to make mathematics more accessible to a larger group of students [
32]. This is clearly linked to sustainability because mathematics is the basis of technical progress, which underpins our entire economy, and we lose many students from hard sciences to other fields, along with the global decrease in performance in mathematics [
33].
The conducted research belongs to innovating pilot research in the Czech Republic as well as in other countries. The impact and effectiveness of visualization in proof teaching have been the subject of interest in numerous international studies [
27,
28,
29] and, more recently, in Czech studies [
34]. In most cases, this impact is investigated in the domain of geometric proofs. The reason for this is the existence of geometric dynamic software suitable for conducting proofs in that specific area. For the purposes of this research in the field of graph theory, the visual presentations of GTPVis and the multimedia application GraProofVis were designed and created by the authors or developed under their guidance.
After reviewing the results of numerous studies in this field, it can be summarized that visualization in proof teaching has a positive impact on academic performance in many cases, as evidenced by [
20,
27,
28,
30]. However, there are also studies that have shown no effect, as indicated by [
35].
The aim of the paper was to contribute to the development of mathematical culture of students in the field of graph theory, and to the clarification of a positive impact which suitable educational visual tools supporting formal explanations of mathematical proofs can have and which can result in better understanding of the abstraction of the presented process; to contribute to the answer why integrating ICT in teaching methodologies is so relevant to achieve sustainability goals.
The paper presents a research case carried out within the framework of the dissertation elaboration.
The research results clearly showed that visual tools improve the understanding of proofs and increase students´ study achievements. The research revealed that study success rate in all researched fields (predicate logic, proofs, predicate logic + proofs) in Phases 1 to 3 differ. Furthermore, from our analysis of the post hoc test with the Bonferroni correlation we can conclude that the students who used visual tools (Phase 2 and Phase 3) achieved greater academic success in comparison with the students who did not use them (Phase 1). The effectiveness of teaching mathematical theorems and their proofs with support by GTPVis application (Phase 2) is comparable to the visual instruction supported by the GraProofVis application (Phase 3).
The level of students´ mathematical culture can be revealed through the level of the methods applied by them to solve problems. The experience gained during the research has been already applied in the educational process:
The error analysis allowed us to identify areas in which students most often made errors. These errors are now given more attention to in our courses.
In introductory Graph Theory lessons, students are reminded that errors often result from just a formal mastery of the issue, so it is important for students to try and get into the essence of the subject, understand the issue properly and to be able to apply the knowledge correctly.
Involving students in creating visualizations leads to a better understanding of the proof itself. Thanks to the final projects we obtained original visualizations. The most interesting of them (which performed proofs correctly) are included in the virtual environment as supporting study materials applicable in the Graph Theory course.
Although the results of the research are important, they should be viewed with caution due to the following limitation—only students studying Computer Science at the Faculty of Informatics at University of Hradec Kralove and attending the Graph Theory course were involved in the research, therefore the research results are valid only for this specific area.
Despite this limitation, this study is another stone in the mosaic of the development of one of the basic pillars of knowledge—the pillar of mathematical culture, which plays an essential role in education for sustainable development.
Visual tools created for our research purposes have already become a common part of our teaching. We have greatly appreciated their existence recently after we had to replace traditional classroom teaching with online teaching due to problems related to COVID-19.


