Abstract
Quarry by-products (QB) pose a major environmental challenge for quarries as they accumulate in large quantities, and their beneficial uses are continually sought out. Research at the Illinois Center for Transportation introduced seven applications to utilize QB in chemically stabilized base/subbase pavement layers. These applications were evaluated for field performance through accelerated pavement testing. This paper presents results for the environmental benefits and trade-offs of including QB or blends of QB with recycled materials in pavements. The seven QB applications and a control section were evaluated in terms of environmental impacts using life cycle assessment (LCA). The LCA was conducted in accordance with the International Standard Organization ISO 14044:2006 guidelines. The life cycle impacts were calculated in terms of energy consumption and global warming potential. Three scenarios for (1) as-constructed thicknesses, (2) as-designed thicknesses, and (3) thinner sections for local roads were considered. LCA analysis results were interpreted in terms of the normalized impacts and the response benefits based on falling weight deflectometer resilient deflections to reflect on the impacts due to relative service life expectancy. It was shown that cement-stabilized QB pavement layers, particularly those having QB blended with recycled pavement materials, can have lower environmental impacts when normalized over pavement life and anticipated traffic (i.e., when pavement life expectancy is considered).
1. Introduction and Background
The Federal Highway Administration (FHWA) defines a sustainable pavement as a pavement that achieves its specific engineering goals while ensuring that basic human needs are achieved, resources are used efficiently, and the surrounding ecosystems are maintained or improved [1]. One powerful tool to evaluate the sustainability of pavements and assess the environmental impacts of different stages throughout a pavement’s lifespan is life cycle assessment (LCA). One method to make pavements more sustainable is by using more marginal, by-product, and recycled materials to reduce the carbon footprint and energy demand. If such pavements are designed to ensure good ride quality and performance, the merits of sustainability are met.
One by-product material that can make pavement designs more sustainable is the excessive fines that are produced during quarry operations such as blasting, crushing, screening, and washing. These fines, termed ‘quarry fines’ or ‘quarry by-products (QB)’ are mostly sand-sized particles (typically with a 6-mm top size and ranging from coarse- to medium- and fine-grained sand) with a small fraction of silts and clays (passing No. 200 sieve or finer than 0.075 mm). QB materials exist in quarries as three distinct types: screenings, settling pond fines, and baghouse fines [2]. According to the National Cooperative Highway Research Program (NCHRP) Synthesis 435 (volume 4), depending on the type of rock quarried, QB can make up to 25% of the total aggregates produced [3]. In the US, more than 175 million tonnes (193 million tons) of QB is produced every year from 3000 operating quarries, and they pose environmental and economic challenges, as large quantities accumulate in stockpiles at the production sites [3]. With the recent focus on sustainable construction practices and the scarcity of natural resources, the use of QB in applications that can consume large material quantities and reduce the utilization of virgin aggregates, such as pavements, is becoming imperative.
A recent Illinois Center for Transportation (ICT) study was conducted to evaluate the field performance of QB materials in sustainable pavement applications [4]. The study evaluated new applications of QB, as well as QB mixed with recycled aggregate materials, in chemically stabilized (i.e., cement- or fly ash-stabilized) pavement layers. These applications were tested using realistic load levels and environmental conditions using accelerated pavement testing (APT) and other nondestructive testing techniques, such as the falling weight deflectometer (FWD) test. Seven full-scale test sections with stabilized QB base or subbase layers, along with an eighth conventional section with an unbound aggregate base, were evaluated. The eight sections were constructed over a subgrade with an unsoaked California bearing ratio (CBR) of 6%. The conducted field study proved that the evaluated QB pavement applications exhibited satisfactory pavement performance and produced pavements with high stiffness and low surface rut accumulation, thus indicating QB screenings have promising usage as a sustainable pavement material. The details of the field performance study and the initial laboratory studies that led to choosing the applications evaluated for field performance can be found elsewhere [4,5,6,7,8,9,10,11].
In addition to field performance evaluations, additional investigations were conducted to evaluate the durability and performance of stabilized QB base and subbase layers in pavement applications. A pavement structural analysis and modeling study based on the finite element method (FEM) to mechanistically evaluate the QB applications was conducted [12]. The moduli of the constructed pavement layers were backcalculated from FWD deflections using a mechanistic forward calculation analysis approach using the GT-PAVE axisymmetric finite element analysis program [12]. The sections were compared using a response benefit parameter, defined as the ratio of maximum resilient surface deflection in a conventional control pavement section to the maximum surface deflection for the section with QB application being considered. The calculated response benefits indicated significant advantages of using cement-stabilized QB applications over fly ash-stabilized QB applications and conventional flexible pavement sections [12].
In another study, durability tests were conducted on samples extracted from field test sections, as well as on new samples prepared in the laboratory with the same QB types and material combinations [13]. Both sets of samples were evaluated by the American Association of State Highway and Transportation Officials (AASHTO) T 135 and AASHTO T 136 test procedures for wet–dry and freeze–thaw durability, respectively. The results of the durability testing indicated that cement-stabilized QB materials benefited from long-term curing in the field, while fly ash-stabilized QB materials were less durable after exposure to multiple freeze–thaw and wet–dry cycles in the field. Further, durability samples made with QB materials from dolomitic aggregate sources, having a higher magnesium oxide content in their chemical composition, showed better field performance trends than those with limestone QB having a high calcium oxide content [13].
To date, no comprehensive environmental study has been performed to quantify the environmental benefits of including QB or mixtures of QB with fractionated reclaimed asphalt pavements (FRAP) or fractionated recycled concrete aggregates (FRCA) in pavement applications. Such studies are deemed necessary for a comprehensive evaluation and justification of QB usage in well-performing sustainable pavement applications. In accordance, this paper presents a complete sustainability assessment of specific QB applications considering pavement performance and environmental impacts. The environmental sustainability assessment calculations were performed following the ISO 14044:2006 [14] and FHWA’s LCA framework [15]. The data obtained during the construction and testing of the pavement sections were used to develop three LCA scenarios for assessing the environmental impacts of QB usage in cement- and fly ash-stabilized pavement layers.
2. Objective and Scope
The objective of this research is to conduct a comparative LCA on the carbon footprint and energy demands for stabilized QB applications in pavement base and subbase layers. The scope of the research entails conducting the comparative LCA for three scenarios: the first (Scenario #1) evaluates the environmental burdens of actual QB pavement test sections constructed in the field and considers actual constructed layer thicknesses measured from trenching and hot mix asphalt (HMA) cores. Scenario #2 assumes that the design thicknesses were properly constructed to eliminate the variability from layer thickness variations. The pavement structure in these two scenarios is more suited for a higher volume of traffic and/or longer design life. Scenario #3 calculates the environmental impacts for thinner pavement structures, which are more suited for low-volume road applications.
3. Materials and Methods
3.1. Evaluated Quarry By-Product Applications
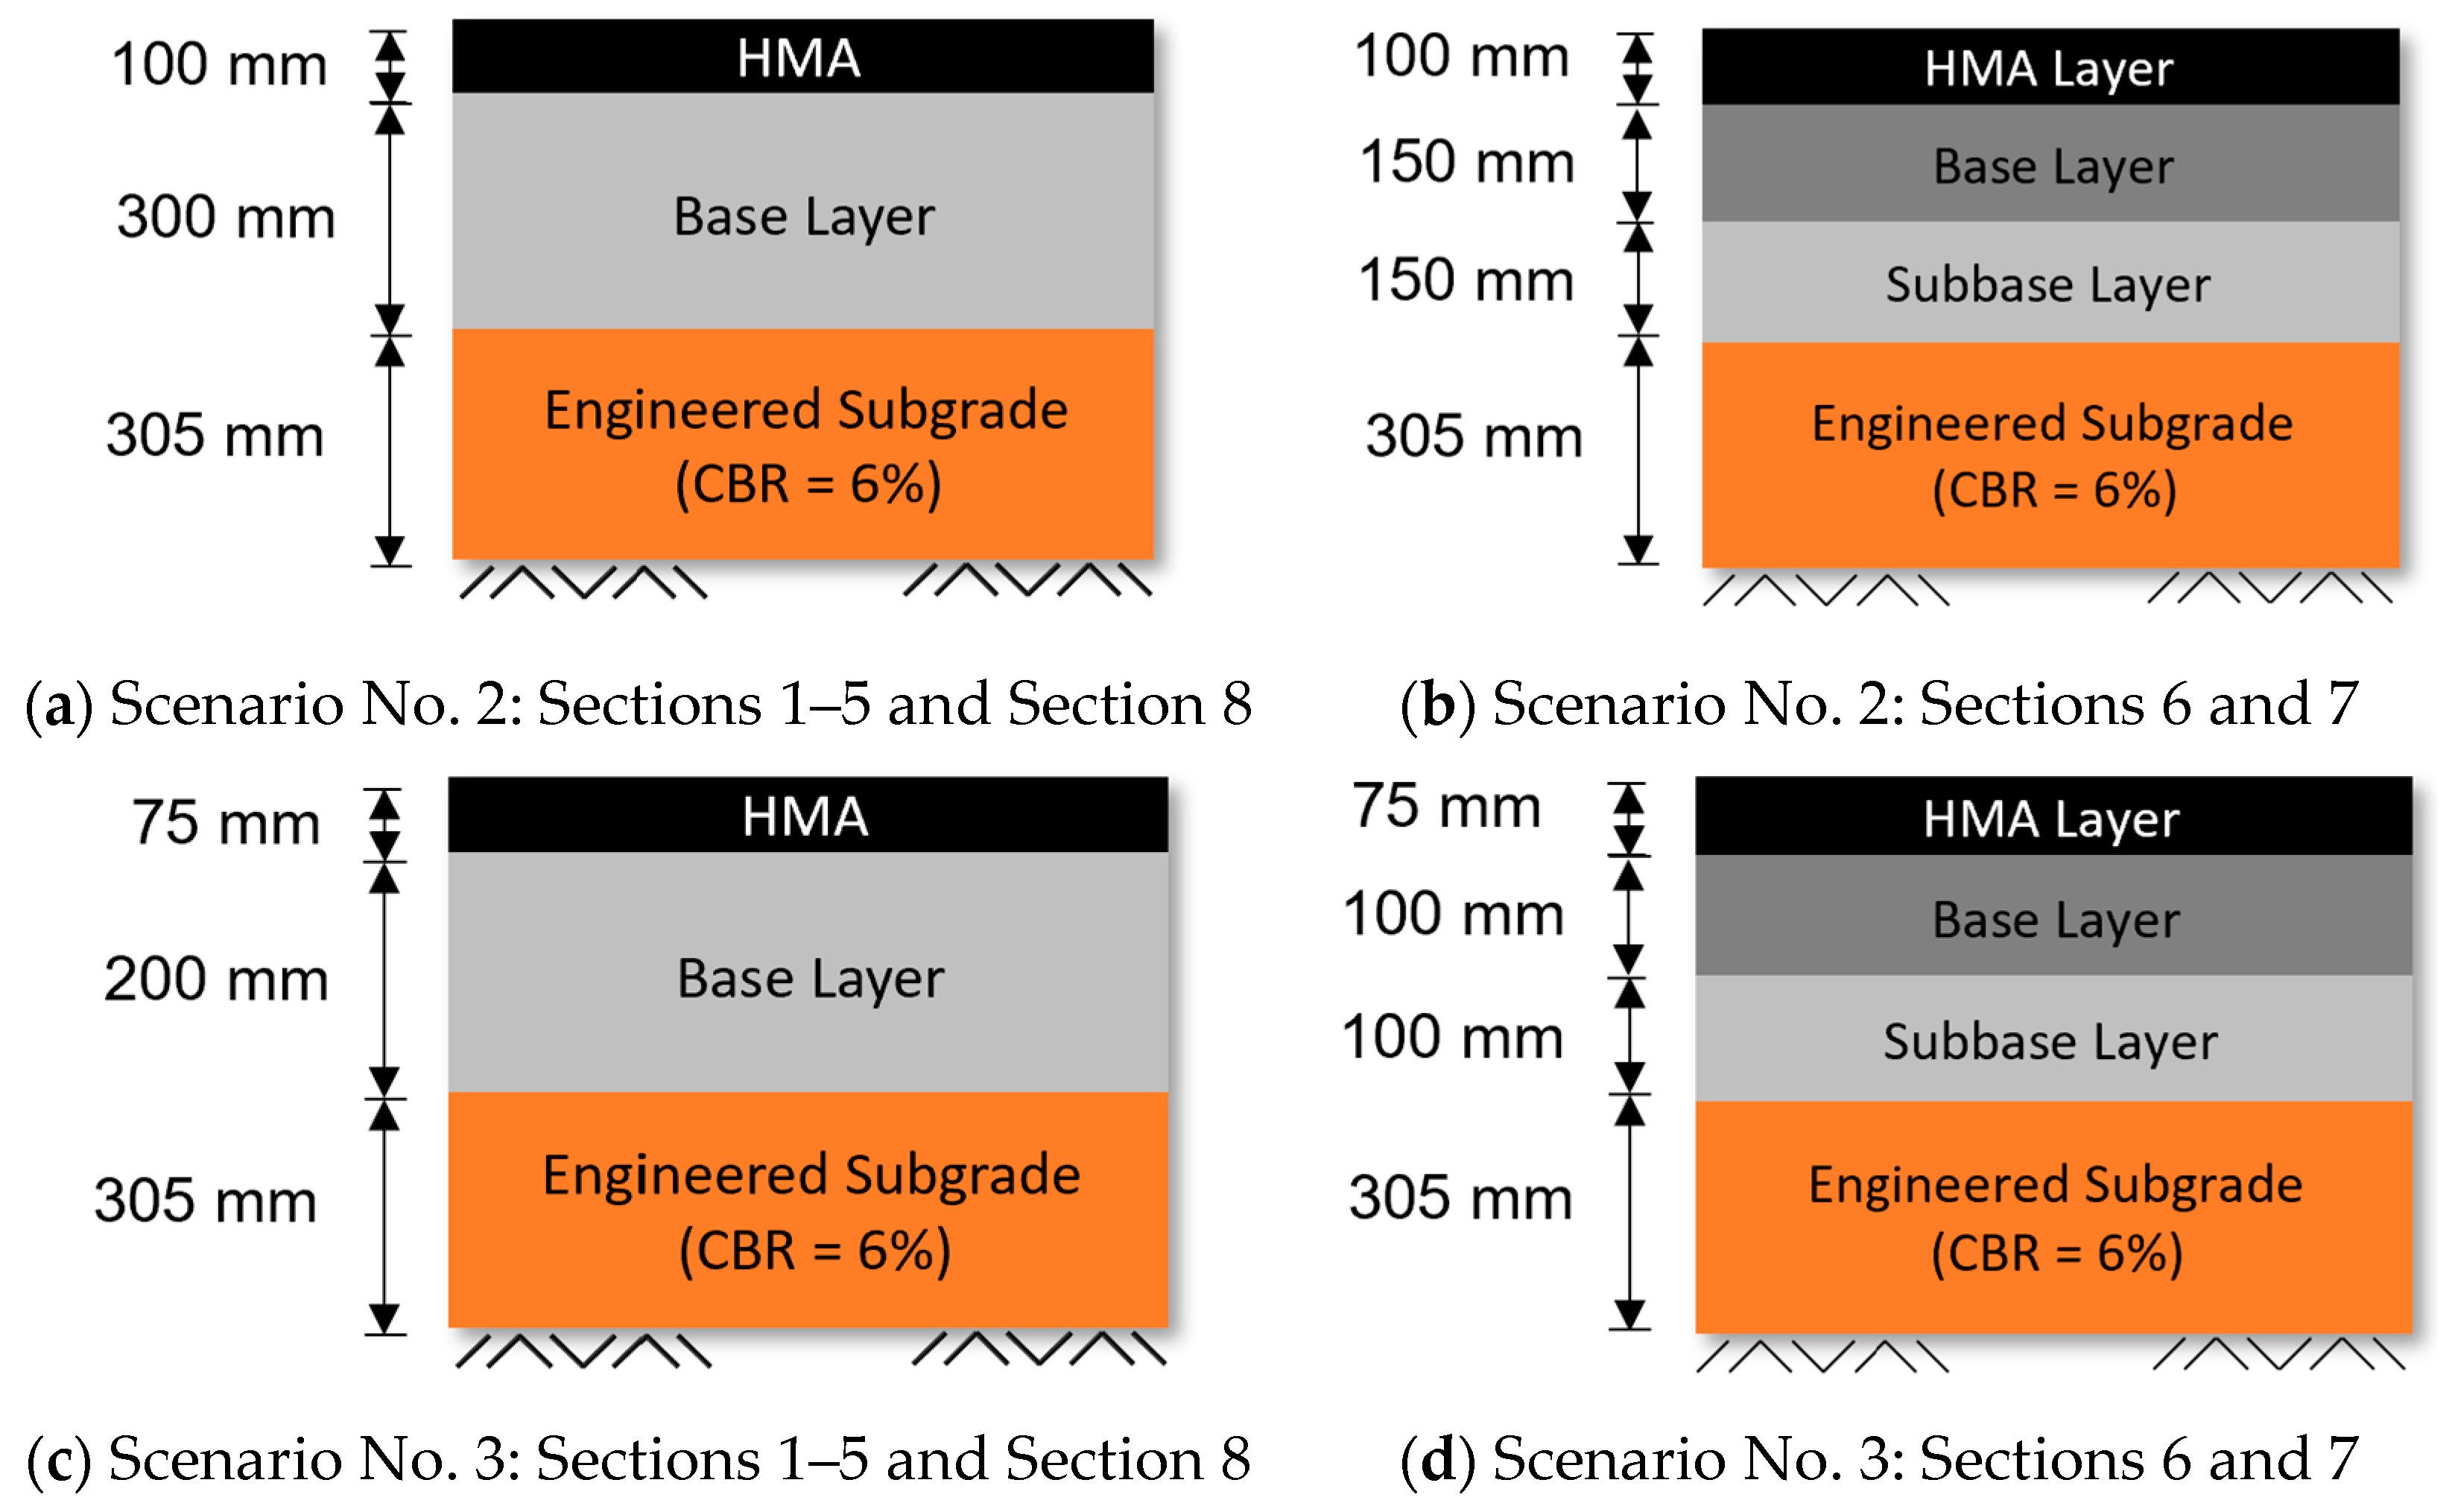
Seven pavement test sections that investigated bound layer applications of QB screenings, and an eighth conventional section, were evaluated for their environmental impacts. These QB pavement foundation applications were selected based on successful outcomes of previous studies that provided evaluations of QB materials both in laboratory and field testing [4,5,6,7,8,9,10,11]. Table 1 summarizes detailed descriptions of the QB applications and layer thicknesses for each application. Note that the constructed test sections referred to as C2S1–C2S4 (Cell 2 Sections 1–4) and C3S1–C3S4 (Cell 3 Sections 1–4) are listed as Sections 1–8 in Table 1. Sections 1–8 also refer to the pavement sections considered for Scenarios #2 and #3 of the conducted LCA. These sections essentially have the same material combinations and refer to the same applications but have different layer thicknesses, as listed in Table 1. The pavement cross-section for each of the eight sections are presented in Figure 1, where the design thicknesses for Scenarios #2 and #3 are shown. These pavement test sections can be broadly divided into the following three categories of QB fines utilization:

Table 1.
Summary of the pavement layer thicknesses for the three LCA scenarios considered.
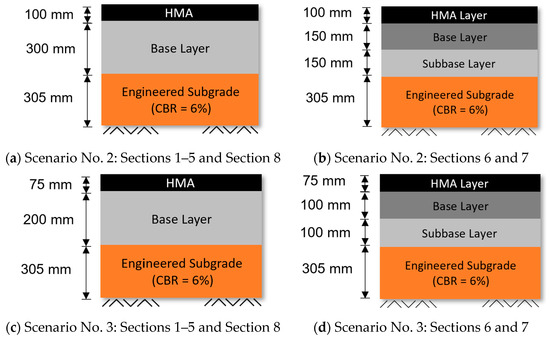
Figure 1.
Pavement cross-sections with the design thicknesses (Scenarios #2 and #3).
- Stabilized base of QB and recycled coarse aggregate-blended QB with coarse recycled aggregate fractions (FRAP or FRCA) and stabilizing the blends with 3% cement or 10% class C fly ash (C2S1-C2S3 (Sections 1 and 3));
- Stabilized base-using QB as a cement-treated base material (C2S4 and C3S1 (Sections 4 and 5));
- Stabilized subbase in an inverted pavement-using QB as a cement- or fly ash-treated subbase in inverted pavements (C3S2 and C3S3 (Sections 6 and 7)).
A super-single tire (455/55R22.5) was used to traffic the sections. A constant unidirectional wheel load of 44.5 kN (10 kip), a tire pressure of 760 kPa (110 psi), and a constant speed of 8 km/h (5 mph) were assigned for the first 100,000 passes. The chemically stabilized sections, particularly the cement-stabilized QB and QB blend sections, performed quite satisfactorily compared to the other sections, including the control section (i.e., they could withstand 7.7- to 20-times higher ESALs compared to the control section, depending on the blend). Detailed descriptions of the performance trends of these sections under loading and nondestructive pavement testing can be found elsewhere [4]. To better compare and evaluate the performance trends, the wheel load was increased to 62.3 kN (14 kips), the tire pressure was increased to 862 kPa (125 psi), and an additional 35,000 passes were applied at these increased loads/pressure levels.
3.2. LCA Methodology
To perform a comparative LCA for the seven QB test sections and the conventional section, the LCA methodology is first defined. This includes a clear definition of the goal and scope of the analysis, system boundaries, functional unit, data quality requirements, and impact categories considered, as well as the limitations and assumptions of the analysis.
The goal of the study is to provide a comparative LCA to evaluate the environmental impacts of constructing flexible pavements utilizing stabilized QB base and subbase applications. The pavement sections evaluated include the seven cement- and fly ash-stabilized sections with QB or mixes of QB with coarse fractionated recycled aggregates, as well as the conventional test section used as the control in the accelerated testing program. The scope of the study covers three scenarios: (#1) constructed layer thicknesses, (#2) as-designed layer thicknesses, and (#3) a proposed case with lower pavement thicknesses for low-volume and local roads. Table 2 provides a summary of the test section properties and quantitative performance metrics (Scenario #1).
Table 2.
Summary of the accelerated pavement testing of the field test sections.
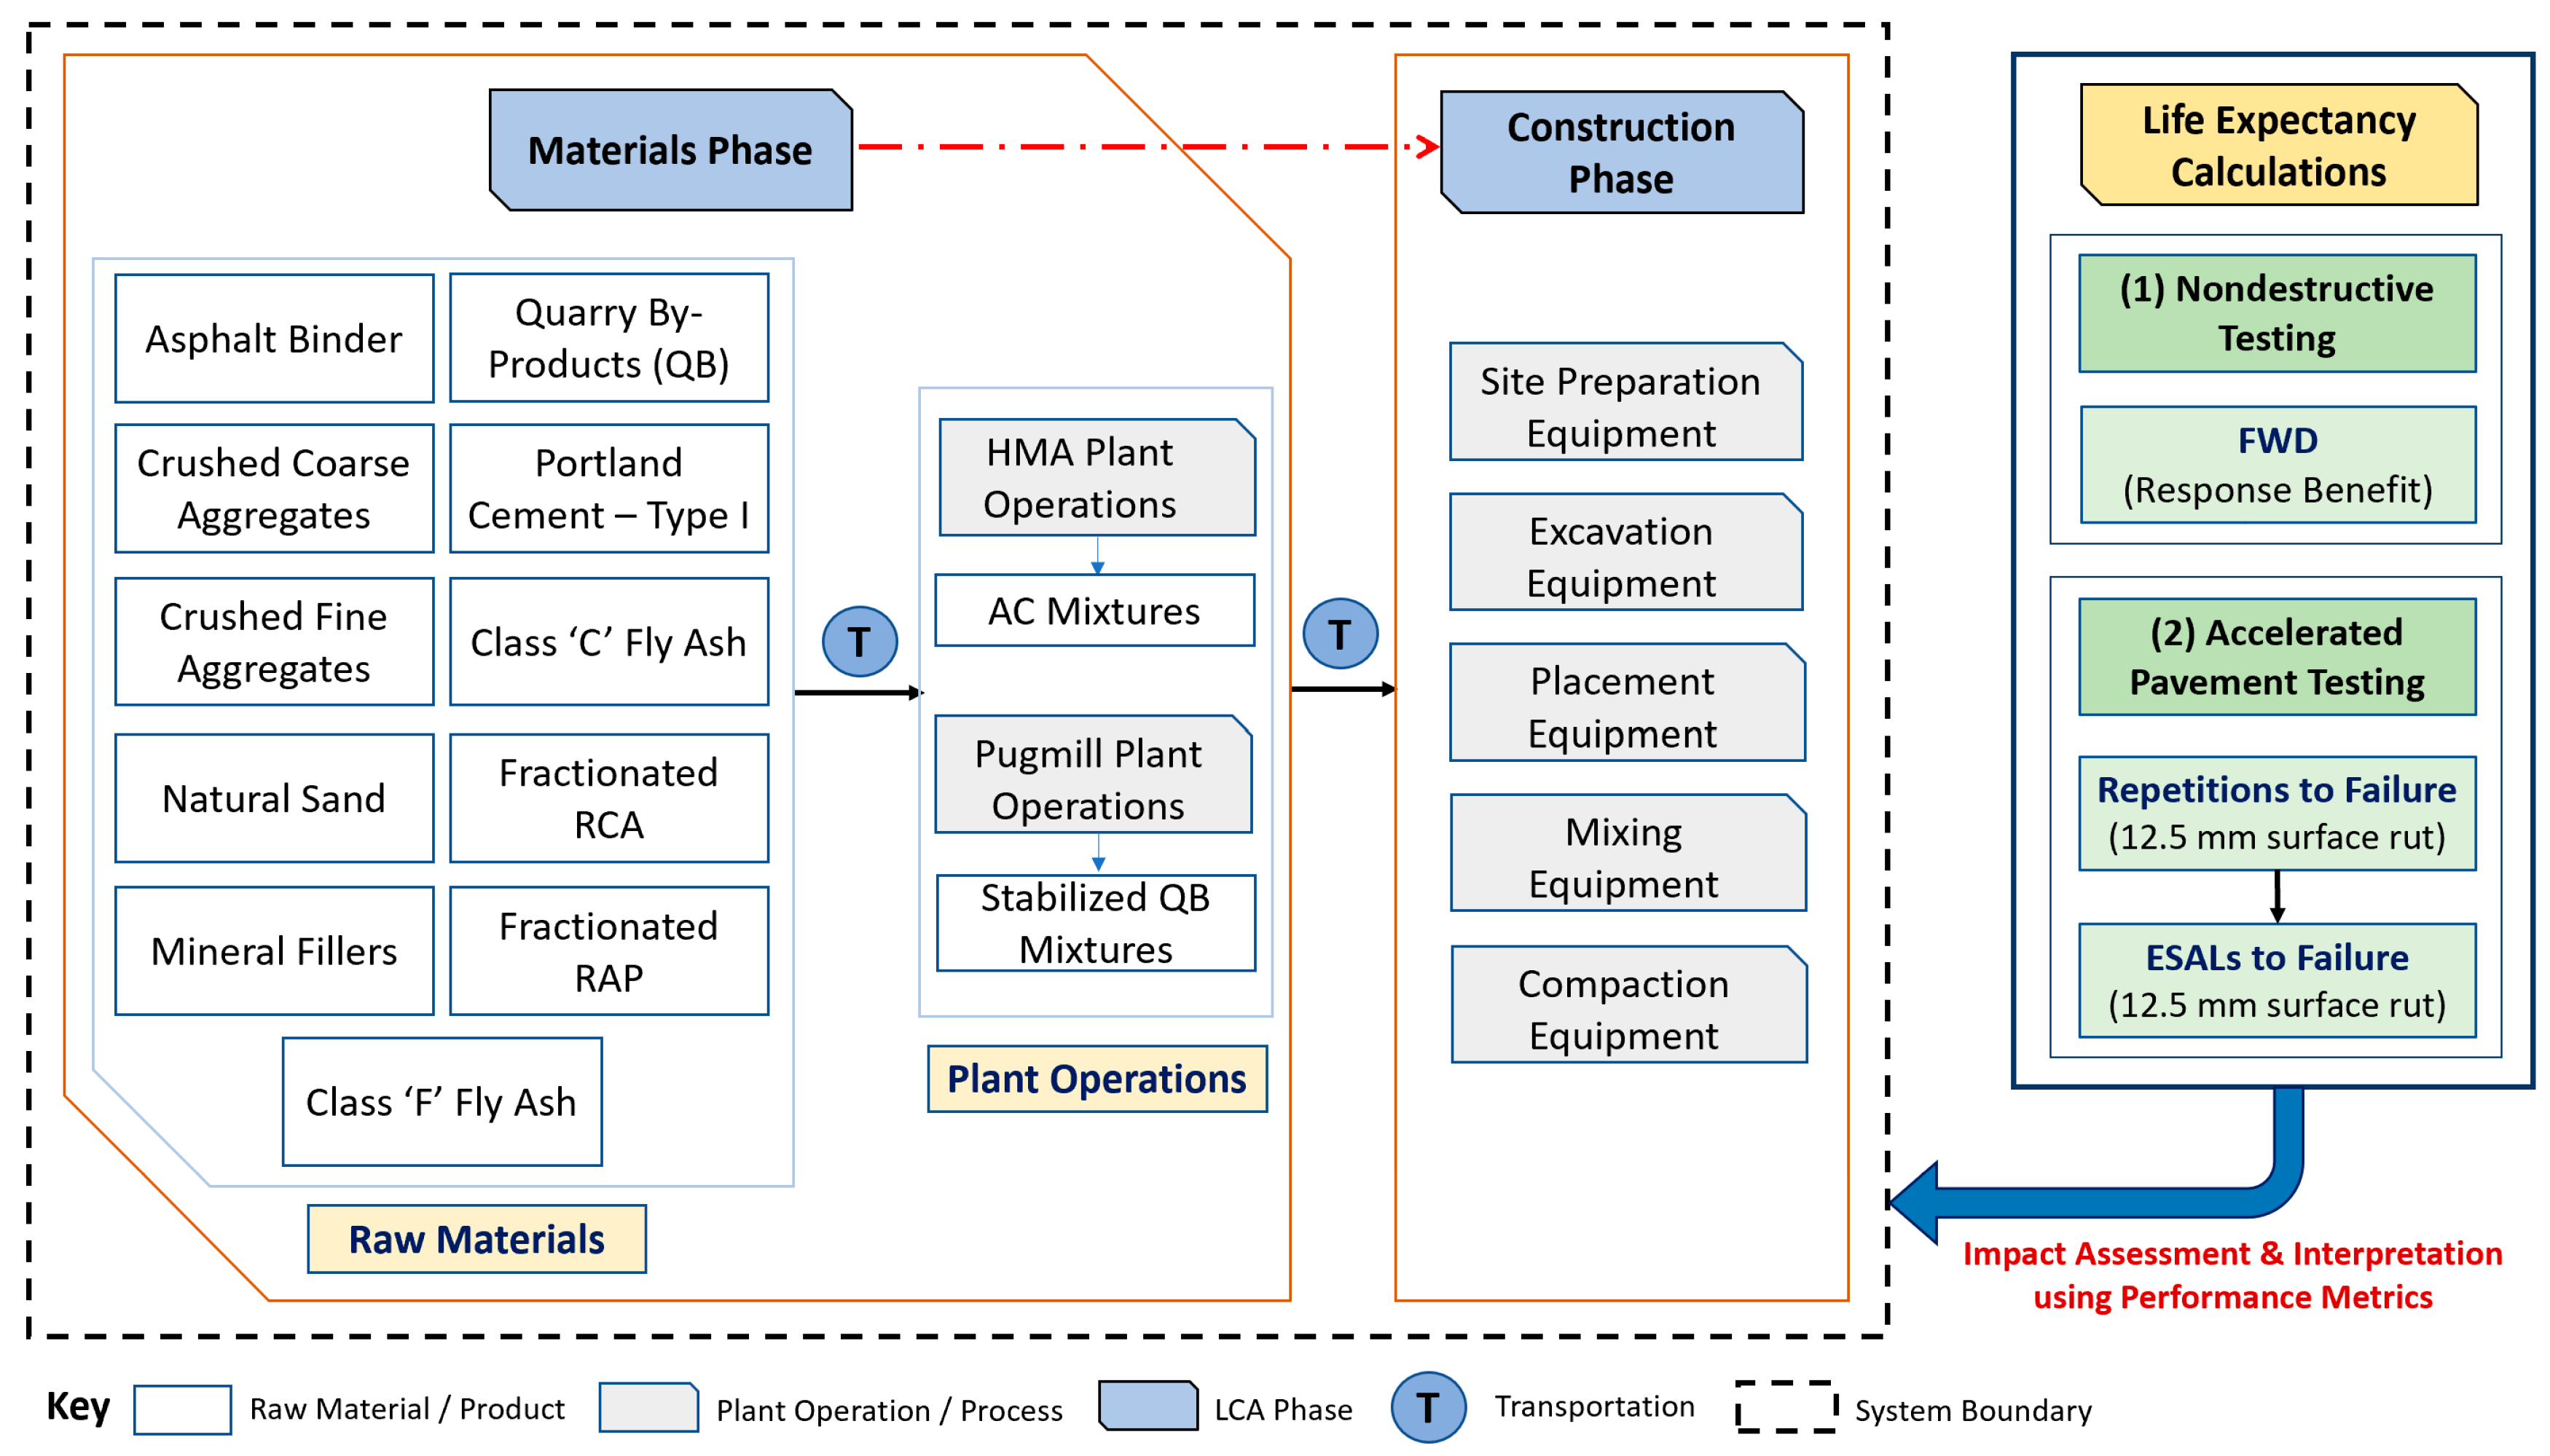
System boundaries, which define the life cycle stages that are considered in the LCA analysis, include the materials and construction stages. The unit processes that are included within each stage and that were considered in this analysis are presented in Figure 2. Note that, for pavement systems, five life cycle stages are commonly considered: materials, construction, use, maintenance/rehabilitation, and end of life [16]. In this study, impact considerations for materials acquisition, materials production, plant operations, transportation, and construction activities are mainly considered due to the lack of long-term performance trends for the evaluated pavement applications covering life cycle stages such as use stage, rehabilitation, and end of life. These newly proposed applications were only tested with APT, and the long-term in-service performance has not been fully evaluated to date. However, the performance of the evaluated sections was also incorporated into the LCA of Scenario #1 through a normalized LCA contribution per 100,000 ESALs and using the concept of ‘response benefit’, which is explained later in the paper.
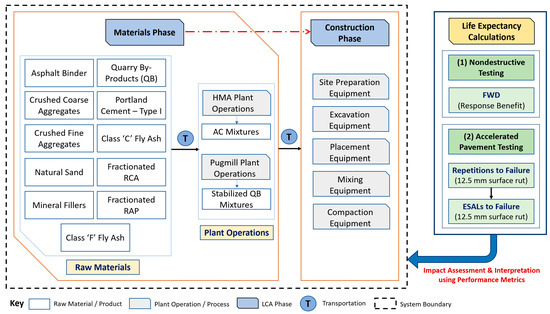
Figure 2.
Pavement life cycle stages considered in the analysis and system boundaries.
The functional unit selected for this analysis is a ‘one-lane mile’ of constructed pavement, which is deemed suitable for the LCA stages being covered by the system boundaries (i.e., materials and construction stages and the performance-related aspects of life expectancy). Common functional units used for the analyses of pavements include one-lane mile and vehicle miles traveled. One-lane mile was deemed adequate for this analysis, since the aspects of the use stage related to vehicular traffic, rolling resistance, and heat island were not included in the system boundaries. No analysis period was selected for this LCA, since the use stage and maintenance/rehabilitation activities were not fully considered a part of the system boundaries. The lane width considered was 3.66 m (12 ft.) for all calculations, while the depths of the pavements varied depending on the design option and scenario being evaluated.
For this comparative LCA, the Tool for the Reduction and Assessment of Chemical and other environmental Impacts (TRACI), which was developed by the Environmental Protection Agency (EPA) and used for environmental impact categories, was considered as the metrics for LCA decision making [17,18]. The TRACI impact assessment methods that were considered for the unit processes were emissions, primarily global warming potential (GWP) in units of kg CO2 equivalent (kg CO2 eq.). Emissions were quantified for each unit process, such as asphalt mixture production, Portland cement production, materials hauling and transportation, and placing and construction operations.
Another metric used to compare the sustainability of the evaluated pavement sections in the different scenarios is the total energy demand (TED) in units of mega joules (MJ). For simplicity, the considered performed LCAs reported one value for the total energy demand, which included both the renewable and nonrenewable primary and secondary energy demands. Thus, energy used as fuel and non-fuel energy (feedstock energy) were reported as a single metric.
One of the main limitations for the conducted life cycle assessments was relying on secondary data sources to perform the comparative LCAs. Primary data from project-specific locations were not collected due to lack of access to reliable sources and time/cost limitations. Additionally, the variable thicknesses in the pavement layers, particularly that of the HMA layer, produced high variability and uncertainty for the end-of-life stage, which was thus not considered in the system boundaries due to the unknown demand for pavement materials at the end of life. Further, the cut-off allocation method was only considered to account for the use of recycled and by-product materials. These limitations shall be further considered in a more thorough analysis.
3.3. Unit Process Calculations
Secondary life cycle inventories (LCI) and data sources were used to compile the TRACI impacts, particularly GWP, and energy demand for the raw materials and fuels (energy flows) required for the materials and construction stages of the conducted LCAs. The data source for the raw materials was the Illinois Center for Transportation (ICT) Tollway Database, which is a comprehensive database compiled for raw materials in Illinois that includes, among others, coarse and fine aggregates, Portland cement and fly ash, FRCA, FRAP, water, asphalt binder, tack coats, and prime coats [19,20]. Several data sources were used for the fuels involved in the material production and construction stages. The fuels involved included electricity, natural gas, and diesel burned in various industrial machineries. For electricity generation, the Emissions & Generation Resource Integrated Database (eGRID) was utilized to calculate the impacts for each kWh generated [21]. For natural gas combustion, the U.S. Life Cycle Inventory Database was utilized for the emissions of each m3 (ft3) combusted [22]. For diesel burned in machinery, the USecoinvent Database was utilized to calculate the emissions of each MJ diesel burned [23].
3.3.1. Truck Hauling and Transportation
Life cycle impacts for hauling/transportation were considered for both the materials and construction stages. For raw materials production, the impacts of transportation were factored into the upstream processes and included in the unit processes modeled by SimaPro for each material individually. The impact of materials hauling was reported separately for the transportation of the raw materials to (and within) the operation plants and the construction site. Reasonable hauling distances were assumed for each material, and a variable impact transportation (VIT) model was utilized to calculate the environmental impacts and energy demand for truck hauling operations [24]. The model considers truck operational parameters such as the payload, roadway grade (assumed 0%), temperature (24 °C or 75 °F), relative humidity (50%), truck speed (75 km/h or 60 mph), and the construction year (2021). The values assumed for each parameter are given above in parentheses, and the impact per truck mile is given by the following equation [24]:
where W is the truck payload (tonnes); G is the grade (%); T is the temperature (°F), T ≥ 60 °F; RH is the relative humidity (%); v is the truck speed (mph); t is the year of hauling, t = 1 for 2014, t = 2 for 2015, and it increases by one each year; and and are the model coefficients [24].
3.3.2. Plant Operations
Two types of plant operations were considered for this LCA study: (1) asphalt plant operations involved in producing HMA mixes and (2) plant operations involved in producing stabilized QB aggregate mixes through the batch pugmill process.
For asphalt plant operations, the main inputs are divided into two categories: materials and fuels. Materials include aggregates, asphalt binders, and mineral fillers. The energy inputs for an asphalt plant are mainly electricity from a grid or from generators, the burning of natural gas in drums for heating aggregates, and diesel used in construction equipment in the plant. Emissions and environmental impacts contributing to the LCA stem from the upstream processes involved in materials and fuels production and the burning of various types of fuels during plant operations, as well as the transportation of materials and fuels to the asphalt plant prior to and during the production of the asphalt mix.
For the conducted LCA, two asphalt mix designs were used: one surface course and one binder course mix. For LCA Scenario #1 involving the constructed pavement sections, only the surface coarse mix design was used for the whole HMA layer. For the pavement sections in Scenarios #2 and #3, the surface course included a 12.5-mm (0.5-in.) nominal maximum aggregate size (NMAS) used for the top layer, and the binder course mix had a 25-mm (1.0-in.) NMAS used for the bottom layer. The HMA thickness was divided equally between the two mixes, i.e., for each HMA mix, 50 mm (2 in.) for Scenario #2 and 38 mm (1.5 in) for Scenario #3. The same mix was used for Scenario #1 to match what was constructed in the field. The details for the two mix designs can be found elsewhere [10].
For the purposes of constructing the chemically stabilized QB test sections, the guide to cement-treated bases published by the Portland Cement Association (PCA) recommends two construction methods for large-scale projects: a mixed-in-place method using single-shaft traveling mixer equipment and a central plant mixing method using twin-shaft pugmill mixing equipment [25].
Central mixing plants can use various methods to prepare soil cement mixtures, such as continuous flow pugmills, batch-type pugmills, and rotary drum mixers [25]. For providing more uniform mixes and a more sustainable construction practice, a central plant mixing method was considered. A batch pugmill operation was selected. Several models of batch-type pugmills were investigated, including a PM100-SG portable pugmill plant model that had an output of 100 tonnes per hour. Based on the reduced production capacity (80 tonnes per hour) and the horsepower of the electric motors used for the pugmill, conveyor belts, and water feeding system, 0.3 kWh/tonne (0.27 kWh per ton) of electricity consumption was estimated for each tonne of material produced. In addition, a front loader R/T Cat 914 was needed to transport materials to the pugmill, which had an hourly fuel consumption of 3.79 L per hour (3 gallons per hour) [26]. The detailed mix designs for the seven QB applications discussed herein can be found elsewhere [10].
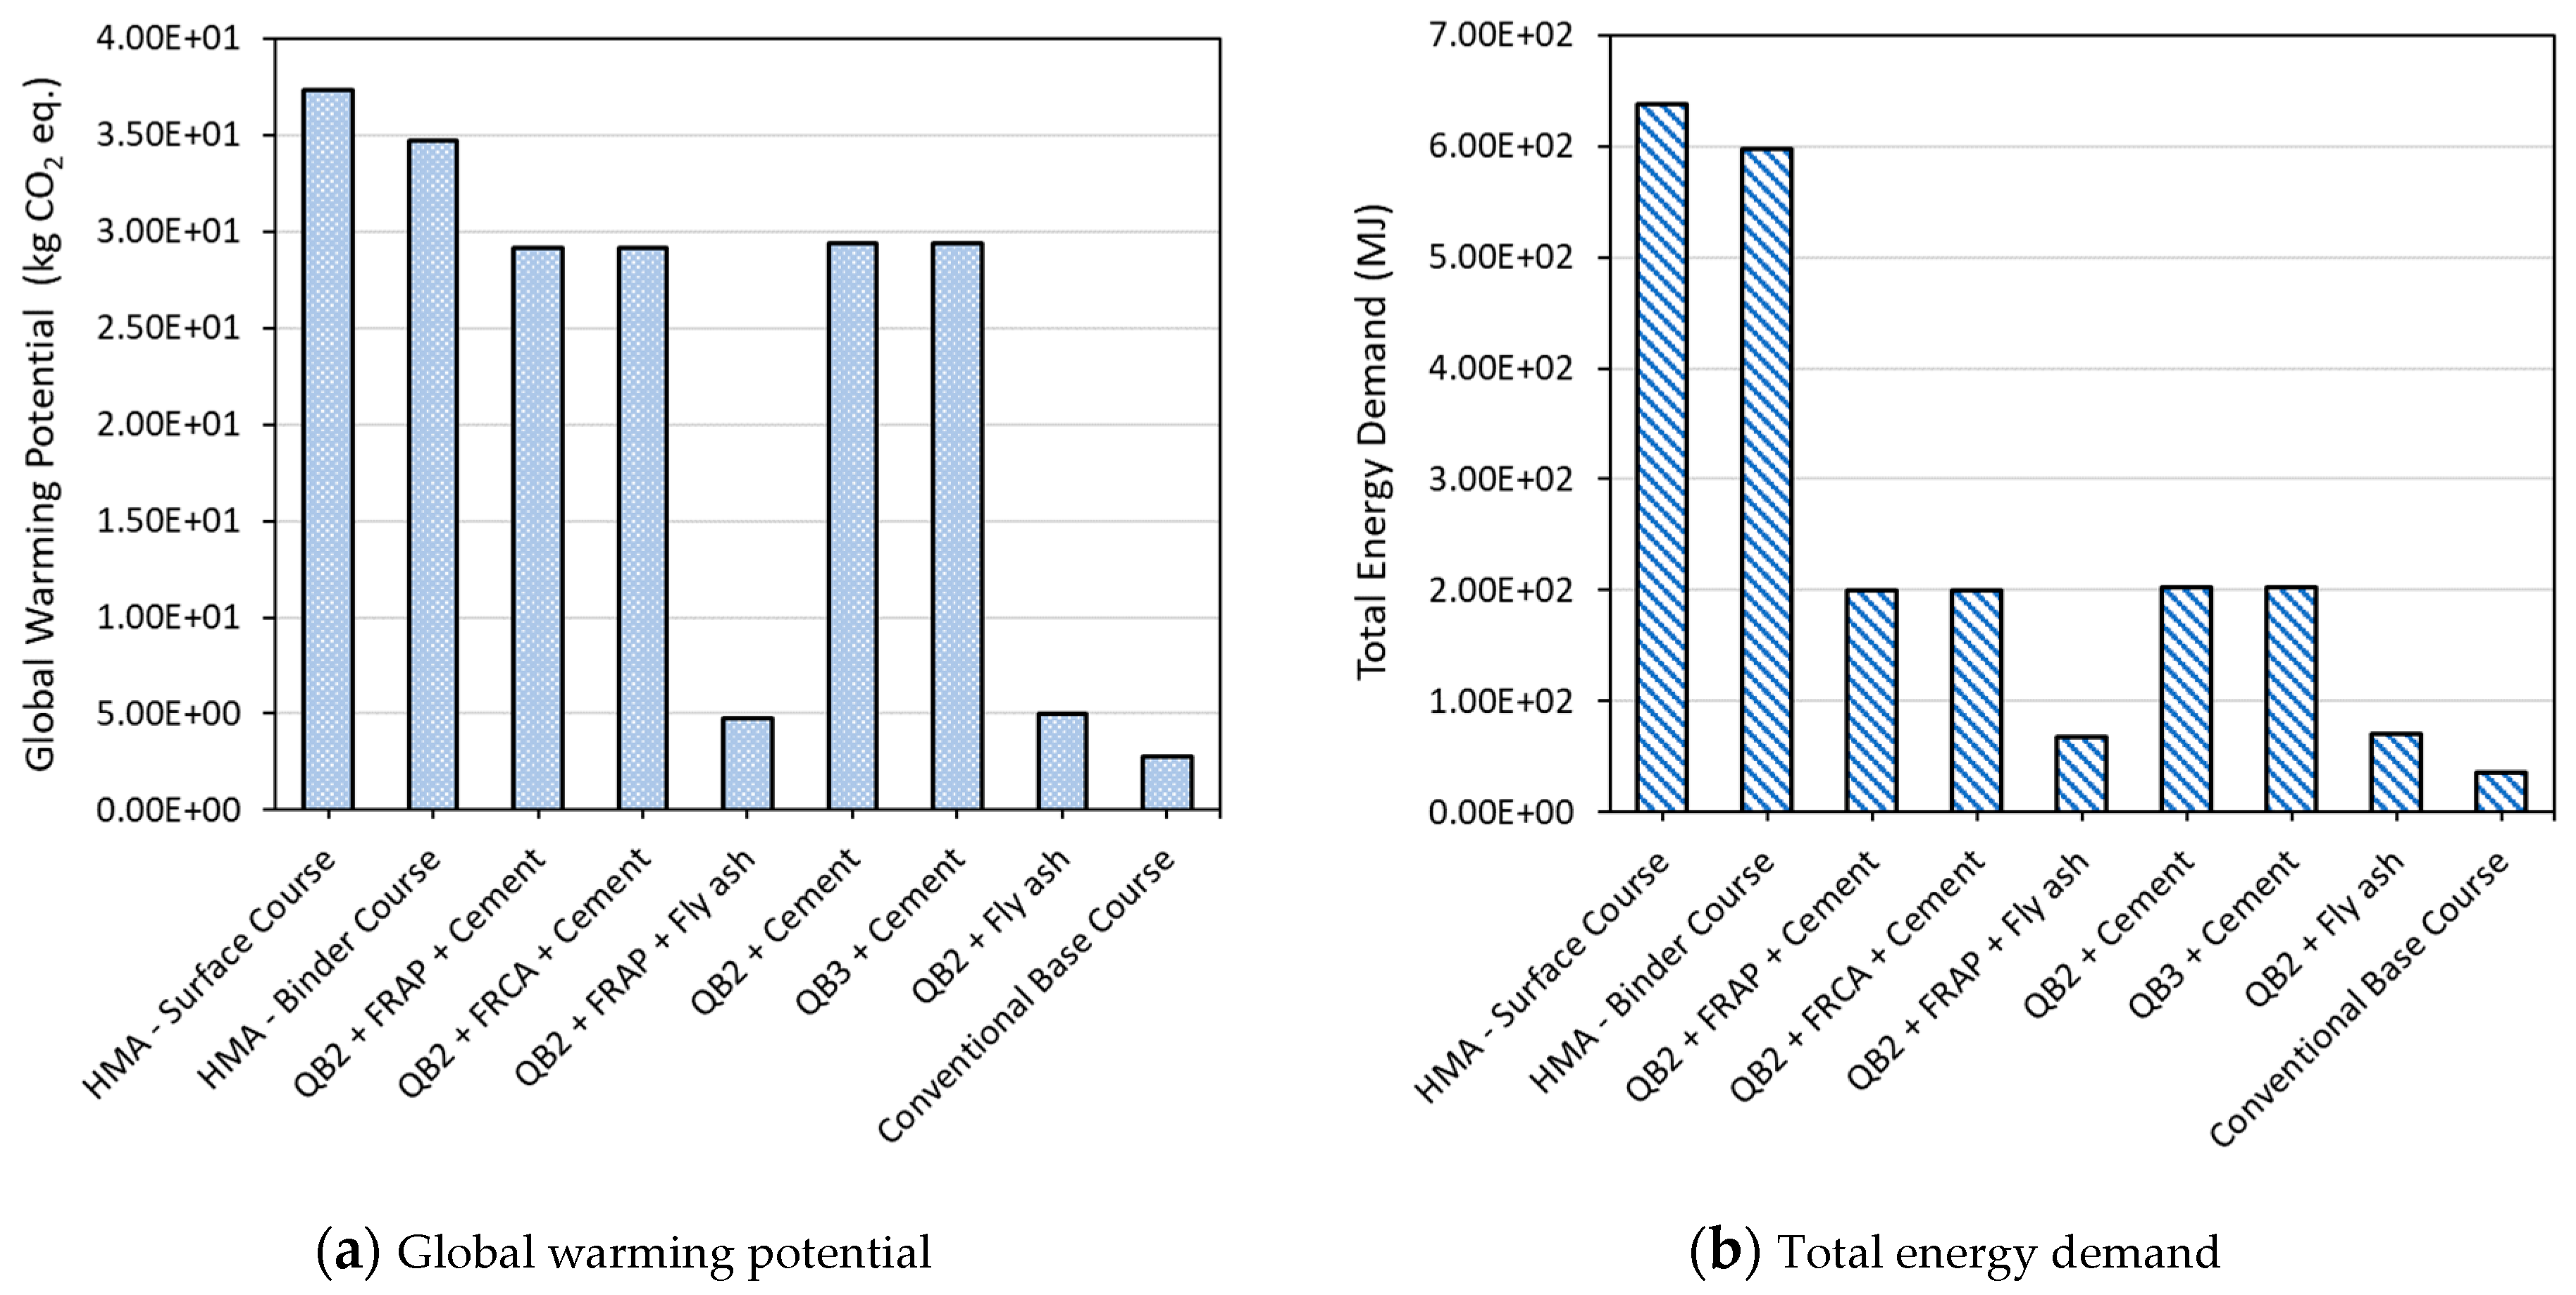
The total impacts of producing 0.91 tonnes (1 ton) of each material combination are presented in Figure 3. For HMA and stabilized QB materials, the presented impacts account for raw materials acquisition and plant operations, while the impacts for conventional base course materials account only for materials acquisition, since no plant mixing is involved. As shown in Figure 3, the materials involved in constructing the QB test sections can be broadly divided into three categories: (1) materials with high GWP and TED, i.e., HMA layers, (2) materials with high GWP and intermediate TED, i.e., cement-stabilized QB materials, and (3) materials with low GWP and low TED, i.e., fly ash-stabilized QB materials and the conventional base course aggregate material.
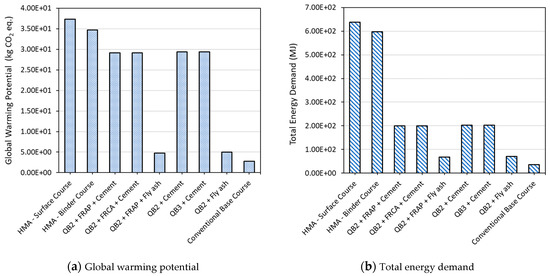
Figure 3.
GWP and TED for producing 0.91 tonnes (one ton) of the various material blends.
3.3.3. Construction
Construction is one of the most critical activities for pavements that can govern performance and lifespan. High-quality construction can ensure good pavement performance throughout the design life and can reduce the variability due to poor construction practices. The data for construction activities, equipment inventories, and fuel consumption were obtained from the National Cooperative Highway Research Program (NCHRP) study involved in estimating fuel usage factors for highway and bridge construction [26]. The construction activities considered were: (1) site preparation, (2) subgrade preparation, (3) placement and compaction of conventional and chemically stabilized subbase and base layers, and (4) placement and compaction of the HMA layers. For site preparation, a new construction was included with the need for tree and plant removals. For subgrade preparation, the quantities of excavation and grading varied depending on the total pavement thickness. The construction activities involved in the construction of the conventional and the chemically stabilized sections were assumed to be essentially the same, since the difference was mainly in the plant operations.
The construction activities and the inventory for equipment were compiled for the different construction activities, as summarized in Table 3. For each construction activity, the productivity rates were compiled based on the equipment inventory. Fuel consumption rates in liters/gallons were also compiled for each construction activity for the representative productivity units. The main source of the productivity rates and fuel consumption was the NCHRP report for fuel usage factors by Skolnik et al. [26]. Note that the fuel consumption and productivity rates assumed that the equipment inventory for each activity was followed closely.
Table 3.
Summary of the construction activities, production rates, and fuel usage rates *.
4. LCA Results, Discussion, and Interpretations
4.1. Scenario #1: As-Constructed Pavement Sections
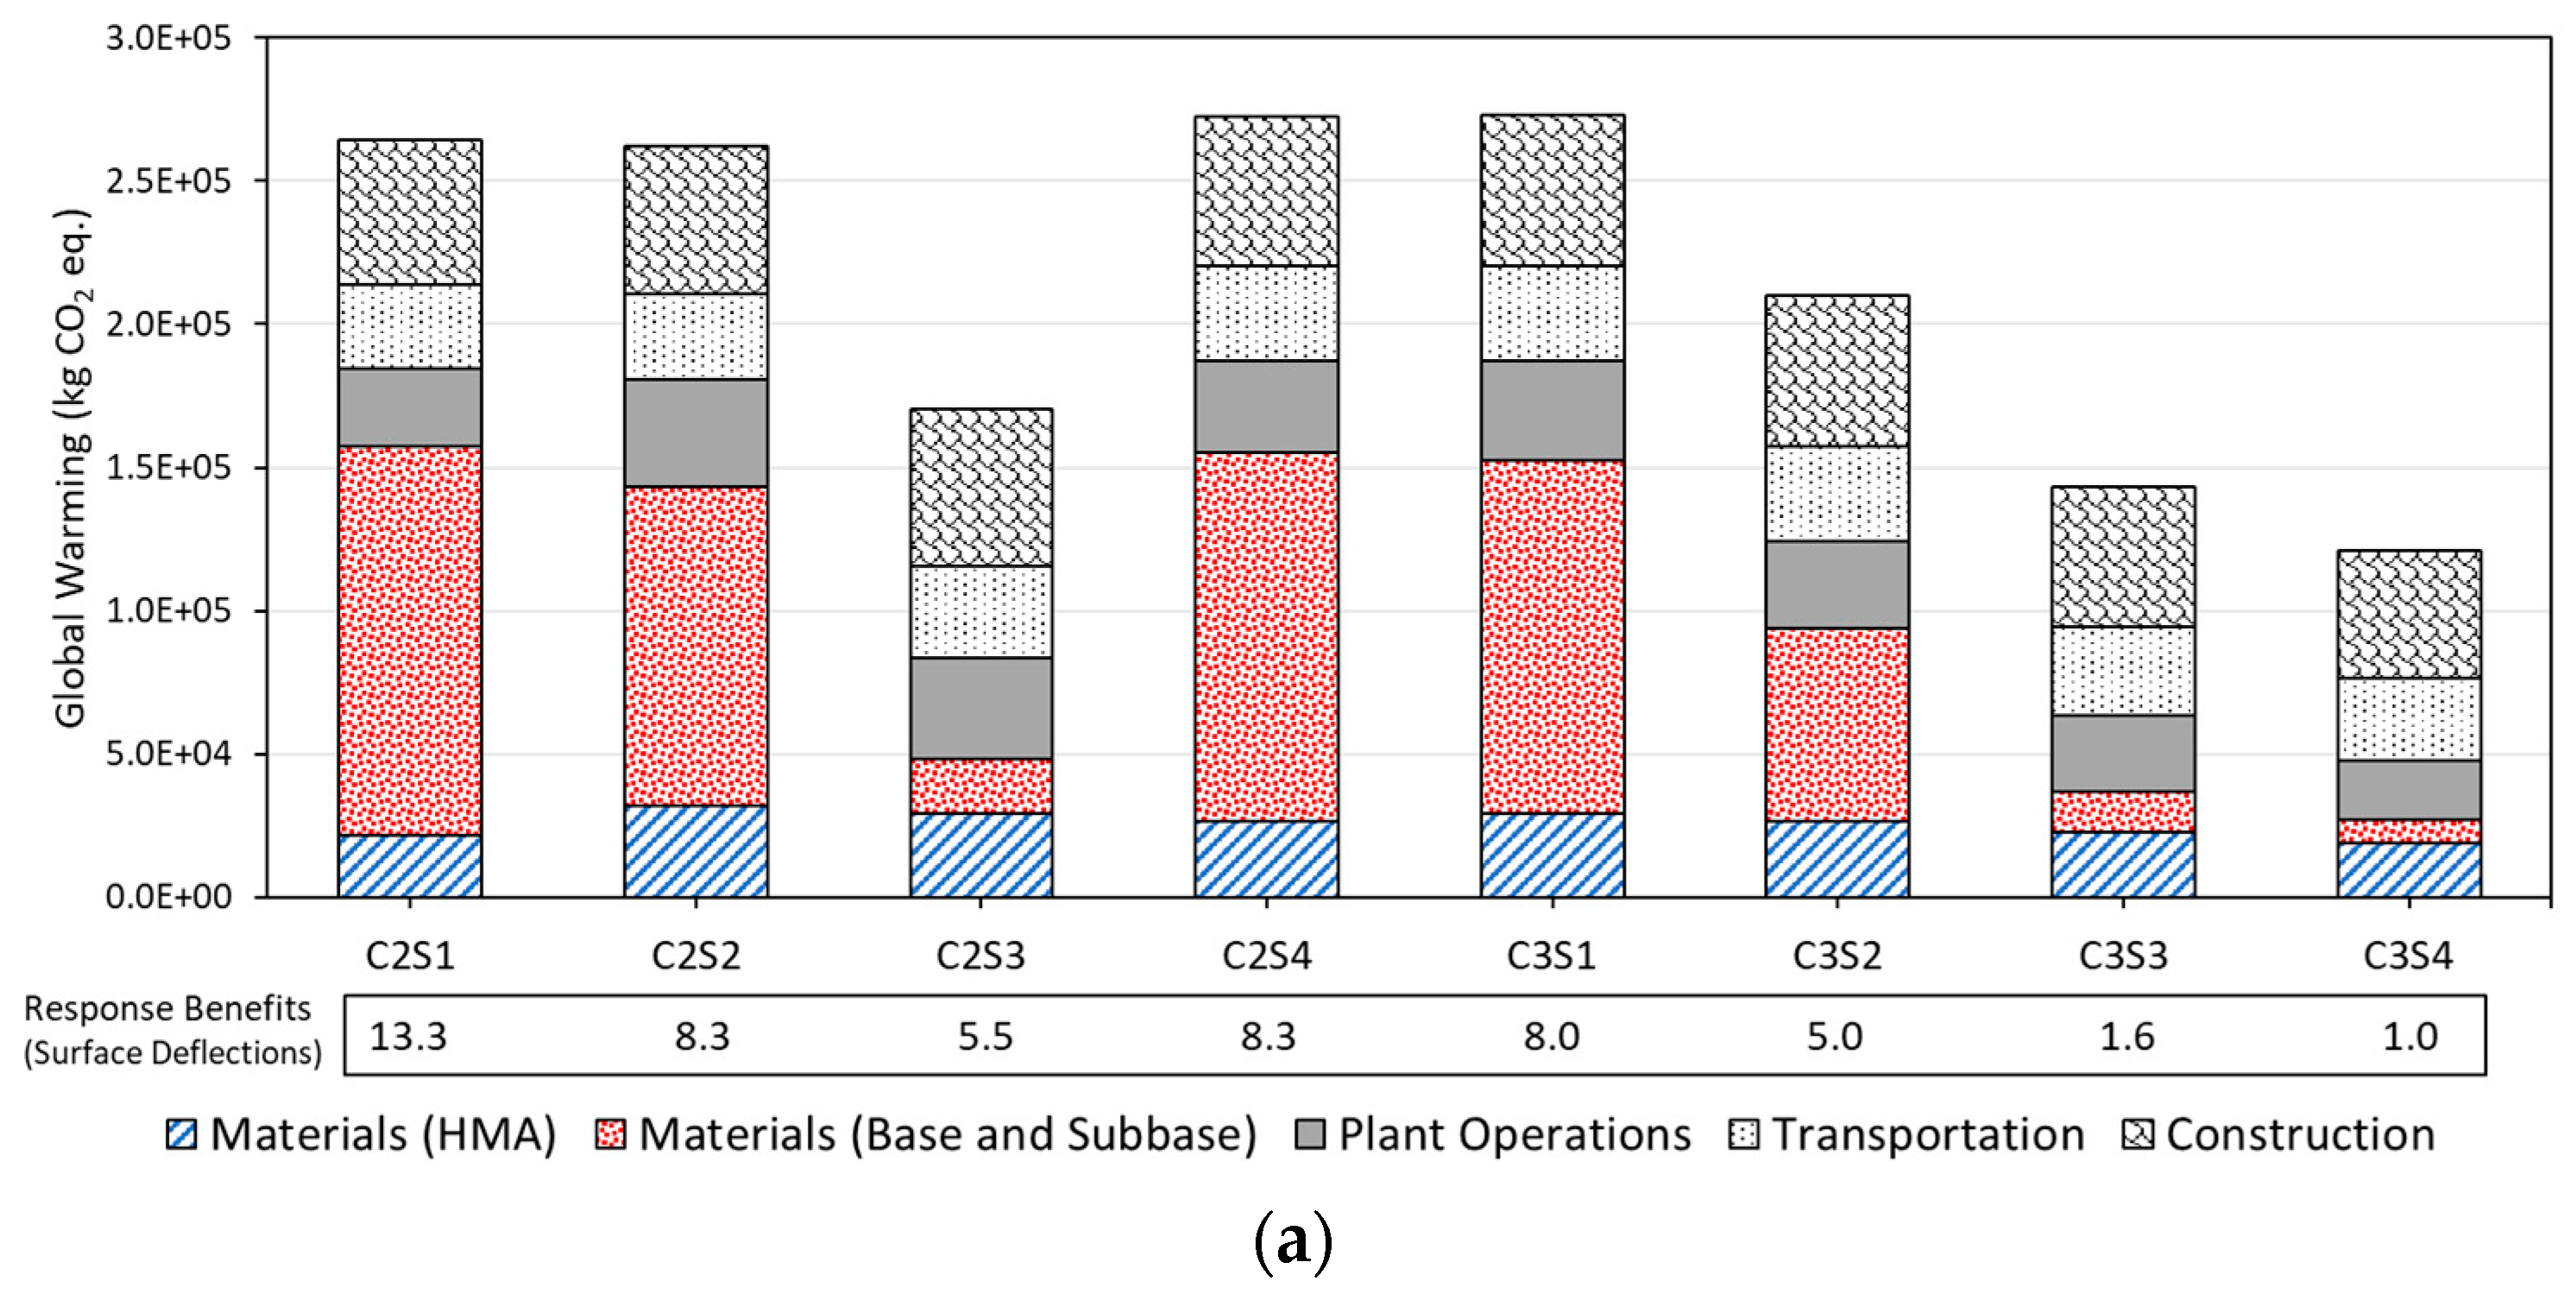
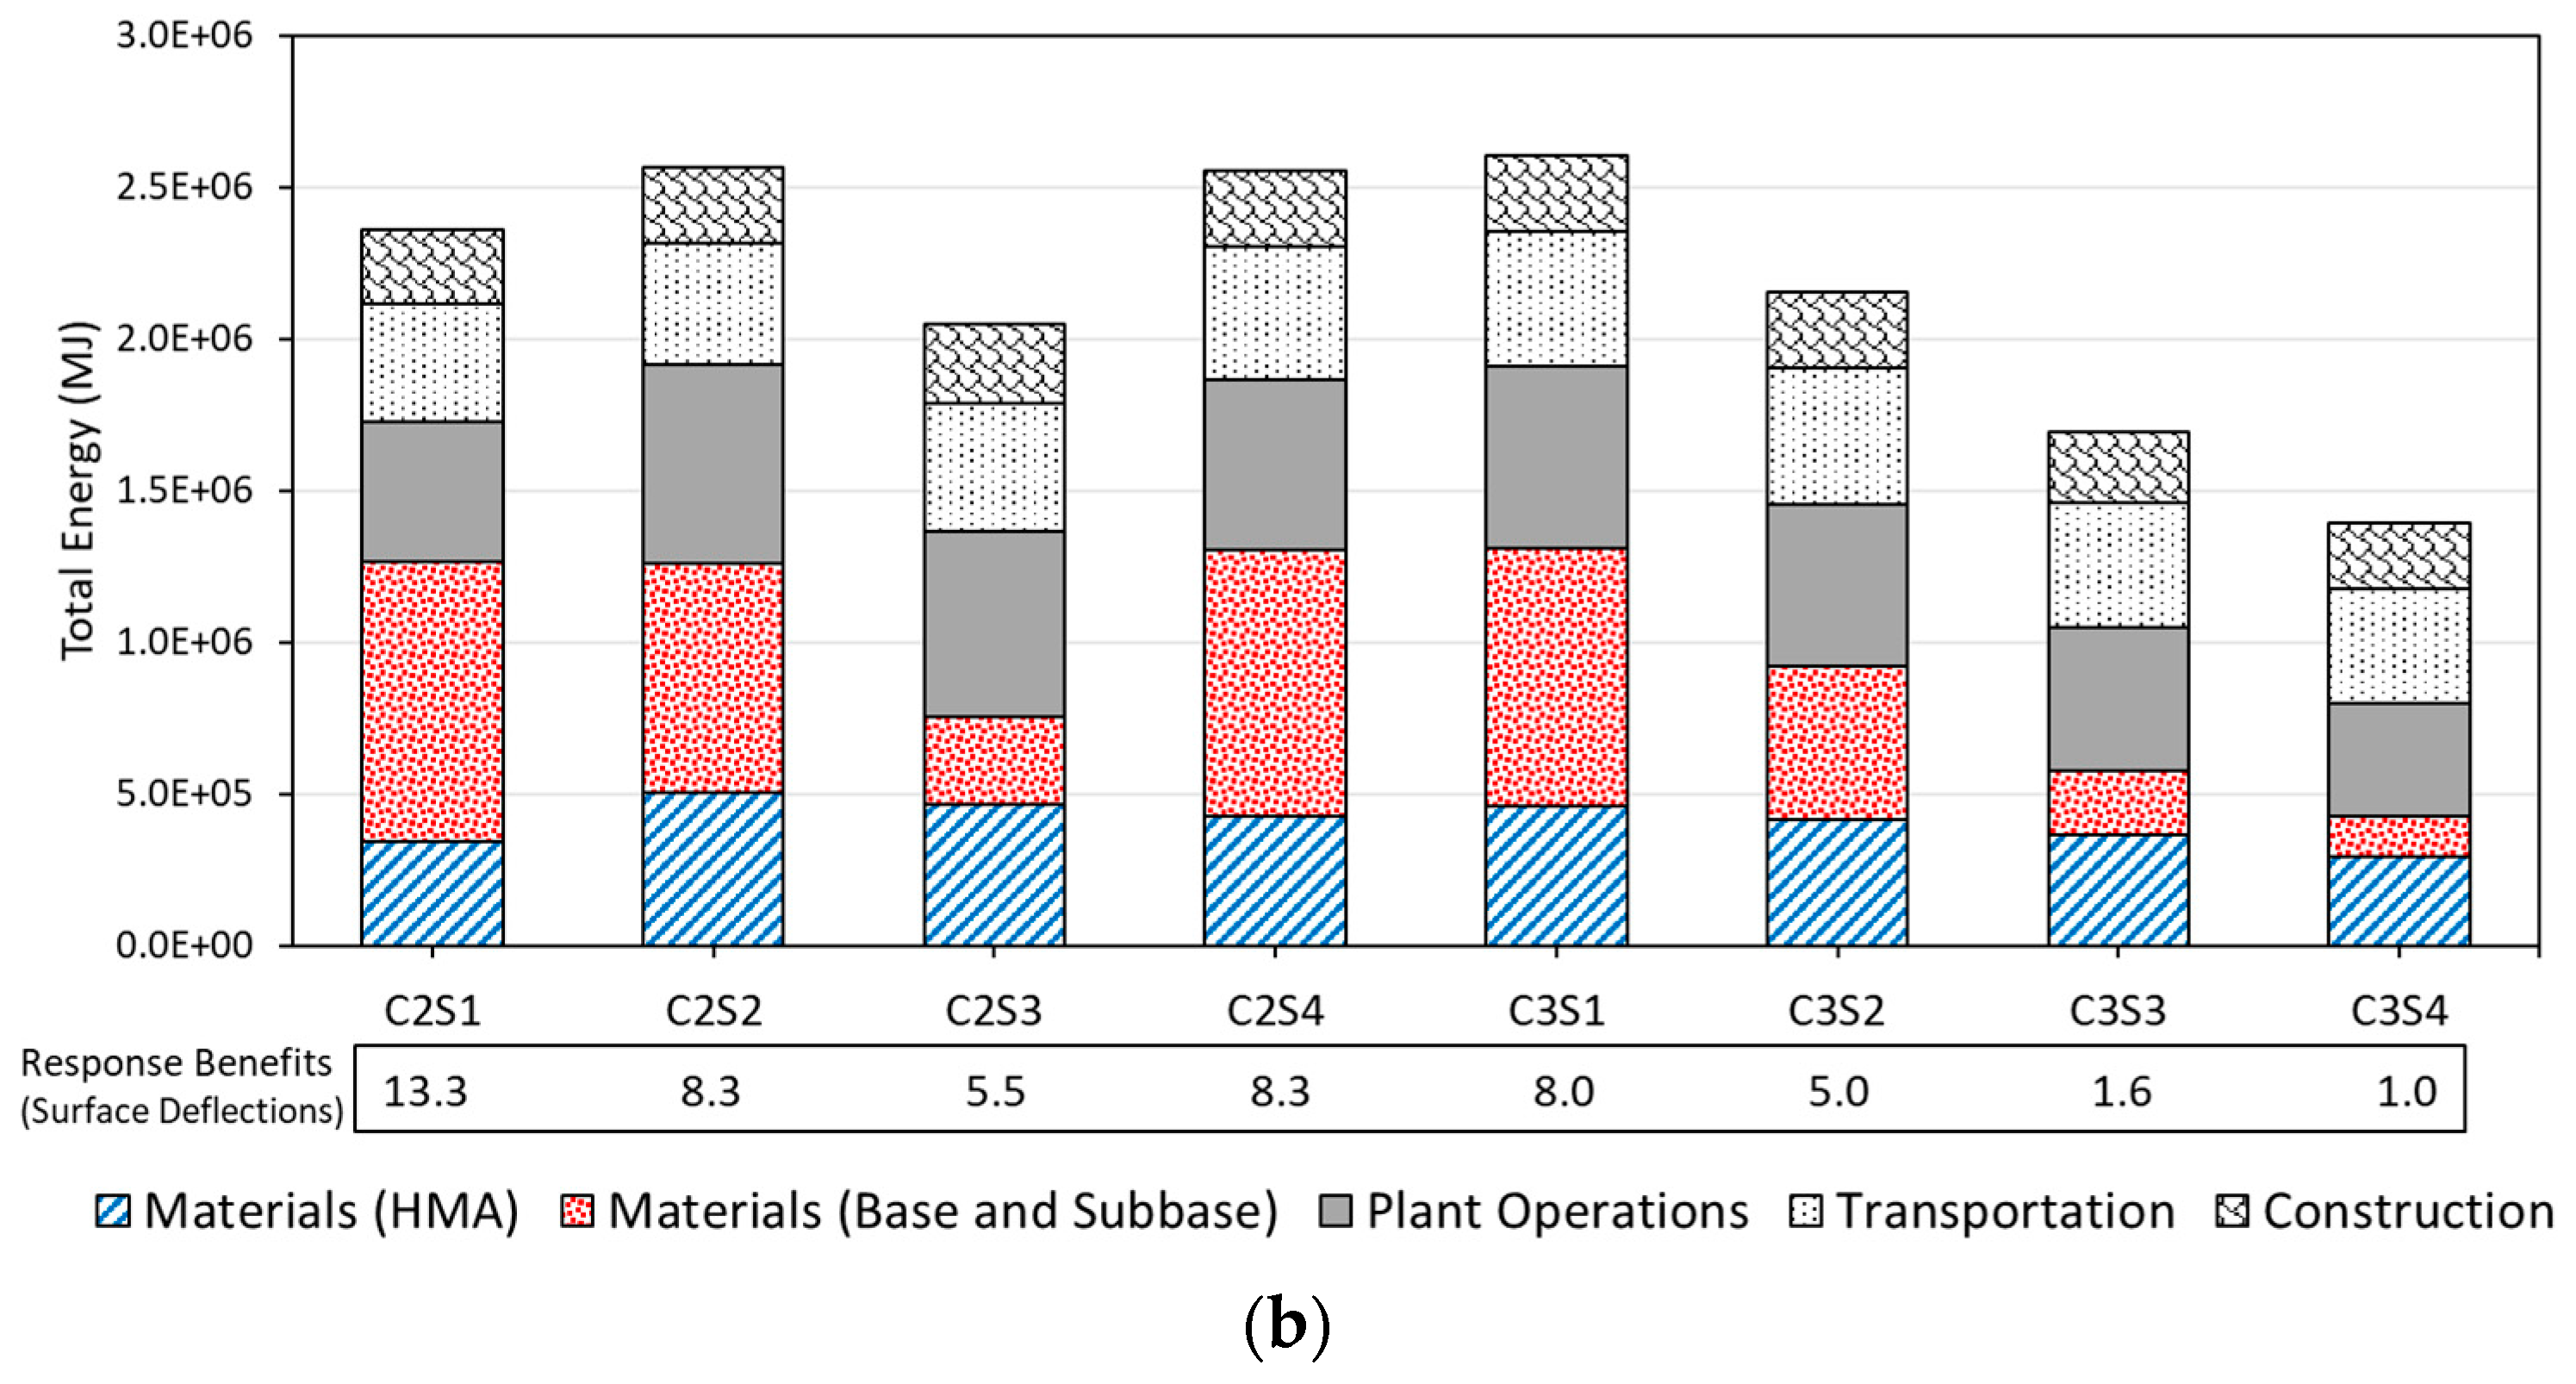
The global warming potential (GWP) and the total energy demand (TED) for the compared pavement sections in Scenario #1 are presented in Figure 4a,b, respectively. For both GWP and TED, the pavement section with the conventional aggregate base (i.e., C3S4) had the lowest environmental impacts, followed by the sections constructed with a fly ash-stabilized QB subbase (C3S3) and base (C2S3), respectively. The major difference in GWP impact among the eight test sections stemmed from the contribution of the base and subbase materials, since the thicknesses of the HMA layers in each section were similar. Specifically, the test sections comprising a cement-stabilized QB base/subbase had significantly higher impacts than those with conventional or fly ash-stabilized base materials. This was largely due to the high CO2 emissions associated with the production of cement. The same trends and observations could also be made for the total energy demand.
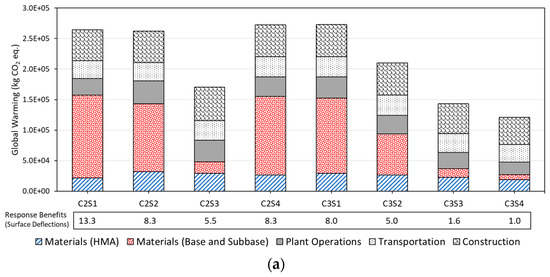
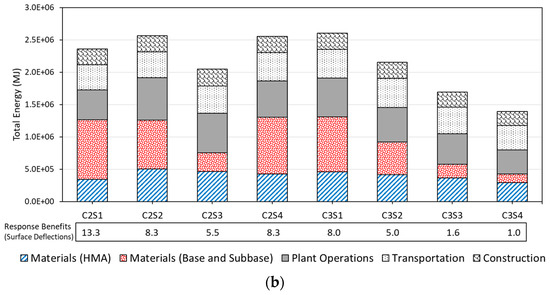
Figure 4.
Comparisons of the (a) global warming potentials and (b) total energy demands for the eight alternative designs in Scenario #1.
The differences in the GWP and TED for the HMA materials were mainly due to the variations of the average HMA thickness in the constructed test sections. Additionally, it was noted that the transportation and construction activities had relatively similar impacts for GWP and TED for the different test sections; the main discrepancies in impacts amongst the different test sections were largely attributed to materials production and plant operations. The GWP impacts of pavements constructed with a cement-stabilized QB base (i.e., C2S1, C2S2, C2S4, and C3S1) were about 2 to 2.5 times higher than those of the pavements constructed with conventional aggregates, while the TEDs were about 1.5 to 2 times higher for the same test sections.
To complement the LCA outcome with a performance criterion that considers the life expectancy calculations, a mechanistic input was developed to indicate data for actual structural performance. The ‘response benefit’ term was introduced as a parameter to compare the section responses using data directly obtained from the field. Figure 4 shows the results of GWP and TED accompanied by the response benefit based on surface deflections. The response benefit is used to meaningfully interpret the structural adequacies and advantages of constructing pavement sections utilizing QB. The parameter compares the pavement application under consideration with the conventional pavement section (C3S4) using the maximum resilient deflections measured using FWD. Detailed FWD data and the detailed calculations can be found elsewhere [4,10,12]. A higher response benefit indicates a stronger section and, thus, higher structural capacity. Higher response benefits are also indicative of better performance during the use phase, which is eliminated from the LCA system boundaries. The response benefit is calculated using the following equation:
where D0 (i) = FWD center deflection for section ‘i’, and D0 (C3S4) = FWD center deflection for the conventional flexible pavement (control) test section C3S4.
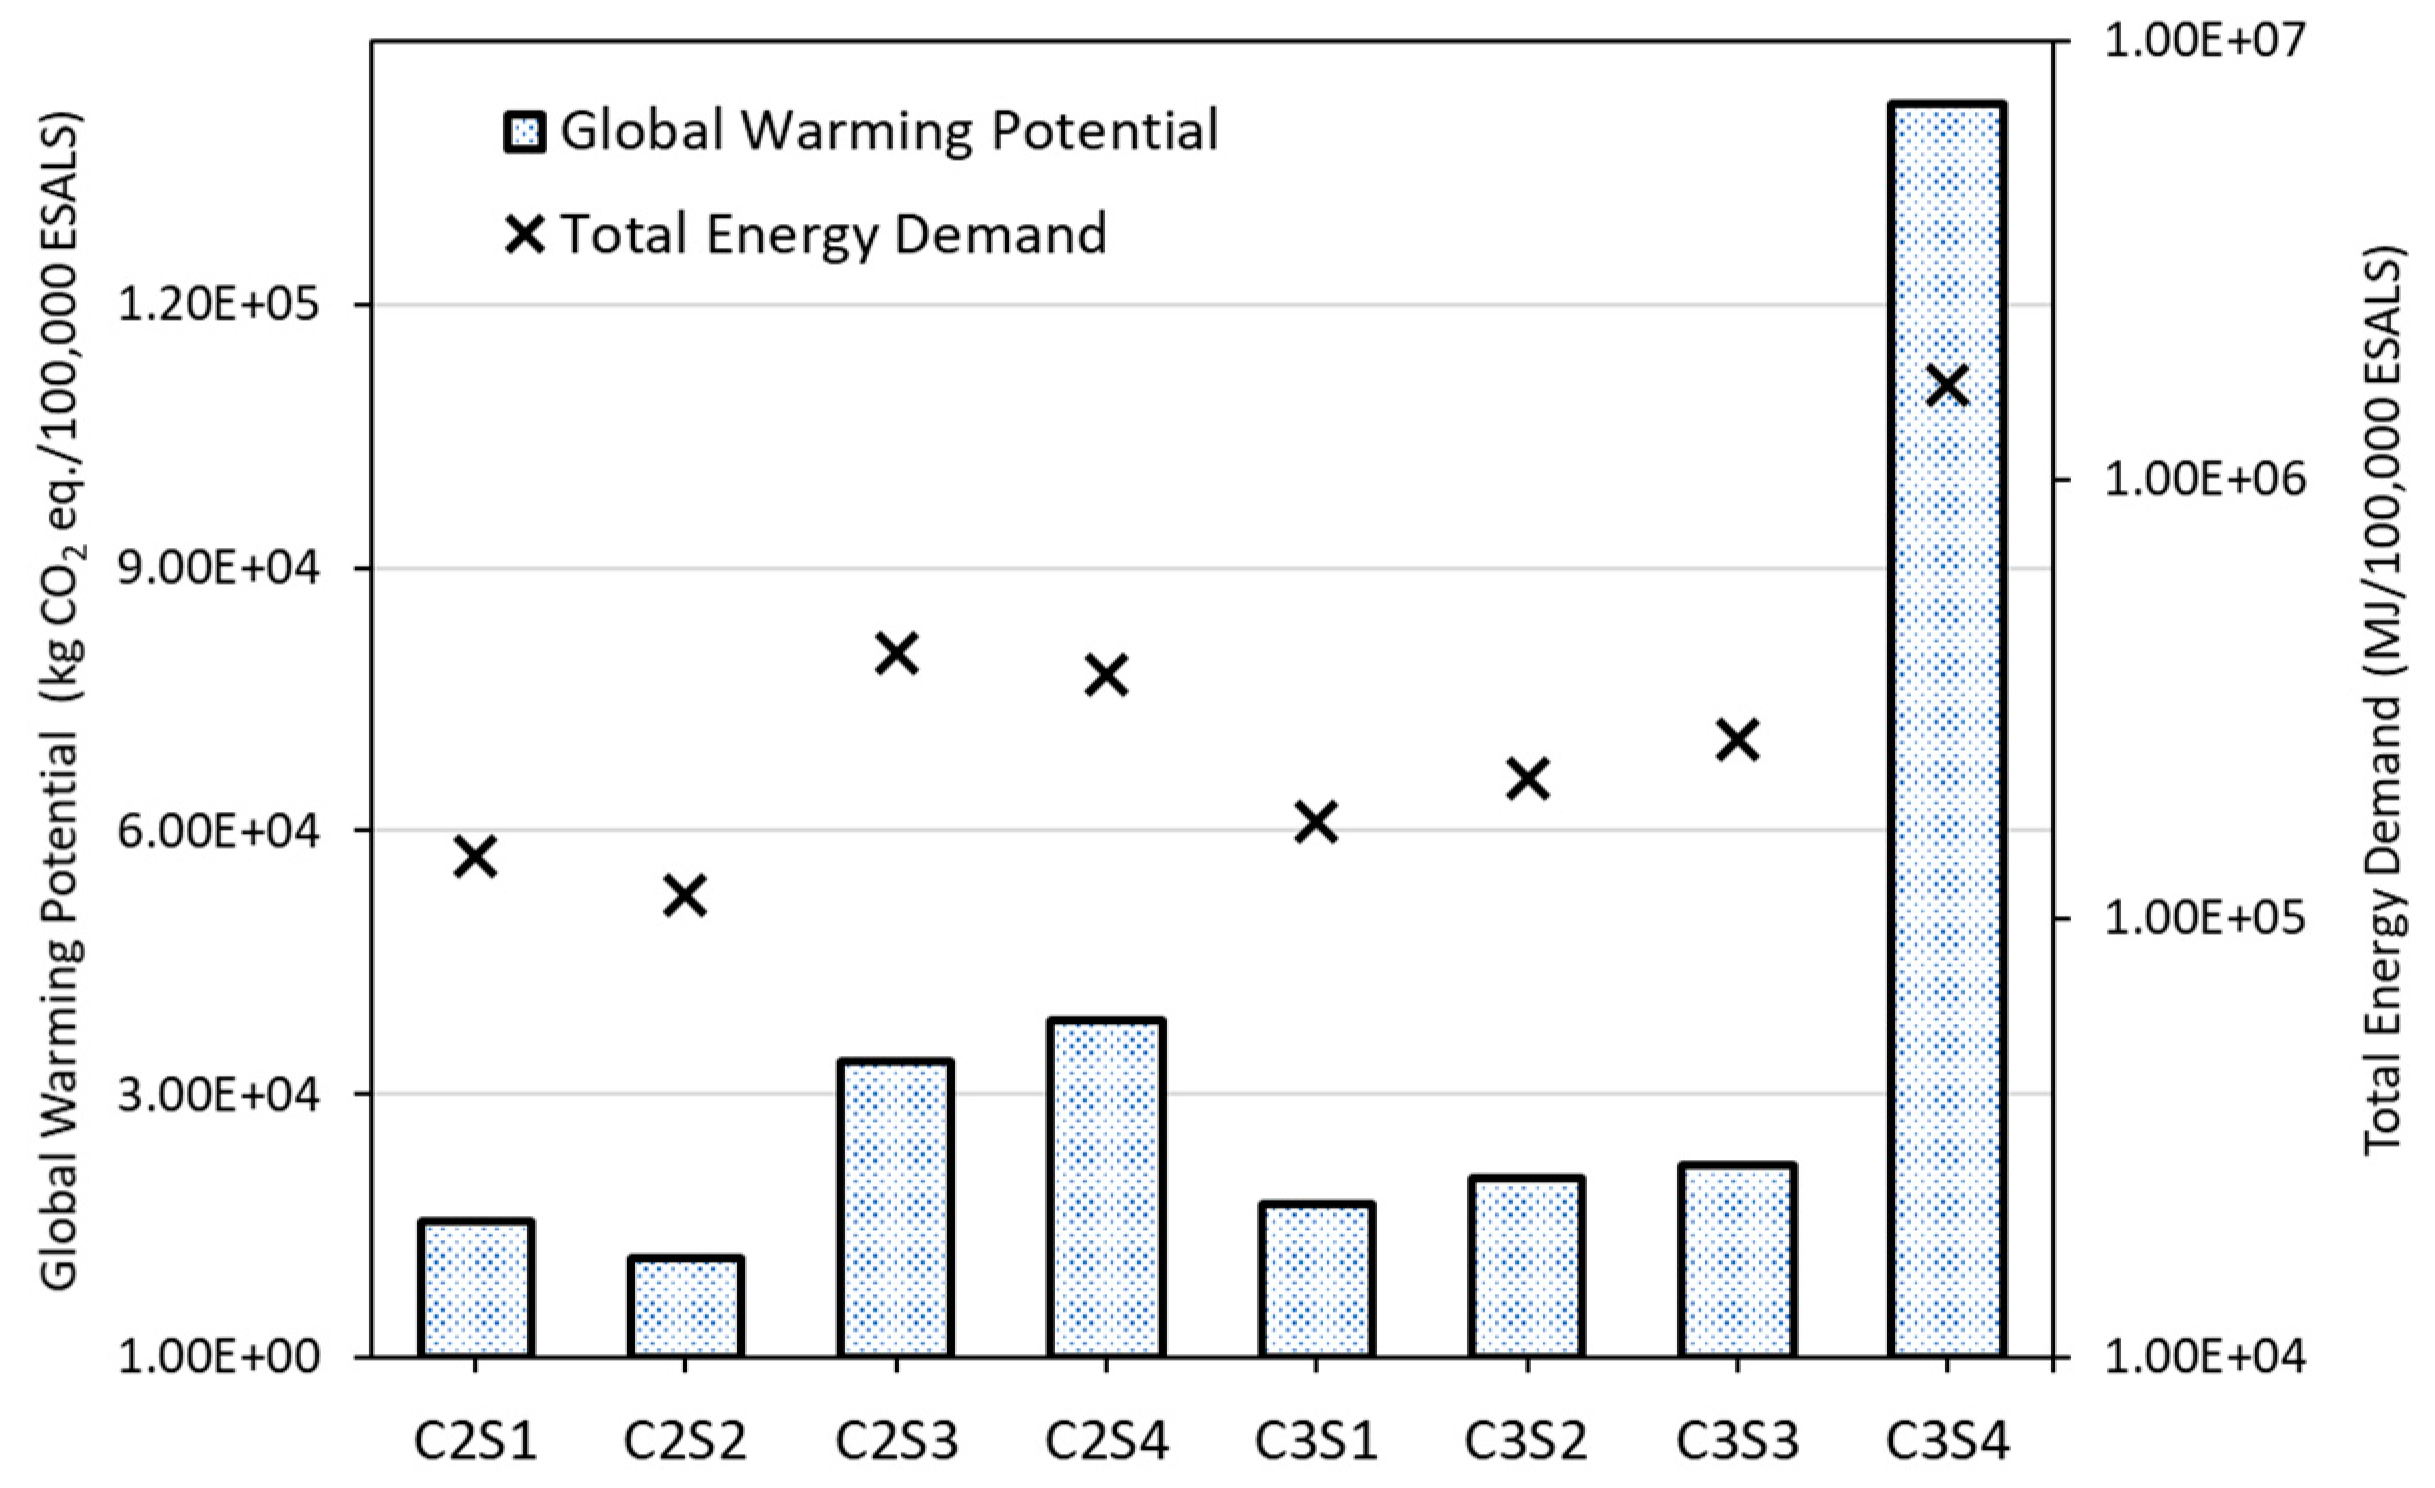
Given that the life expectancies of the compared pavement sections may vary widely, another analysis was performed to determine the normalized impacts of each constructed test section based on performance. This was needed, since the use stage was not fully considered in the scope. Since data on rutting accumulation were collected from accelerated pavement testing, the number of wheel passes required to accumulate a 12.5-mm (0.5-in.) rutting was extrapolated for this analysis and converted to equivalent single-axle loads (ESALs). The extrapolation was based on a piecewise regression to fit each portion of the rutting curve for each pavement section with a best fit regression equation. For all stabilized QB test sections, the linear fit of the rutting data between 30,000 and 100,000 passes was adequate (coefficient of determination values ranged between 0.946 and 0.986). The detailed calculations can be found elsewhere [10]. For C3S4, the number of APT load repetitions to accumulate 12.5 mm (0.5 in.) of rutting and the corresponding ESALs were estimated as 56,219 passes and 84,891 ESALs, respectively, and no extrapolation was required. Details on the rutting progression of the various test sections, extrapolated number of passes for 12.5 mm (0.5 in.) of rutting, and the corresponding ESALs are summarized in Figure 5.
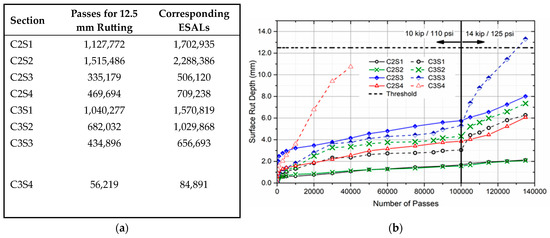
Figure 5.
Scenario #1. (a) Estimated APT load repetitions and ESALs for a 12.5-mm surface rut depth, and (b) measured wheel path surface rutting.
The GWP and TED results can thus be normalized to determine these impacts per 100,000 ESALs trafficked. These results are presented in Figure 6. Based on the total impacts calculated for constructing each test section and the performance data collected, the lowest impacts were calculated for C2S1 and C2S2 constructed with cement-stabilized QB mixed with FRAP and FRCA, respectively. Significantly higher GWP and TED impacts were calculated for C3S4, largely due to the low number of passes until failure for that section. Additionally, the two sections constructed with fly ash-stabilized QB bases/subbases (i.e., C2S3 and C3S3) accumulated higher GWP and TED impacts when compared to the cement-stabilized QB sections (excluding section C2S4). The normalized impacts imply that the high environmental impacts associated with cement to stabilize the QB layers can be balanced or eliminated when the pavement performance is taken into consideration. According to the normalized results with actual performance during the APT, the sections with cement stabilization can be considered as the most environmentally friendly and cost competitive.
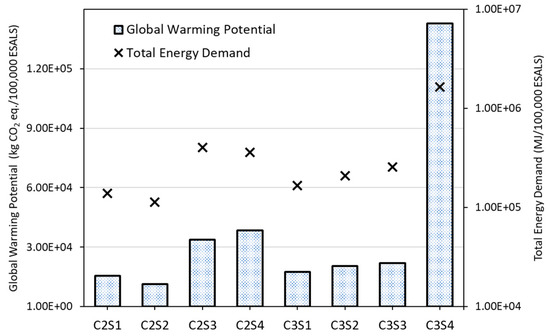
Figure 6.
Normalized GWP and TED for each 100,000 ESALs trafficking each pavement section in Scenario #1.
4.2. Scenario #2: As-Designed Pavement Sections
Scenario #1 presented crucial information on the performance trends and environmental impacts of constructing the proposed QB applications. However, the two shortcomings of Scenario #1 are (1) the variability in layer thicknesses due to construction nonuniformities and (2) the constructed conventional section (C3S4) having a relatively low HMA thickness, a weaker base, and low subgrade modulus compared to the other sections due to some moisture intrusion. These two issues can be eliminated by considering the as-designed pavement sections with identical target layer thicknesses in Scenario #2. Further, Scenario #2 assumes a properly constructed conventional section with proper modulus assignments in pavement layers for a fair comparison. Note that, like the evaluation conducted for Scenario #1, the comparison of environmental impacts for the pavement sections considered in Scenario #2 is not on a one-to-one basis due to the different pavement responses, field performance, and pavement life expectations.
The GWP and TED for the compared pavement sections are presented in Figure 7a,b, respectively. For both GWP and TED, all pavement sections essentially have the same impacts for HMA production and transportation, since the mix designs, HMA thicknesses, and quantities are identical. The impacts of the base/subbase materials are significantly higher for the cement-stabilized bases (Sections 1, 2, 4, and 5) when compared to the conventional section. These impacts are 12–13 times higher for GWP and 4.5–4.9 times higher for TED, mostly due to the high impacts of producing cement. This difference is seen to a lower extent in Section 6 with a cement-stabilized QB subbase (inverted pavement) due to the lower thickness of the cemented layer. When compared to the conventional aggregate base section, the impacts of the fly ash-stabilized QB pavements are only 19–54% higher for both TED and GWP. These higher impacts could be alleviated when the pavement performance and lifespans were considered.
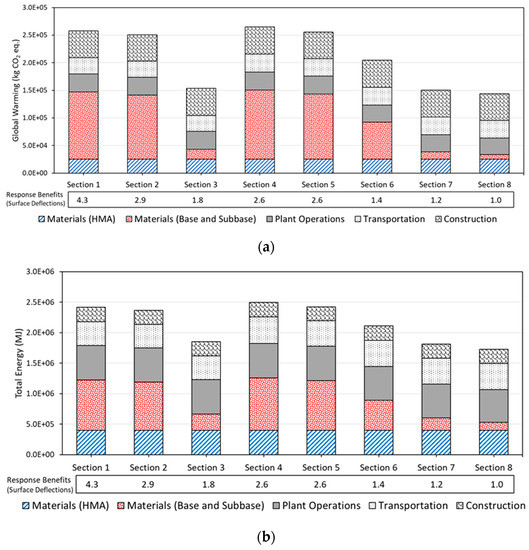
Figure 7.
Comparisons of (a) global warming potentials and (b) total energy demands for the eight alternative designs in Scenario #2 with the target layer thicknesses.
The response benefits calculated for each pavement structure, based on the predicted resilient FWD surface deflections relative to those predicted for the conventional section (Section 8), are also reported in Figure 7. The resilient FWD surface deflections were predicted by modeling the pavement sections with as-designed (or target) layer thicknesses and assigning the modulus values obtained from backcalculation of the layer moduli from measured FWD deflections for the constructed test sections. More details on the backcalculation process can be found elsewhere [10,12]. Note that the response benefits are significantly lower than those reported in Scenario #1, largely due to proper modulus assignments for the conventional pavement section and the underlying subgrade and due to considering an adequate thickness of the overlying HMA layer. Nevertheless, the benefits of constructing pavement sections with stabilized QB applications are evident from the higher response benefits of the QB sections, particularly those where cement is used as the chemical stabilizer.
For plant operations, Sections 1–5 have 10% higher GWP impacts and 5% higher TED when compared to the conventional section. The impacts of plant operations are 5% and 2.3% higher for GWP and TED, respectively, for the inverted pavement in Sections 6 and 7. These higher impacts are attributed to the plant mixing operations for the stabilized QB materials (using a batch pugmill). The transportation and construction impacts were relatively similar for all eight sections, and the slight differences were due to the differences in the compacted densities of the materials, which directly affected the weights of the materials hauled, placed, and compacted.
4.3. Scenario #3: Proposed Pavement Sections
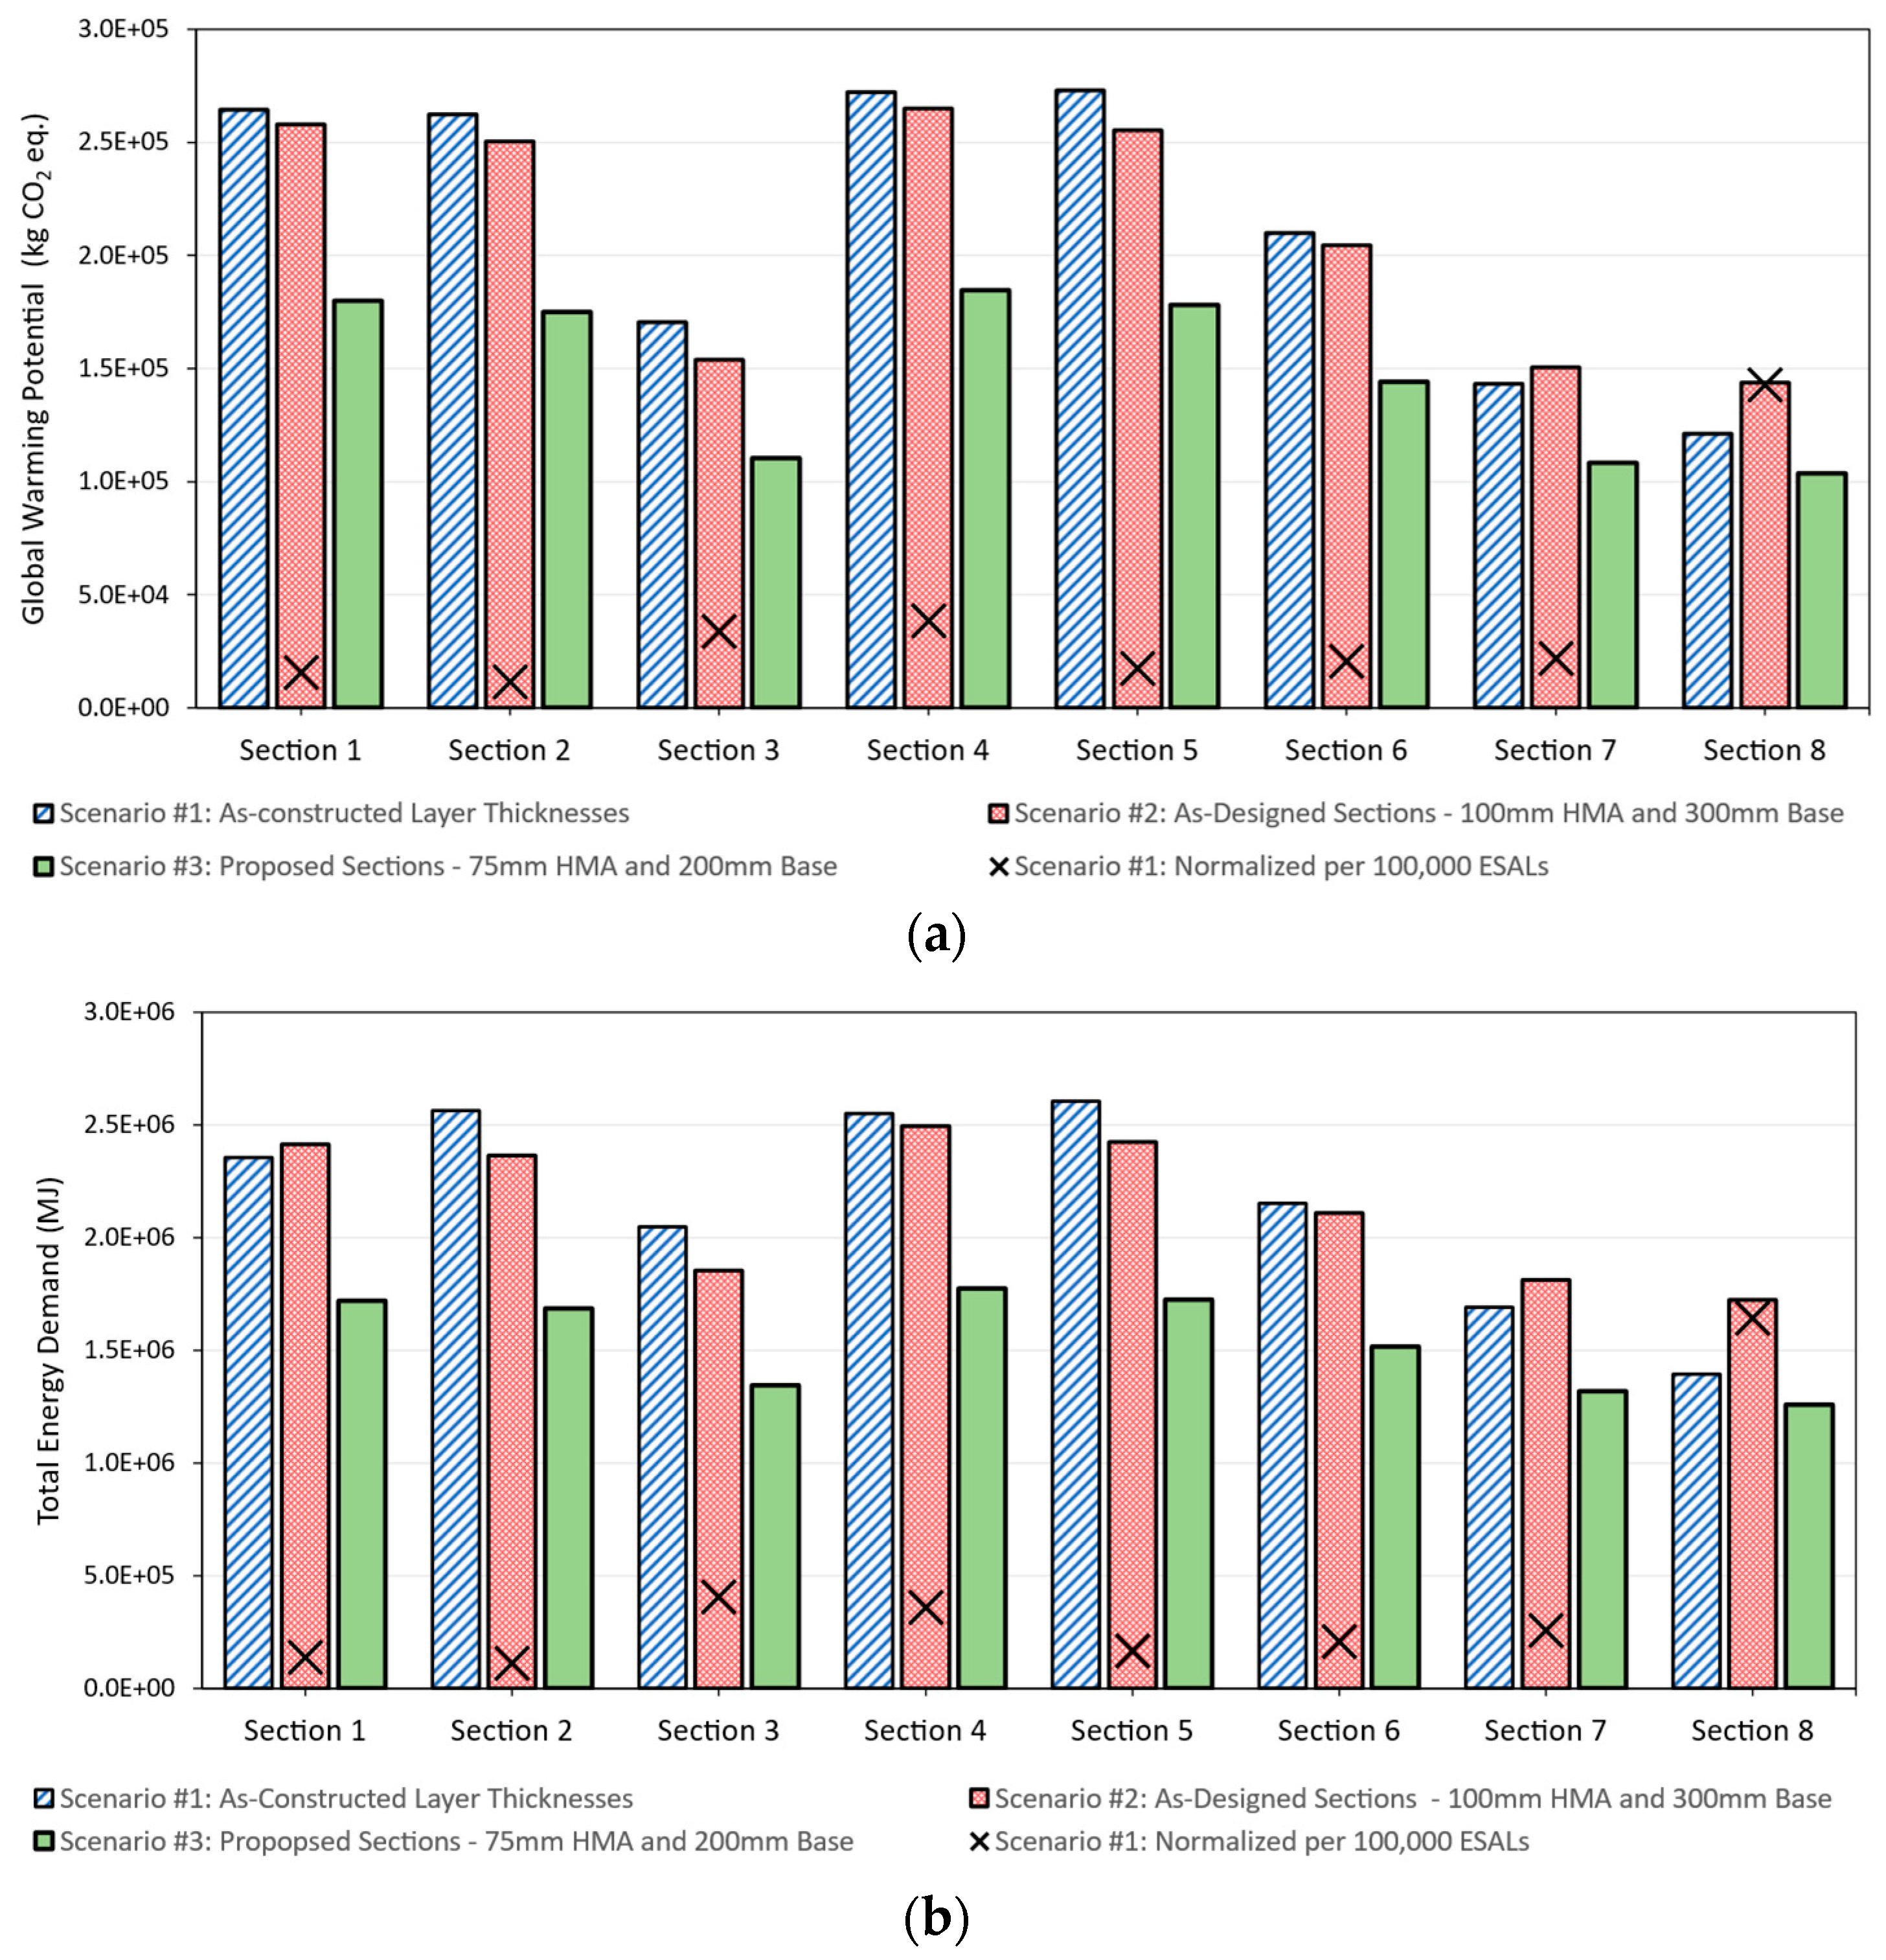
The LCA results for the third scenario of the proposed thinner pavement sections, with an HMA thickness of 76 mm (3 in.) and a base thickness of 203 mm (8 in.), are presented in Figure 8a,b, respectively. The total GWP and TED for the compared pavement sections are only presented because these trends for the separate unit processes (i.e., materials acquisition, plant operations, and transportation and construction) are proportional and in good agreement with those previously reported for Scenario #2. These proposed pavement sections are more suited for low-volume roads and local roads, where a lower structural capacity is needed for the same design period. Overall, these sections had lower impacts than those in the first two scenarios due to the reduced pavement layer thicknesses.
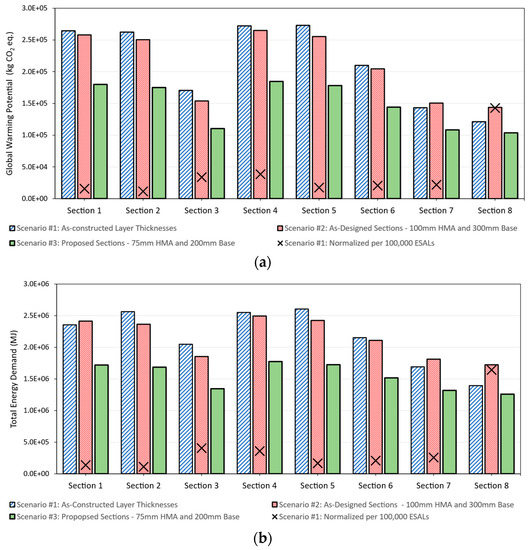
Figure 8.
Summary of (a) the GWP, and (b) the TED for all LCA scenarios (1 in. = 25.4 mm).
Figure 8 also shows a summary of the total GWP and TED computed for the three scenarios, along with the normalized impacts per 100,000 ESALs trafficked for Scenario #1 in order to compare all three scenarios side by side. The results from the LCA analysis showed that, due to the high environmental burdens associated with the production of cement, the materials acquisition stage for the cement-stabilized sections had the highest impact in all three scenarios. For the fly ash-stabilized QB sections and the conventional test section, the plant operations or construction stages resulted in the highest impacts. When the normalized impacts in Scenario #1 and the response benefits (based on FWD resilient deflections) reported for the pavement sections in the three scenarios are considered, it can be realized that the cement-stabilized test sections, particularly those with QB blended with FRAP/FRCA, can have relatively lower initial GWP and TED from the materials and construction stages normalized over pavement life and anticipated traffic.
5. Summary and Conclusions
A comprehensive sustainability assessment of quarry by-product (QB) pavement applications was conducted combining life cycle assessment (LCA) with the pavement performance data obtained from full-scale tests [10,11]. The conducted LCA followed the structure recommended by ISO 14044:2006 and FHWA’s pavement LCA framework [13,14]. Due to uncertainties that may occur during the construction, design, and use stages of these products, three analysis scenarios were considered. The first scenario evaluated the environmental impacts of field constructed pavement test sections by considering the actual constructed layer thicknesses. The second scenario considered the as-designed or target layer thicknesses (102 mm or 4 in. of HMA and 305 mm or 12 in. base) to eliminate the field variability. The third scenario considered proposed thinner pavement structures (76 mm or 3 in. of HMA and 203 mm or 8 in. of base) to target applications for low-volume and local roads.
Each of the three scenarios analyzed eight pavement sections with cement- and fly ash-stabilized QB material combinations and one conventional pavement section. The first five test sections had a chemically stabilized QB or blends of QB with recycled coarse fractionated aggregates. The next two sections were inverted pavements, and Section 8 had a conventional aggregate base. Actual field performance trends from accelerated pavement testing were used to normalize the sustainability impacts to present the results for each 100,000 ESALs trafficked in the first scenario. The response benefit, measured as the ratio of the falling weight deflectometer (FWD) maximum center deflection of the conventional pavement section to that of the pavement section considered, was reported for each pavement section. These results indicated that savings in environmental impacts can be anticipated from constructing pavements with chemically stabilized QB base and subbase layers when the use stage benefits (i.e., higher anticipated traffic volumes and pavement lives) are reported.
The LCA results of the flexible pavement sections with stabilized QB applications provide guidelines for situations where the use of cement- or fly ash-stabilized QB base/subbase layers can provide affordable and sustainable pavement designs without compromising performance. Based on the LCA results, it is evident that the use of stabilized QB layers can be suited for scenarios where higher traffic loads and volumes are expected. This is the result of the higher stiffness characteristics of the stabilized layers, which deflect less and sustain more load repetitions in the use stage, thus possibly leading to environmental and cost-saving benefits. As such, applications of stabilized QB pavement layers can be especially attractive as an option for constructing more sustainable and longer-lasting local roads or higher-volume county roads or collector/arterial roads with lower carbon footprints and energy demands. Therefore, policymakers and industry leaders should consider these findings when aiming to mitigate the effects of climate change and promote sustainable development.
Future research is recommended to perform a complete LCA by including the use, maintenance, and end of life stages. As the material and structural configurations change with the use of innovative materials, mix designs, and structures like inverted sections, the life cycle consequences can be significant. Such a comprehensive analysis will be possible when the long-term performance of the evaluated applications is fully understood, which is not currently known from test sections evaluated by accelerated pavement testing.
Author Contributions
Conceptualization, I.I.A.Q., E.T. and H.O.; methodology, I.I.A.Q., E.T. and H.O.; validation, I.I.A.Q. and H.O.; formal analysis, I.I.A.Q.; resources, I.I.A.Q.; data curation, I.I.A.Q. and H.O.; writing—original draft preparation, I.I.A.Q.; writing—review and editing, I.I.A.Q., E.T. and H.O.; visualization, I.I.A.Q.; supervision, H.O. and E.T.; project administration, E.T.; and funding acquisition, E.T. All authors have read and agreed to the published version of the manuscript.
Funding
This research received no external funding.
Institutional Review Board Statement
Not applicable.
Informed Consent Statement
Not applicable.
Data Availability Statement
The data presented in this study are available on request from the corresponding author.
Acknowledgments
This publication is based on the results of ICT-R27-168 Project: ‘Field Performance Evaluation of Sustainable Aggregate By-product Applications’ [4]. ICT-R27-168 was conducted in cooperation with the Illinois Center for Transportation, the Illinois Department of Transportation, and the U.S. Department of Transportation, Federal Highway Administration. The authors would like to acknowledge the members of IDOT Technical Review Panel (TRP) for their useful advice at different stages of this research. The contents of this paper reflect the view of the authors, who are responsible for the facts and the accuracy of the data presented herein. The contents do not necessarily reflect the official views or policies of the Illinois Center for Transportation, the Illinois Department of Transportation, or the Federal Highway Administration. This paper does not constitute a standard, specification, or regulation.
Conflicts of Interest
The authors declare no conflict of interest. The funders had no role in the design of the study; in the collection, analyses, or interpretation of the data; in the writing of the manuscript; or in the decision to publish the results.
References
- Harvey, J.; Meijer, J.; Kendall, A. Life Cycle Assessment of Pavements; Tech Brief No. FHWA-HIF-15-001; Transportation Reseach Record; Federal Highway Association: Washington, DC, USA, 2014.
- Chesner, W.H.; Collins, R.J.; MacKay, M. User Guidelines for Waste and By-Product Materials in Pavement Construction; Publication FHWA-RD-97-148; FHWA, U.S. Department of Transportation: Washington, DC, USA, 1998.
- Stroup-Gardiner, M.; Wattenberg-Komas, T. Recycled Materials and Byproducts in Highway Applications. Volume 4: Mineral and Quarry By-Products; NCHRP Synthesis of Highway Practice (Project 20-05, Topic 40-01); Transportation Research Board: Washington, DC, USA, 2013. [Google Scholar]
- Qamhia, I.; Tutumluer, E.; Ozer, H. Field Performance Evaluation of Sustainable Aggregate By-Product Applications; Final Report FHWA-ICT-18-016; Illinois Center for Transportation/Illinois Department of Transportation: Rantoul, IL, USA, 2018. [Google Scholar]
- Tutumluer, E.; Ozer, H.; Hou, W.; Mwumvaneza, V. Sustainable Aggregates Production: Green Applications for Aggregate By-Products; Final Report FHWA-ICT-15-012; Illinois Center for Transportation/Illinois Department of Transportation: Rantoul, IL, USA, 2015. [Google Scholar]
- Mwumvaneza, V.; Hou, W.; Tutumluer, E.; Al-Qadi, I.L.; Beshears, S. Characterization and Stabilization of Quarry Byproducts for Sustainable Pavement Applications. Transp. Res. Rec. J. Transp. Res. Board 2015, 2509, 1–9. [Google Scholar] [CrossRef]
- LaHucik, J.; Schmidt, S.; Tutumluer, E.; Roesler, J. Characterization of Cement Treated Base Course Using Reclaimed Asphalt Pavement, Aggregate By-Products, and Macro-Synthetic Fibers. In Proceedings of the Geo-Chicago Conference, Chicago, IL, USA, 14–18 August 2016; pp. 523–533. [Google Scholar]
- Tutumluer, E.; Qamhia, I.; Ozer, H. Field Performance Evaluations of Sustainable Aggregate By-Product Applications. Keynote Paper. In Proceedings of the International Symposium on Geotechnics of Transportation Infrastructure (ISGTI), Delhi, India, 7–8 April 2018. [Google Scholar]
- Qamhia, I.; Cheung, J.; Hou, W.; Mwumvaneza, V.; Ozer, H.; Tutumluer, E. Gradation Effects on the Strength Properties of Cement and Fly Ash Stabilized Quarry By-Products. In Geo-Chicago 2016; Procedia Engineering; ASCE: Reston, VA, USA, 2016; Volume 143, pp. 911–920. [Google Scholar]
- Qamhia, I. Sustainable Pavement Applications Utilizing Quarry By-Products and Recycled/Nontraditional Aggregate Materials. Doctoral Dissertation, University of Illinois Urbana-Champaign, Champaign, IL, USA, 2019. [Google Scholar]
- Qamhia, I.; Tutumluer, E.; Ozer, H.; Shoup, H.; Beshears, S.; Trepanier, J. Evaluation of Chemically Stabilized Quarry Byproduct Applications in Base and Subbase Layers through Accelerated Pavement Testing. Transp. Res. Rec. J. Transp. Res. Board 2019, 2673, 259–270. [Google Scholar] [CrossRef]
- Qamhia, I.; Tutumluer, E.; Ozer, H.; Solanki, P. Mechanistic Analysis and Modeling of Pavement Sections Utilizing Sustainable Aggregate Quarry By-Product Applications. Transp. Res. Rec. J. Transp. Res. Board, 2020; in press. [Google Scholar]
- Qamhia, I.; Tutumluer, E.; Ozer, H.; Boler, H.; Shoup, H.; Stolba, A. Durability Aspects of Chemically Stabilized Quarry By-product Applications in Pavement Base and Subbase. Transp. Res. Rec. J. Transp. Res. Board 2020, 2674, 339–350. [Google Scholar] [CrossRef]
- ISO, EN. 14044:2006; Environmental Management-Life Cycle Assessment-Requirements and Guidelines. European Committee for Standardization: Brussels, Belgium, 2006.
- Harvey, J.; Meijer, J.; Ozer, H.; Al-Qadi, I.L.; Saboori, A.; Kendall, A. Pavement Life Cycle Assessment Framework; Report No. FHWA-HIF-16-014; Federal Highway Administration: Washington, DC, USA, 2016.
- Yang, R.Y. Development and Implementation of Comprehensive Regionalized Pavement Life-Cycle Assessment. Doctoral Dissertation, University of Illinois at Urbana-Champaign, Champaign, IL, USA, 2017. [Google Scholar]
- Bare, J. TRACI 2.0: The Tool for the Reduction and Assessment of Chemical and Other Environmental Impacts 2.0. Clean Technol. Environ. Policy 2011, 13, 687–696. [Google Scholar] [CrossRef]
- Bare, J. The Tool for the Reduction and Assessment of Chemical and other Environmental Impacts; TRACI 2.1: User’s Manual; Document ID: S-10637-OP-1-0; U.S. Environmental Protection Agency: Washington, DC, USA, 2012.
- Ozer, H.; Yang, R.; Al-Qadi, I.L. Quantifying Sustainable Strategies for the Construction of Highway Pavements in Illinois. Transp. Res. Part D Transp. Environ. 2017, 51, 1–13. [Google Scholar] [CrossRef]
- Kang, S.; Yang, R.; Ozer, H.; Al-Qadi, I.L. Life-Cycle Greenhouse Gases and Energy Consumption for Material and Construction Phases of Pavement with Traffic Delay. Transp. Res. Rec. J. Transp. Res. Board 2014, 2428, 27–34. [Google Scholar] [CrossRef]
- Emissions and Generation Resource Integrated Database (eGRID) 2010; U.S. Environmental Protection Agency: Washington, DC, USA, 2014.
- U.S. Life Cycle Inventory Database National Renewable Energy Laboratory. 2012. Available online: https://www.lcacommons.gov/nrel/search (accessed on 21 December 2022).
- EarthShift. US-Ecoinvent Database; Version 2.2; Swiss Center for Life Cycle Inventories: St-Gallen, Switzerland, 2013. [Google Scholar]
- Kang, S.; Ziyadi, M.; Ozer, H.; Al-Qadi, I.L. Variable Impact Transportation (VIT) Model for Energy and Environmental Impact of Hauling Truck Operation. Int. J. Life Cycle Assess. 2018, 24, 1154–1168. [Google Scholar] [CrossRef]
- Halsted, G.E.; Luhr, D.R.; Adaska, W.S. Guide to Cement-Treated Base (CTB); Portland Cement Association: Skokie, IL, USA, 2006; 20p. [Google Scholar]
- Skolnik, J.; Brooks, M.; Oman, J. Fuel Usage Factors in Highway and Bridge Construction. In National Cooperative Highway Research Program Report No. 744; National Academy of Sciences: Washington, DC, USA, 2013. [Google Scholar]


Disclaimer/Publisher’s Note: The statements, opinions and data contained in all publications are solely those of the individual author(s) and contributor(s) and not of MDPI and/or the editor(s). MDPI and/or the editor(s) disclaim responsibility for any injury to people or property resulting from any ideas, methods, instructions or products referred to in the content. |
© 2023 by the authors. Licensee MDPI, Basel, Switzerland. This article is an open access article distributed under the terms and conditions of the Creative Commons Attribution (CC BY) license (https://creativecommons.org/licenses/by/4.0/).