Abstract
A more scientific, objective, and reasonable renewal orientation is gradually becoming a research hotspot in the field of industrial heritage conservation and renewal. This study selected five samples to carry out field investigation and face-to-face interviews. POI data were collected and analyzed, which revealed the relationship between environmental resources and the five samples based on the kernel density estimation method. Sequentially, we unprecedentedly created a complete BN-POI-AHP hybrid Bayesian network model that was used to implement simulation analysis of the industrial heritage of the Former Site Museum of Changchun Film Studio. A renewal orientation and a strategy for the community comprehensive sports ground were determined based on the results of the simulation data through the previous model. We eventually achieved a sustainable renewal strategy and innovative research method for industrial heritage, from objective data collection and simulation model creation to generation of a final reasonable plan.
1. Introduction
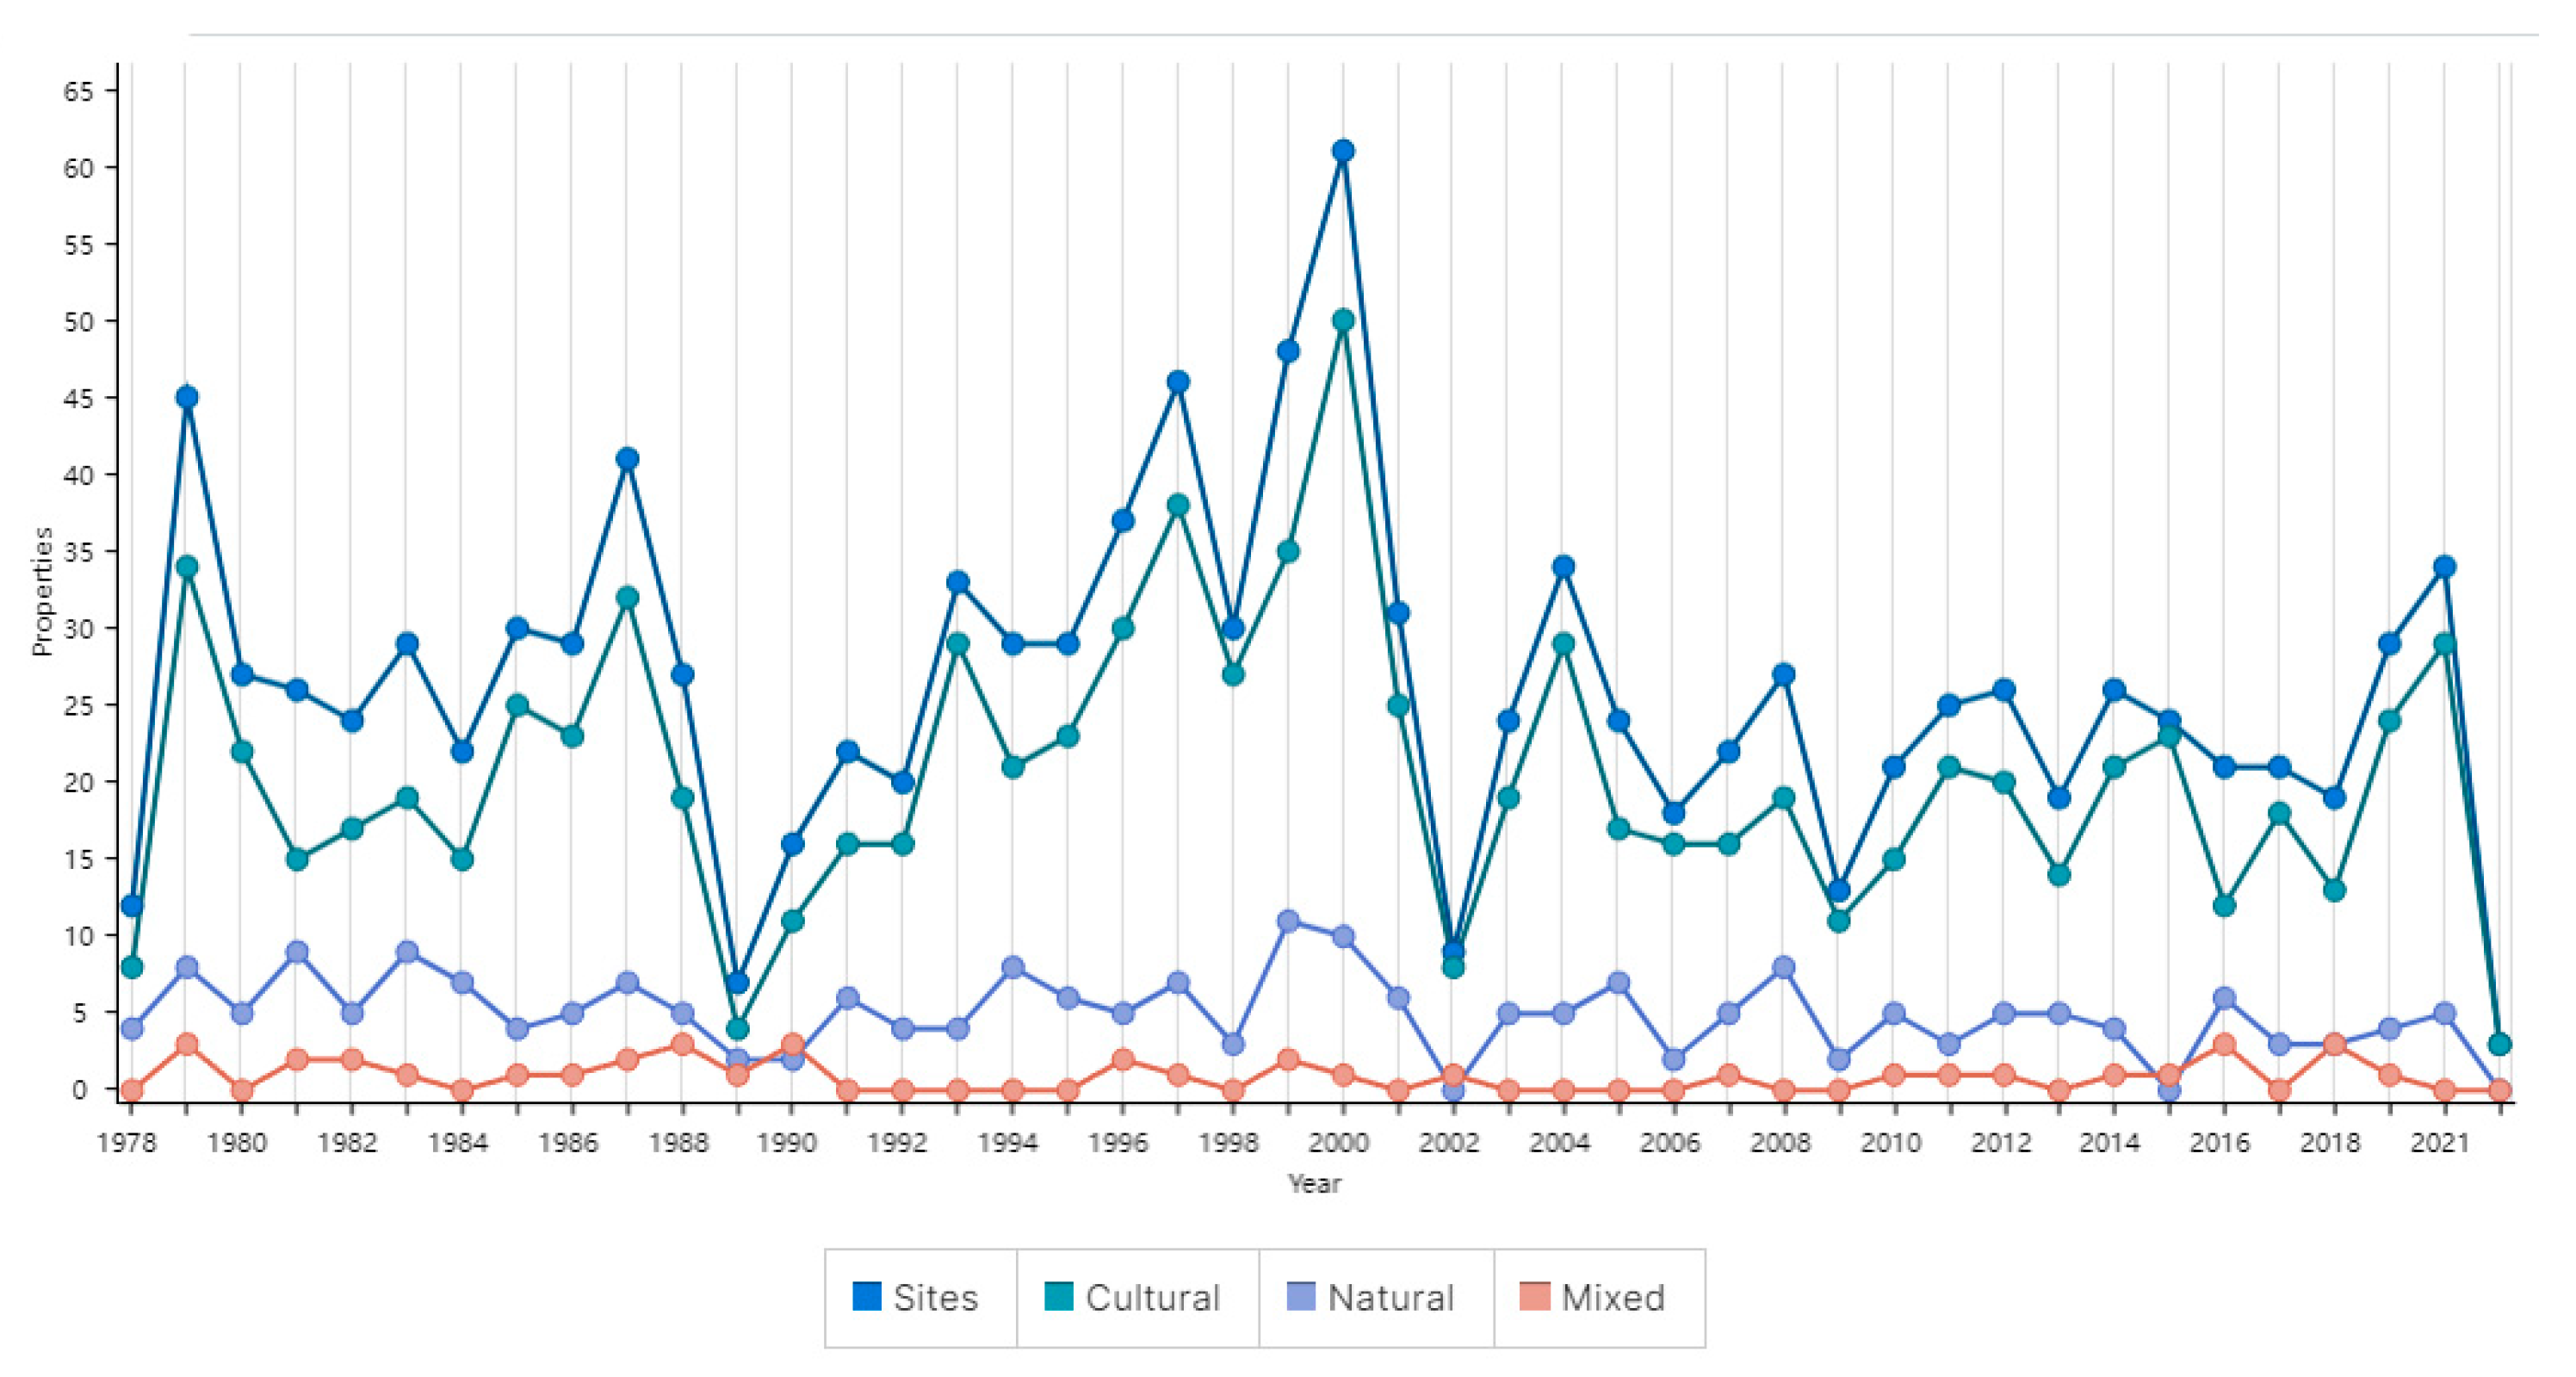
Already in 1965, the Second Congress of Architects and Specialists of Historic Buildings adopted 13 resolutions, one of which was very important—put forward by UNESCO, it provided for the creation of the International Council on Monuments and Sites (ICOMOS). ICOMOS works for the conservation and protection of cultural heritage places. As of 2022, the number of projects inscribed on the International Register of Industrial Heritage Protection was as high as 1157. The annual distribution of projects is depicted in Figure 1. Within this data set, the Asia-Pacific region accounts for 277 projects, representing approximately 24% of the total [1]. Notably, China is experiencing a flourishing trend in the conservation and revitalization of its industrial heritage. In 2017, the Ministry of Industry and Information Technology of the People’s Republic of China officially released the inaugural inventory of industrial heritage sites in the country. At present, a total of 195 industrial heritage projects are included on this list [2]. It is important to note, however, that this figure merely represents a fraction of the vast industrial heritage encompassed by China’s expansive land.
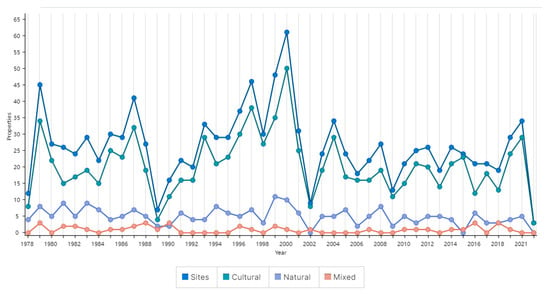
Figure 1.
Number of World Heritage properties inscribed each year: cultural, natural, mixed [1].
Regarding the current domestic industrial heritage renewal projects, some were finished with simple functions, making it hard to adapt them to the rapid development of cities, resulting in them finally facing renovations (the Qingdao Beer Museum). Others, meanwhile, only narrowly pursued high efficiency, utilizing simple functions that were also hard to adapt to the rapid development of cities, resulting in them facing renovations as well (the Old Salt Farm 1957). Some were inconsistent with urban planning and construction, ultimately becoming an eyesore in the cities (the Guanggang Park Industrial Site). Obviously, these failed projects cannot meet the requirements of future urban sustainable development. Undoubtedly, numerous scholars and experts have dedicated substantial efforts to researching the conservation and sustainable revitalization of industrial heritage. However, a noticeable limitation in these studies is the lack of a comprehensive model or algorithm capable of effectively addressing the renewal direction of most projects.
In light of this, this paper constructs a hybrid modeling technique capable of catering to the majority of industrial heritage updates by leveraging various professional research methods and techniques such as CiteSpace software, bibliometrics, AHP hierarchical analysis, POI analysis, and Bayesian network models. By harnessing their strengths and compensating for each other’s weaknesses, this paper aims to achieve the following:
- Summarize the latest research findings on industrial heritage in China and other countries;
- Scientifically and quantitatively analyze the development prospects of industrial heritage in the context of sustainable development;
- Develop a novel hybrid model for regeneration studies that specifically caters to all types of industrial heritage through an in-depth exploration of multiple research methods and techniques.
The hybrid model developed in this study not only facilitates precise decision-making during the initial stages of industrial heritage projects by determining the most suitable direction for revitalization, but also enables analysis of the future development viability of such projects during periods of economic stagnation. As a result, it provides valuable technical guidance for the sustainable development of industrial heritage across diverse contexts.
2. Materials and Methods
2.1. Literature Review
2.1.1. Industrial Heritage
In 1968, the Association of Industrial Archaeology (AIA) was established in the United Kingdom, and the first comprehensive study and documentation of industrial heritage locations within the United Kingdom was undertaken [3]. Since then, these invaluable industrial heritages have gradually entered the public eye. Almost ten years later, the establishment of the International Committee for the Conservation of Industrial Heritage (TICCIH) in 1978 greatly spurred the organization of numerous international conferences, charters, and conventions dedicated to this field [4,5]. The strategy of conserving and renewing industrial heritage has always been a topic of discussion in the global research field. On 18 April 1982, the International Council of Monuments and Sites (ICOMOS) established the International Day of Monuments and Sites which was later named “World Heritage Day” [6]. However, after 40 years, the theme for the International Day of Monuments and Sites was changed to “Heritage Changes” in 2023 [7]. The concept of “Change” encompasses the essence of historical progression and serves as the foundation of sustainable development. In contemporary contexts, the strategy for renewing industrial heritage is inherently intertwined with the broader paradigm of sustainable development.
Over the course of four decades, the international academic community’s investigation into the preservation of industrial heritage has achieved significant breadth and depth. This research field initially focused on conservation methodologies, as highlighted by Harun [8]. Subsequently, there was a shift toward using diverse technological approaches to support conservation, as researched by Cano [9]. The scholarly discourse then expanded to examine the impact of rejuvenating industrial heritage on urban development and societal structures. This line of inquiry predominantly utilized questionnaire methods, as seen in the works of Ball [10], Fuentes [11], and Albert Chan [12]. More recently, the academic conversation has centered around strategies for the influential factors contributing to the progression of heritage renewal (Philippe Cyrenne [13]; Retnasih S. Adiwibowo [14]; Ioannis Vardopoulos [15]) and industrial heritage renewal strategy (Alessandra Oppio [16]; Marta Bottero [17]), demonstrating an increasingly prominent trend in scholarly discourse. The research directions from previous literature are summarized in Table 1.

Table 1.
Research directions from previous literature.
In this study, the influential factors for the direction of industrial heritage renewal are what we want to pay close attention to. Upon reviewing previous research on influential factors, it was observed that the majority of the literature presents similar perspectives. However, a minority of scholarly works diverge, offering distinctively contrasting viewpoints. Among them, Jie Chen et al. [17] examined the primary influential factors of structural style and urban planning in their research on industrial heritage in China. Vardopoulos [15] argued for the essential influential factors of industrial heritage renewal in Greece from a sustainability perspective using Fuzzy-DEMATEL analysis, which identified the surrounding resources, urban planning, and sustainable development as indispensable components. Meanwhile, Bottero et al. [18] placed stronger emphasis on the influence of people’s subjective needs while considering the structural form and surrounding resources. Additionally, Liu Yu [19], Xosé Somoza-Medina [20], and Liu Na [21] researched significant influential factors from various angles. The influential factors mentioned in the literature summary are shown in Table 2.

Table 2.
Influential factors of industrial heritage renewal strategies mentioned in the literature.
In China, work related to industrial heritage has gradually revived since 1987 [22]. By the early 21st century, the National Cultural Heritage Administration of China organized the first “China Heritage Conservation Forum” in Wuxi. During this event, they issued the “Wuxi Recommendations”, which marked a significant milestone in the conservation history of industrial heritage in China [23]. This event also signaled China’s official entry into a phase of extensive discussion and exploration of industrial heritage conservation and renewal. On 19 November 2018, the Ministry of Industry and Information Technology of the People’s Republic of China published the “Interim Measures for the National Industrial Heritage Management” for the first time. Meanwhile, on 15 March 2023, China officially launched the “National Industrial Heritage Management Measures” to replace the previous interim measures. These measures primarily delineate regions of critical significance for the preservation and application of the nation’s industrial heritage, emphasizing a sequence of conservation and sustainable development prerequisites [24,25].
Clearly, industrial heritage is not only a product of its time, but also a witness to history, capturing the pictorial history of a city, country, and specific time period. Consequently, industrial heritage embodies unparalleled historical significance and value. In recent times, the rejuvenation of industrial heritage has played a significant role in urban renewal. Globally, strategies tailored to the renewal of industrial heritage in alignment with sustainable urban development have been rigorously explored. “Sustainability” refers to a process or state that can be maintained over a long time. Ecological sustainability, economic sustainability, and social sustainability are three interrelated and inseparable aspects that together form the sustainability of human society. Similarly, the renewal and sustainability of industrial heritage necessitate attention to various issues, including ecological conservation, economic efficiency, urban needs, historical heritage, and social environment [26,27,28]. Given the multitude of intricate internal and external requirements, this research aims to address the decision problem of the direction of industrial heritage development by employing mathematical methodologies and techniques for precise inference and computation of said development.
2.1.2. Bayesian Network
Bayesian networks, within cognitive science and artificial intelligence, were based on updating the rule of probabilities by Bayes to calculate hypothetical probability (Dialsingh, I. 2014) [29]. The first system using Bayesian networks was established by Pearl et al. (1987) [30]. D. Heckerman et al. (1996) [31] and Armelle Fay (2000) [32] have also developed and verified the abilities of a Bayesian network. Initially, Bayesian networks were mainly used in the fields of medicine (D.E. Heckerman et al., 1991) [33] and mathematics. However, they have gradually found wider applications in areas such as ecology (Seong-Pyo Cheon. 2009) [34], criminal cases (Greer, S. 1994) [35], geography (Jiahao Zhang et al., 2022) [36], economy (Sou-Sen Leu et al., 2023) [37], building safety (Yongjun Chen et al., 2023) [38], and risk assessment (Hollnagel, E. 2009) [39]. Norman Fenton and Martin Neil [40] regarded that a BN provides a general approach to reasoning, with explainable models of reality, in contrast to big data approaches, where the emphasis is on prediction rather than explanation, and on association rather than causal connection. Nowadays, Bayesian networks have been gradually holding significant potential for development and application in many fields.
In this paper, we propose a hybrid research method based on a Bayesian network, which is highly supported by evidence. The application of Bayesian networks in different fields is accompanied by the development of structural models (Figure 2). The hybrid Bayesian network model has been a prevalent research topic in recent years. On account of various research fields, integrating different technical methodologies can result in specific hybrid Bayesian networks.

Figure 2.
Advances in BN model structure and applications [41,42,43,44,45,46,47,48,49,50,51,52,53,54,55,56,57,58,59,60,61,62,63,64,65].
On the one hand, the Bayesian network system is relatively mature and exhibits strong objectivity, enabling reasonable inferences of future development based on existing data. Furthermore, its application within the field of construction is progressively maturing. On the other hand, employing Bayesian networks alone for the analysis of this study is not exhaustive. Consequently, we delve into the research and application of hybrid Bayesian networks (HBNs) by other scholars, integrating Bayesian networks with other algorithms, and propose a hybrid model. This HBNs approach aims to combine the strengths of each method, enhance the precision of Bayesian network models, and consequently derive a more objective and precise method for data analysis. However, it is important to acknowledge that the primary limitation of the HBNs model proposed in this paper lies in the data itself, such as data accuracy, comprehensiveness, and timeliness. Nonetheless, one of the merits of BN is its capability to provide a robust framework even when faced with limited data, enabling the provision of initial guidance to managers and decision-makers [66]. The purpose of this study is to provide a viable guideline for the direction of industrial heritage renewal within the framework of sustainable development. This objective coincides with the advantages of Bayesian networks. Therefore, the hybrid Bayesian network is a suitable approach for this study.
2.2. Determine Intermediate Nodes
Bayesian networks typically consist of root nodes (also known as parent nodes) and leaf nodes (also known as child nodes), but more intricate Bayesian networks may also include intermediate nodes [46]. In this study, our purpose is to provide decision-makers with recommendations for the direction of industrial heritage renewal. To accomplish this, we introduce intermediate nodes which represent the impact factors related to industrial heritage renewal. We also employ CiteSpace® knowledge visualization software (version 6.2.R3, developed by Chaomei Chen’s team) for the preliminary study of impact factors related to industrial heritage. This combination involves comprehensive cluster structure analysis, knowledge network mapping analysis, and other methods to analyze the fundamental knowledge and sustainable development of building renewal. Ultimately, the goal is to explore the primary impact factors [67,68].
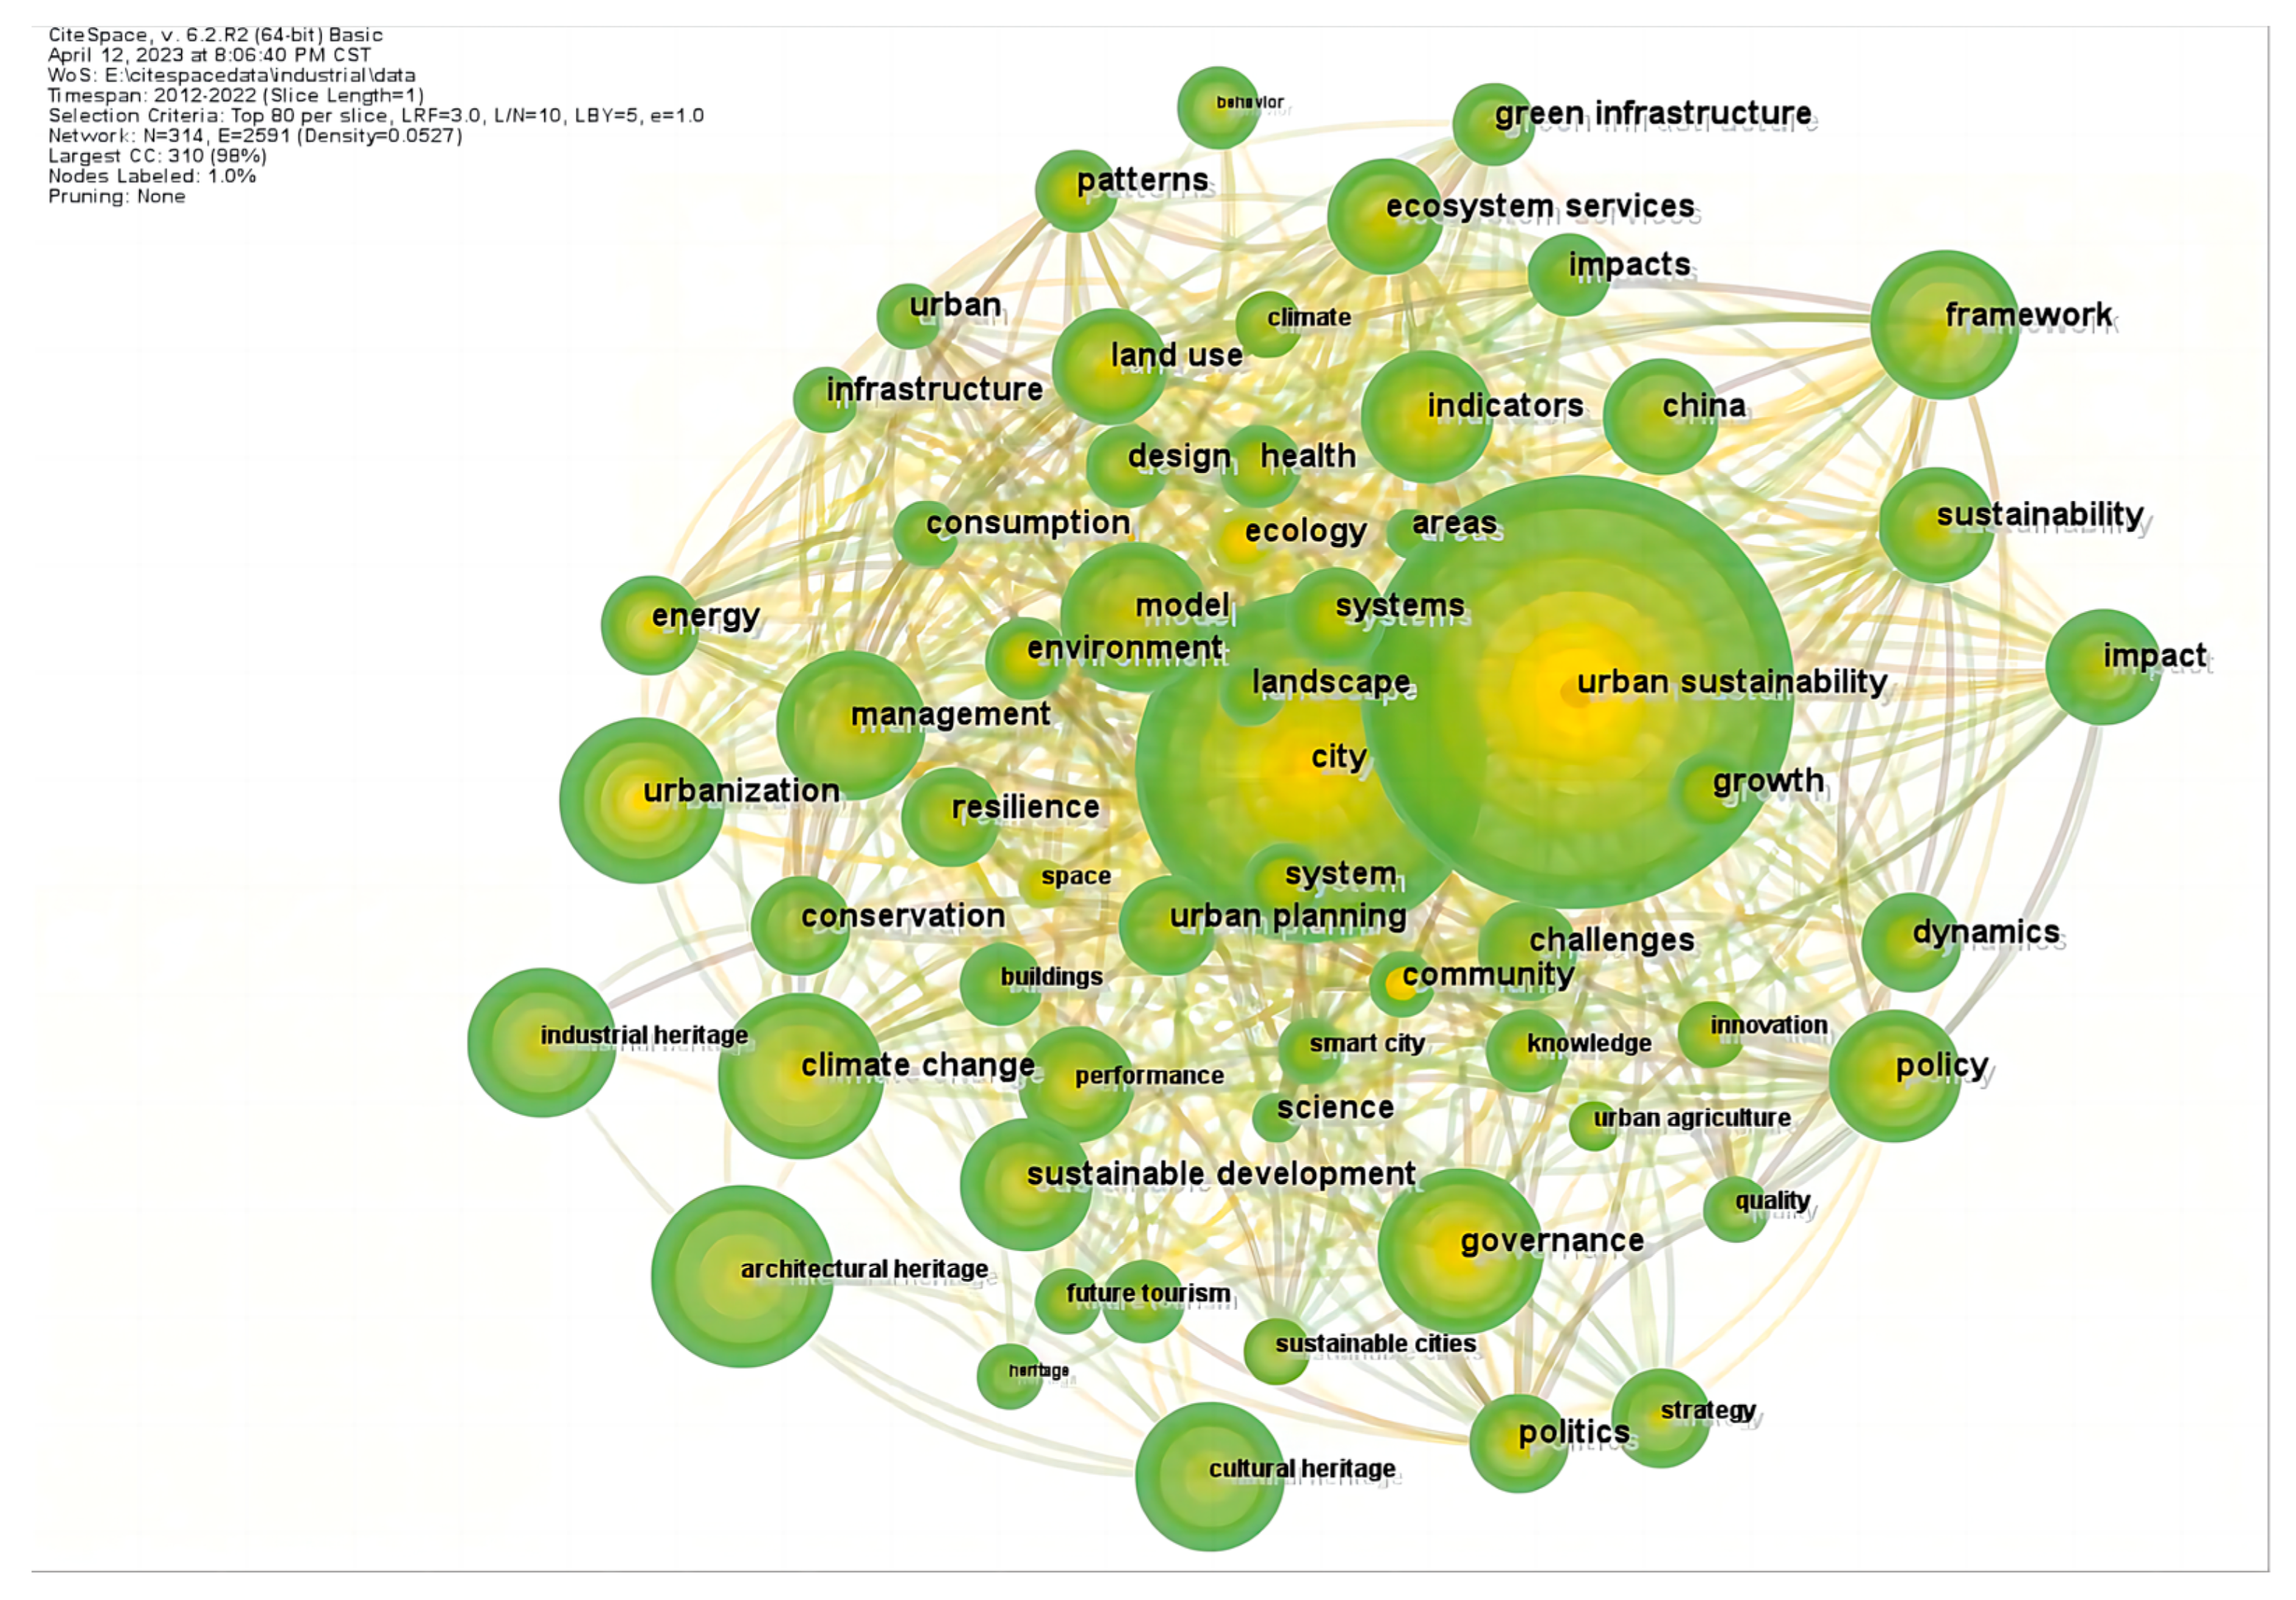
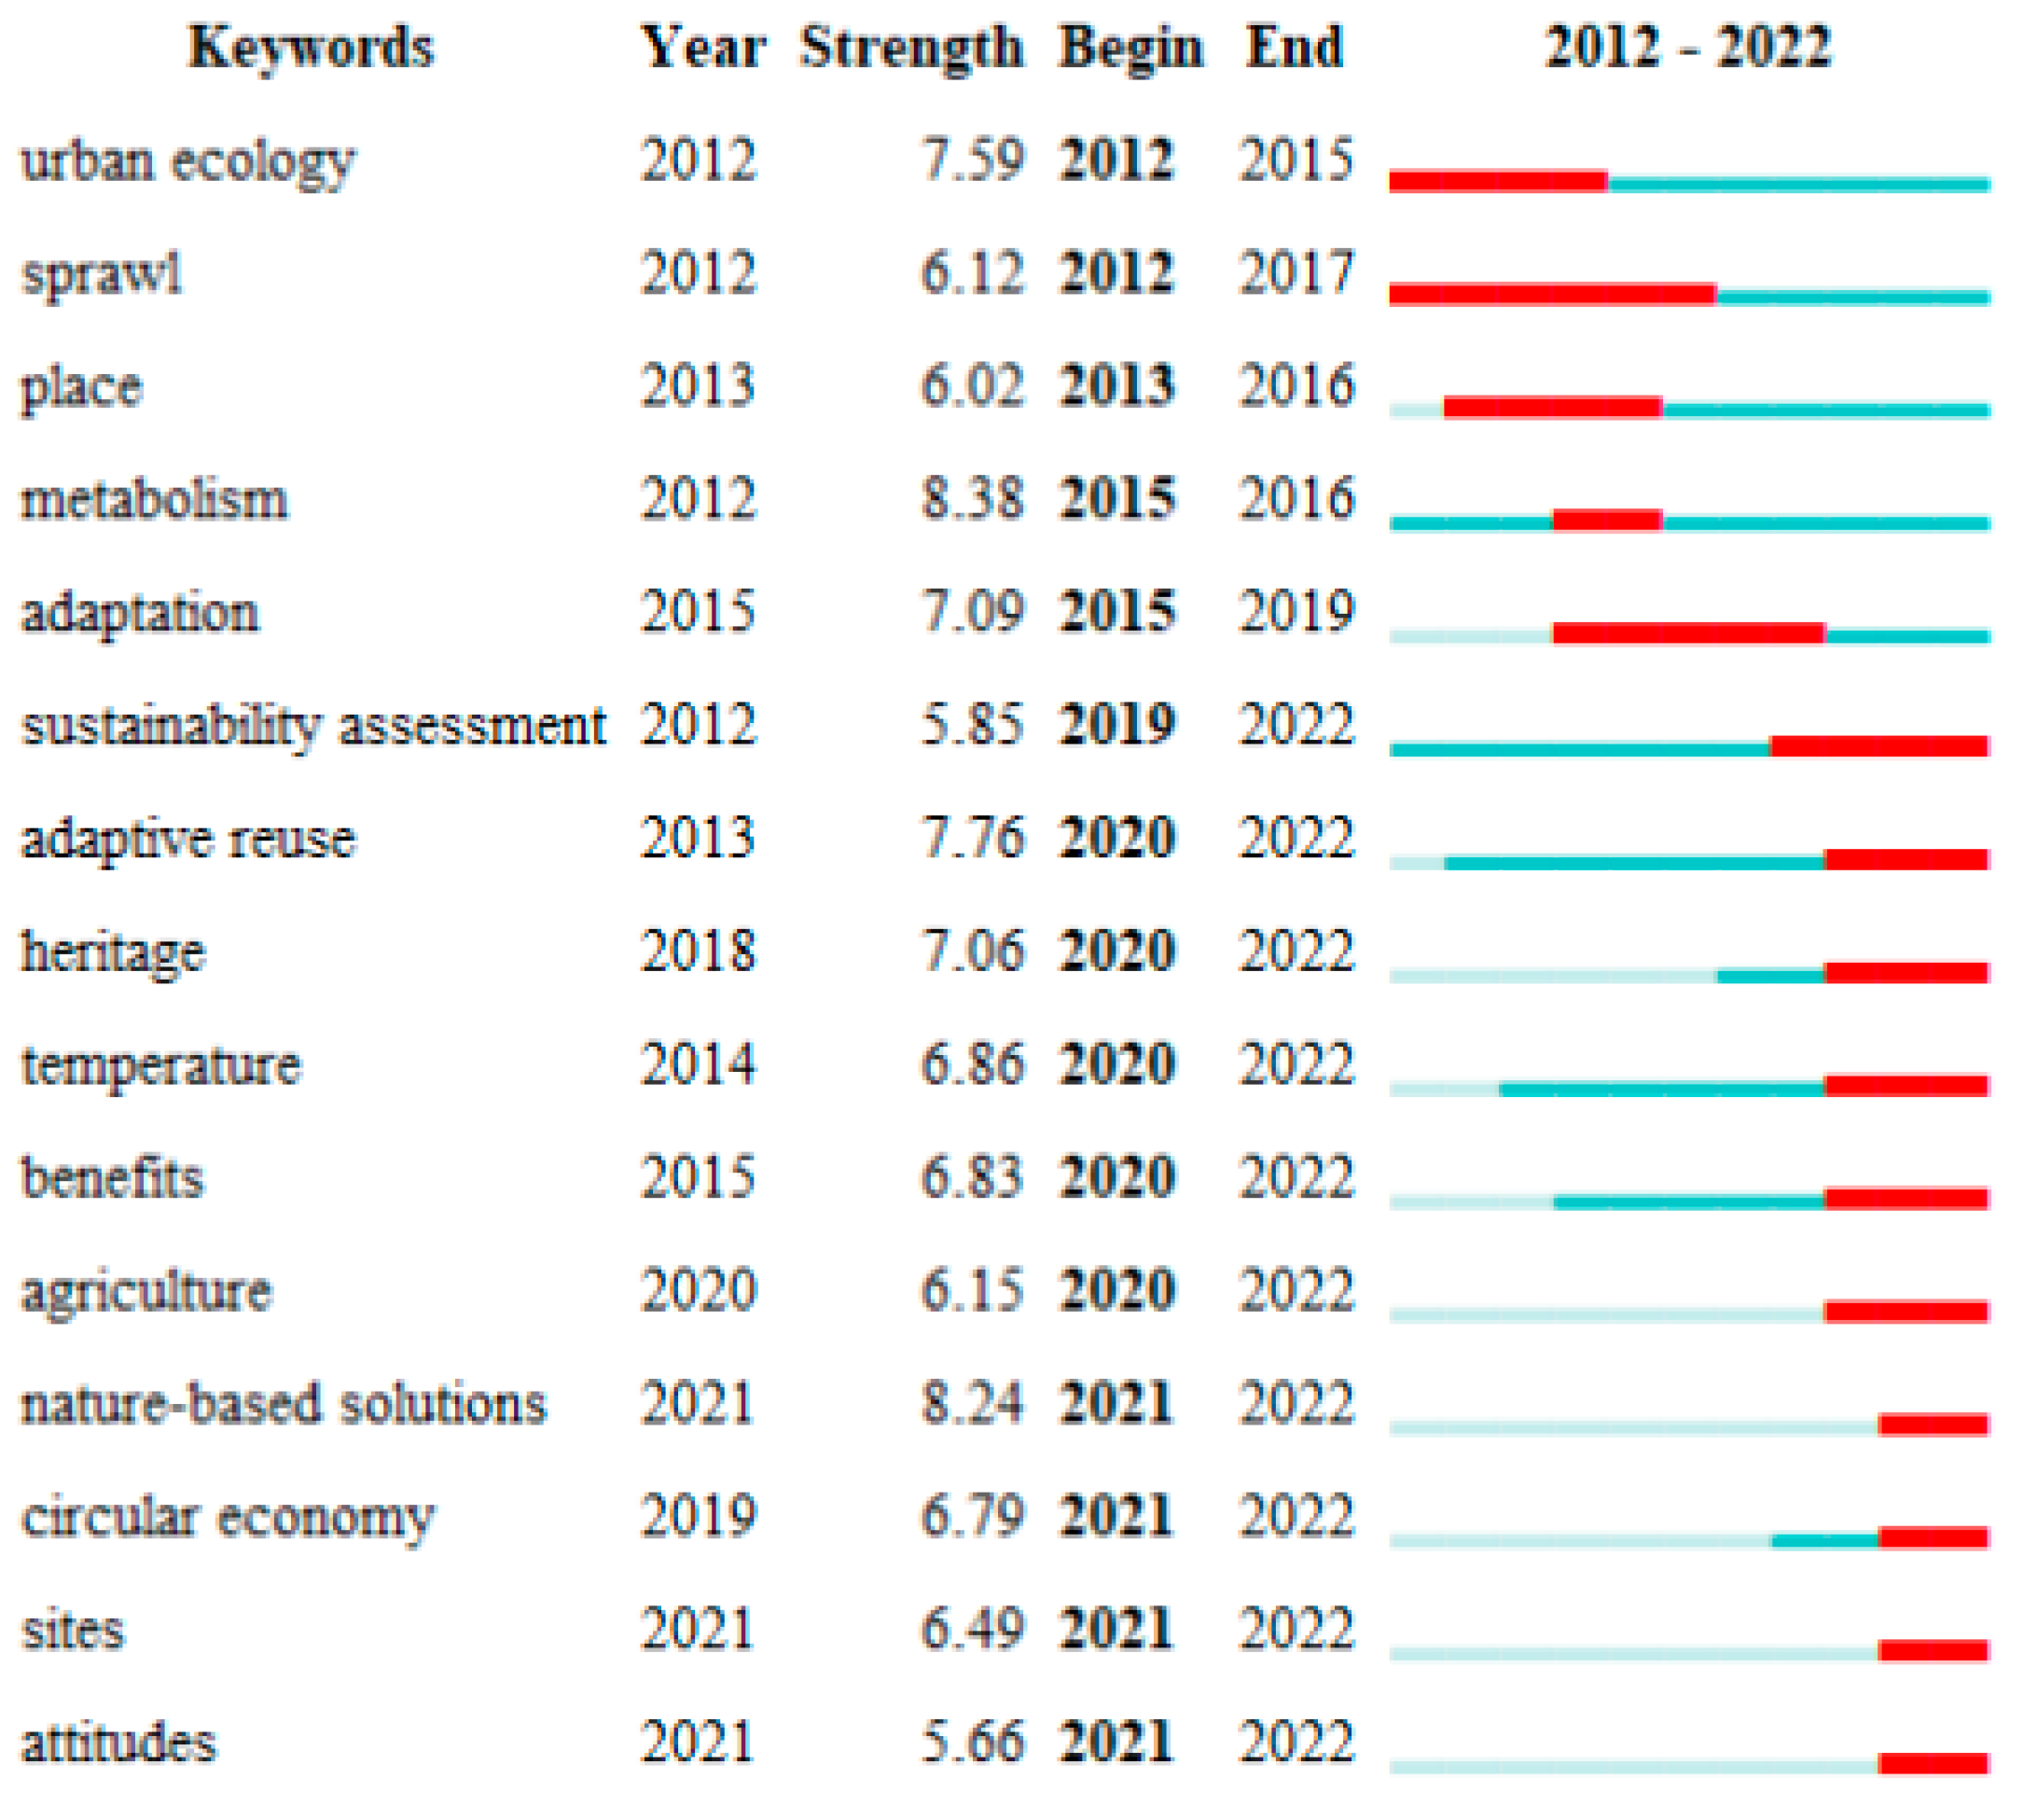
The primary data source utilized in most previous studies is the Web of Science, indicating its capacity to provide a more comprehensive range of data information. Our learning of scholarly articles authored by domestic and foreign researchers revealed three distinct categories for data selection timeframes: all time intervals (primarily applicable to natural phenomena such as geography, geology, and meteorology) [69], the past 20 years (mainly addressing human interventions like the impact of constructed landscapes on bird populations) [70], and the previous 10 years (primarily concerning sustainable development and future studies involving human interventions) [71]. This paper is a strategic study based on the premise of sustainable development, which fits into the third category. Despite the presence of minor data discrepancies in these investigations, we maintain that the negligible margin of error does not compromise the validity of the outcomes. Consequently, we assert that this range of time selection demonstrates scientific rigor and generalizability. Based on these findings, we have chosen to utilize the Web of Science core database as our primary data source, covering the period from 1 January 2012 to 31 December 2022, searching for keywords such as “industrial heritage”, “heritage conservation”, “urban sustainability”, and “architectural heritage”. The resulting data set, referred to as Set #5, consists of 4595 bibliographic records comprising articles and reviews in English (Table 3). The cluster structure analysis chart and the top 15 keywords with the strongest citation bursts, which serve as sample keywords, were analyzed by CiteSpace® software (version 6.2.R3), as shown in Figure 3 and Figure 4.

Table 3.
Chart comprising details of the WOS data retrieval.
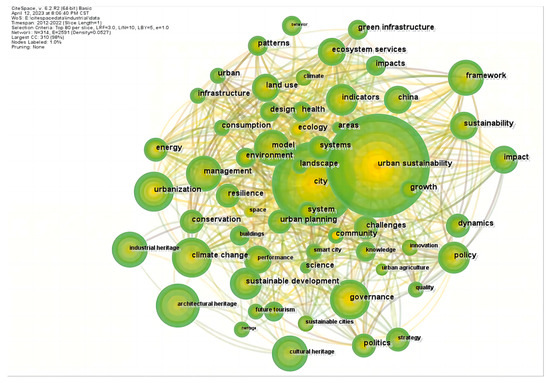
Figure 3.
Chart of the cluster structure analysis.
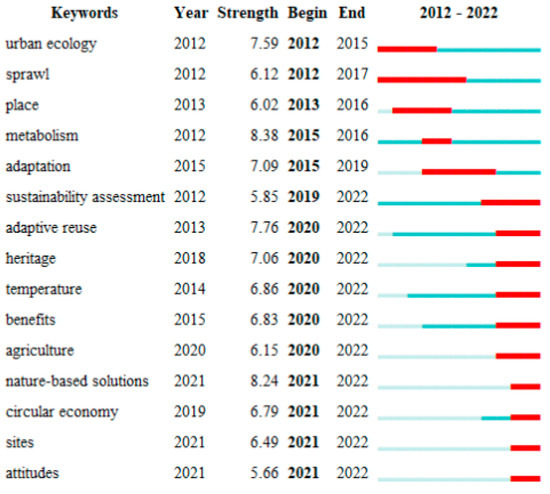
Figure 4.
Top 15 keywords with the strongest citation bursts.
The nodes in the analysis figure represent the keywords found in the literature, and the size of the nodes reflects the number of published studies. The lines connecting the nodes indicate the level of relevance between the keywords. It is evident that sustainability, urbanization, governance, and sustainable development are focal points that have captivated scholars’ attention in the field of industrial heritage renewal. Furthermore, by examining the keyword emergence map, it can be observed that the keyword “attitudes” has emerged significantly in the past two years. It is noteworthy that we selected keywords in the analysis chart that are related to the impact factors.
Based on the impact factors derived from the analysis outcomes of CiteSpace data and supplemented by the research findings of other scholars as presented in Table 1, we conducted a comprehensive review. Moreover, we sought input from industry experts to further refine the review process by excluding factors with weak or uncertain degrees of influence. Ultimately, six impact factors of relatively higher significance were identified: location, surrounding resources, urban planning, surrounding residents, sustainable development, and structural style. These factors served as the foundation for constructing an initial Bayesian network model.
2.3. Determine Leaf Nodes—Field Investigation
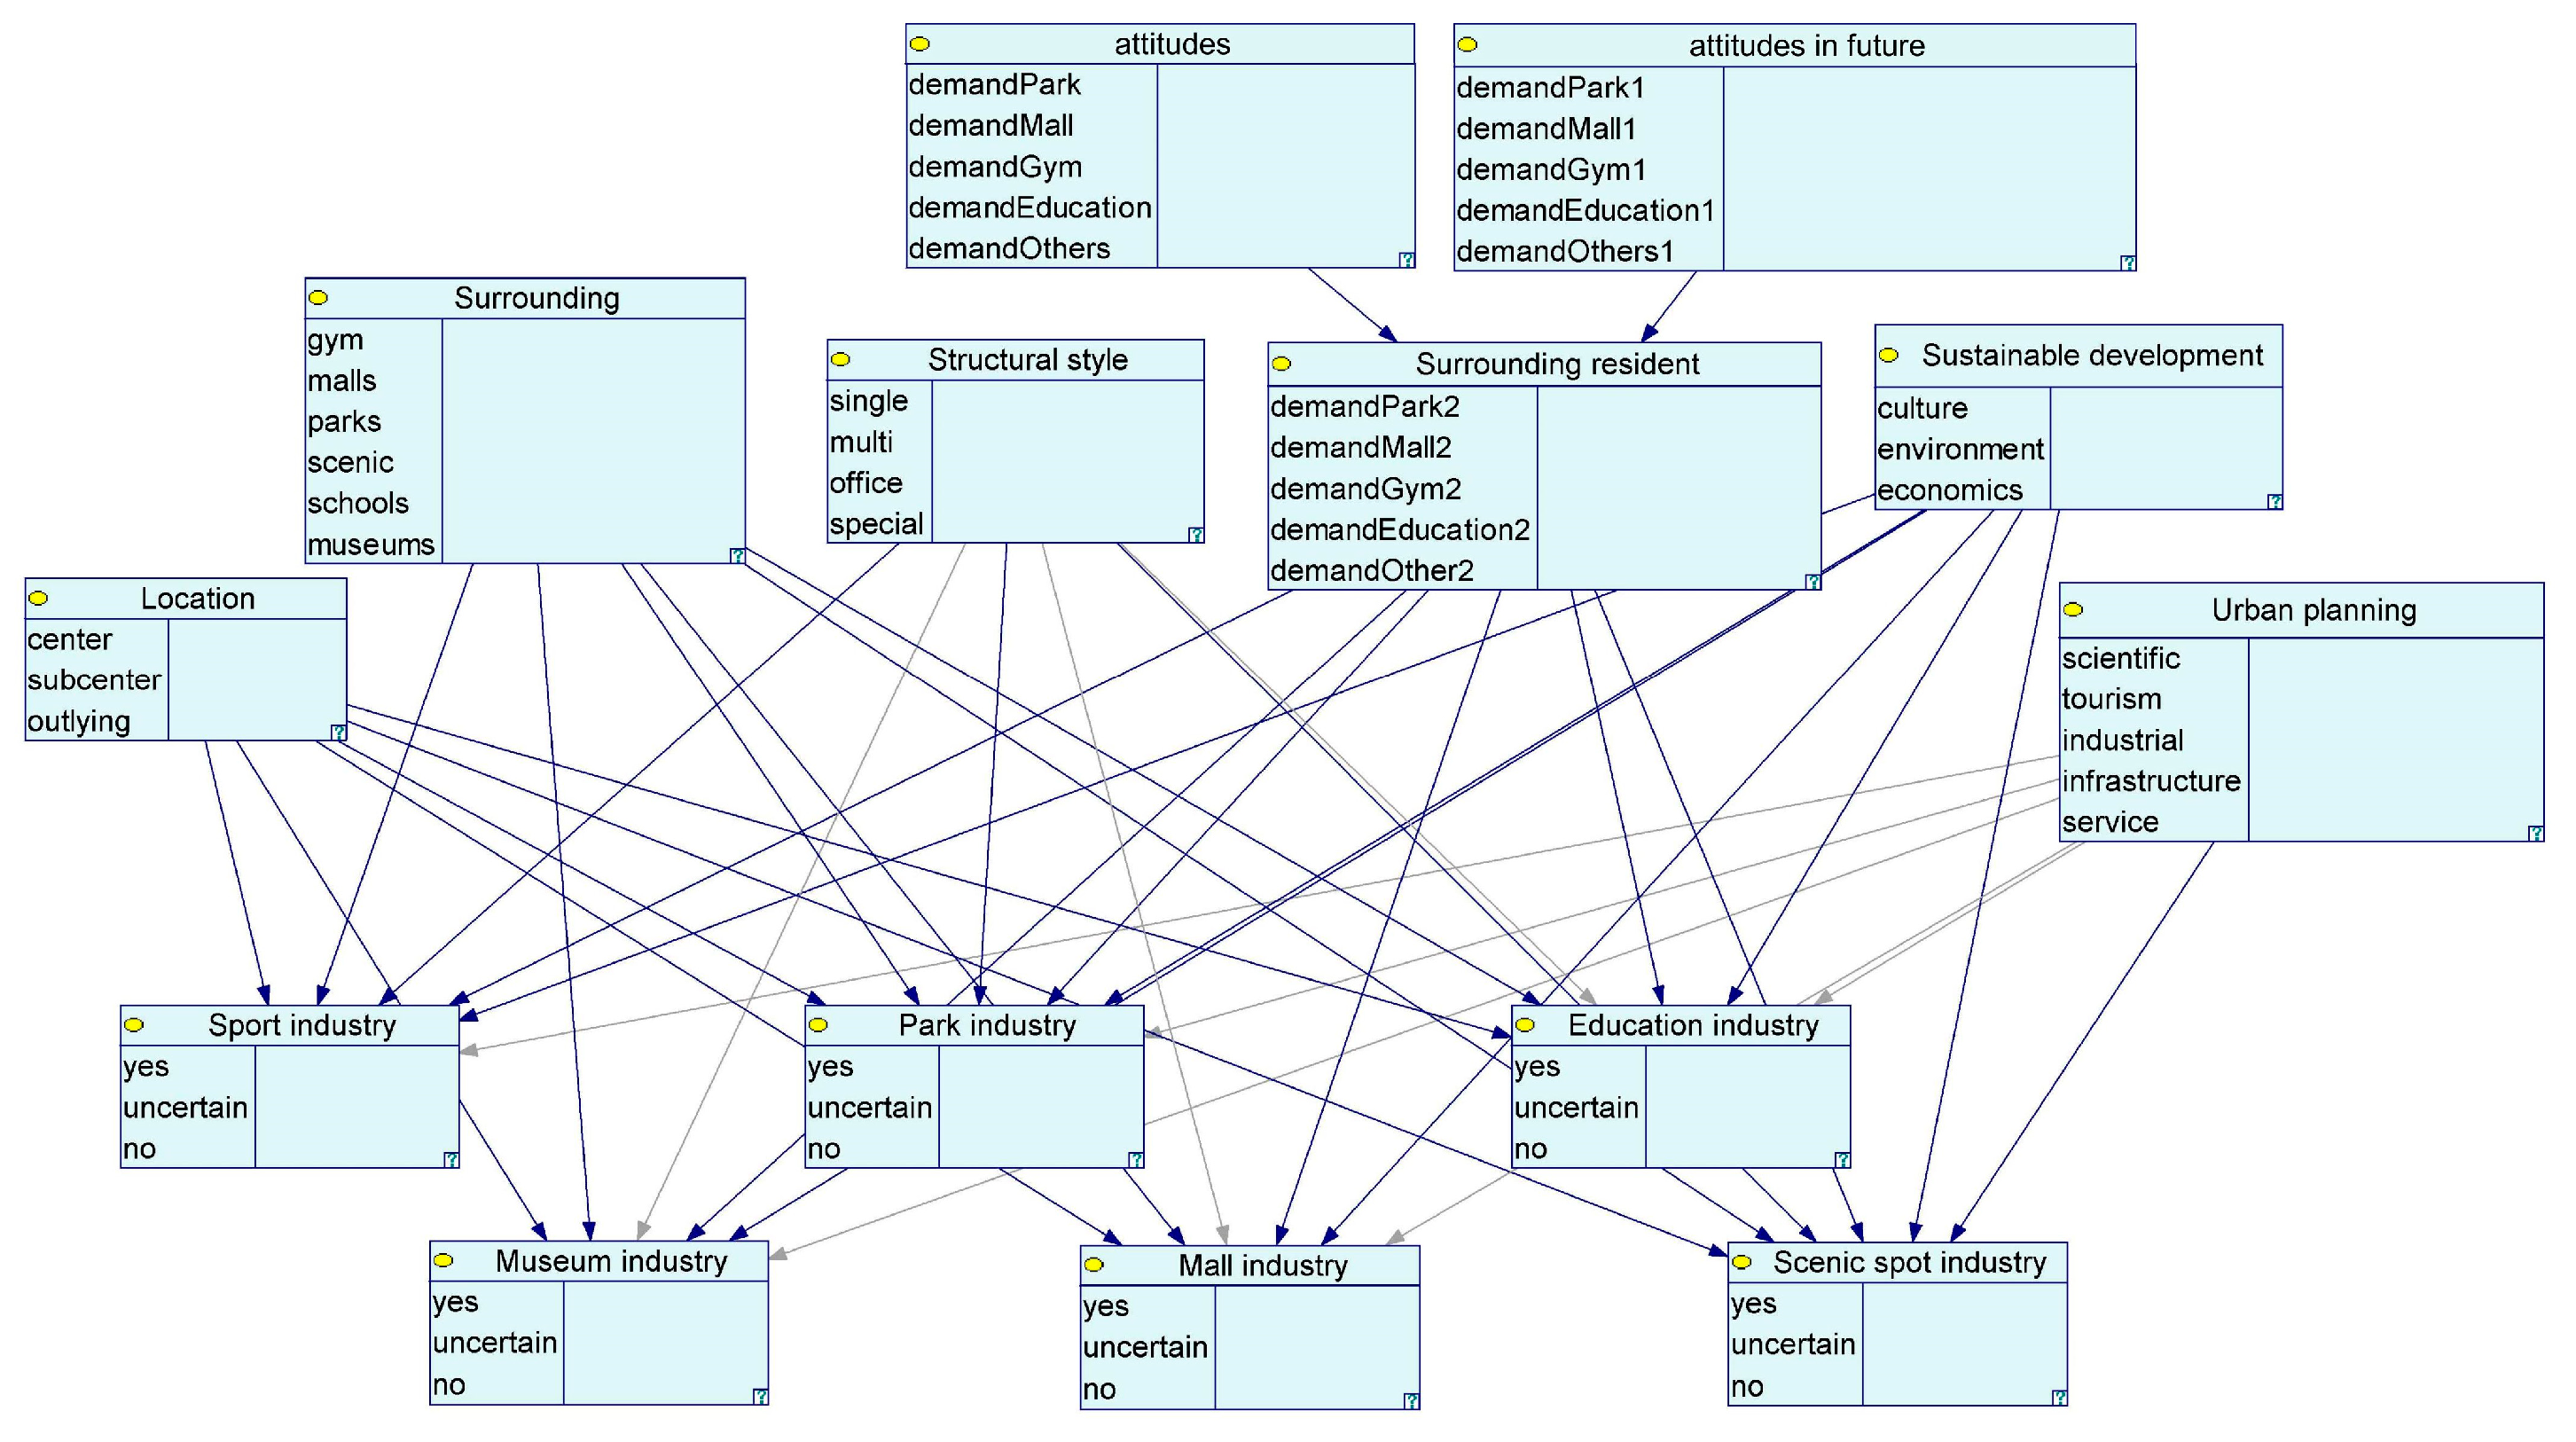
To facilitate clear representation, we have designated the intermediate nodes in Figure 5 as B1–B6. Distinct technical approaches were employed to determine the content of the leaf nodes associated with these six intermediate nodes. We relied on the recommendations of industry experts and the knowledge accumulated by other scholars to directly specify B1 and B3. Afterward, concerning “Location (B1)”, we adopted the expert’s suggestion, leading to its classification into “center”, “sub-center”, and “outlying” regions. As for “Structural style (B3)”, we arranged it based on the findings of other scholars, consulted with industry experts for further categorization, and ultimately classified it into four types: “single-story factory buildings”, “multi-storied factory buildings”, “office buildings”, and “special buildings”. Furthermore, we referred to the “Report of the World Commission on Environment and Development: Our Common Future” for a comprehensive understanding of sustainable development, which encompasses environmental protection, economic viability, and social justice [72]. Considering the industrial heritage nature of this study, which encompasses culture and art, we identified the leaf nodes categorized under “Sustainable development (B5)” as “ecological environment”, “economics”, and “culture”. However, to determine the leaf nodes for the remaining three intermediate nodes, a more specific approach was required.

Figure 5.
Intermediate nodes and leaf nodes in the new hybrid Bayesian networks.
2.3.1. Urban Planning (B6)
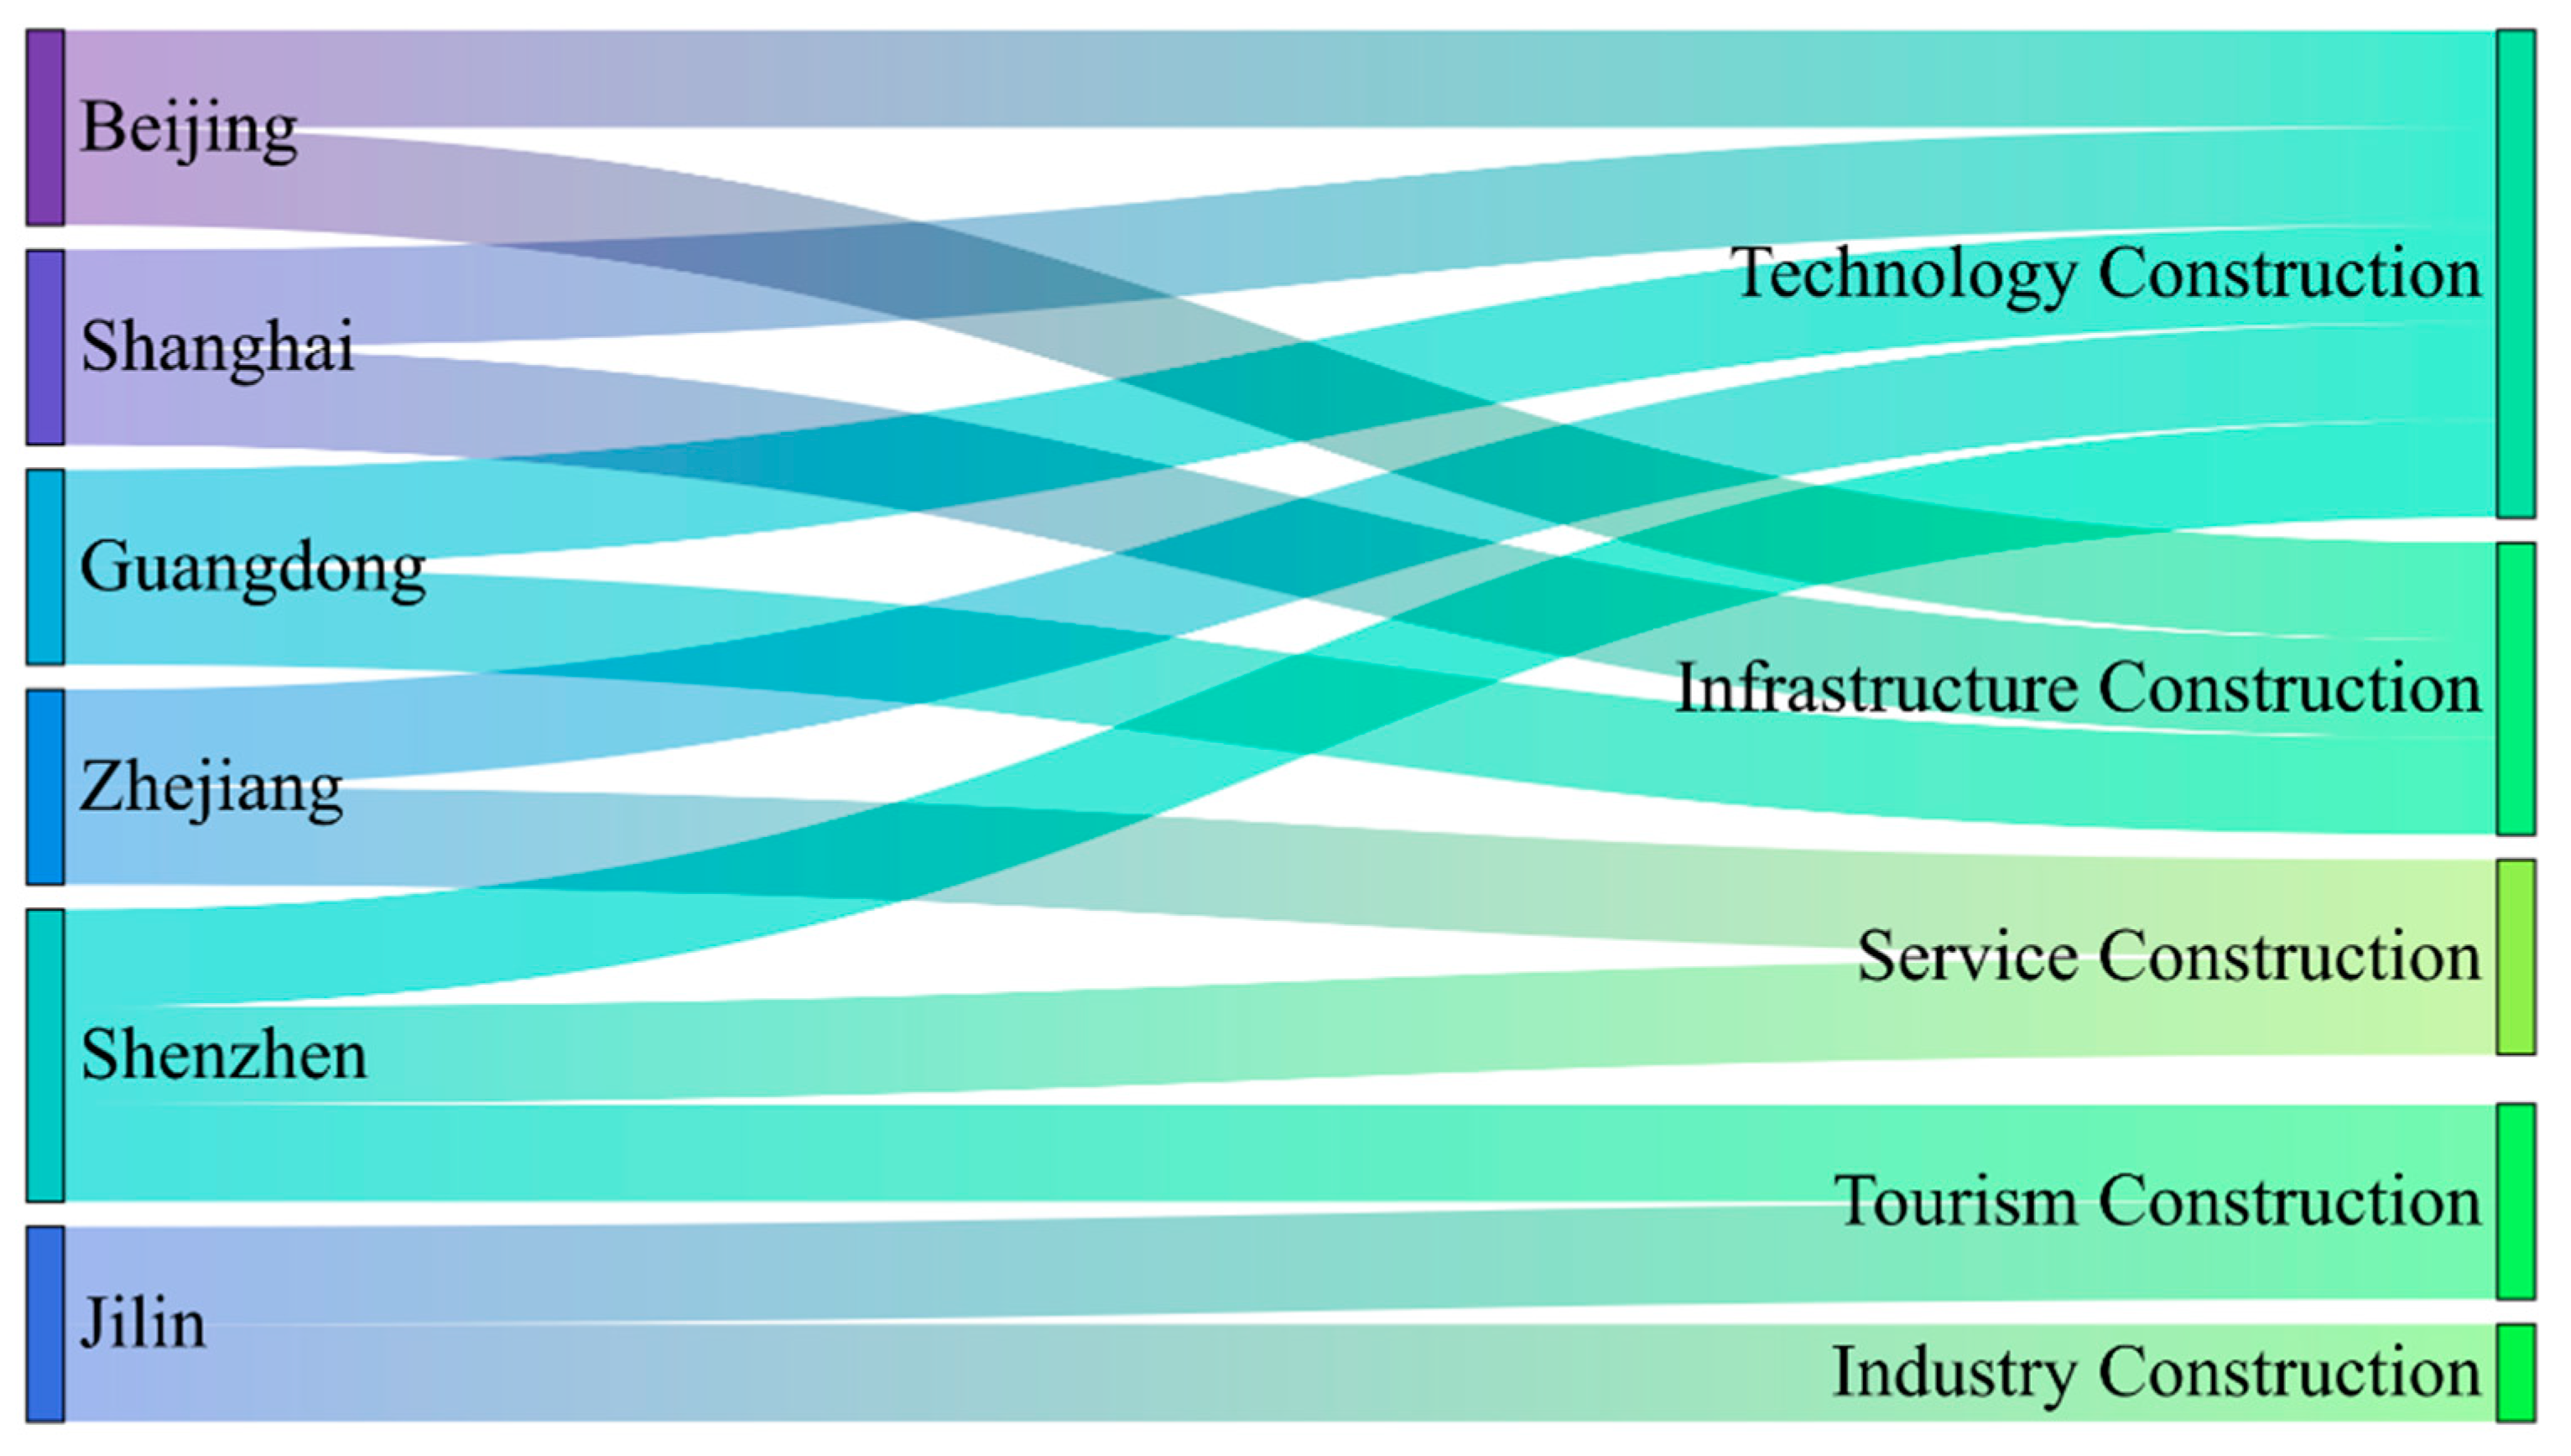
Regarding the direction of urban development planning, each city possesses its unique characteristics, and many cities also share similar urban planning approaches. Through meticulous examination and systematic organization of urban development documents from various Chinese cities, we removed irrelevant content for our study. We then extracted and assimilated the essential information to capture the general trajectory of future development. By conducting a detailed analysis of the distinctive content in key development layouts across diverse provinces, we systematically classified the fundamental elements of “Urban planning (B6)” into five primary directions: technology, tourism, industry, infrastructure, and service construction. Figure 6 provides a summary of urban development plans for some provinces in China.
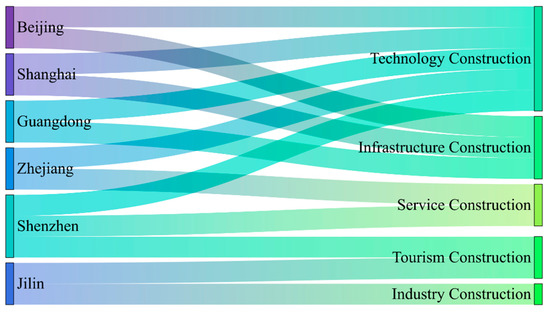
Figure 6.
Summary of urban development plans for some provinces in China.
These directions were then skillfully incorporated as the foundational elements of the “Urban planning (B6)” leaf nodes in the improved hybrid Bayesian network model. Additionally, a thorough analysis of urban renewal planning published by both domestic and international governments and extensive consultations with industry experts were undertaken. It is worth noting that the experts gave equal weight to different urban planning elements.
2.3.2. Surrounding Resources (B2)—Initial Sample Selection
Given the heterogeneity inherent to the “Surrounding Resources (B2)” within each case under study, we emphasize the need for an individualized analytical approach. This stance emerged from a profound dialogue with domain experts, leading us to the adoption of POI (Point-of-Interest), a POI distribution datum, for constructing leaf nodes of B2. We carefully selected and integrated five distinct items of poi data into the hybrid Bayesian model to serve as our foundational data samples. In view of the authenticity and comprehensiveness imperative for sample data, a field survey methodology was employed, coupled with a comparative analysis encompassing over 50 operational industrial heritage renovation projects within China. This analysis was stratified along three dimensions: geographical location, completion timeframe, and industrial category. By integrating these prevalent industrial heritage characteristics, we aspire to guarantee a high degree of generalizability in our findings.
- Selection of Geographic Location: Various geographic locations are available for consideration. In line with the overarching focus on sustainable development, the chosen geographic location disregards geological, geomorphological, and locational information, instead prioritizing the city’s developmental trajectory. The rapid advancements witnessed in first-tier cities hold significant guidance for informing the sustainable progression of other urban areas. Therefore, we tried to identify suitable samples from first-tier Chinese cities: Beijing, Shanghai, Guangzhou, and Shenzhen. In addition, we wanted to select a city that has experienced significant growth in the past decade, even if it is not a provincial capital or a first-tier city. After evaluating city rankings and GDP rankings in China over the previous decade, we found that Wenzhou in Zhejiang Province is an optimal choice. Formerly classified as a third-tier city, Wenzhou garnered recognition as the most promising third-tier city after 2015. By 2020, Wenzhou ascended to the status of a second-tier city, securing the ninth position in city rankings. Consequently, this study elected the representative industrial heritage project from each of these five cities as a sample. Additionally, these five samples must meet specific requirements regarding completion time and industrial category.
- Construction Period: The chosen set of five projects comprehensively encompasses the historical timeline of China’s industrial development, spanning ancient, modern, and contemporary eras following the establishment of the country.
- Industrial Categories: The selected five projects represent a wide spectrum of industrial categories, ranging from early extractive industries to subsequent heavy and light industries. These categories effectively cover the diverse facets of China’s industrial category.
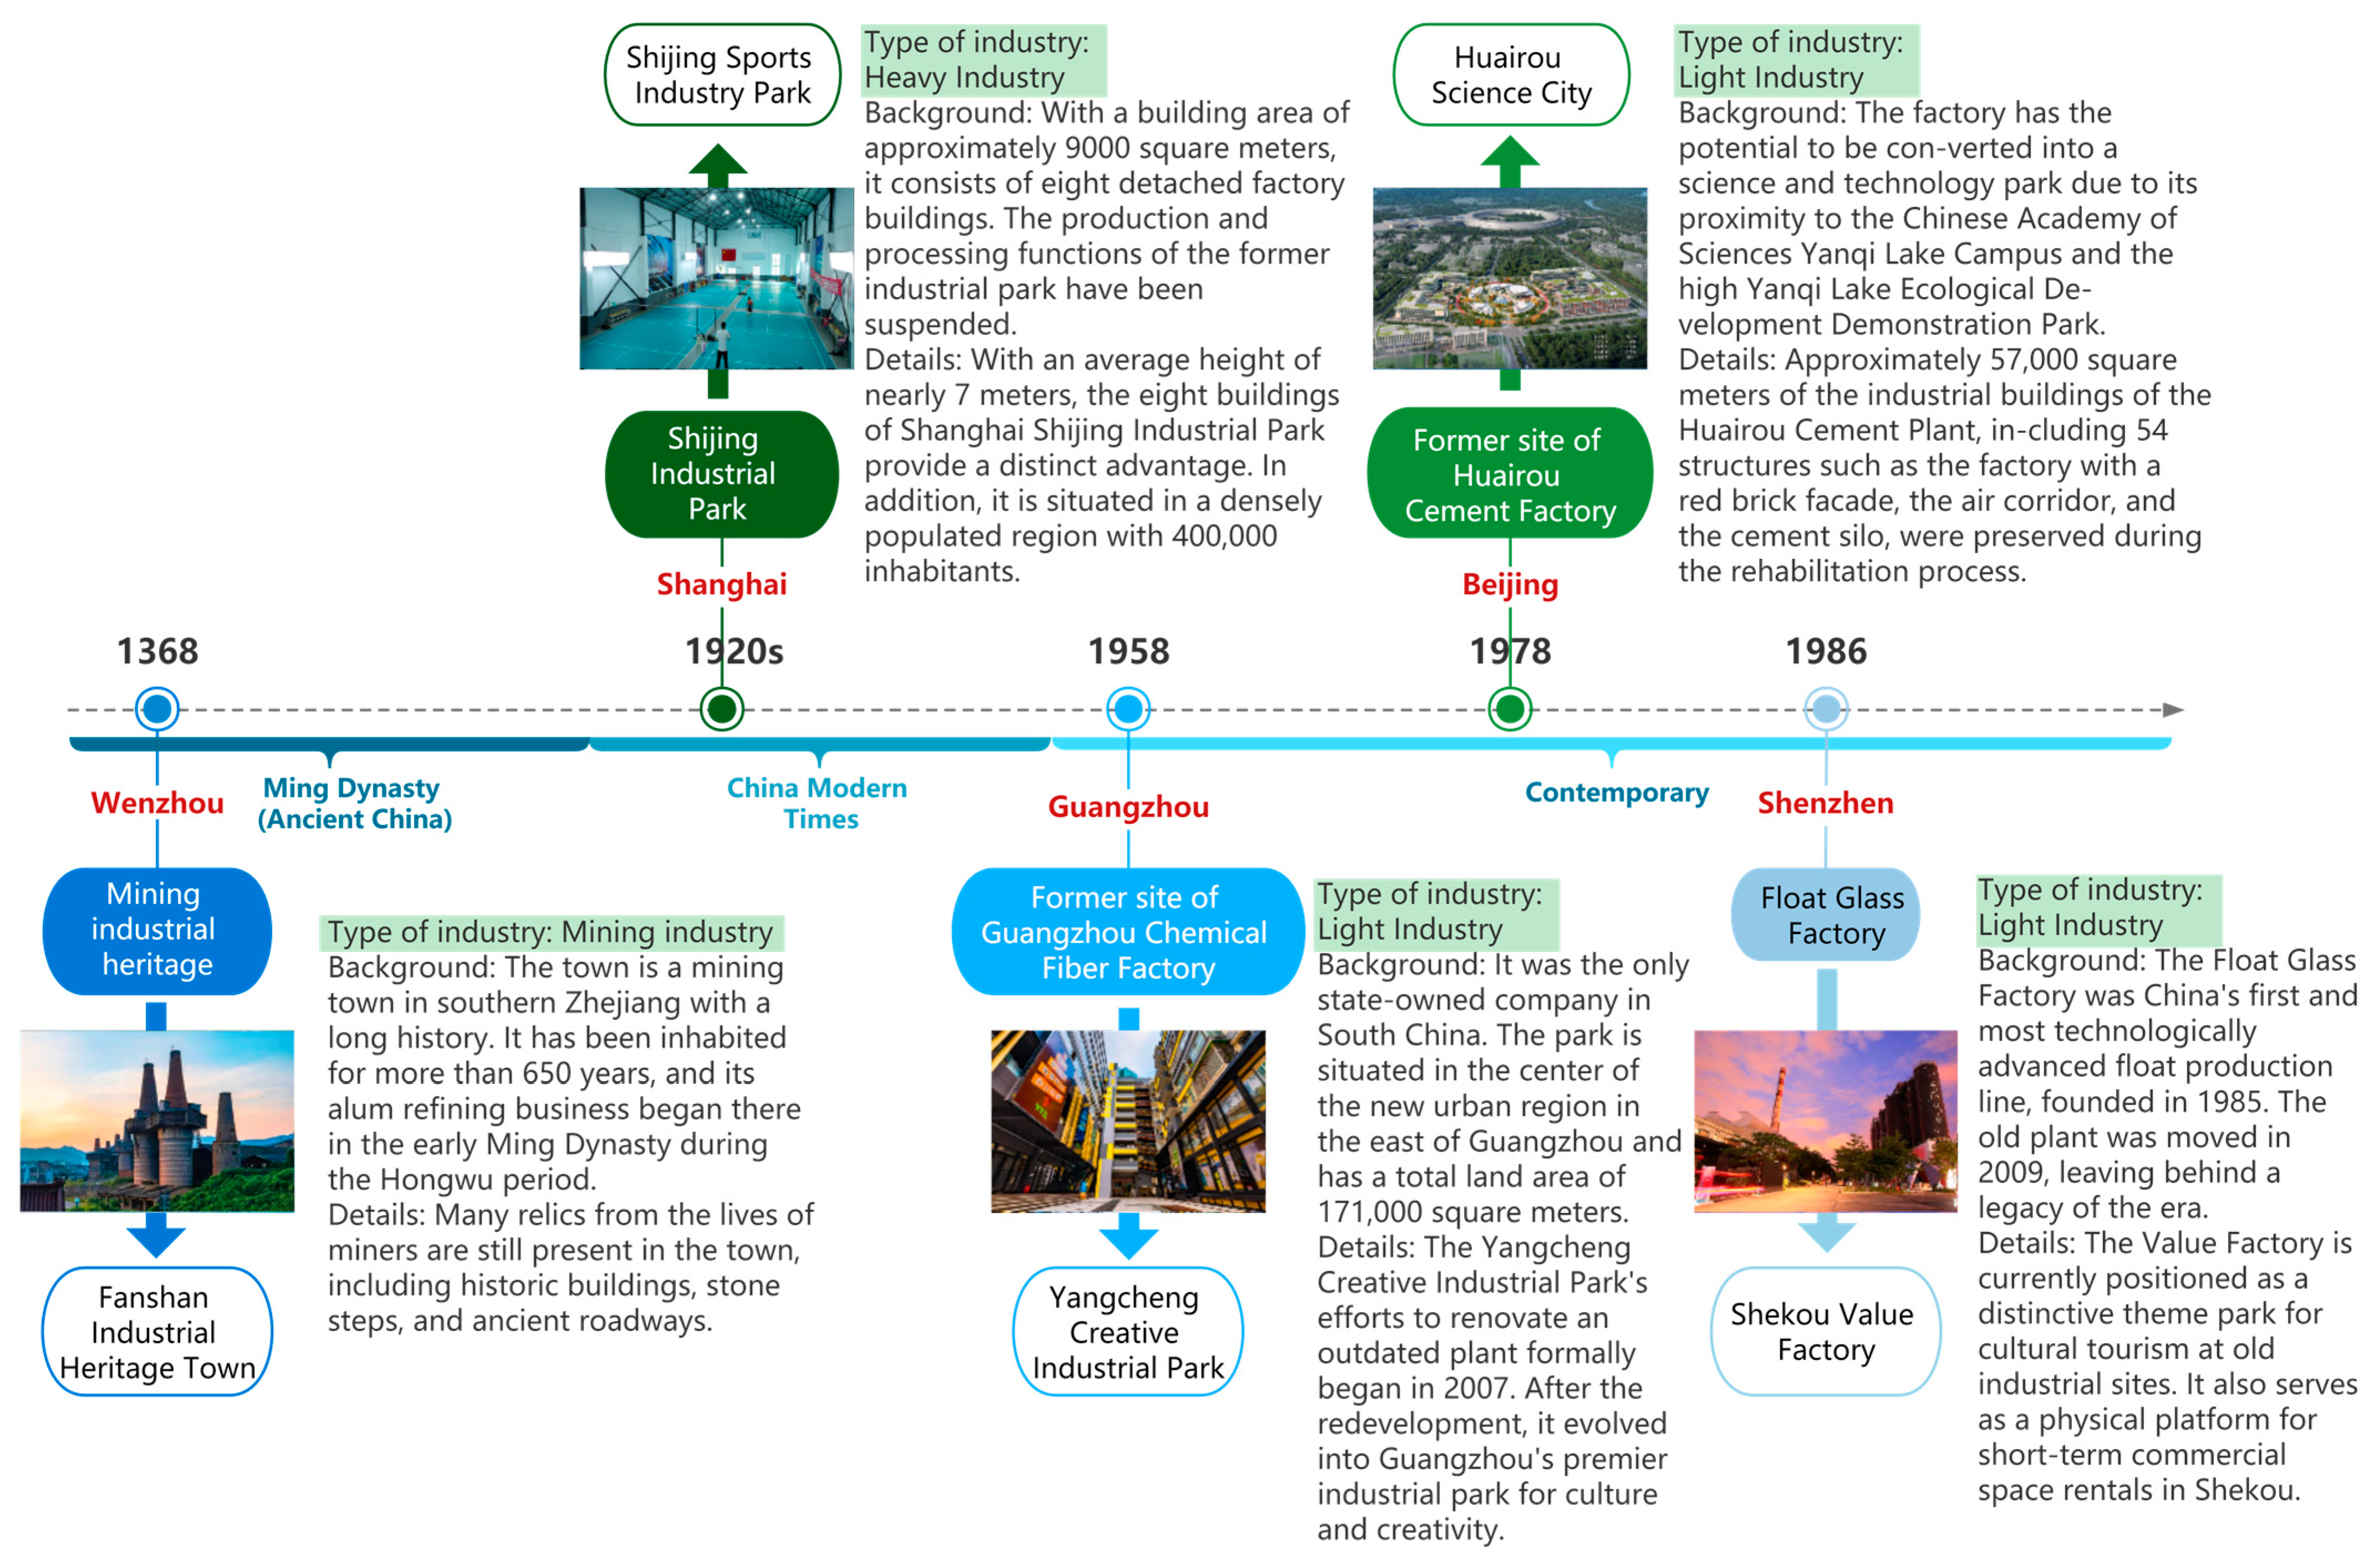
Ultimately, the chronological arrangement of the initial five samples with their information is presented in Figure 7.
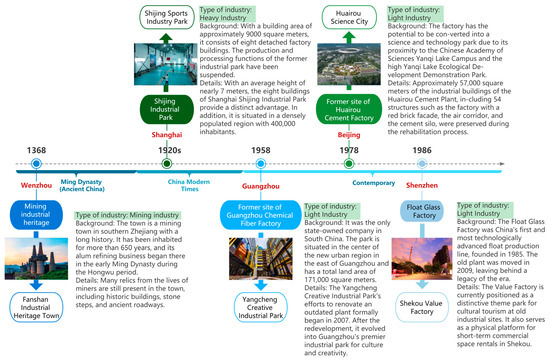
Figure 7.
The basic information of the initial sample cases [73,74,75,76,77,78,79,80,81].
2.3.3. Validation Case: Current Status of the Former Site Museum of Changchun Film Studio (CFS)
To validate the accuracy and applicability of the hybrid Bayesian network model developed in this paper, we have selected a case for validation purposes. The model’s construction relied on utilizing the five samples as primary data sources, thereby enhancing its accuracy in validating similar cases. Therefore, for validation, we need to choose a project that differs enough from the aforementioned samples. Following an initial field survey of over 50 industrial heritage projects in China, we have identified the Changying Old Site Museum in Changchun, Jilin Province as the suitable selection. Notably, among the 195 national industrial heritage projects evaluated in China, the Former Site Museum of Changchun Film Studio (CFS) stands out as the only project with an original purpose centered around culture and art. In contrast, all other industrial heritage sites have original purposes associated with mining, production, processing, manufacturing, and scientific research. Furthermore, the distinctiveness of CFS is not solely manifested in historical development, but also in various aspects such as architectural space and utilization, cultural value and preservation, and the evolution of the park’s architectural structure. Consequently, CFS represents a distinctive presence within the realm of Chinese industrial heritage, which forms the basis for our selection.
The old Changchun Film Studio was formerly known as “Manchurian Film Corporation”, a propaganda organization established by the Japanese during the pseudo-Manchukuo period. It was subsequently rechristened as the “Changchun Film Studio” in 1955. Since its establishment, it has undeniably maintained a crucial position in the history of Chinese cinema. Moreover, this institution has produced an impressive array of over 900 feature films and has translated 2666 films [76].
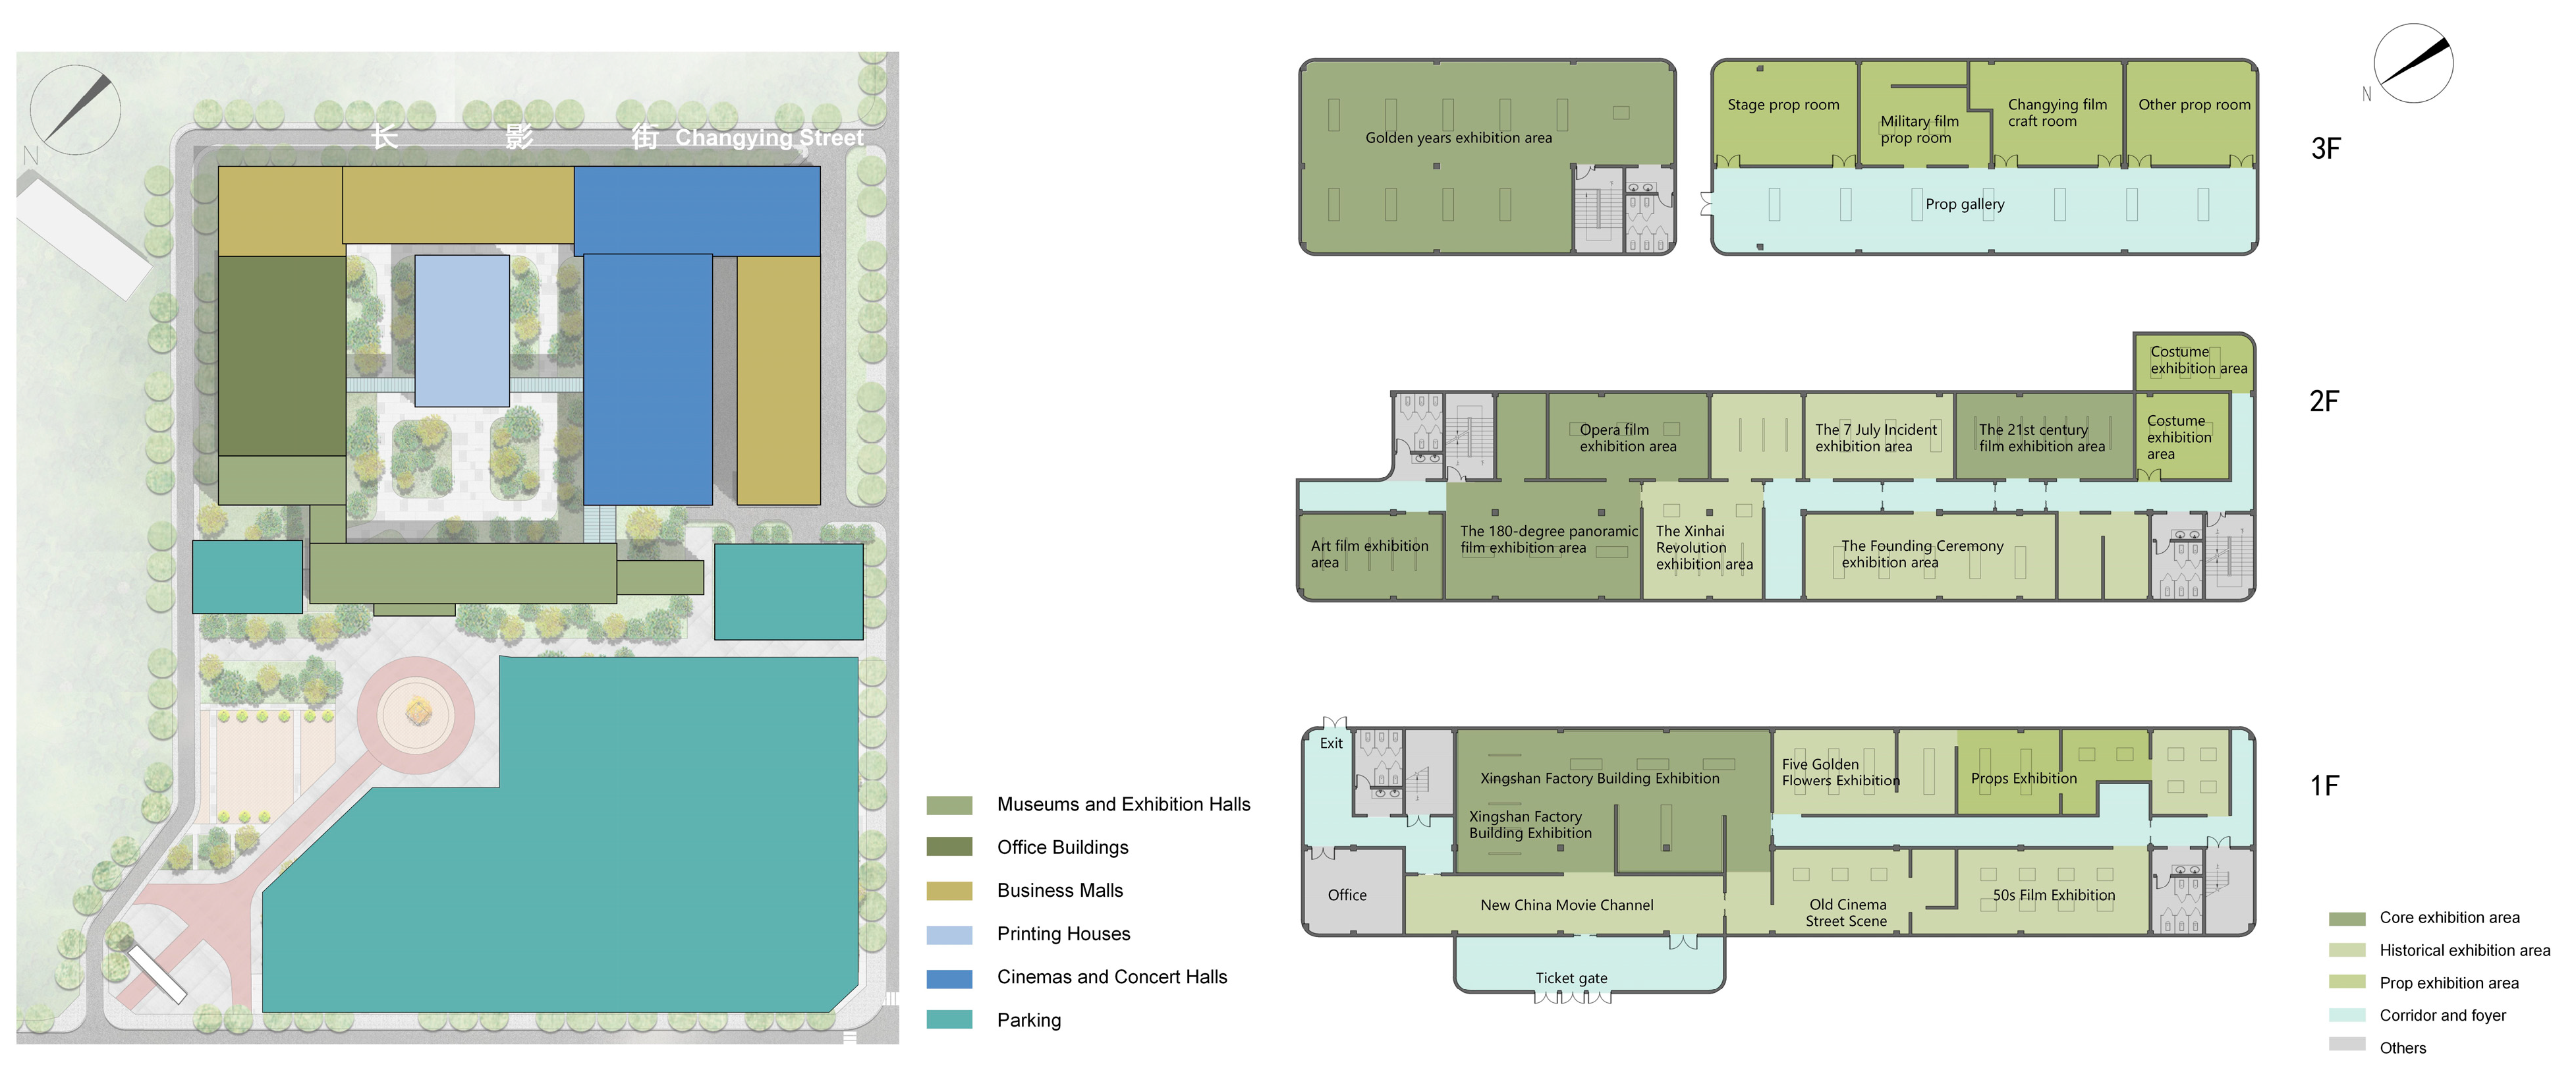
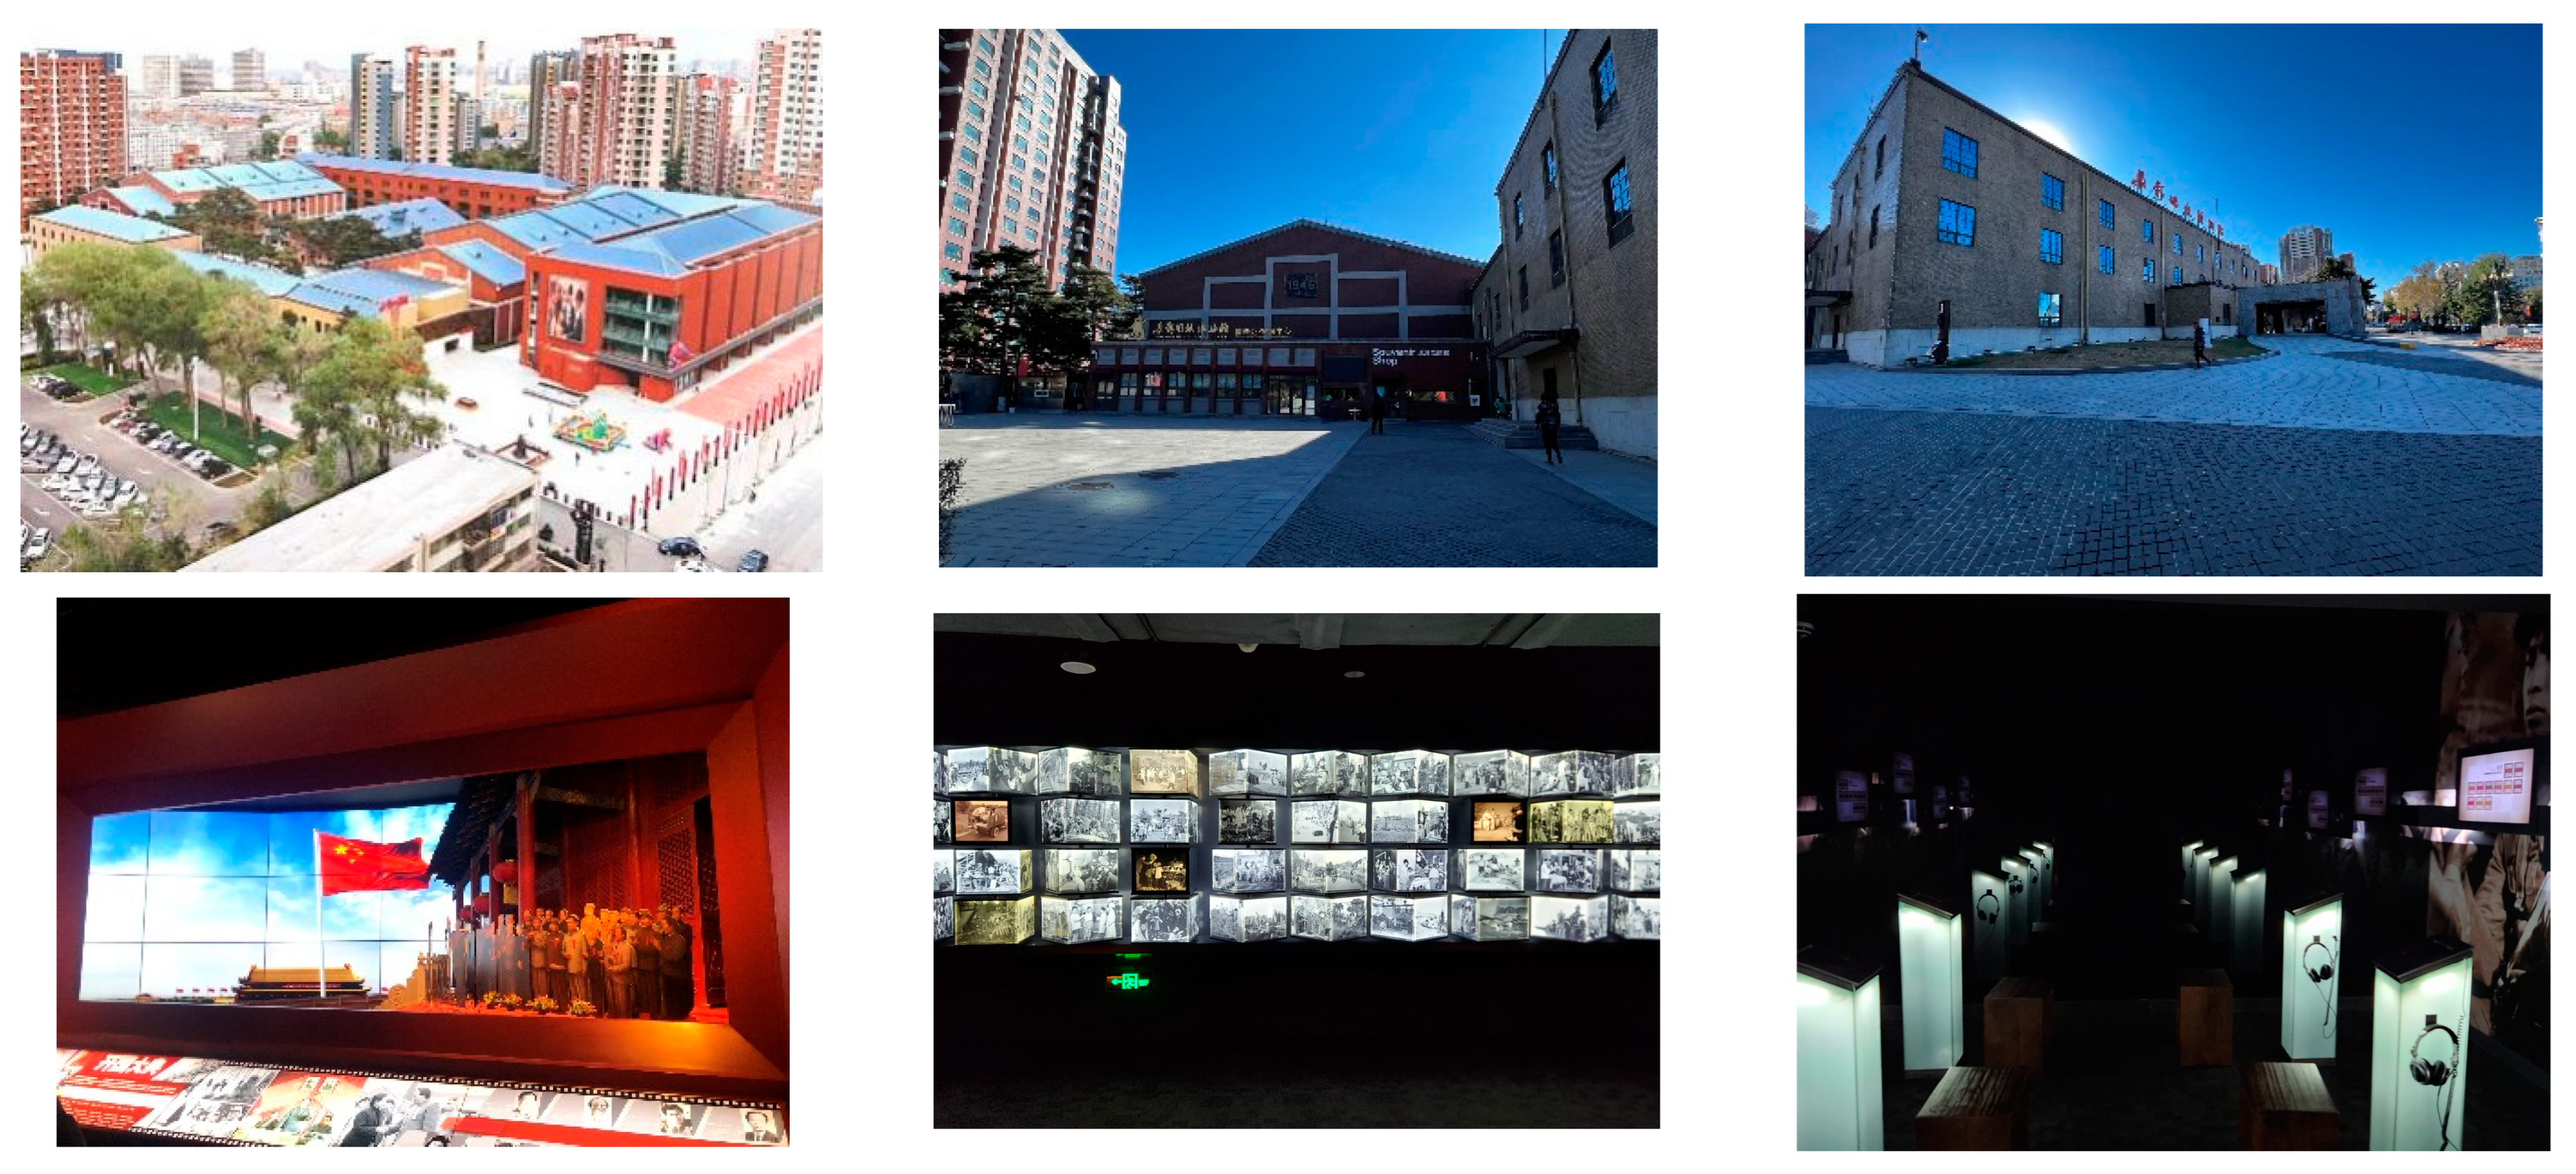
In 2011, the project embarked on an extensive renovation process, steadfastly guided by the principle of “restoring the old as the old”, culminating in a grand opening in 2014. The museum, with a construction area of 46,137 square meters, is systematically segmented into six distinct functional zones: The Changchun Film Art Museum, the studio, the printing workshop, the cinema, the concert hall, and the Changchun Film Studio Cultural Street. The museum documents Changchun Film Studio’s growth trajectory, advancements, flourishing periods, and transformative changes in detail. Furthermore, the museum offers a comprehensive showcase of the illustrious history and artistic accomplishments of Changchun Film and even the new Chinese cinema. Importantly, in 2015, the Former Site Museum of CFS was awarded the prestigious “Jilin Province Industrial Tourism Demonstration Point”. Subsequently, in 2017, it meritoriously earned a spot among the top ten industrial heritage tourism bases in China. In 2020, it was successfully selected into the fourth batch of Chinese industrial heritage. The architectural proposal and plan of the Former Site Museum of Changchun Film Studio are shown in Figure 8, and the detailed present situation of the Museum is in Figure 9.
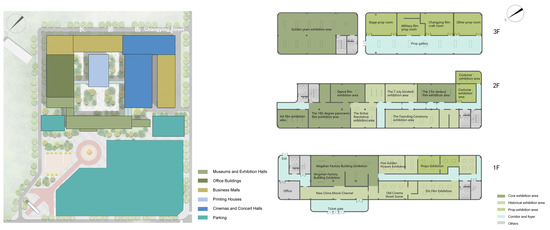
Figure 8.
Architectural proposal and plan of the Former Site Museum of Changchun Film Studio.
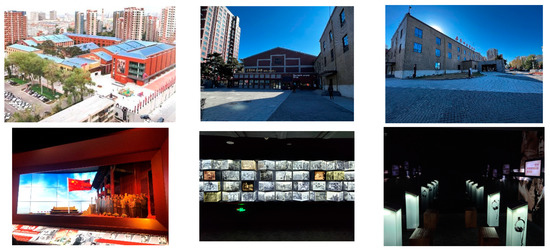
Figure 9.
Present situation of the Former Site Museum of Changchun Film Studio.
In this study, we employed the Former Site Museum of CFS, located in Changchun City, Jilin Province, as the experimental subject. This research strictly applied the innovative hybrid Bayesian network model to conduct a comprehensive numerical analysis of the subject. The primary goal is to comprehensively assess and summarize various aspects of the experimental subject, including its developmental status, future planning, adaptability, and sustainability. By doing so, the study aims to verify the rationality of the hybrid Bayesian network regarding the current renewal direction and propose more precise and targeted strategies for the development and revitalization of the experimental subject.
2.4. Experimental Method
In the Cambridge dictionary, the term “change” is defined as “to make or become different”. Therefore, change is an ongoing process rather than a simple result. The developmental journey of all entities is invariably traceable. Consequently, in alignment with the requirements of global sustainability strategies [82], this study employs various research methods, including literature review, Field Investigation, POI data analysis, AHP hierarchical analysis, and Bayesian network, to explore the direction of industrial heritage renewal. Based on these methods, we created a new hybrid Bayesian model: the BN-POI-AHP hybrid Bayesian network mode. This model serves to conduct an initial analysis to determine the most suitable renewal and development direction for the target project, thereby providing guidance for decision-makers and stakeholders. To validate the effectiveness of the model, a specific case study of CFS is examined using the BN-POI-AHP hybrid Bayesian network model and is compared with the actual results to argue the advantages and disadvantages of this new model.
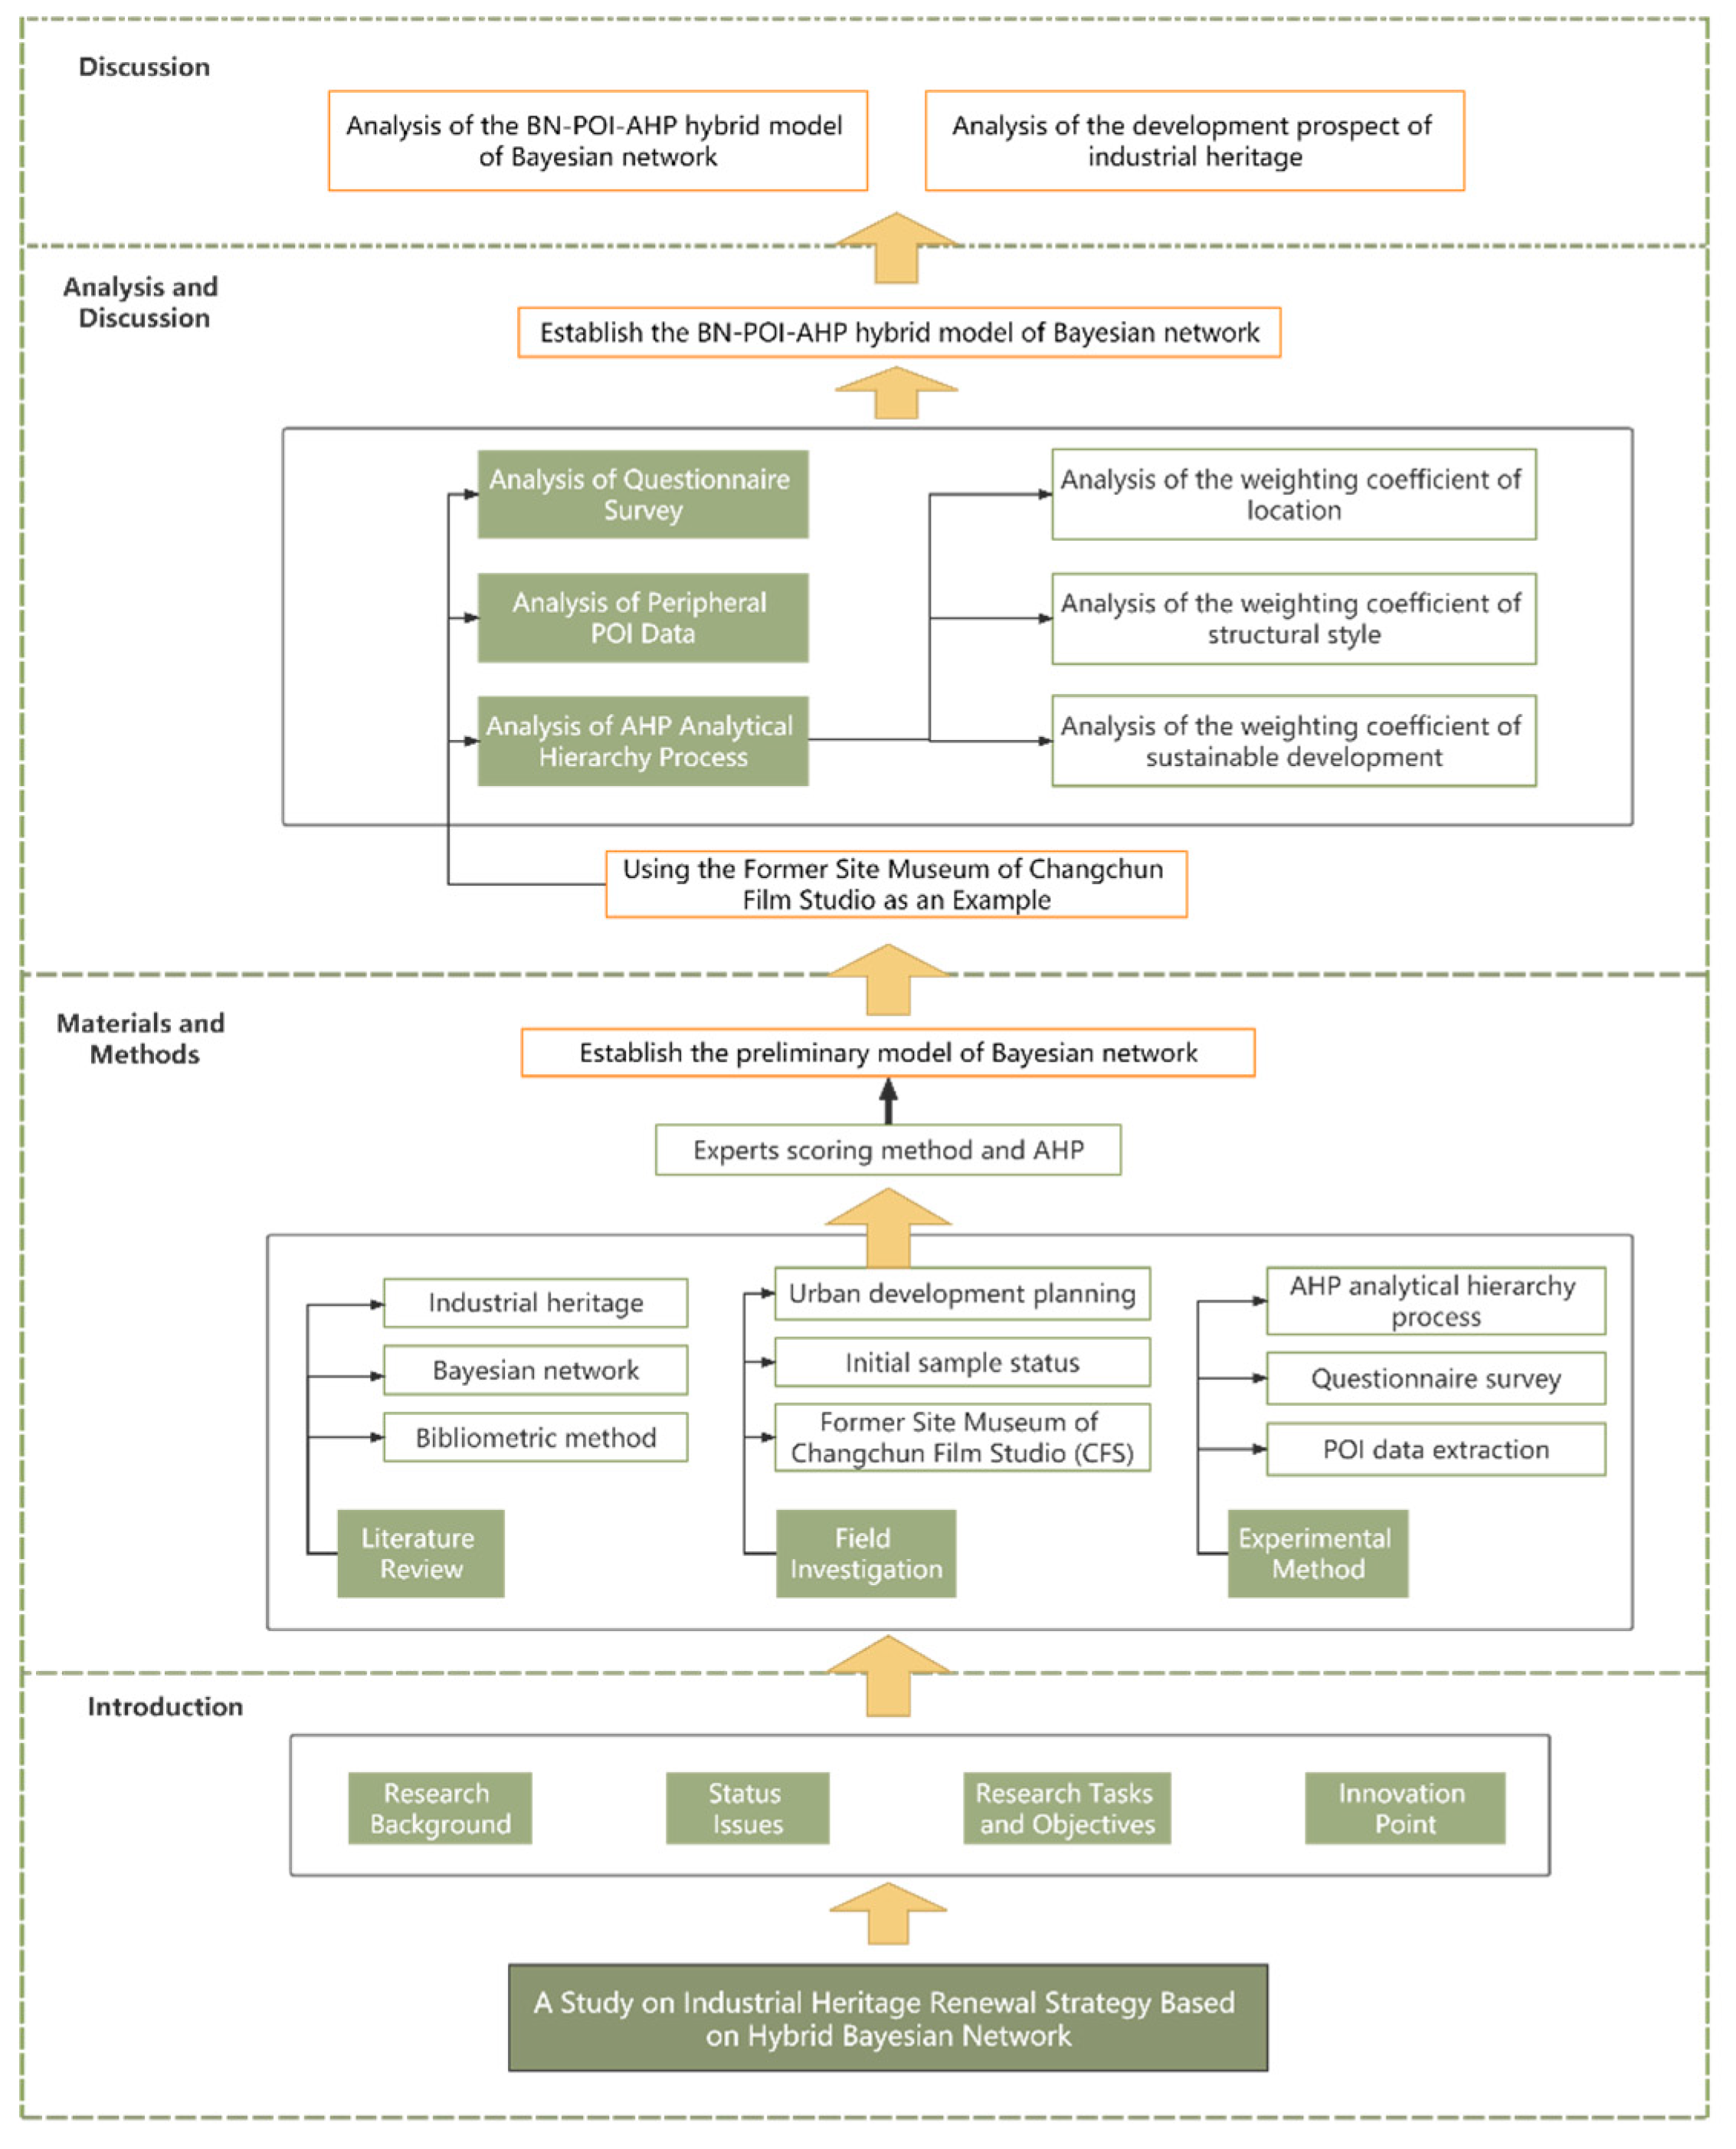
The technology flow chart is depicted in Figure 10.
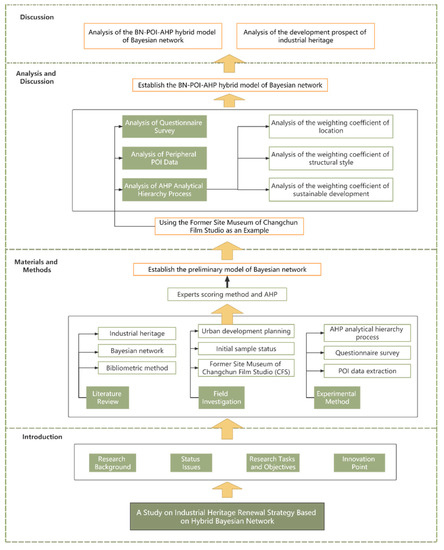
Figure 10.
Technology flow chart.
The process of this study is as follows:
- First, we analyzed keywords in the literature pertaining to industrial heritage, urban renewal, heritage renewal, and related fields using CiteSpace software and conducting a literature review. The initial analysis aimed to discern the demand for industrial heritage renewal forms and identify the principal influential factors in the context of sustainable development and establish intermediate nodes B1–B6.
- Second, the intermediate nodes of “Location”, “Structural Style”, and “Sustainable Development” can be determined based on expert opinions, providing general content. Additionally, the leaf nodes of “Urban Planning” are derived from the development planning requirements of select first-tier cities in China.
- Third, for “Surrounding Resources”, a questionnaire and face-to-face interviews are conducted to select projects in China that represent the historical and industrial categories of the country’s industrial heritage. These projects serve as initial sample data to develop the root nodes for training the hybrid model. Then, we obtain the POI data around the research object and the total POI data under the related industry classification of the whole city and combine the kernel density analysis method to analyze the proportion of data of different fields in the city.
- Fourth, the leaf nodes of “Surrounding Residents” are obtained through a questionnaire conducted among residents residing in proximity to the target. This survey aims to gain insights into the future needs of the residents and explore the anticipated trends in user requirements over the next 15–25 years.
- Fifth, we review literature related to the AHP analytical hierarchy method and combine it with expert industry guidance to determine whether the AHP method can be employed to investigate the 6 intermediate nodes and 10 root nodes in the Bayesian model.
- Sixth, we create a comprehensive innovative BN-POI-AHP hybrid Bayesian network model.
- Seventh, taking the Former Site Museum of Changchun Film Studio (CFS) as a case study, the questionnaire and face-to-face interviews data collected from the surrounding residents and the data on surrounding POI are incorporated into the hybrid Bayesian network model. Then, the strengths and weaknesses of the hybrid model are evaluated.
- Finally, based on the experimental data from the case study and combined with the literature survey method, an analysis is conducted to examine the development prospects and limitations of the BN-POI-AHP hybrid Bayesian network model.
2.4.1. Face-to-Face Interviews
The face-to-face interview method, initially employed in sociology and social psychology, has gradually permeated various professional fields due to its versatile application. This method is particularly suitable for investigating individual attitudes toward space utilization and cannot be replaced by observational survey methods. Nowadays, there is an increasing trend to employ face-to-face interviews as a form of public engagement [83,84]. Consequently, the subjective demands of residents around the research sample represent a crucial factor that cannot be ignored.
To ensure the relevance and purposefulness of the face-to-face interviews, the design of our questionnaire adhered to the following sequential steps and principles:
- Initially, we refined the questionnaire information based on the primary research purpose and content of this study. This step facilitated the determination of relevant items in the questionnaire survey. It was assessed by industry experts for the accuracy and representativeness of the question items.
- Next, we defined the scope of the survey respondents, considering variables such as residential districts and age ranges.
- Subsequently, we disseminated and collected questionnaires to ensure a sufficient number of valid responses, and used face-to-face surveys for those who were too old to finish the questionnaire alone.
- Finally, we systematically organized and analyzed the collected questionnaire data.
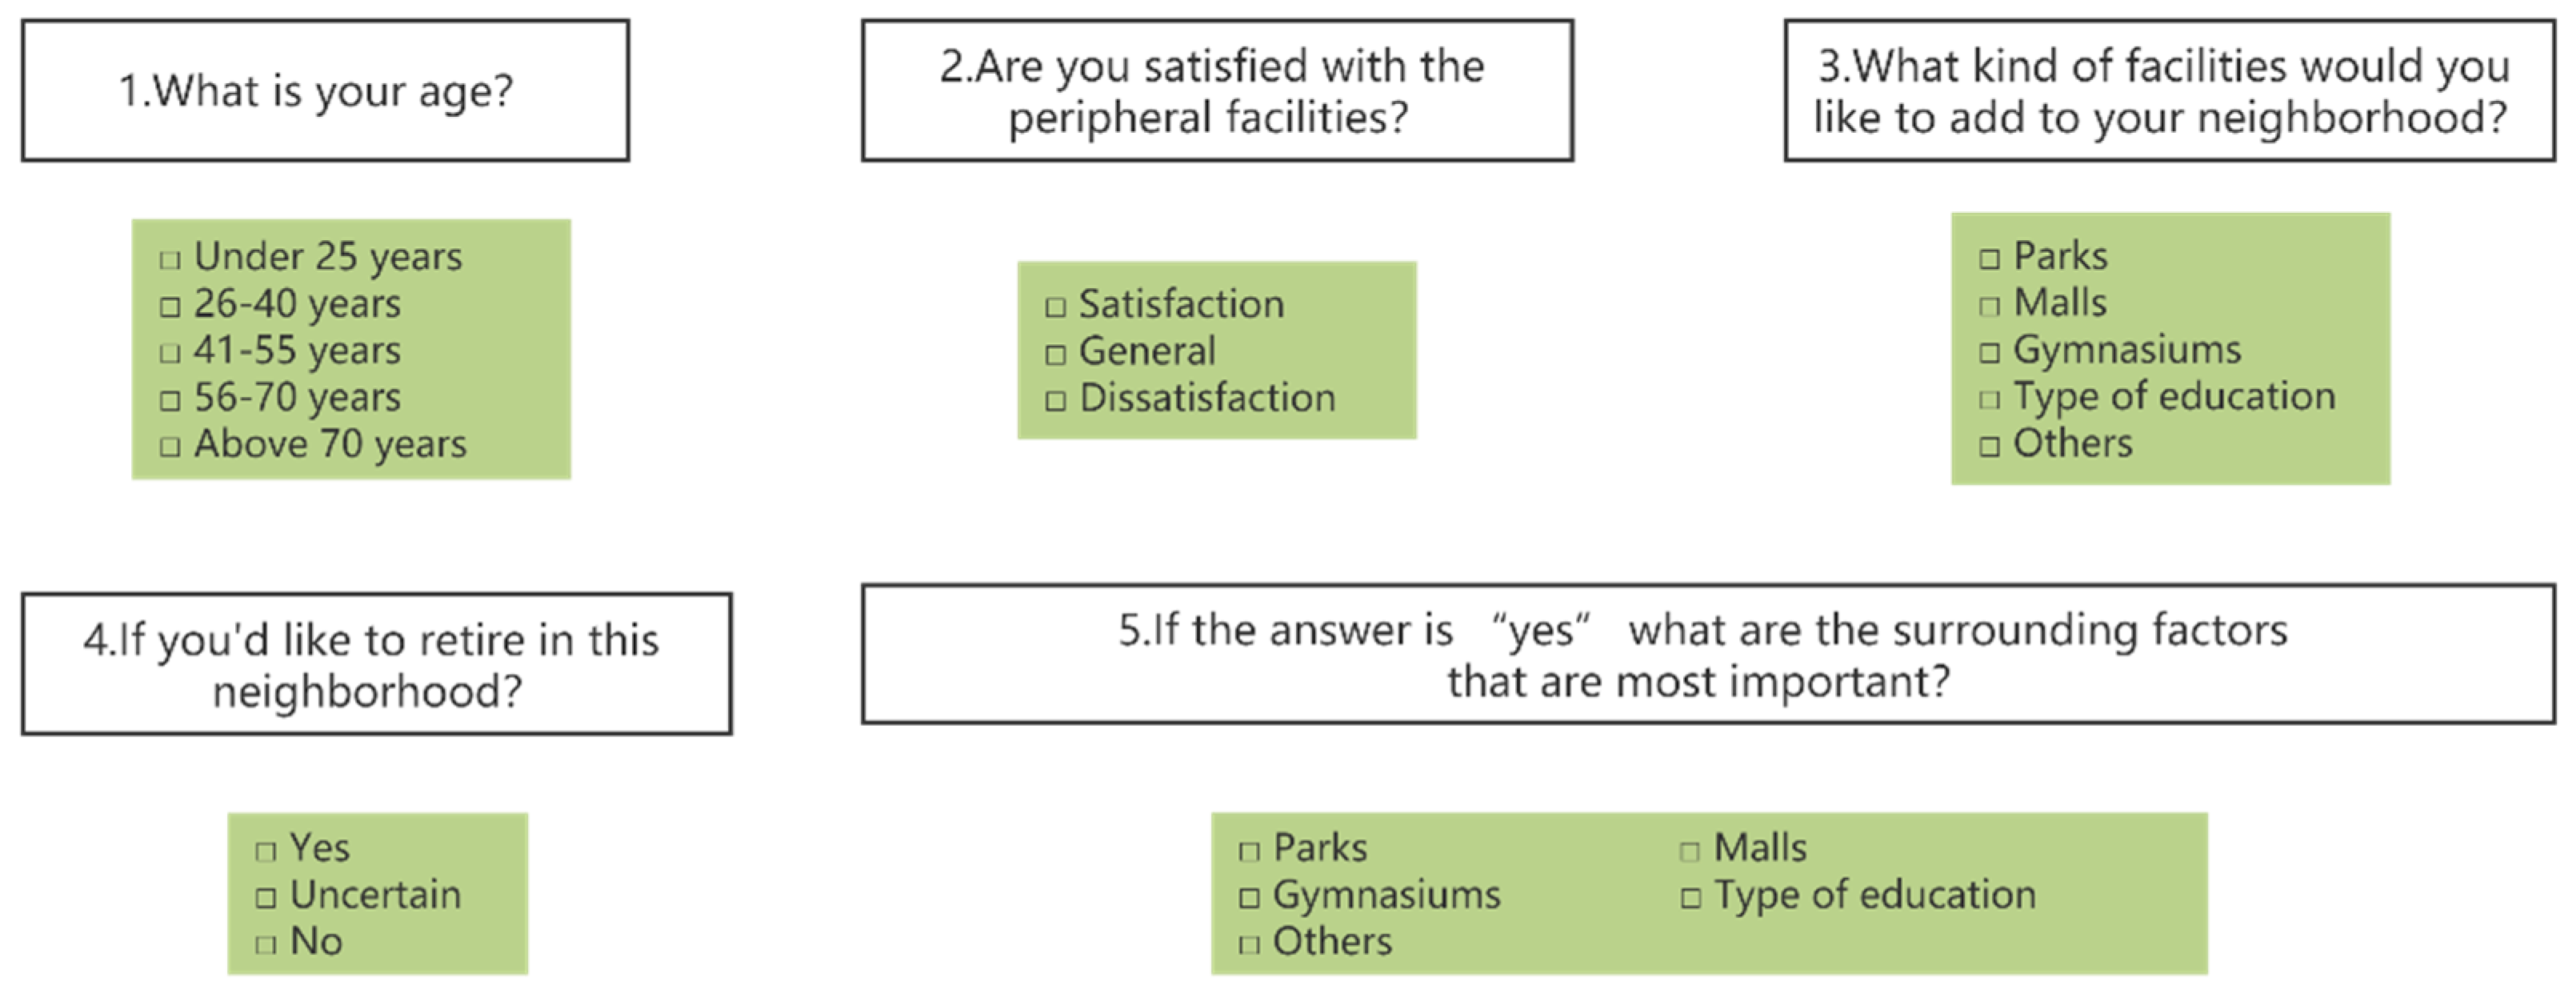
The relevant items for the face-to-face interviews were determined as follows (Figure 11):
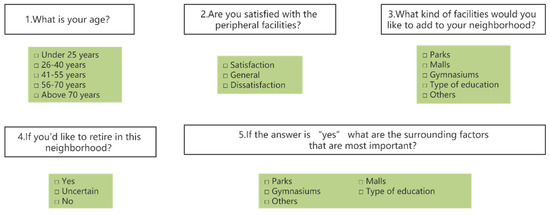
Figure 11.
The relevant items for the face-to-face interviews.
After the experts’ evaluation of the question items, several choices were modified. The outcomes of this question selection hold paramount importance within the present study, despite certain limitations. It is crucial not to overlook factors such as subjectivity, bias, and other aspects related to the research subjects. In order to mitigate potential errors, we strictly adhere to the principles of respect and equality when interacting with survey respondents. Our approach ensures that outcomes are non-harmful and non-beneficial, irrespective of the results. Regarding the selection of survey respondents, we advocate a randomized approach that encompasses all age groups, thereby minimizing selection biases and associated errors.
Consequently, our analysis has led us to determine that the leaf nodes relevant to the “Surrounding resident(B4)” in the model include “attitudes” and “attitudes in future”.
2.4.2. POI Data Extraction
This section of the POI data set provides unprocessed data used to train the hybrid Bayesian model, primarily applied within the leaf nodes of the “Surrounding resources (B2)”. POI (point of interest) represents a crucial geospatial data information resource. With the rapid advancement of Internet technology, various map service platforms include a large amount of POI data, which can significantly contribute to a city’s development and urban planning. In this research, we obtained POI data within a 5 km radius of the samples for five industrial heritage renewal projects. These data, gathered in December 2022, include information on schools, businesses, scenic spots, and residences. Moreover, we gathered all of the data from the urban areas where the samples were located. The comprehensive POI data set includes various critical details such as the name, address, longitude, and category information of each point. In addition, the category information of each point was divided into 21 primary categories, 183 secondary categories, and 1825 tertiary categories. In this study, the main data categories were six categories, which are considered as the leaf nodes of B2. The project classification and detailed content are depicted in Table 4.

Table 4.
Project classification and detailed content.
For this study, the essential POI data consist of fundamental information stored in the geographic information repository. Building upon insights gained from previous research that utilized POI data by other experts [85,86,87], we have processed and integrated the POI data from Baidu (https://lbsyun.baidu.com/ (accessed on 30 April 2023)) and Gaode (https://lbs.amap.com/ (accessed on 30 April 2023)). These two major companies, Baidu and Gaode, sufficiently cover the most significant databases of geographic information in China. Therefore, we believe that their data have a high accuracy.
The data processing and analysis were conducted as follows:
- Step 1: Process POI data
We conducted a comparison between the information in the two geographic databases, specifically focusing on retaining identical information. Regarding dissimilar information, we kept higher similarity information through a comparison using the Geospatial Data Cloud platform. In cases where information items had missing values, we promptly consulted the experts and compiled a list of vacant items which excluded essential attributes such as “name”, “primary classification”, “secondary classification”, and “latitude and longitude”. Information meeting these criteria was deemed valid and retained, while information failing to meet the criteria was considered invalid and subsequently deleted. Furthermore, we eliminated functional urban information that bore no relevance to this study, such as road appurtenances, shared equipment, entrances and exits, and government activities.
- Step 2: Kernel density analysis
Kernel density analysis currently stands as one of the vital methods for POI data analysis and is also regularly used in spatial hotspot studies. This method facilitates the creation of a spatial aggregation distribution map through statistical analysis of point or line elements. It takes into account the diffusion characteristics of urban facility services that impact the surrounding locations, where areas closer to the core have a greater weight. The formula for calculating kernel density is as follows (1):
where f(x) is the estimated kernel density value at the spatial location point x; h is the bandwidth (that is, the search radius of the kernel density function); n is the total number of POIs. The POI data distribution within 5 km of the study sample is depicted in Table 5.

Table 5.
The POI data distribution within 5 km of the study sample.
- Step 3: Validate the data
The acquisition and processing of POI data present certain limitations. Firstly, although we utilize data from two prominent geographic information companies in China, it cannot be guaranteed that every data point, which amounts to tens of thousands, is completely accurate. However, since the data used represents a percentage and the average total number of data points is around 2000, the presence of errors in a few data points will not significantly impact the resulting percentage. Secondly, during data processing, it is essential to identify outliers and skewed distributions based on statistical requirements. Relying solely on observing the data distribution to determine abnormality is not sufficient. The identification of outliers necessitates incorporating background information, research areas, and industry realities to evaluate whether the data align with expected patterns. To address this concern, we employ the triple standard deviation method for data verification [88]. This approach involves calculating the mean and standard deviation of the data and validating it according to the criteria established by the triple standard deviation method.
The guidelines of the triple standard deviation method were shown as follows: 1. Data Di that satisfy Di < 2σ are considered as normal; 2. Data Di that satisfy 2σ < Di < 3σ are considered early warning data, requiring expert assessment to determine their adherence to expectations; 3. Data that satisfy Di > 3σ are regarded as abnormal and necessitate re-collection and recalculation [88].
Based on the data computed in Table 6, it is evident that most of the data fall within 2 times the standard deviation range. Additionally, there are only three data points that lie between 2 times and 3 times the standard deviation range. After careful expert consideration within the specific field context, these three data points were determined to be reasonable.

Table 6.
The percentage and deviation average of the POI data.
- Step 4: Normalization process
The Z-transform is a standardized data transformation method that converts data into what is known as standard form, where all data have a mean of zero and a standard deviation of one. This process, commonly used in statistics, serves to standardize the statistical distribution of a unified sample, simplifying computational methods and facilitating data extraction. In this study, normalization mapped each group of sample data to a value of 1, as demonstrated in Table 7. The specific calculation adheres to the following Formula (2):
where is the percentage of the original data in the citywide data and is the percentage after normalization [85].

Table 7.
Normalized analysis of the POI data distribution within 5 km of the study sample.
The normalized data are brought into the seven leaf nodes of “Surrounding resources (B2)” in the hybrid model and used to train the hybrid Bayesian model.
2.4.3. Analytical Hierarchy Process Method
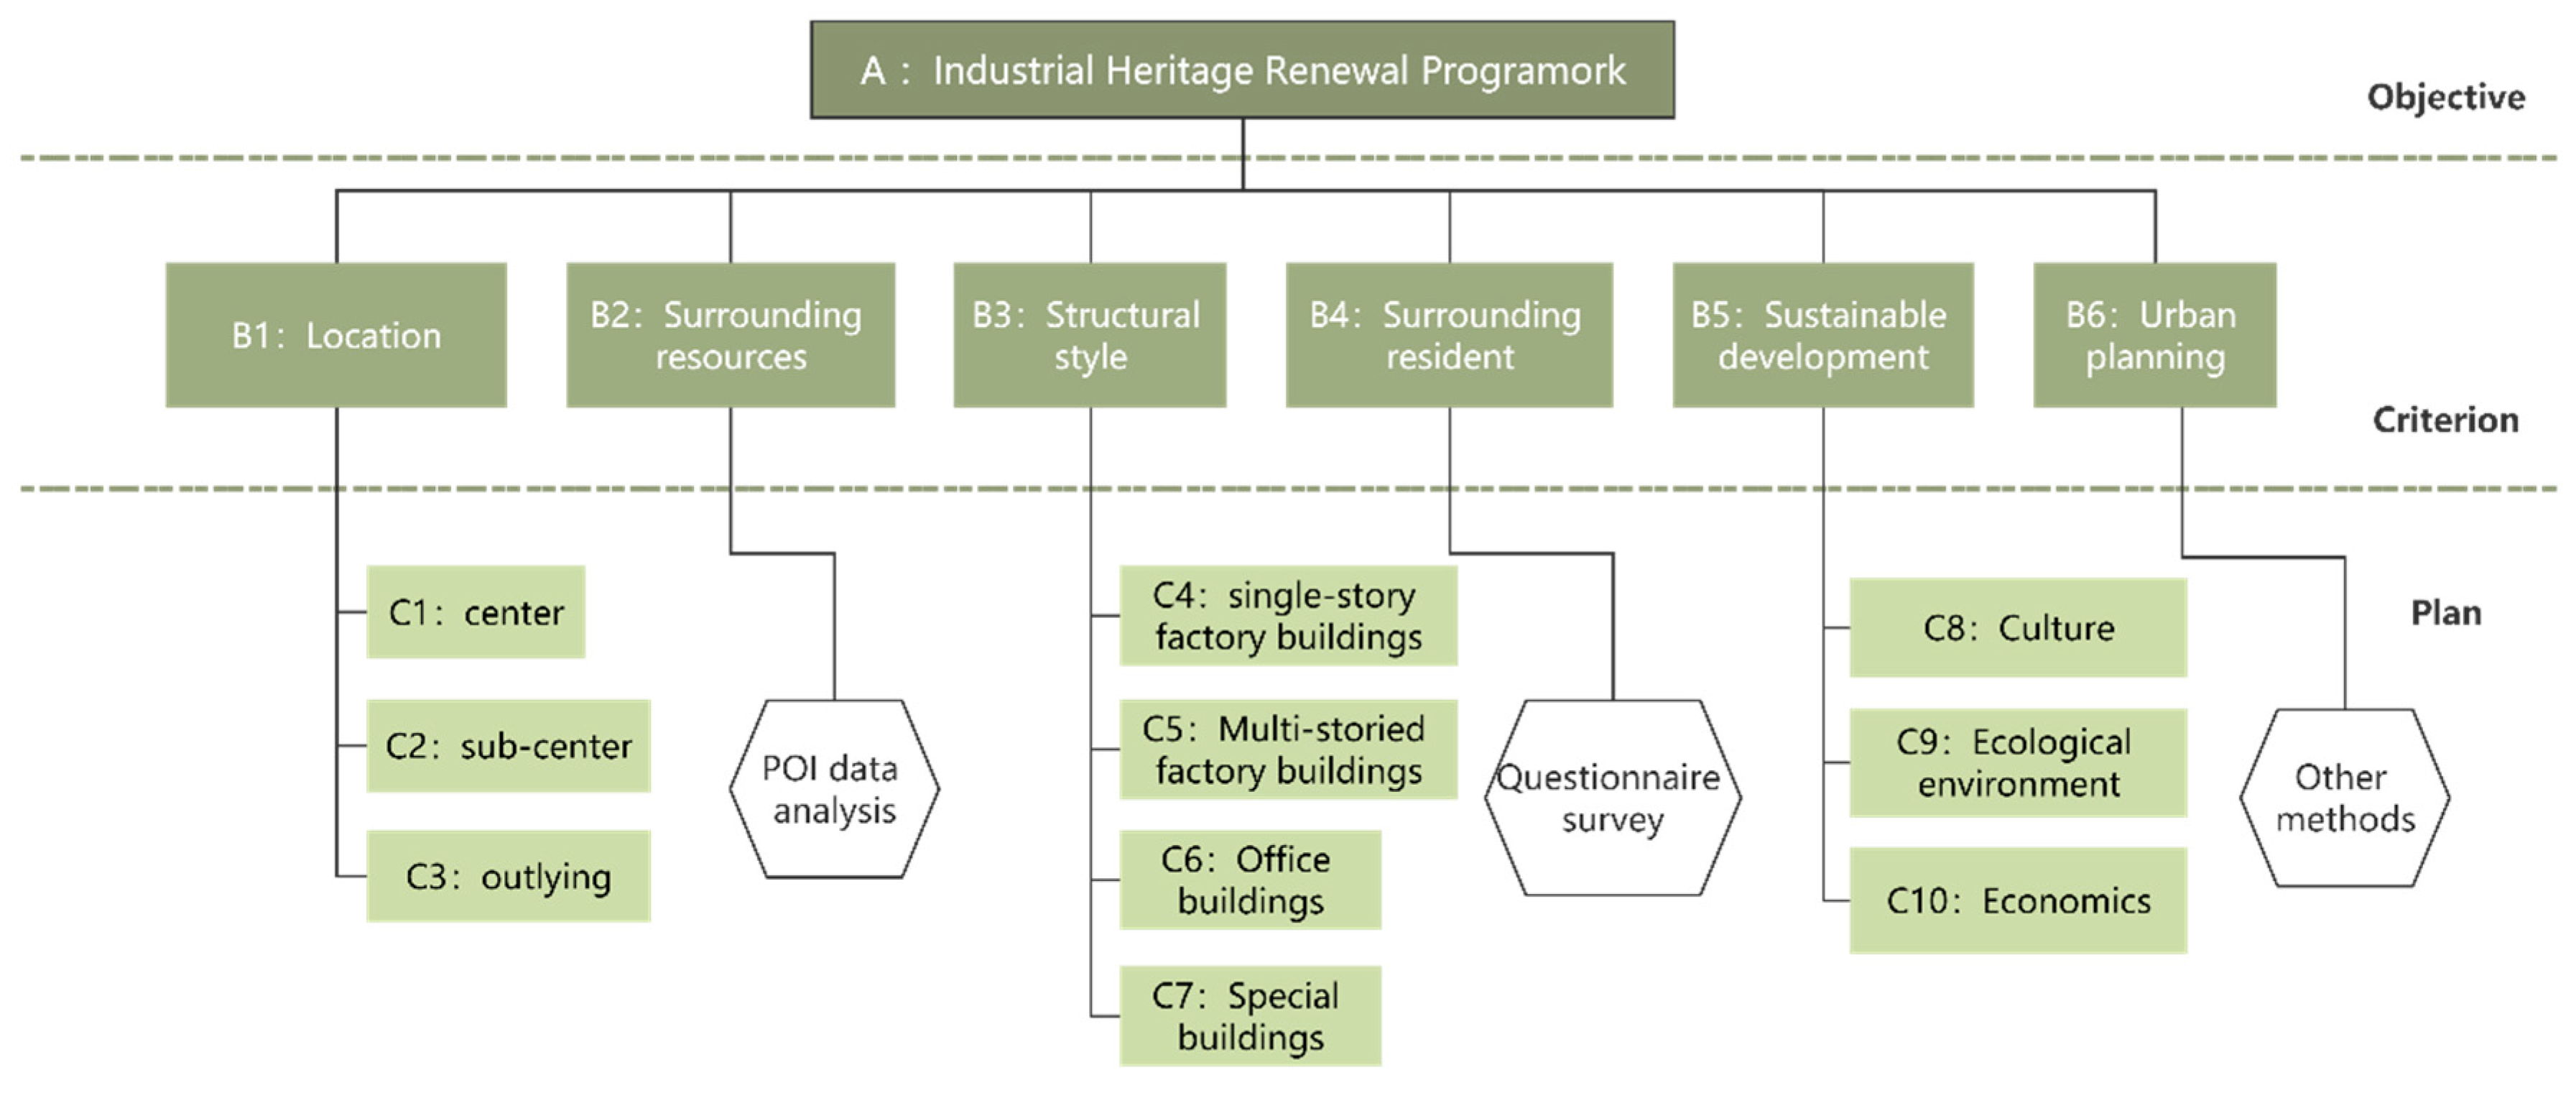
The analytic hierarchy process, often abbreviated as AHP analysis, is a comprehensive decision-making method that blends qualitative and quantitative analysis. It utilizes mathematical techniques to articulate the problem requiring resolution and is specifically tailored for large-scale applications [89]. It is suitable for multiple objectives, a multitude of factors, numerous criteria, and challenging complexity. In this study, we employed AHP analysis within the foundational structure of our preliminary Bayesian network model [90]. Through this integrative approach, we determined that the weights of six intermediate nodes (secondary indicators B1–B6 in AHP) and ten root nodes (tertiary indicators C1–C10 in AHP) in the Bayesian model using the AHP method. The concrete application of this process is depicted in Figure 12.
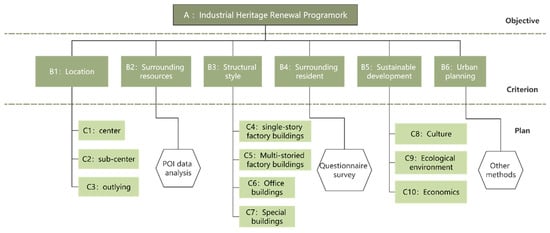
Figure 12.
Construction diagram of the AHP analysis elements.
The steps are as follows:
- Evaluate pairwise comparisons of criteria: for each pair of criteria, it is necessary to determine which criterion is more important. With the input of industry experts (including middle and senior engineers from planning or architectural design institutes and professors of architecture-related majors in universities in Changchun), we determined the roles and levels of importance of each index in the industrial heritage renewal strategy. We then constructed each index layer and performed pairwise comparisons. The values within pairwise comparisons of criteria were shown in Table 8 [91].
 Table 8. Linguistic scale during the 0–10 interval.
 - Develop judgment matrices: After pairwise comparisons have been made for all pairs of criteria, judgment matrices need to be developed. The data were subsequently divided into four groups, and the corresponding judgment matrices were created based on pairwise comparisons.
- Calculate criteria weights: After all judgment matrices are developed, it is necessary to calculate the weight of each criterion. The judgment matrices must be transformed to obtain the numerical values of the weighting indicators. For this, the eigenvalue of the judgment matrices and the priority vector are used.
- Check consistency: It is important to check the consistency of the obtained results using the consistency ratio. This can prove the validity of the data.
The specific data analysis process will be presented in Section 3.
2.4.4. Bayesian Network
The construction of Bayesian networks generally follows three main methods, as outlined in Table 9 [91]. In this study, we primarily employed the third method. After rigorously reviewing a plethora of literature related to industrial heritage cases, seeking the counsel of industry experts, and implementing field investigations, we determined the specific content of target variables and observation variables. Subsequently, we constructed an initial Bayesian network model using the Netica® software (version 5.18) and GeNle® software (version 2.1.1104). Concurrently, we conducted a detailed analysis of the individual components of each intermediate node, using both data and expert assessments to further refine the model. The frame of the Bayesian network model is depicted in Figure 13.

Table 9.
Bayesian network model construction method and content.
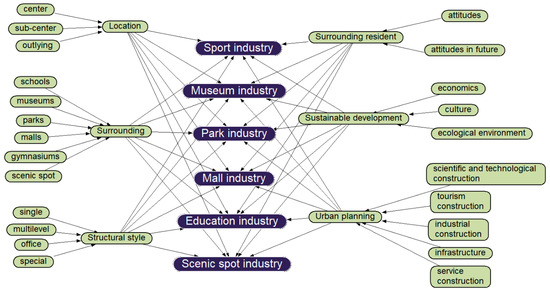
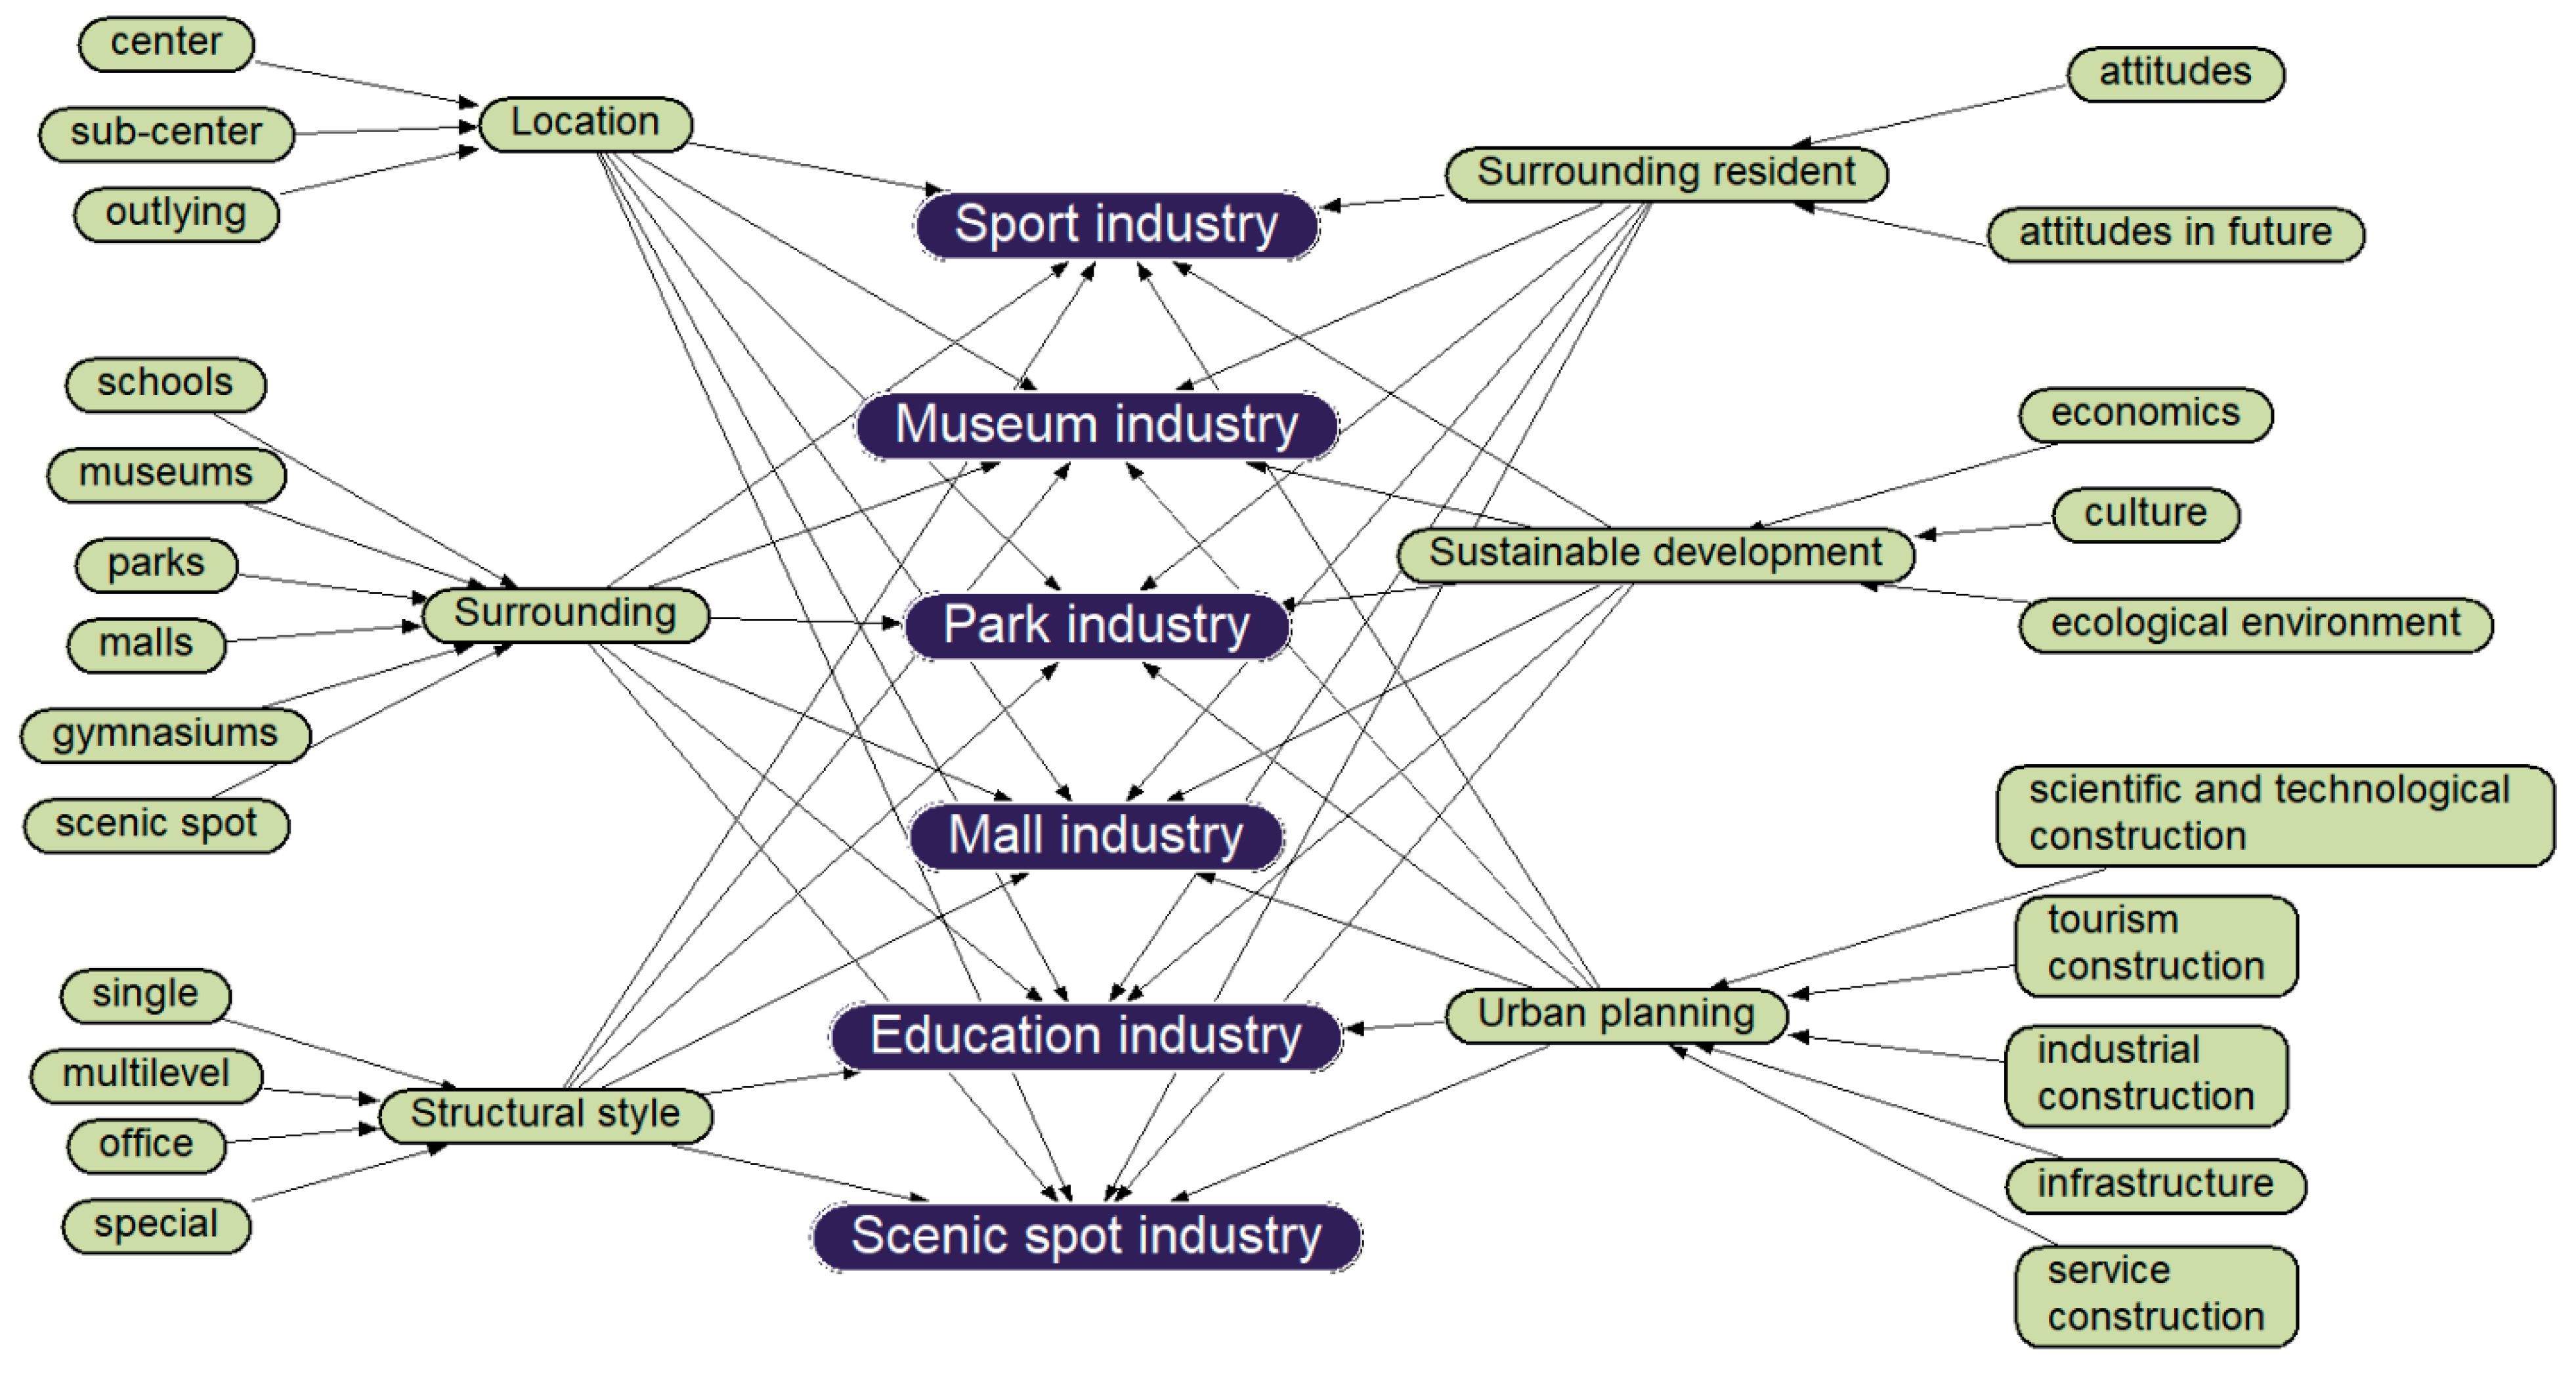
Figure 13.
The initial framework of the Bayesian network model diagram.
In Section 2, we have previously discussed the advantages and disadvantages of Bayesian networks, as well as the current application results of hybrid Bayesian models. Taking into consideration the characteristics of this study, we have carefully chosen several hybrid Bayesian networks approaches to construct a suitable hybrid network for this project. Our comprehensive analysis of all leaf and root nodes has led to the identification of two pivotal technical methods in this model: POI and AHP analysis. The former offers distinct advantages in terms of geographic information, while the latter has been widely applied by scholars, demonstrating the effectiveness of the hybrid model that combines AHP and Bayes. As a result, we have created an initial complete BN-POI-AHP hybrid Bayesian network model system and proceeded to train the new hybrid model using the acquired POI data and AHP data from five cities.
3. Analysis and Discussion
3.1. Quantitative Analysis of the AHP Method
- Step 1: Develop Judgment Matrices
The data were subsequently divided into four groups, and the corresponding judgment matrices were created based on the pairwise comparisons outlined in Table 10, Table 11, Table 12 and Table 13.

Table 10.
Group 1 evaluation model and weight values of each indicator.

Table 11.
Group 2 evaluation model and weight values of each indicator.

Table 12.
Group 3 evaluation model and weight values of each indicator.

Table 13.
Group 4 evaluation model and weight values of each indicator.
- Step 2: Calculate criteria weights
Calculate the feature vectors of these four data sets.
In this phase, “W” represents the weight ranking of the factors at the same level, reflecting the relative importance within the preceding level—a process known as hierarchical single ranking. “Aw” signifies the result obtained by multiplying the original matrix with the “w” matrix of feature vectors. Detailed calculations are provided in Table 14, Table 15, Table 16 and Table 17.

Table 14.
Calculation of the judgment matrix of Group 1.

Table 15.
Calculation of the judgment matrix of Group 2.

Table 16.
Calculation of the judgment matrix of Group 3.

Table 17.
Calculation of the judgment matrix of Group 4.
The maximum eigenvalues (λmax) for each factor were subsequently calculated using the below equation, with the detailed results presented in Table 18:
where n is the order of the judgment matrix.

Table 18.
Judgment matrix consistency test table.
- Step 3: Consistency Test for the Data Results
The consistency test criterion states that hierarchical single-ranking results are considered consistent when the random consistency ratio (CR) is less than 0.1. The formula for the test is as follows:
where RI is the average random consistency index, the values of which are shown in Table 19 [92].

Table 19.
RI table of values.
Based on empirical evidence, all four groups of judgment matrices comply with the consistency test requirements, as comprehensively detailed in Table 18.
3.2. Created the BN-POI-AHP Hybrid Bayesian Network Model
According to the initial Bayesian network model, the BN-POI-AHP hybrid Bayesian network model is created by integrating POI data and AHP data. The process involves the following fundamental steps:
- Step 1: Build the hybrid model.
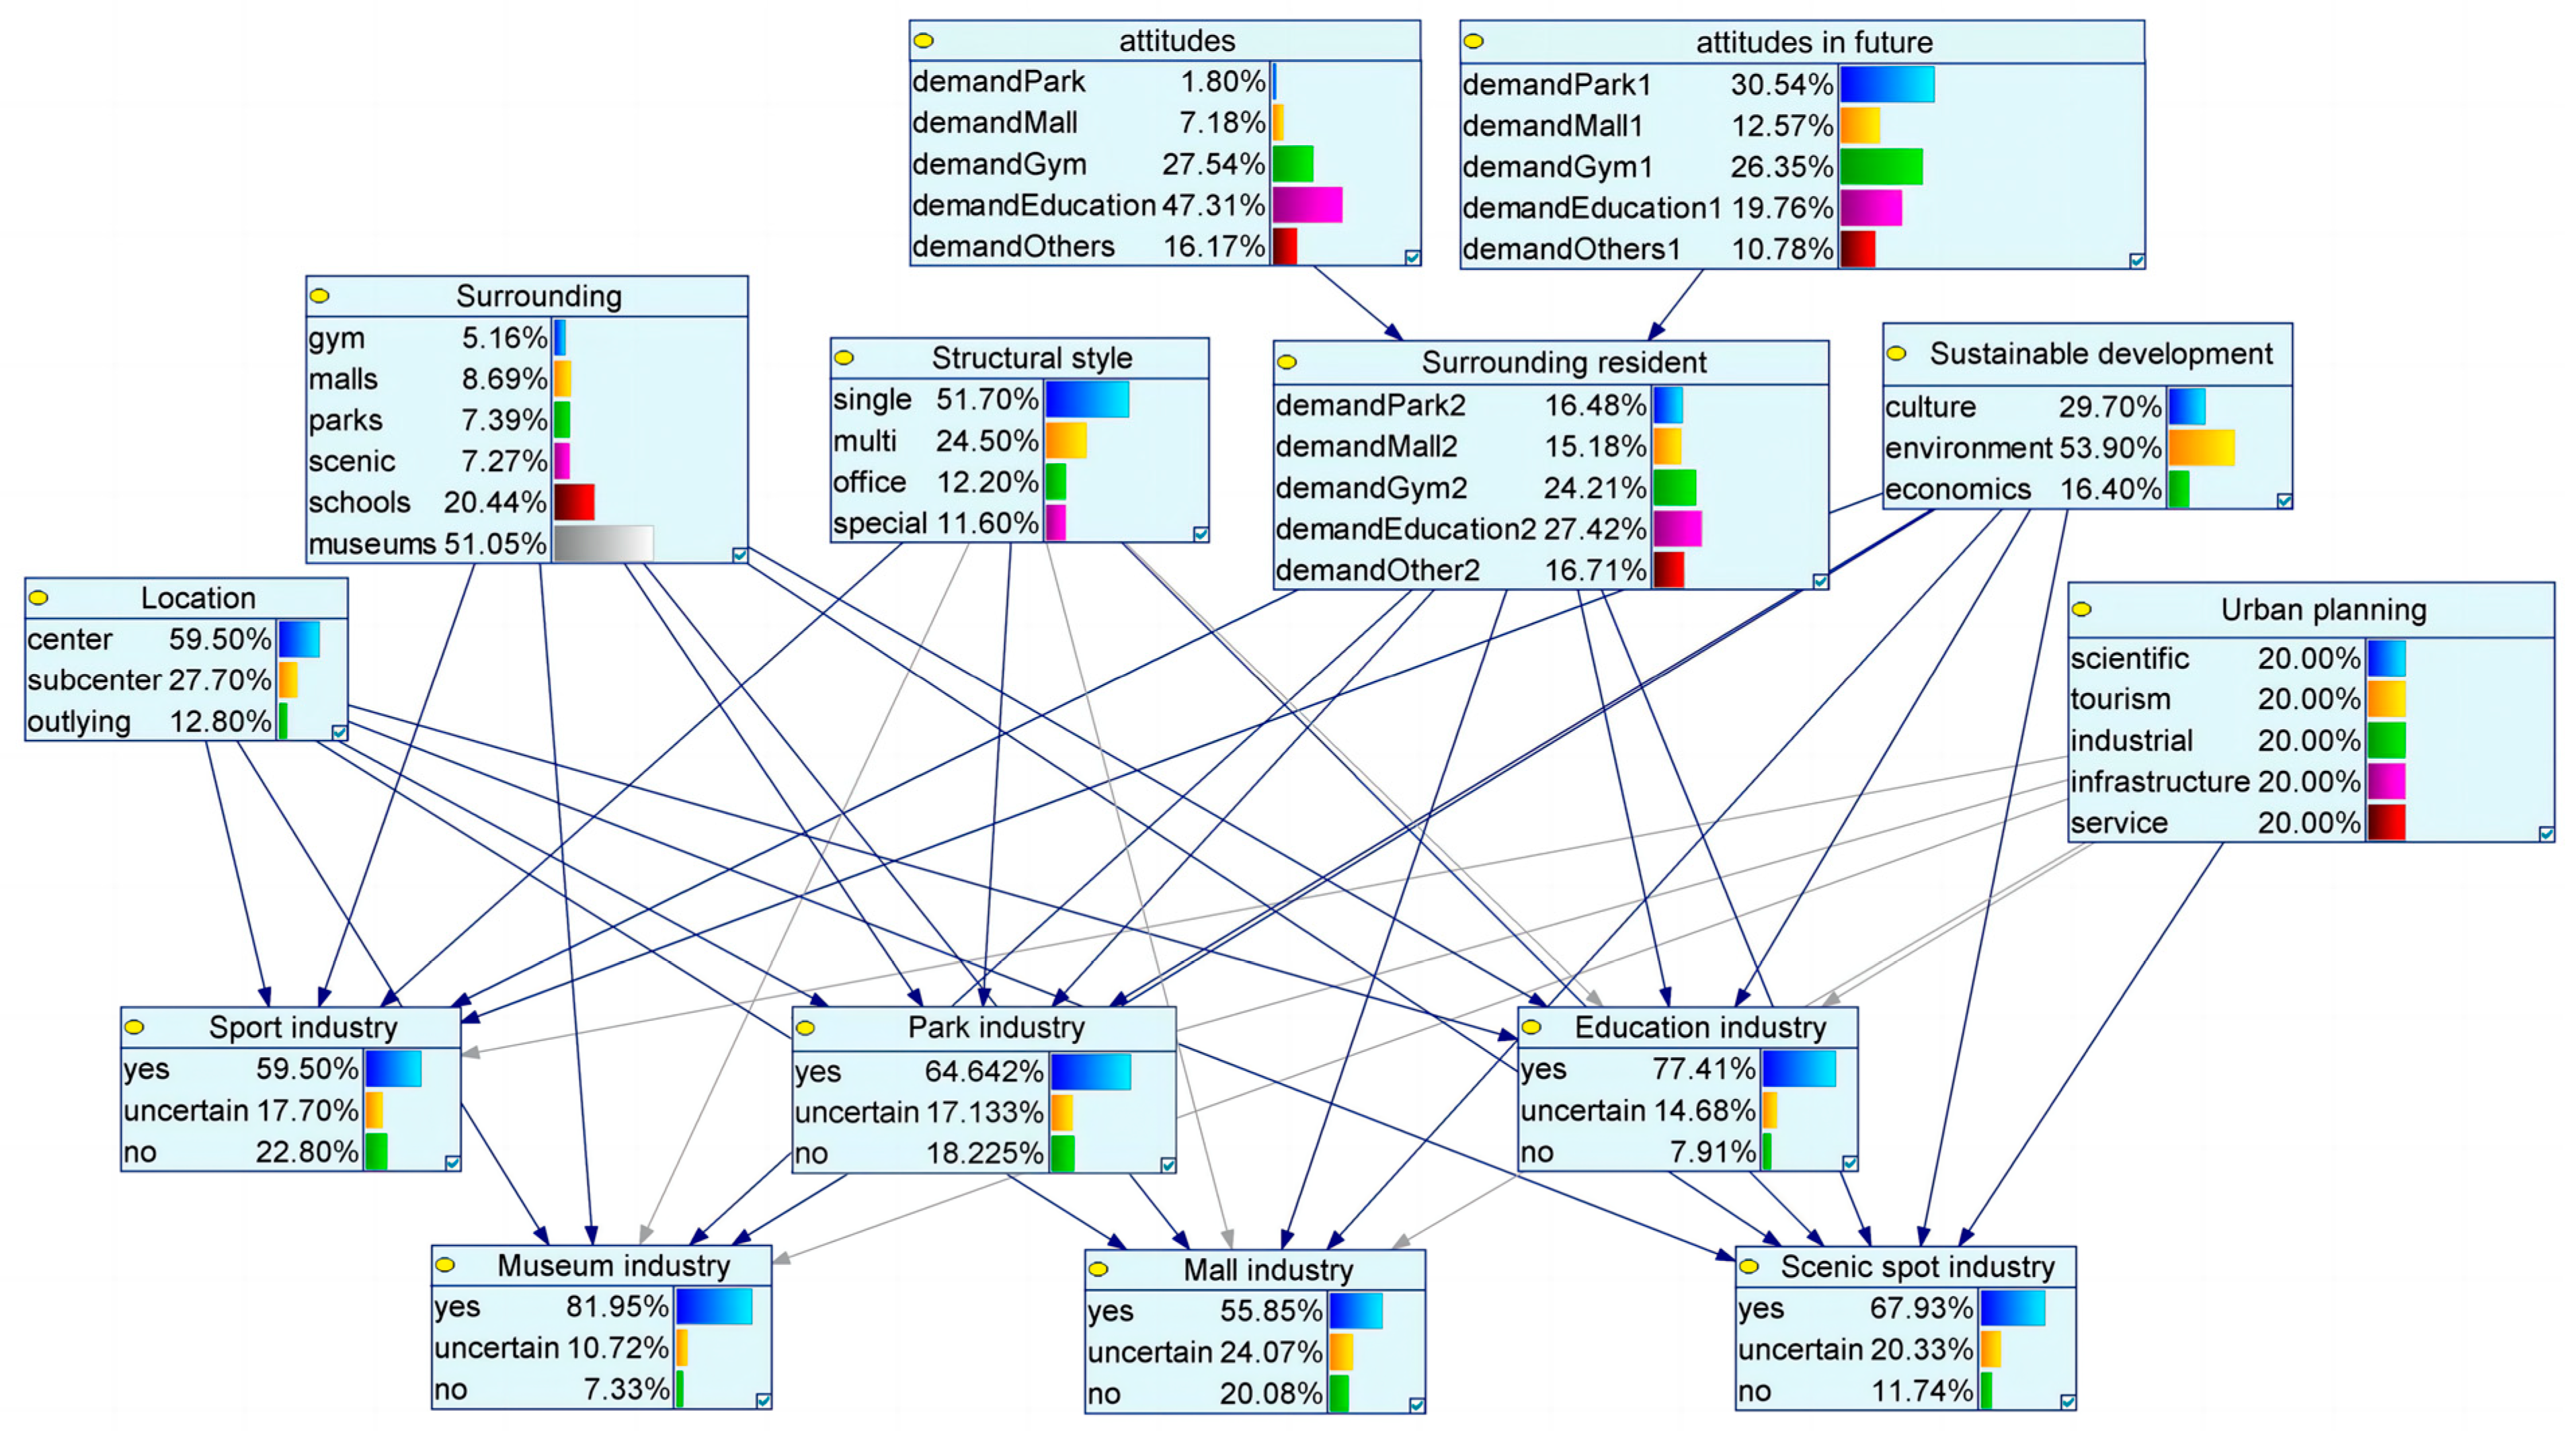
Utilize Netica® software (Version 5.18) or GeNle® software (Version 2.1.1104.0) to develop the Bayesian network model. For this study, Netica software was employed to build the model, as depicted in Figure 14.
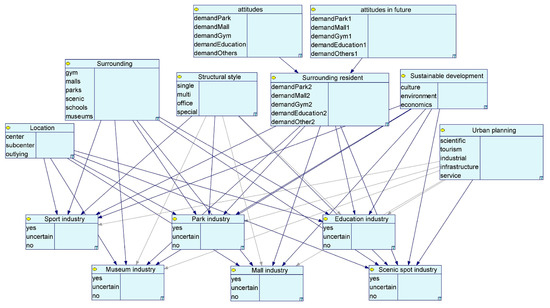
Figure 14.
The initial BN-POI-AHP hybrid Bayesian network model diagram.
- Step 2: Training the model.
Manually input the original POI data and AHP data obtained from all five samples into the model for training purposes, leading to the derivation of the BN-POI-AHP hybrid Bayesian network model. To ensure the utmost accuracy, the data input will undergo thorough verification by other researchers to detect and rectify any potential human errors. The BN-POI-AHP hybrid Bayesian network model is depicted in Figure 15.
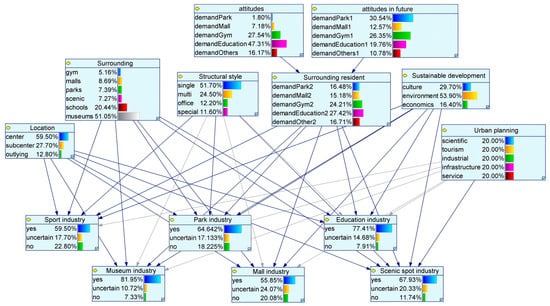
Figure 15.
BN-POI-AHP hybrid Bayesian network model.
3.3. Case Proof
In this study, we conduct a quantitative analysis using the Former Site Museum of CFS in Changchun, Jilin Province, China as an example. The main objectives are twofold: firstly, to verify the accuracy of the BN-POI-AHP hybrid Bayesian network model, and secondly, to provide a reliable basis and preliminary guidance for decision-makers in the Industrial Heritage Conservation and Management system regarding future development trends. The research process involves several steps, including conducting a questionnaire survey among residents living in the vicinity of the Former Site Museum of CFS, analyzing data from surrounding points of interest (POI), determining additional leaf nodes based on the specific case circumstances, and finally, inputting these specific data into the hybrid model.
3.3.1. Quantitative Analysis of the Face-to-Face Interviews
In March 2023, the authors meticulously distributed 200 questionnaires as part of a pre-survey. Out of these, a total of 182 were returned, of which 167 were deemed valid, achieving an efficiency rate of 83.5%. Concurrently, we conducted semi-structured interviews within neighborhoods located within a 1 km radius of the Former Site Museum of CFS. The questionnaires were thoughtfully divided into four distinct sections: Sociodemographic information, an appraisal of the surrounding environment, satisfaction levels, and a survey of the present demands and future needs. Subsequently, Table 20 illustrates some of the variable categories and their respective frequencies. These data were then meticulously injected into the Bayesian network model, enhancing the objectivity of the model and adding a layer of depth to our research findings.

Table 20.
Face-to-face interview data on the needs of the surrounding residents.
3.3.2. Quantitative Analysis of POIs
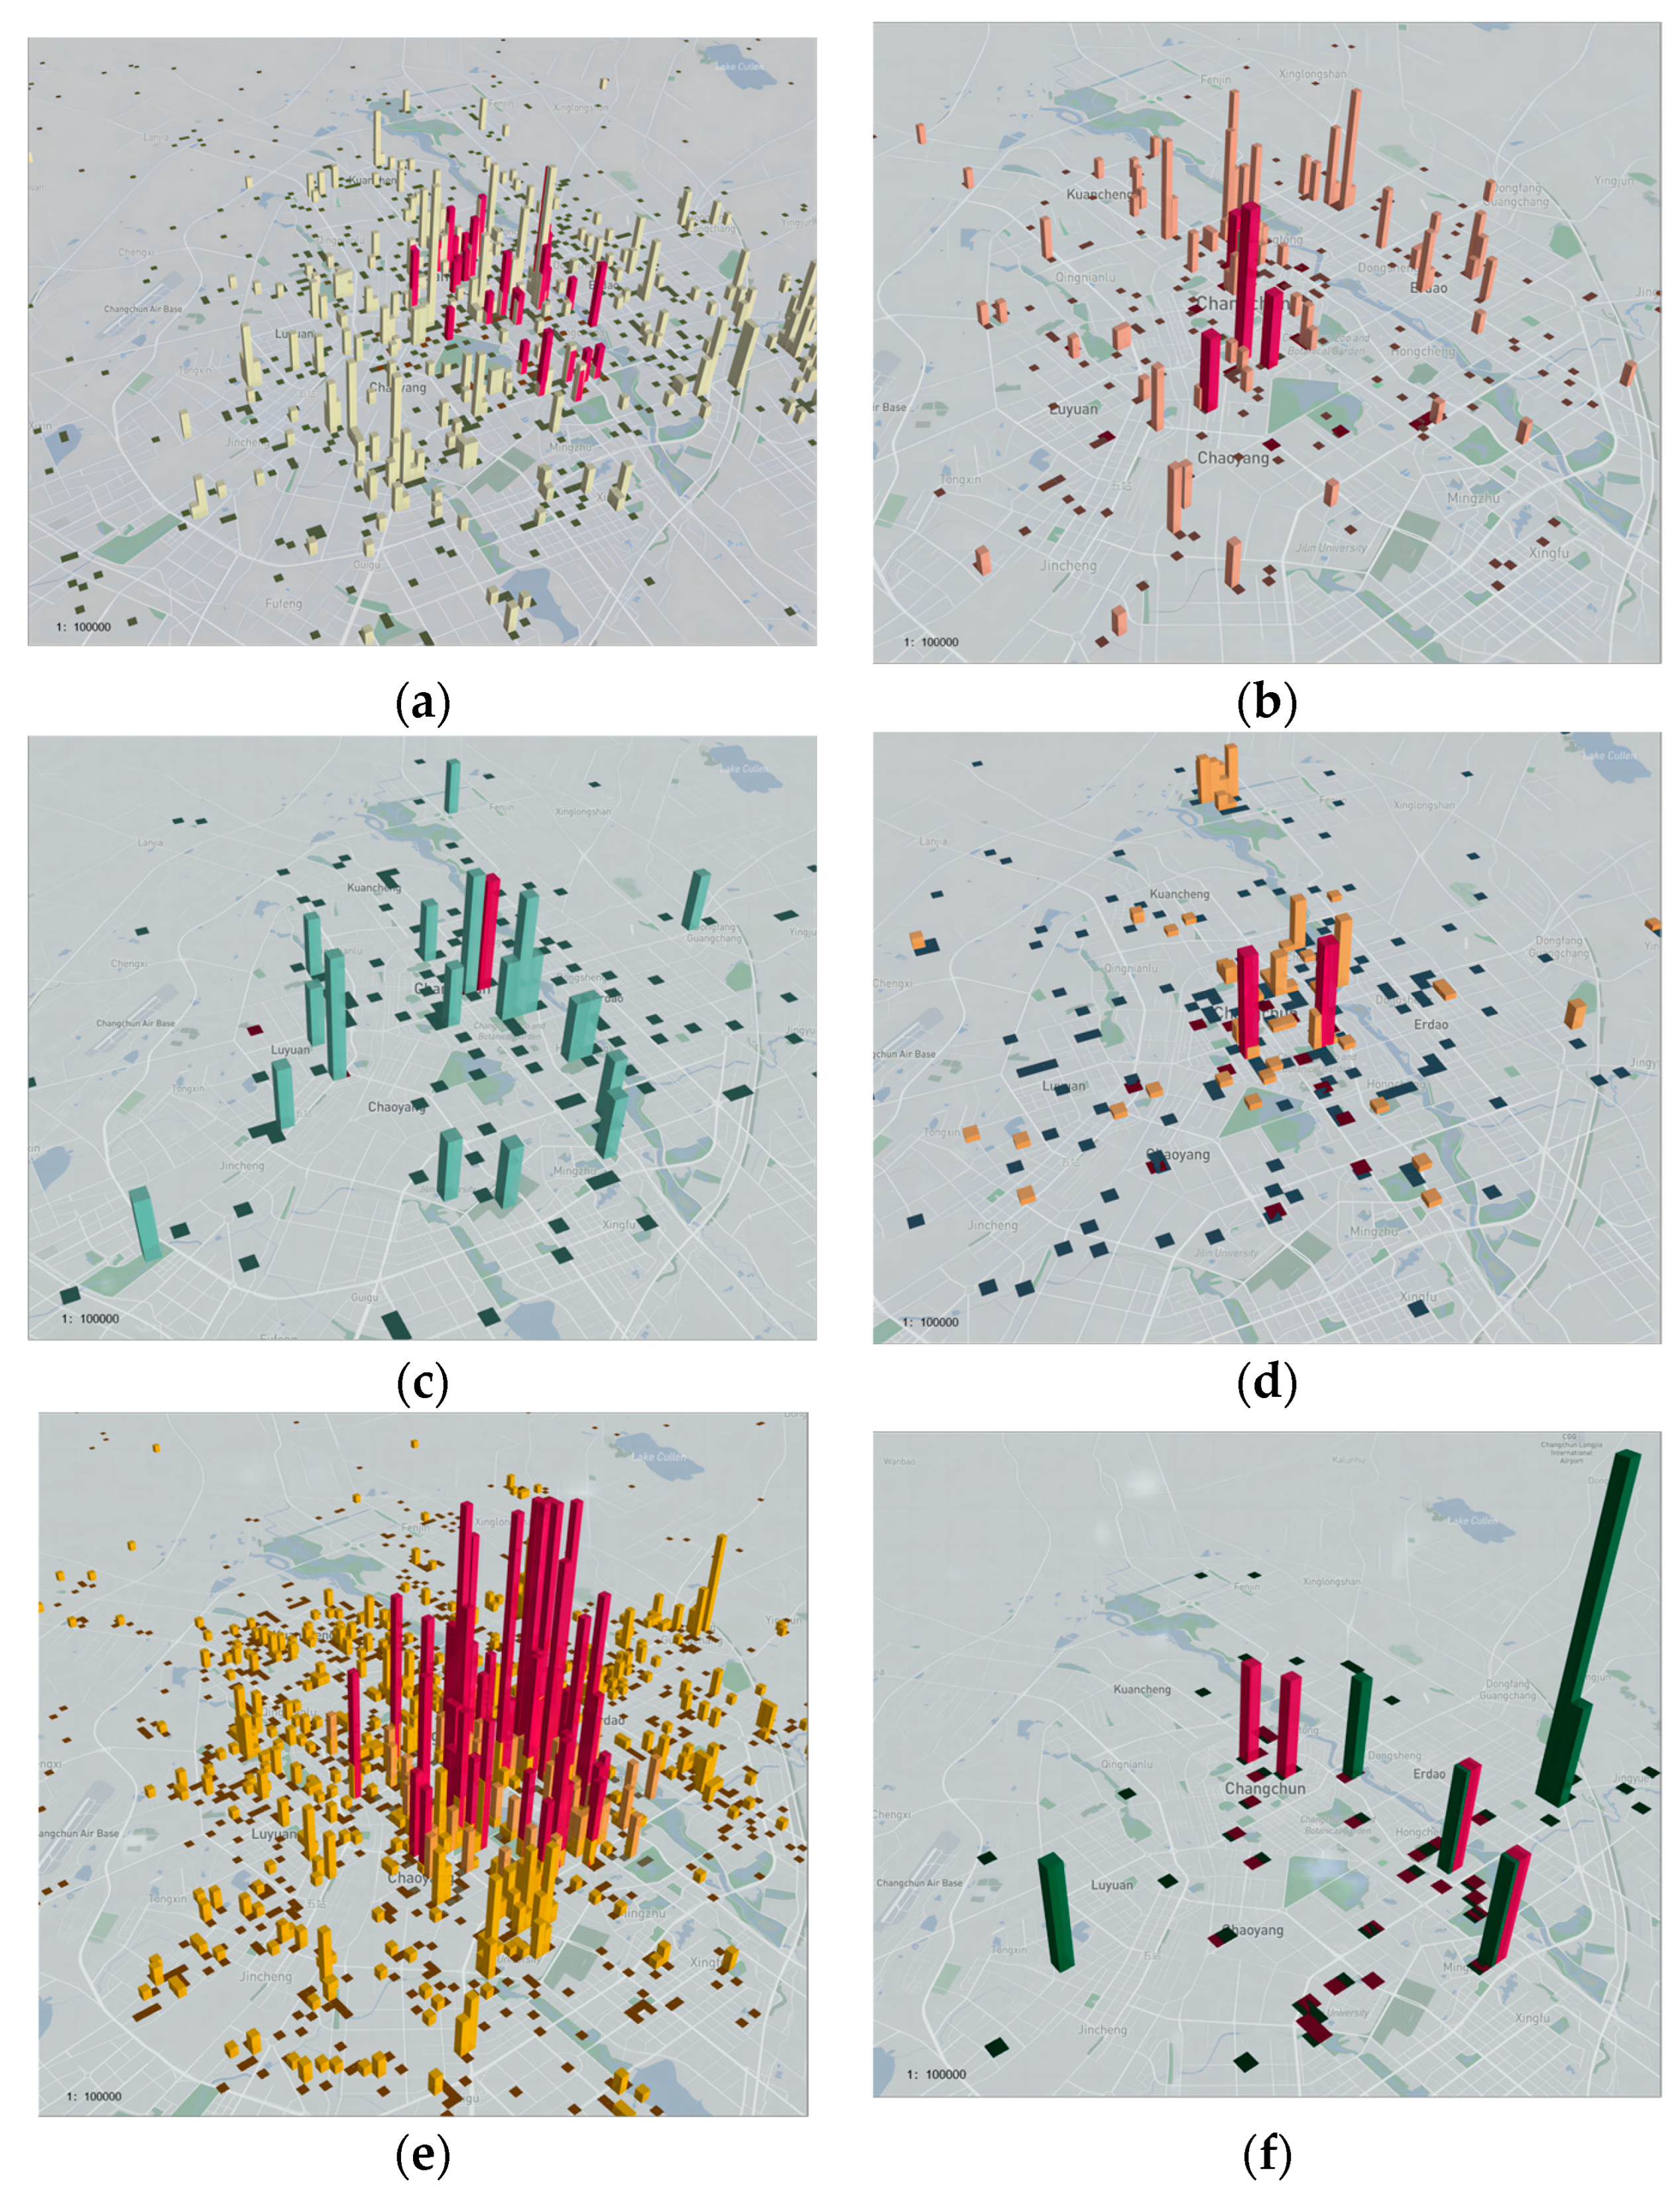
To effectively present the results derived from the kernel density analysis, this study strategically used Kepler.gl® software (Version 3.0.0-alpha.0) for visualizing the data from the project samples. As part of this process, the Former Site Museum of CFS was selected as a prominent example. Table 21 and Figure 16 provide the detailed visualizations and data.

Table 21.
POI data distribution and normalization table of 5 km around the Former Site Museum of CFS.
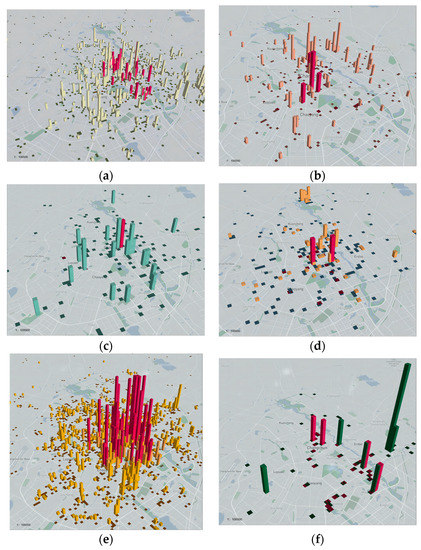
Figure 16.
POI data distribution of visualization analysis map of 5 km around the Former Site Museum of CFS. (a) POI data distribution of the visualization analysis map for sport grounds; (b) POI data distribution of the visualization analysis map for malls; (c) POI data distribution of the visualization analysis map for parks; (d) POI data distribution of the visualization analysis map for scenic spots; (e) POI data distribution of the visualization analysis map for education institutes; (f) POI data distribution of the visualization analysis map for museums.
The mean and standard deviation of the data, in this case, are outlined in Table 22. Upon comparing the deviations from the mean, it is noted that only the Museum exhibits a deviation exceeding 2σ, but it remains below 3σ. Following a comprehensive analysis of the data within the relevant field, the expert concluded that the data can be considered reasonable. Notably, all other data points demonstrate deviations below 2σ, indicating their adherence to normalcy.

Table 22.
The percentage and deviation average of the POI data around the Former Site Museum of CFS.
3.4. Discussion
The BN-POI-AHP hybrid Bayesian network model was created using a variety of techniques such as CiteSpace, a literature review, field investigations, face-to-face interviews, POI analysis, AHP analysis, and Bayesian algorithms. This strategic blend of methods not only overcomes the inherent limitations of the Bayesian network, but also enables a multifaceted examination of the problem, establishing a more extensive model. Within this system, six renewal development categories were delineated: the Sports industry, the Park industry, the Museum industry, the Mall industry, the Education industry, and the Scenic Spot industry. To evaluate the suitability of these categories for the experimental subjects, we employed a simple “yes”, “uncertain”, and “no” indicator. Using precise data regarding the six surrounding conditions of the target object, our model can infer a highly suitable direction for renewal development. Simultaneously, it takes into account the future needs of the surrounding residents and the city’s development positioning to ensure sustainability in the development process. It provides an initial assessment and guidance for decision-makers and stakeholders.
To corroborate the applicability of the BN-POI-AHP hybrid Bayesian network model, we conducted a validation analysis using a specific case in the cultural industrial heritage, specifically the Former Site Museum of CFS. The obtained results are as follows:
Based on face-to-face interviews conducted in the neighborhood surrounding the Former Site Museum of CFS, it was found that 52.1% of residents expressed solid satisfaction with the local infrastructure, which accounts more than half. Furthermore, the primary demand for nearby facilities, as indicated by a considerable 47.31% of responses, is centered on education. Additionally, 56.89% of residents responded affirmatively when asked if they would prefer to stay in the neighborhood for the coming decades, suggesting a significant number of residents envisioning their long-term future in the area. In terms of future infrastructure needs, particularly during their retirement years, there was a discernible preference for sports facilities and parks, as indicated by the semi-structured interviews. Residents expressed a desire for more fitness locations in parks during their retirement years. Thus, it is reasonable to conclude that residents’ future demands are likely to gravitate toward sports-related facilities.
In this study, a comprehensive quantitative analysis was conducted on different categories of Points of Interest (POIs) within a 5 km radius around the Former Site Museum of CFS. According to the normalized results, the “education” category constituted 20.44%, while the “museums” category represented a substantial 51.05%. Together, these two categories accounted for 71.49% of the total, significantly higher than the other four categories. This indicates that within this particular region, there is a substantial demand for educational facilities and museums compared to other categories.
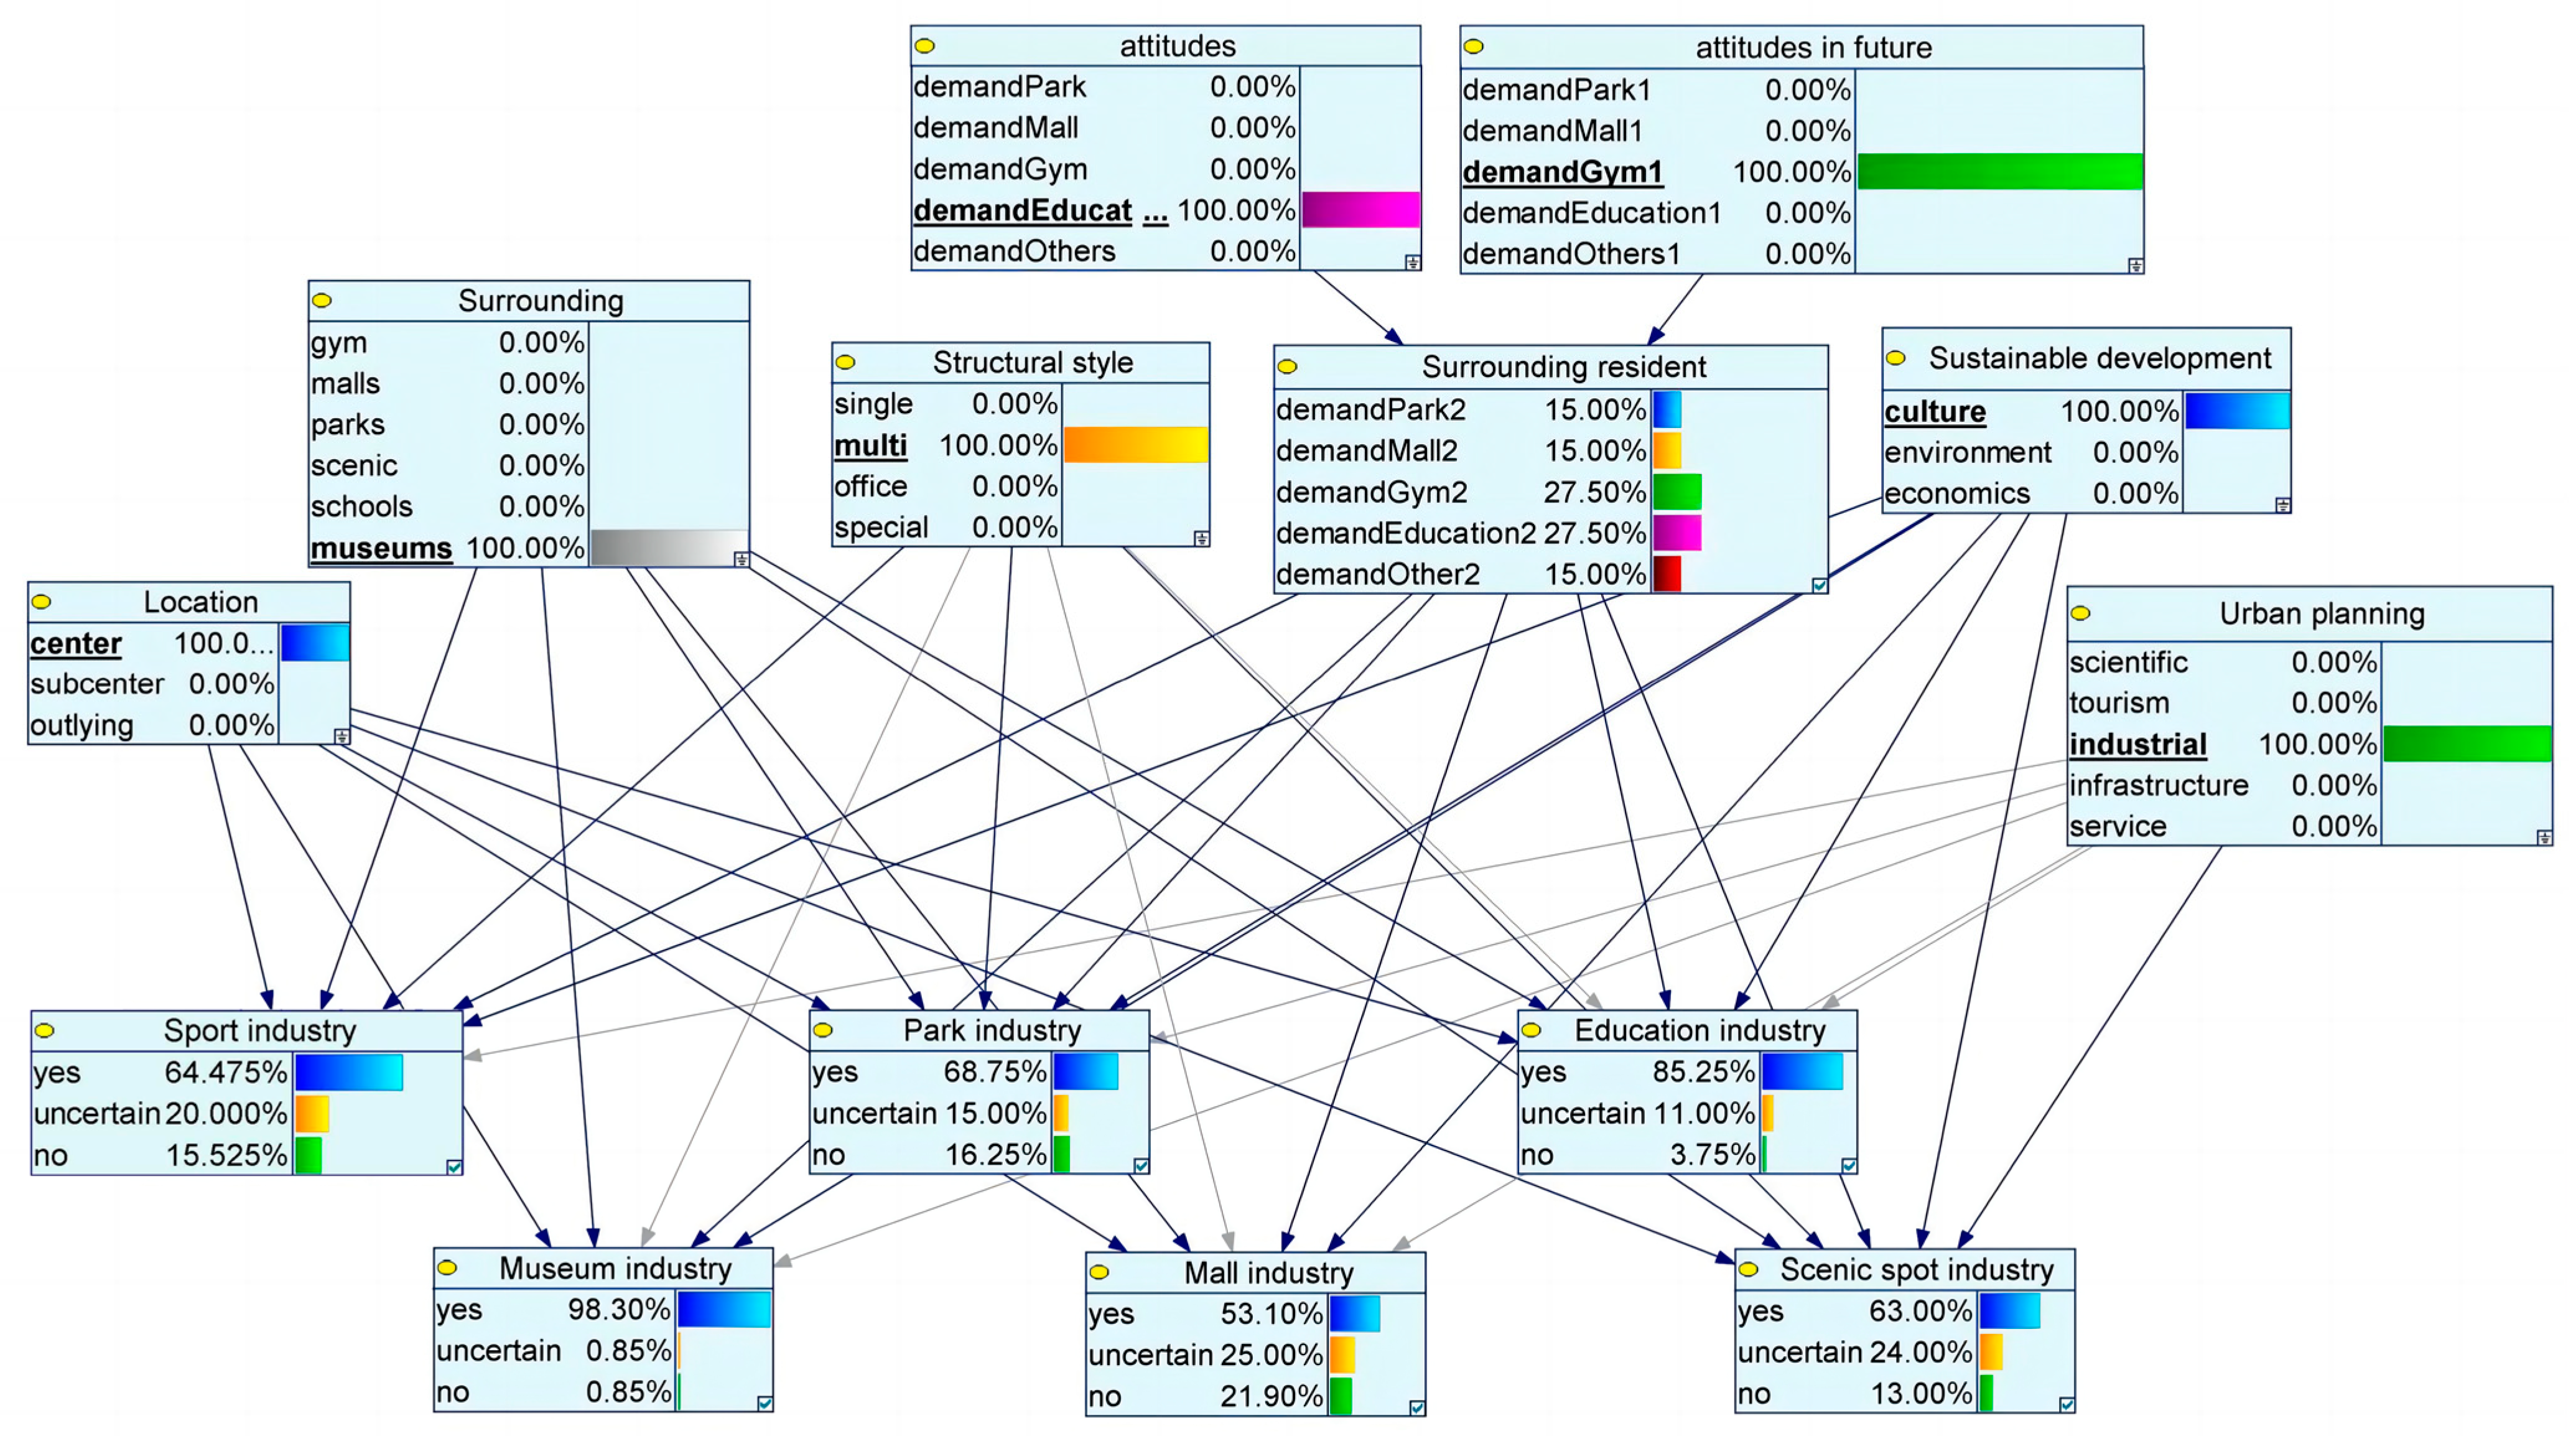
Pertinent data from the Former Site Museum of CFS were integrated into the BN-POI-AHP hybrid Bayesian network model, enabling an examination of prospective industrial heritage renewal directions specific to this project, as illustrated in Figure 17. Based on the current state of the experimental subjects, the elements of “surrounding facility” and “sustainable development” exerted the most significant influence on the outcomes. Following these, “surrounding residents” and “urban planning” had a noteworthy impact, whereas “location” and “structural style” were observed to be least influential. The Museum industry stands out impressively high in terms of its suitability as a renewal direction, with a rating of 98%, closely followed by the Education industry, with a suitability rating of 85%. Taking into consideration the existing conditions of the surrounding area and the urban development trends, it is crucial to forecast the requirements of residents over the forthcoming 15–25 years. Therefore, it would be prudent to designate spaces that offer the flexibility for easy conversion into fitness or sports facilities in the future. This forward-thinking strategy ensures a responsive infrastructure that can adapt to shifting residents’ needs over time.
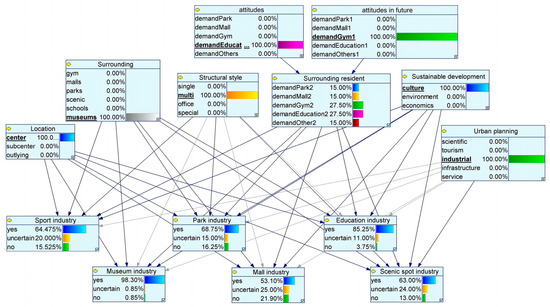
Figure 17.
BN-POI-AHP hybrid Bayesian network model for the Former Site Museum of CFS.
Consequently, the current direction of renewal for CFS coincides with the optimal renewal direction predicted by the BN-POI-AHP hybrid Bayesian network model, both emphasizing museums as the preferred choice. This finding demonstrates that the developed hybrid model in this study can provide a reasonable, sustainable, and preliminary direction for most industrial heritage renewal projects.
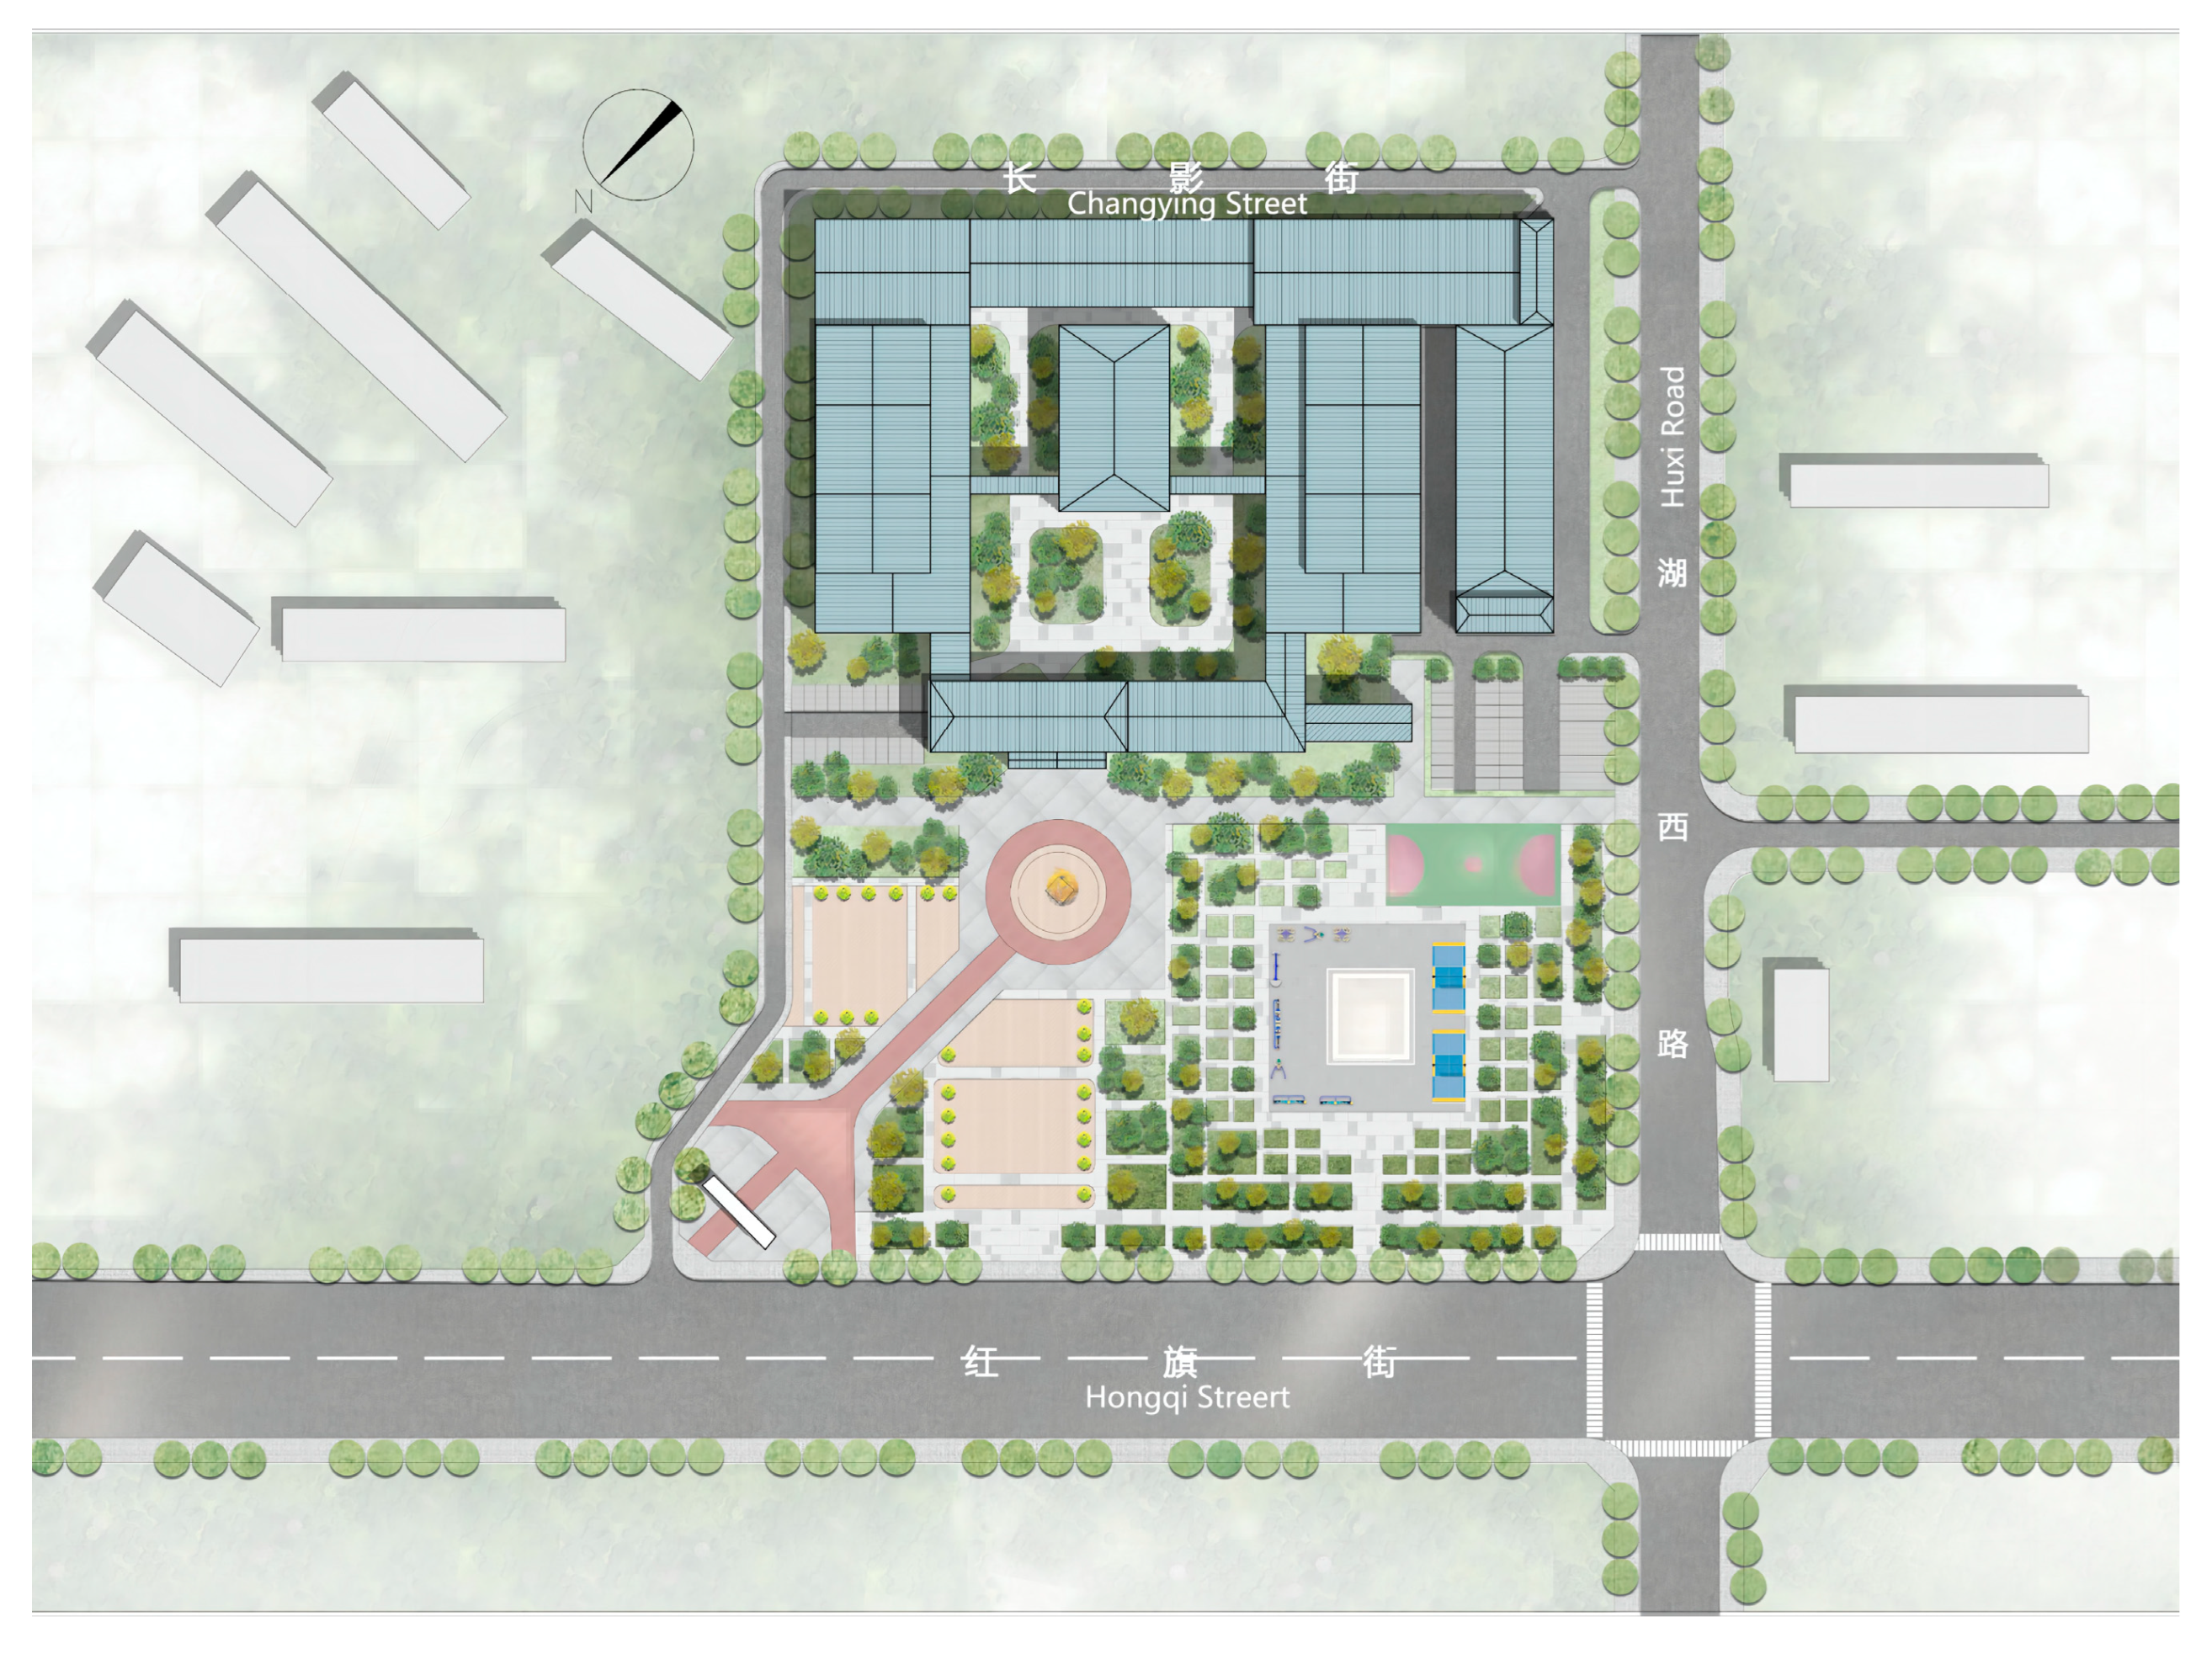
Based on the outcomes derived from the hybrid model and long-term planning, an optimized design was created for the Former Site Museum of CFS. A preliminary initial design for the case was developed, with the global layout design depicted in Figure 18. A significant change involves the transformation of the substantial parking area into a comprehensive park square, providing space for fitness and sporting activities. This adjustment not only enhances the landscape environment, but also incorporates fitness equipment and courts. Additionally, smaller parking spaces have been incorporated into other unoccupied areas to accommodate the existing vehicular flow. If future projections indicate an increase in daily traffic, the consideration of some assembled three-dimensional parking structures may be necessary.
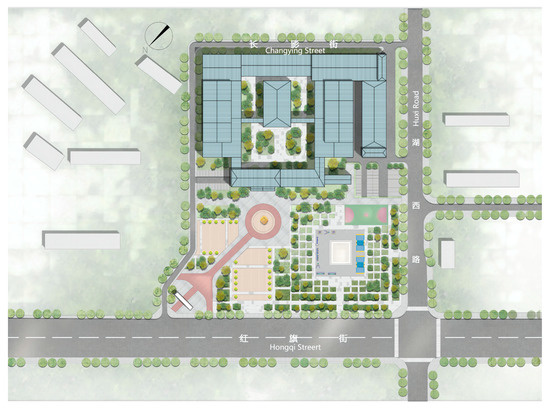
Figure 18.
Global layout design of the Former Site Museum of CFS.
Undoubtedly, this study has encountered certain limitations and challenges:
- The BN-POI-AHP hybrid Bayesian network model developed in this research, although capable of providing an initial determination of the update direction, is not yet comprehensive enough to encompass all the influencing factors. There is a need for further improvement in terms of accuracy.
- During the data acquisition stage of this study, there may be a minor presence of errors. These errors have been identified through industry expert assessments and specific validation methods, and they have almost no impact on the final results. However, it is important to acknowledge that data errors remain a challenge that should not be overlooked in future in-depth investigations.
- In an attempt to enhance the accuracy of the model, the BN-POI-AHP hybrid Bayesian network model created in this study integrates calculations and modeling techniques that are multidomain, and multimethod, and require the integration of multiple software platforms. However, this complexity poses a challenge for general decision-makers, as it necessitates time and effort to attain proficiency in these calculations and models. Therefore, perhaps they need the help of additional professional researchers.
4. Conclusions
Utilizing bibliometric methodology and CiteSpace technology, this study examined the evolution and current state of industrial heritage, both domestically and internationally. This approach allows for the identification of research focal points and the recognition of any methodological limitations in the field. To delve deeper, we incorporated a range of complementary research tools, including field surveys, face-to-face interviews, surrounding point of interest (POI) analysis, analytical hierarchy process (AHP) analysis, and Bayesian networks. The data necessary for this study were derived from a variety of projects randomly selected from different Chinese cities. The collected data served as the foundation for the construction of a BN-POI-AHP hybrid Bayesian network model. To validate the effectiveness of this hybrid model, we employed the Former Site Museum of CFS as a practical case study. This systematic approach culminated in the creation of a more objective, comprehensive, and logically sound mathematical model that outlines the renewal strategy within the overarching framework of sustainable development.
The main contributions of this study are as follows:
- We utilized the Former Site Museum of CFS as an example to demonstrate the applicability of the BN-POI-AHP hybrid Bayesian network model across different projects, tailoring the renewal to each project’s distinct characteristics. This approach is underpinned by a “specialization” strategy. The hybrid model created in this research surpasses previous scholarly results in terms of objectivity, comprehensiveness, and specialization. Consequently, the feasibility of the BN-POI-AHP hybrid Bayesian network model, developed within the context of this research, is significant.
- According to the study’s findings, each of the proposed six intermediate nodes exerts a non-negligible direct or indirect impact on the industrial heritage renewal strategy.
- The BN-POI-AHP hybrid Bayesian network model enables the proposal of more targeted renewal strategies for each various project, considering the characteristics of the target project itself. On the one hand, it prioritizes sustainability and aligns with urban development needs; on the other hand, by objectively analyzing the data, we can assess the future development direction, predict residents’ needs, and reduce the risk of obsolescence over time. Therefore, we strongly believe that the BN-POI-AHP hybrid Bayesian network model provides both technological advancements and methodological approaches to industrial heritage renewal strategies, driving them toward compliance with the requirements of sustainable development.
- The research successfully realized the strategy and method of sustainable renewal of industrial heritage, from objective data collection to data modeling and the construction of rational proposals.
However, it should be noted that the BN-POI-AHP hybrid Bayesian network model does have certain limitations. On the one hand, the foundation of this model is primarily based on five randomly selected Chinese case projects. Despite the representativeness of the data, the database remains quantitatively limited. On the other hand, additional validation is necessary to evaluate the generalizability of the model. The current validated specificity case—cultural industrial heritage—does not cover all specific cases. Although it confirms the model’s suitability for a majority of industrial heritage projects, comprehensive research and validation across diverse contexts are indispensable for its widespread promotion.
Undoubtedly, the BN-POI-AHP hybrid Bayesian network model demonstrates substantial potential for future advancements. By integrating an expansive range of case data from various regions and diverse circumstances, a robust data model system could be constructed as the foundational base for the hybrid model. Moreover, by introducing new elements, regularly updating the database, and providing timely training for the mathematical model, we envision the eventual materialization of a hybrid model that is more authoritative, precise, and widely applicable.
In conclusion, this research presented a feasible technical framework and hybrid data model that serve as an effective support system for future sustainable industrial heritage renewal and urban development. It also provided novel technical reinforcement and guidance for subsequent strategies concerning industrial heritage renewal.
Author Contributions
Conceptualization: S.Y.; investigation: R.H. and S.Y.; methodology: S.Y.; writing—original draft: R.H. and S.Y.; review and editing: R.H. All authors have read and agreed to the published version of the manuscript.
Funding
This research was funded by the Key Science and Technology Project of the Jilin Provincial Department of Science and Technology (20210203142SF).
Institutional Review Board Statement
Not applicable for studies not involving humans or animals.
Informed Consent Statement
Informed consent was obtained from all subjects.
Data Availability Statement
POI data can be found here: https://lbsyun.baidu.com/ (accessed on 30 April 2023) and https://lbs.amap.com/ (accessed on 30 April 2023).
Acknowledgments
We would like to thank the anonymous reviewers for their constructive and supportive feedback.
Conflicts of Interest
The authors declare no conflict of interest.
Abbreviations
| BN | Bayesian Network |
| HBNs | Hybrid Bayesian Networks |
| POI | Point of Interest |
| AHP | Analytic Hierarchy Process |
| CFS | Changchun Film Studio |
References
- World Heritage List Statistics. Available online: https://whc.unesco.org/en/list/stat (accessed on 1 June 2023).
- Notice of the Ministry of Industry and Information Technology of the People’s Republic of China on the Announcement of the First List of China’s Industrial Heritage. Available online: https://www.miit.gov.cn/zwgk/zcwj/wjfb/tg/art/2020/art_26f9f30006e449c5a082bbda09dd7952.html (accessed on 30 April 2023).
- Buchanan, R.A. History and Heritage: The Development of Industrial Archaeology in Britain; National Council on Public History, University of California Press: Berkeley, CA, USA, 1989; Volume 11. [Google Scholar]
- TICCIH. The Nizhny Tagil Charter for the Industrial Heritage. 2003. Available online: https://ticcih.org/wp-content/uploads/2013/04/NTagilCharter.pdf (accessed on 30 April 2023).
- Mieg, H.A.; Oevermann, H.; Cossons, N.; Cramer, J.; Ringbeck, B.; Watson, M. Discussing Industrial Heritage Conservation and Planning. In Industrial Heritage Sites in Transformation: Clash of Discourses; Routledge: New York, NY, USA, 2015; pp. 201–218. [Google Scholar]
- This Year’s IDMS Features the Following Theme: Heritage Changes. Available online: https://www.icomos.org/en/focus/18-april-international-day-for-monuments-and-sites/121522-18-april-2023-heritage-changes (accessed on 30 April 2023).
- Wilkinson, S.J.; Remøy, H.; Langston, C. Sustainable Building Adaptation: Innovations in Decision-Making; John Wiley & Sons: Chichester, UK, 2014. [Google Scholar]
- Harun, S.N. Heritage Building Conservation in Malaysia: Experience and Challenges. Procedia Eng. 2011, 20, 41–53. [Google Scholar] [CrossRef]
- Cano, M.; Garzón, E.; Sánchez-Soto, P. Historic preservation, GIS, & rural development: The case of Almería province, Spain. Appl. Geogr. 2013, 42, 34–47. [Google Scholar] [CrossRef]
- Ball, R. Developers, regeneration and sustainability issues in the reuse of vacant industrial buildings. Build. Res. Inf. 1999, 27, 140–148. [Google Scholar] [CrossRef]
- Fuentes, J.M.; Gallego, E.; García, A.I.; Ayuga, F. New uses for old traditional farm buildings: The case of the underground wine cellars in Spain. Land Use Policy 2010, 27, 738–748. [Google Scholar] [CrossRef]
- Chan, A.; Cheung, E.; Wong, I. Impacts of the Revitalizing Industrial Buildings (RIB) Scheme in Hong Kong. Sustain. Cities Soc. 2015, 19, 184–190. [Google Scholar] [CrossRef]
- Cyrenne, P.; Fenton, R.; Warbanski, J. Historic Buildings and Rehabilitation Expenditures: A Panel Data Approach. J. Real Estate Res. 2006, 28, 349–380. [Google Scholar] [CrossRef]
- Adiwibowo, R.S.; Widodo, P.; Santosa, I. Correlations between Public Appreciation of Historical Building and Intention to Visit Heritage Building Reused as Retail Store. Procedia—Soc. Behav. Sci. 2015, 184, 357–364. [Google Scholar] [CrossRef]
- Vardopoulos, I. Critical sustainable development factors in the adaptive reuse of urban industrial buildings. A fuzzy DEMATEL approach. Sustain. Cities Soc. 2019, 50, 101684. [Google Scholar] [CrossRef]
- Oppio, A.; Bottero, M.; Ferretti, V. Designing Adaptive Reuse Strategies for Cultural Heritage with Choice Experiments. In Appraisal: From Theory to Practice; Green Energy and Technology; Springer: Cham, Switzerland, 2017; pp. 303–315. [Google Scholar]
- Chen, J.; Judd, B.; Hawken, S. Adaptive reuse of industrial heritage for cultural purposes in Beijing, Shanghai and Chongqing. Struct. Surv. 2016, 34, 331–350. [Google Scholar] [CrossRef]
- Bottero, M.; D’Alpaos, C.; Oppio, A. Ranking of Adaptive Reuse Strategies for Abandoned Industrial Heritage in Vulnerable Contexts: A Multiple Criteria Decision Aiding Approach. Sustainability 2019, 11, 785. [Google Scholar] [CrossRef]
- Yu, L. Strategy Research on the Preservation and Re-Usage of China’s Urban Industrial Architectural Heritage in the Post-industrial Era. Ph.D. Thesis, Tianjin University, Tianjin, China, 2015. [Google Scholar]
- Somoza-Medina, X.; Monteserín-Abella, O. The Sustainability of Industrial Heritage Tourism Far from the Axes of Economic Development in Europe: Two Case Studies. Sustainability 2021, 13, 1077. [Google Scholar] [CrossRef]
- Liu, N.; Huang, J.; Zhou, J. Strategies of Industrial Heritage Protection Planning in Urban Central Area: A Case Study of Huaxin Cement. Design 2023, 39, 117–124. [Google Scholar]
- Han, R.; Liu, D.; Zhu, G.; Li, L. A Comparative Study on Planning Patterns of Industrial Bases in Northeast China Based on Spatial Syntax. Sustainability 2022, 14, 1041. [Google Scholar] [CrossRef]
- China Industrial Heritage Conservation Forum. Wuxi Suggestion; Architectural Creation: Wuxi, China, 2006. [Google Scholar]
- Wang, Q.; Liu, W.; Mao, L. Spatial Evolution of Traditional Village Dwellings in Heilongjiang Province. Sustainability 2023, 15, 5330. [Google Scholar] [CrossRef]
- Ministry of Industry and Information Technology of the People’s Republic of China. Interpretation of “National Industrial Heritage Management Measures”; Ministry of Industry and Information Technology of the People’s Republic of China: Beijing, China, 2023.
- Ni, Z.; Ouyang, T.; Xu, J. Research on the Sustainable Development of Enterprises That Evoke Industrial Heritage—A Case Study of Taoxichuan. Sustainability 2023, 15, 1176. [Google Scholar] [CrossRef]
- Ji, Y.; Xu, M.; Zhang, T.; He, Y. Intelligent Parametric Optimization of Building Atrium Design: A Case Study for a Sustainable and Comfortable Environment. Sustainability 2023, 15, 4362. [Google Scholar] [CrossRef]
- Pournara, A.; Sakellariadou, F. Development of a Protocol for a Sustainable Blue Economy in the Coastal Zone: Case Study and Preliminary Results in a Coastal Industrial Area in the Eastern Mediterranean. Sustainability 2022, 14, 323. [Google Scholar] [CrossRef]
- Dialsingh, I. Risk assessment and decision analysis with Bayesian networks. J. Appl. Stat. 2014, 41, 910. [Google Scholar] [CrossRef]
- Kim, J.; Pearl, J. Convince—A conversational inference consolidation engine. IEEE Trans. Syst. Man Cybern. 1987, 12, 120–132. [Google Scholar] [CrossRef]
- Heckerman, D.; Breese, J. Causal independence for probability assessment and inference using Bayesian networks. Syst. Man Cybern. Part A Syst. Hum. IEEE Trans. 1996, 26, 826–831. [Google Scholar] [CrossRef]
- Fay, A.; Jaffray, J.-Y. A justification of local conditioning in Bayesian networks. Int. J. Approx. Reason. 2000, 24, 59–81. [Google Scholar] [CrossRef]
- Heckerman, D.E.; Horvitz, E.J.; Nathwani, B.N. Toward normative expert systems: Part I. The Pathfinder project. Methods Inf. Med. 1992, 31, 90–105. [Google Scholar] [CrossRef] [PubMed]
- Cheon, S.-P.; Kim, S.; Lee, S.-Y.; Lee, C.-B. Bayesian networks based rare event prediction with sensor data. Knowl.-Based Syst. 2009, 22, 336–343. [Google Scholar] [CrossRef]
- Greer, S. Miscarriages of criminal justice reconsidered. Mod. Law Rev. 1994, 57, 58–74. [Google Scholar] [CrossRef]
- Zhang, J.; Sun, H.; Xu, S.; Aoki, N. Analysis of the Spatial and Temporal Distribution and Reuse of Urban Industrial Heritage: The Case of Tianjin, China. Land 2022, 11, 2273. [Google Scholar] [CrossRef]
- Leu, S.-S.; Lu, C.-Y.; Wu, P.-L. Dynamic-Bayesian-Network-Based Project Cost Overrun Prediction Model. Sustainability 2023, 15, 4570. [Google Scholar] [CrossRef]
- Chen, Y.; Li, X.; Wang, J.; Liu, M.; Cai, C.; Shi, Y. Research on the Application of Fuzzy Bayesian Network in Risk Assessment of Catenary Construction. Mathematics 2023, 11, 1719. [Google Scholar] [CrossRef]
- Hollnagel, E. The ETTO Principle: Efficiency-Thoroughness Trade-Off: Why Things That Go Right Sometimes Go Wrong; Ashlater: Surrey, UK, 2009. [Google Scholar]
- Fenton, N.; Neil, M. Risk Assessment and Decision Analysis with Bayesian Networks, 2nd ed.; Chapman and Hall: Boca Raton, FL, USA, 2018. [Google Scholar]
- Wu, Y.; Chen, S.; Wang, D.; Zhang, Q. Fire Risk Assessment of Heritage Villages: A Case Study on Chengkan Village in China. Fire 2023, 6, 47. [Google Scholar] [CrossRef]
- Wang, H.; Tang, J.; Xu, P.; Chen, R.; Yao, H. Research on the Influence Mechanism of Street Vitality in Mountainous Cities Based on a Bayesian Network: A Case Study of the Main Urban Area of Chongqing. Land 2022, 11, 728. [Google Scholar] [CrossRef]
- Yao, J.; Qiu, B.; Zhou, M.; Deng, A.; Li, S. A Two-Stage Fuzzy Optimization Model for Urban Land Use: A Case Study of Chongzhou City. Sustainability 2021, 13, 13961. [Google Scholar] [CrossRef]
- Marcot, B.G. Common quandaries and their practical solutions in Bayesian network modeling. Ecol. Model. 2017, 358, 1–9. [Google Scholar] [CrossRef]
- Phan, T.D.; Smart, J.C.R.; Capon, S.J.; Hadwen, W.L.; Sahin, O. Applications of Bayesian belief networks in water resource management: A systematic review. Environ. Model. Softw. 2016, 85, 98–111. [Google Scholar] [CrossRef]
- de Waal, A.; Koen, H.; De Villiers, J.; Roodt, J.H.s.; Moorosi, N.; Pavlin, G. Construction and Evaluation of Bayesian Networks with Expert-Defined Latent Variables. In Proceedings of the 2016 19th International Conference on Information Fusion (FUSION), Heidelberg, Germany, 5–8 July 2016. [Google Scholar]
- Kininmonth, S.; Lemm, S.; Malone, C.; Hatley, T. Spatial vulnerability assessment of anchor damage within the Great Barrier Reef World Heritage Area, Australia. Ocean Coast. Manag. 2014, 100, 20–31. [Google Scholar] [CrossRef]
- Pitchforth, J.; Mengersen, K. A proposed validation framework for expert elicited Bayesian Networks. Expert Syst. Appl. 2013, 40, 162–167. [Google Scholar] [CrossRef]
- Aguilera, P.A.; Fernández, A.; Ropero, R.F.; Molina, L. Groundwater quality assessment using data clustering based on hybrid Bayesian networks. Stoch. Environ. Res. Risk Assess. 2013, 27, 435–447. [Google Scholar] [CrossRef]
- Yacef, R.; Benghanem, M.; Mellit, A. Prediction of daily global solar irradiation data using Bayesian neural network: A comparative study. Renew. Energy 2012, 48, 146–154. [Google Scholar] [CrossRef]
- Hossain, M.; Muromachi, Y. A Bayesian network based framework for real-time crash prediction on the basic freeway segments of urban expressways. Accid. Anal. Prev. 2012, 45, 373–381. [Google Scholar] [CrossRef]
- Loyd, K.A.T.; DeVore, J.L. An Evaluation of Feral Cat Management Options Using a Decision Analysis Network. Ecol. Soc. 2010, 15, 373–381. [Google Scholar] [CrossRef]
- Johnson, S.; Fielding, F.; Hamilton, G.; Mengersen, K. An Integrated Bayesian Network approach to Lyngbya majuscula bloom initiation. Mar. Environ. Res. 2010, 69, 27–37. [Google Scholar] [CrossRef]
- Choi, J.P.; Han, T.H.; Park, R.W. A Hybrid Bayesian Network Model for Predicting Breast Cancer Prognosis. J. Korean Soc. Med. Inform. 2009, 15, 49–57. [Google Scholar] [CrossRef]
- Lauret, P.; Fock, E.; Randrianarivony, R.N.; Manicom-Ramsamy, J.-F. Bayesian neural network approach to short time load forecasting. Energy Convers. Manag. 2008, 49, 1156–1166. [Google Scholar] [CrossRef]
- Barton, D.N.; Saloranta, T.; Moe, S.J.; Eggestad, H.O.; Kuikka, S. Bayesian belief networks as a meta-modelling tool in integrated river basin management—Pros and cons in evaluating nutrient abatement decisions under uncertainty in a Norwegian river basin. Ecol. Econ. 2008, 66, 91–104. [Google Scholar] [CrossRef]
- Tu, H.; Allanach, J.; Singh, S.; Pattipati, K.R.; Willett, P. Information integration via hierarchical and hybrid bayesian networks. Trans. Sys. Man Cyber. Part A 2006, 36, 19–33. [Google Scholar] [CrossRef]
- Shenoy, P.P. Inference in Hybrid Bayesian Networks Using Mixtures of Gaussians. arXiv 2006, arXiv:1206.6877. [Google Scholar]
- Murray, R.C.; VanLehn, K.; Mostow, J. Looking Ahead to Select Tutorial Actions: A Decision-Theoretic Approach. Int. J. Artif. Intell. Educ. 2004, 14, 235–278. [Google Scholar]
- Bangsø, O.; Flores, M.J.; Jensen, F.V. Plug & Play Object Oriented Bayesian Networks. In Current Topics in Artificial Intelligence; Springer: Berlin/Heidelberg, Germany, 2004; pp. 457–467. [Google Scholar]
- Kim, S.Y.; Imoto, S.; Miyano, S. Inferring gene networks from time series microarray data using dynamic Bayesian networks. Brief. Bioinform. 2003, 4, 228–235. [Google Scholar] [CrossRef]
- Raphael, M.G.; Wisdom, M.J.; Rowland, M.M.; Holthausen, R.S.; Wales, B.C.; Marcot, B.G.; Rich, T.D. Status and trends of habitats of terrestrial vertebrates in relation to land management in the interior Columbia river basin. For. Ecol. Manag. 2001, 153, 63–87. [Google Scholar] [CrossRef]
- Yang, H.; Kashimura, M.; Onda, N.; Ozawa, S. Extraction of bibliography information based on image of book cover. Int. J. Pattern Recognit. Artif. Intell. 2000, 14, 963–978. [Google Scholar] [CrossRef]
- PEARL, J. Graphs, Causality, and Structural Equation Models. Sociol. Methods Res. 1998, 27, 226–284. [Google Scholar] [CrossRef]
- Lauritzen, S.L. The EM algorithm for graphical association models with missing data. Comput. Stat. Data Anal. 1995, 19, 191–201. [Google Scholar] [CrossRef]
- Guerriero, M.; Wheeler, F.; Koste, G.; Dekate, S.; Choudhury, N. Bayesian data fusion for pipeline leak detection. In Proceedings of the 2016 19th International Conference on Information Fusion (FUSION), Heidelberg, Germany, 5–8 July 2016; pp. 278–285. [Google Scholar]
- Chen, C. Science Mapping: A Systematic Review of the Literature. J. Data Inf. Sci. 2017, 2, 1–40. [Google Scholar] [CrossRef]
- Chen, C. A Glimpse of the First Eight Months of the COVID-19 Literature on Microsoft Academic Graph: Themes, Citation Contexts, and Uncertainties. Front. Res. Metr. Anal. 2020, 5, 607286. [Google Scholar] [CrossRef] [PubMed]
- Chen, T.; Liu, F.; Li, Z.; Shan, H.; Liu, H.; Quan, Y.; Zhou, Z.; Tan, Z.; Jia, Y. Global Trends and Prospects of Nepheloid Layers: A Comprehensive Bibliometric Review. Water 2023, 15, 1067. [Google Scholar] [CrossRef]
- Zhang, Y.; Ye, E.; Liu, F.; Lai, N.; You, X.; Dong, J.; Dong, J. The Relationship between Landscape Construction and Bird Diversity: A Bibliometric Analysis. Int. J. Environ. Res. Public Health 2023, 20, 4551. [Google Scholar] [CrossRef]
- Yan, W.-J.; Liu, S.-T. Creative Economy and Sustainable Development: Shaping Flexible Cultural Governance Model for Creativity. Sustainability 2023, 15, 4353. [Google Scholar] [CrossRef]
- Brundtland, G.H. Our Common Future: Report of the World Commission on Environment and Development; General Assembly of the United Nations: Oslo, Norway, 1987. [Google Scholar]
- Shujing, F. Industrial Archaeological Research on Wenzhou Alum Mine form the Perspective of the History of Technology. Ph.D. Thesis, University of Science and Technology Beijing, Beijing, China, 2020. [Google Scholar]
- Dong, Z.; Chun, Y.; Zhaohui, Z. The organic integration of science and city--Exploration and reflection on the planning of Huairou Science City. Urban Dev. Stud. 2020, 27, 4–11. [Google Scholar]
- Qi, L. Study on the planning and design of supporting facilities for old-fashioned cultural and creative industrial park—A case study of Guangzhou. Master’s Thesis, Nanchang University, Nanchang, China, 2018. [Google Scholar]
- Shengchao, Z. Research on Development Strategy of Creative Industries of Cultural Relics & Museum in Jilin Province. In Proceedings of the 3rd International Seminar on Education Innovation and Economic Management (SEIEM 2018), Penang, Malaysia, 29–31 December 2018; pp. 327–330. [Google Scholar]
- Wenzhou Proposes to Build a Geological Park with an Area of 11.33 Square Kilometers, Where Alum Is Stored in Abundance. Netease. 19 January 2021. Available online: https://www.163.com/dy/article/G0MRC1CF054474EP.html (accessed on 12 May 2023).
- Ye, C. Old Factory Buildings “Updated to Live” Beautifully Transformed into a Sports Industry Park. Netease. 2 July 2022. Available online: https://www.163.com/dy/article/FGIEM1MO05506BEH.html (accessed on 12 May 2023).
- We, L. With the Rise of Cultural and Creative Parks, the Future of Xinxia Is Promising. Yangcheng Evening News. 30 September 2022. Available online: https://www.sohu.com/a/589148776_120046696 (accessed on 12 May 2023).
- Yan, M. Sailing towards a New Journey of Building a Science and Technology Innovation Center. Beijing Network Radio and Television Station. 28 February 2023. Available online: https://item.btime.com/441e44jvs6080sbmhf6n2n8gssi (accessed on 12 May 2023).
- Lu, L. This Epoch-Making Cutting-Edge Technology Show Opened in Shekou. Nanfang Daily. 6 July 2018. Available online: https://www.sohu.com/a/239581230_100116740?_f=index_pagerecom_12 (accessed on 12 May 2023).
- Kafa, N.; Jaegler, A.; Sarkis, J. Harnessing Corporate Sustainability Decision-Making Complexity: A Field Study of Complementary Approaches. Sustainability 2020, 12, 584. [Google Scholar] [CrossRef]
- Khahro, S.H.; Talpur, M.A.H.; Bhellar, M.G.; Das, G.; Shaikh, H.; Sultan, B. GIS-Based Sustainable Accessibility Mapping of Urban Parks: Evidence from the Second Largest Settlement of Sindh, Pakistan. Sustainability 2023, 15, 6228. [Google Scholar] [CrossRef]
- Oladinrin, O.T.; Mesthrige, J.W.; Ojo, L.D.; Alencastro, J.; Rana, M. Smart Home Technologies to Facilitate Ageing-in-Place: Professionals Perception. Sustainability 2023, 15, 6542. [Google Scholar] [CrossRef]
- Luo, G.; Ye, J.; Wang, J.; Wei, Y. Urban Functional Zone Classification Based on POI Data and Machine Learning. Sustainability 2023, 15, 4631. [Google Scholar] [CrossRef]
- Hu, Y.; Han, Y. Identification of Urban Functional Areas Based on POI Data: A Case Study of the Guangzhou Economic and Technological Development Zone. Sustainability 2019, 11, 1385. [Google Scholar] [CrossRef]
- Ni, M.; Zhao, Y.; Ma, C.; Hou, X.; Xie, Y. Exploring Relationships between Spatial Pattern Change in Steel Plants and Land Cover Change in Tangshan City. Sustainability 2023, 15, 9729. [Google Scholar] [CrossRef]
- Felipe, C.A.S.; Rocha, S.C.S. Prediction of minimum fluidization velocity of gas–solid fluidized beds by pressure fluctuation measurements—Analysis of the standard deviation methodology. Powder Technol. 2007, 174, 104–113. [Google Scholar] [CrossRef]
- Saaty, R.W. The analytic hierarchy process--what it is and how it is used. Math. Model. 1987, 9, 161–176. [Google Scholar] [CrossRef]
- Xiaoyu, W. Creation of Beijing-Shenyang Qing (Dynasty)Cultural Heritage Corridor based on Analytic Hierarchy Process. Ph.D. Thesis, Xi’an University of Architecture and Technology, Xi’an, China, 2009. [Google Scholar]
- Meng, F.; Pang, Y.; Zhi, Y. Multicriteria Model for Determining the Best and Low-Cost Methods of Industrial Heritage Transformation and Utilization under Fuzzy Inputs. Sustainability 2023, 15, 3083. [Google Scholar] [CrossRef]
- Huanchen, Z.; Shubai, X.; Sheng, J. Analytic Hierarchy Process; China Science Publishing: Beijing, China, 1986. [Google Scholar]
Disclaimer/Publisher’s Note: The statements, opinions and data contained in all publications are solely those of the individual author(s) and contributor(s) and not of MDPI and/or the editor(s). MDPI and/or the editor(s) disclaim responsibility for any injury to people or property resulting from any ideas, methods, instructions or products referred to in the content. |
© 2023 by the authors. Licensee MDPI, Basel, Switzerland. This article is an open access article distributed under the terms and conditions of the Creative Commons Attribution (CC BY) license (https://creativecommons.org/licenses/by/4.0/).

