Article

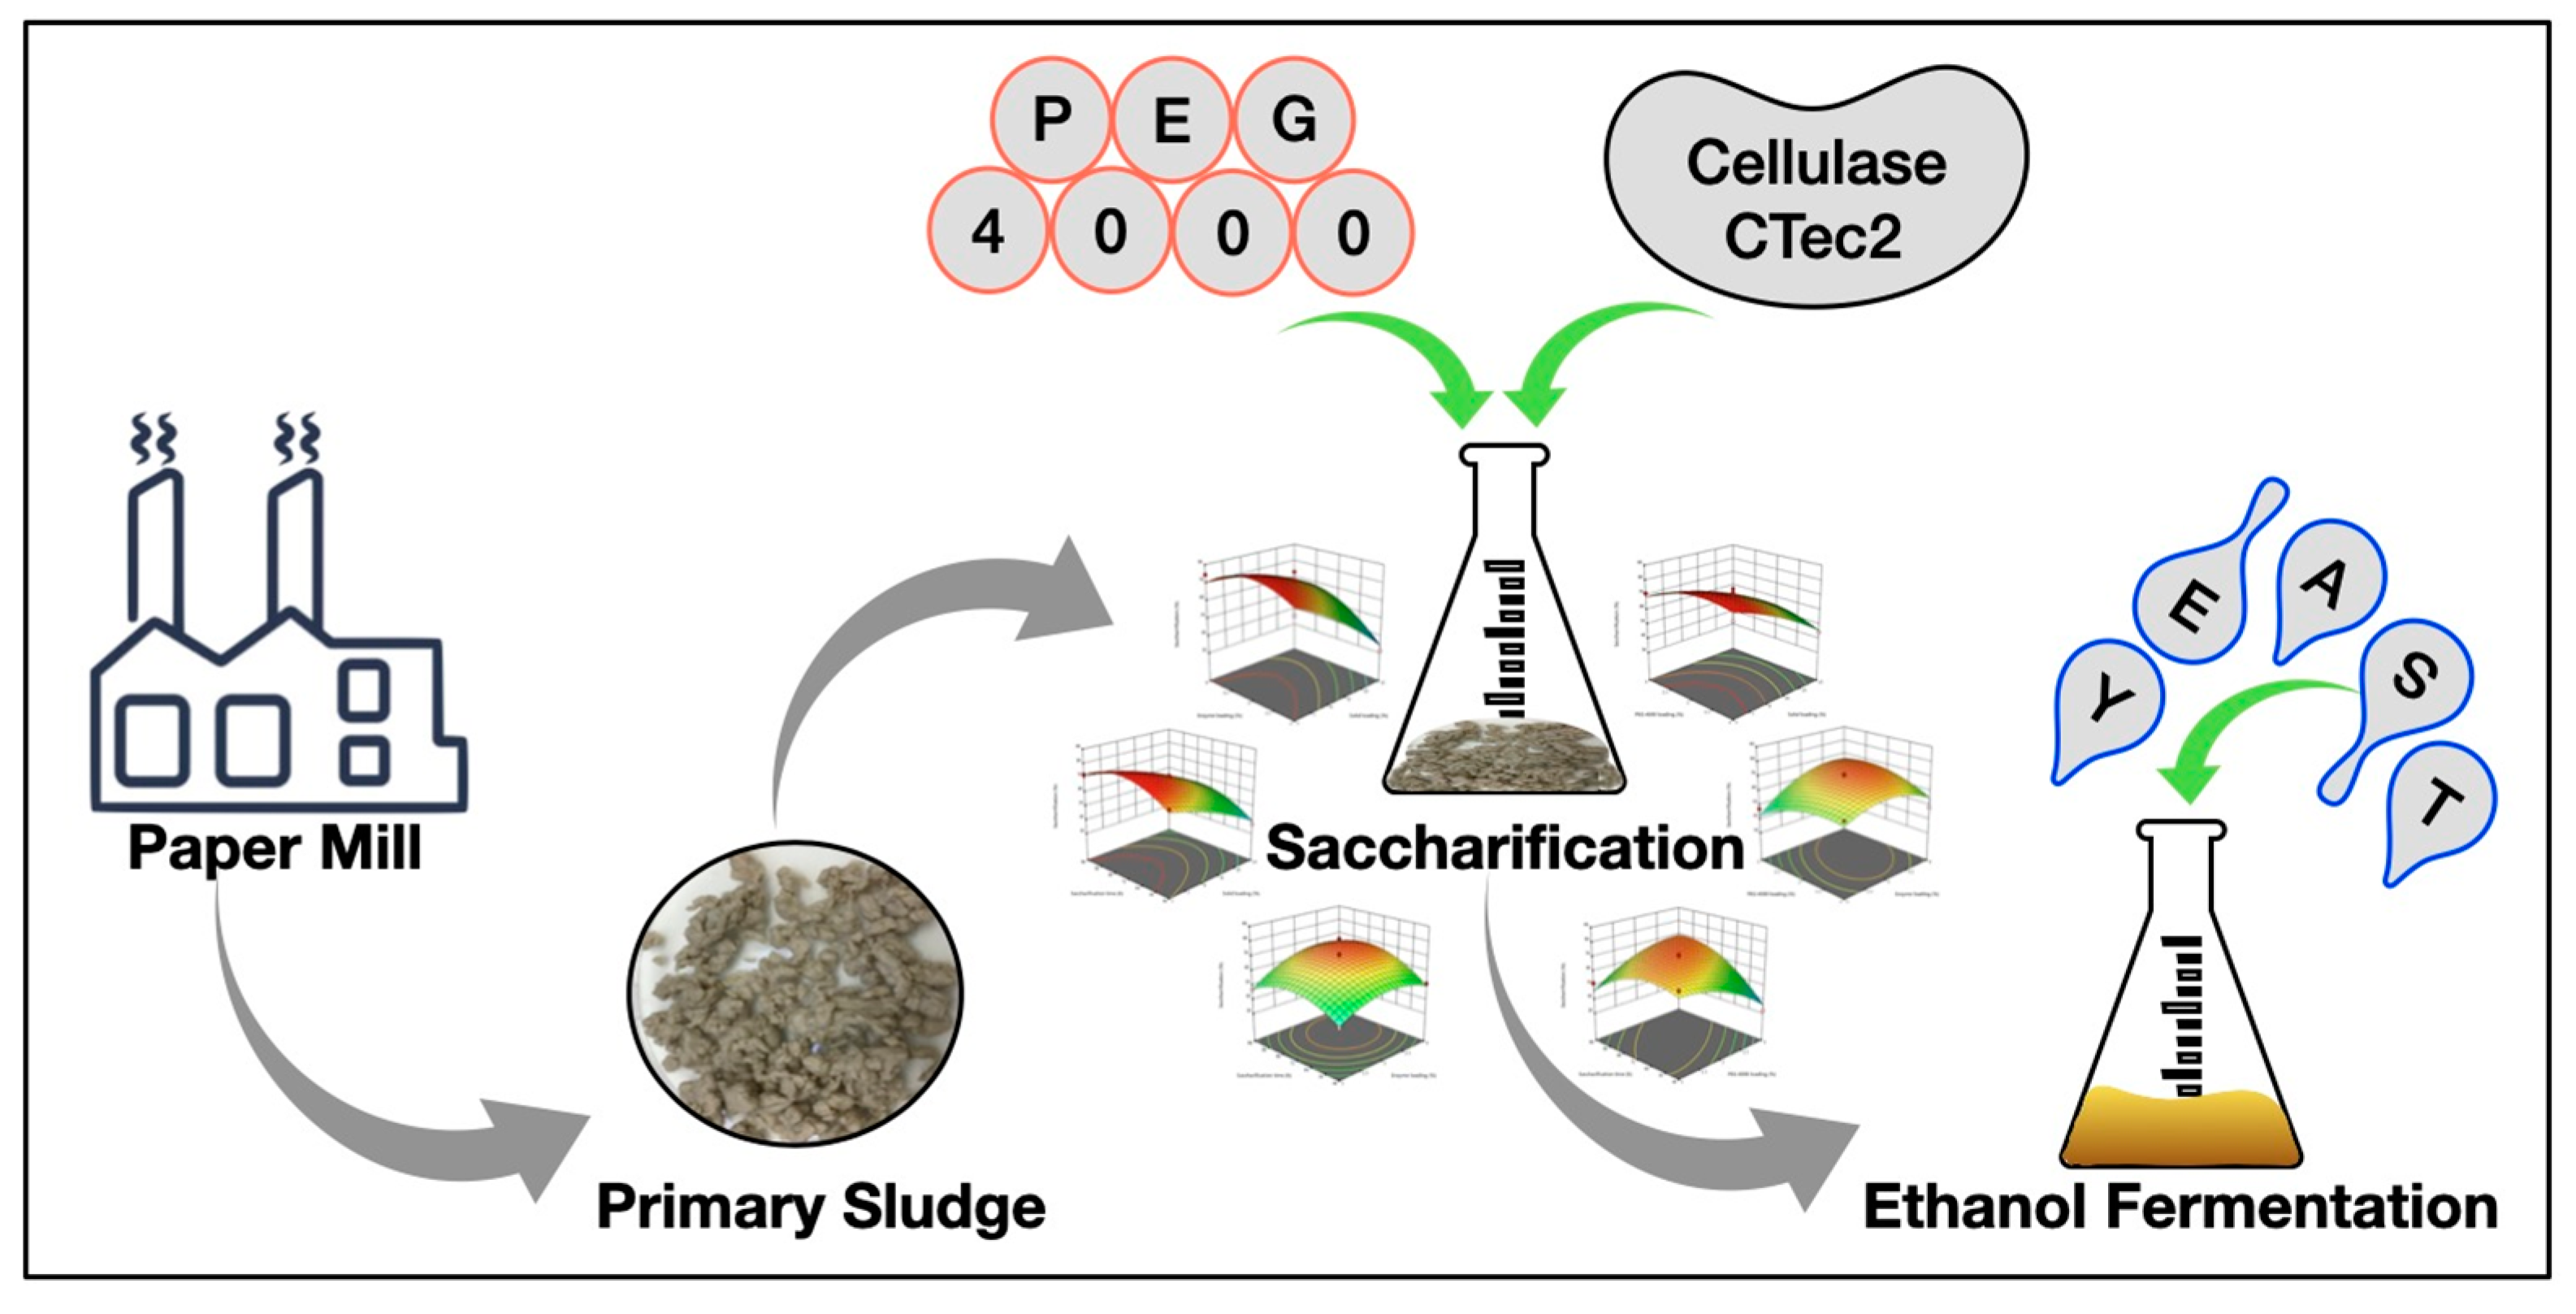
Box–Behnken Design-Based Optimization of the Saccharification of Primary Paper-Mill Sludge as a Renewable Raw Material for Bioethanol Production

by
Vasudeo Zambare
1,2,*,
Samuel Jacob
3,
Mohd Fadhil Md. Din
2,4 and
Mohanadoss Ponraj
5,*
1
R&D Department, Om Biotechnologies, Nashik 422 011, India
2
Centre for Environmental Sustainability and Water Security (IPASA), Universiti Teknologi Malaysia, Johor Bahru 81310, Malaysia
3
Department of Biotechnology, School of Bioengineering, Faculty of Engineering and Technology, College of Engineering and Technology, SRM Institute of Science and Technology, Kattankulathur 603203, India
4
Department of Water and Environmental Engineering, Universiti Teknologi Malaysia, Johor Bahru 81310, Malaysia
5
Department of Biological Sciences, The Copperbelt University, Riverside, Kitwe 21692, Zambia
*
Authors to whom correspondence should be addressed.
Sustainability 2023, 15(13), 10740; https://doi.org/10.3390/su151310740
Submission received: 5 April 2023 / Revised: 26 June 2023 / Accepted: 27 June 2023 / Published: 7 July 2023

Abstract

:
In this study, the primary paper-mill sludge characterized as containing 51% glucan was used to optimize the enzymatic saccharification process for the production of bioethanol using a Box–Behnken design (BBD). Polyethylene glycol 4000 (PEG-4000) surfactant-assisted enzymatic saccharification of dried primary sludge (DPS) showed a 12.8% improvement in saccharification efficiency. There was a statistically significant effect of solid enzyme loading and saccharification time on the enzymatic saccharification of DPS at a 95% confidence level (p < 0.05). The optimum levels of 10.4% w/w DPS solid loading, 2.03% enzyme loading (10 FPU g/DPS), and 1% (w/w DPS) PEG-4000 loading for a saccharification efficiency of 57.66% were validated experimentally and found to be non-significant with regard to the lack of fit with the predicted saccharification efficiency of 56.76%. Furthermore, Saccharomyces cerevisiae fermented the saccharified sugars into ethanol (9.35 g/L) with a sugar-to-ethanol conversion yield of 91.6% compared with the theoretical maximum. Therefore, DPS is a more suitable renewable biomass for determining the presence of fermentable sugar and for the production of ethanol.

1. Introduction

Natural carbohydrates that are widely available are a potential resource for renewable biofuels and the production of green chemicals. Plant-based resources rich in lignocellulose are exploited for various human needs through rigorous industrial operations [1,2]. While biofuel production from first-generation feedstocks (food-based) could have an impact on food security, tapping into the waste residues from lignocellulose-based industries could be of enormous ecological and economic benefit [3]. In addition, the fermentative green chemical synthesis seems to be more economically viable when waste valorization is adopted at an industrial scale. Urbanization and industrialization processes simultaneously generate huge amounts of waste, which is a great environmental concern. One of the major utilizers of lignocellulose is the pulp and paper manufacturing industry. The global pulp and paper market was found to be USD 351.53 billion in 2021 and is projected to grow up to USD 372.70 billion by the year 2029 with a CAGR of 0.72% [4]. The literature also demonstrates a worldwide pulp-for-paper output of 191.6 million metric tonnes, with about 151.2 million metric tonnes originating from chemical pulp processes and the remaining from mechanical and semi-chemical pulp [5]. During pulping processes, an enormous amount of wastewater is produced. Pulping processes have a high biological oxygen and chemical oxygen demand, and they are associated with the production of large quantities of wastewater which is highly toxic and which contains phenolic compounds, organochlorines, and solids. This wastewater is difficult to treat and poses a high environmental risk [6]. Each tonne of paper produced results in 40–50 kg of dry sludge, with 70% and 30% from primary and secondary sludge, respectively [7]. Generally, the primary paper-mill sludge generated from the clarifier of the effluent treatment plants has short fibers, clays, and filler materials [6,7]. Secondary sludge is mainly generated from wastewater treatment operations (biological treatment), which is separated in the secondary decanter and is rich in microbes, proteins, minerals, and polysaccharides [6,7]. Waste disposal is, therefore, a major challenge for all pulp and paper-mill industries with an integrated wastewater treatment plant. Although landfilling is most often the preferred disposal strategy for sludge as it is less expensive, easy to handle and dispose, this method poses a secondary non-point source of pollution, especially of groundwater contamination. As a result, environmental bodies in a number of countries have issued regulatory guidelines for pulp and paper sludge-based landfilling.
Considering the available sludge from pulp mills and its compositional analysis (45–50% glucan and 10–14% xylan), it can serve as a potential feedstock for producing fuel and as an energy alternative to conventional first-generation resources due to its safer and more sustainable utilization [8,9]. The Ministry of Environment and Forests (MOEF, Govt. of India) has regulated the pulp and paper industrial sludge by dewatering, followed either by the recycling or incineration of unusable parts or by safe landfilling as the last option [9]. Generally, carbohydrate-based biomass is hydrolyzed using acid and alkali reagents to yield the reducing sugars for fermentative utilization. However, such acid/alkali hydrolysis poses some limitations in product separation, catalyst selection, recyclability, corrosion of handling equipment, and post-treatment of waste disposal [10]. These processes also affect the fermentation performance of yeast by unbalancing the intracellular redox system [11]. Lignocellulosic derivatives such as furfural, acetaldehydes, 4-hydroxybenzoic acids, and other weak acids could act as yeast growth inhibitors [11]. Hence, using alternative bio-based hydrolyzing agents (whole cells or cell-free enzymes) is the safest and most efficient method because it does not produce the aforementioned yeast growth inhibitors [12]. The lignocellulosic hydrolysate containing the fermentable sugars has been widely utilized in the production of biofuels [13,14], biochemicals [15], and biopolymers [16]. Enzymatic saccharification of lignocellulosic feedstocks is dependent on the pretreatment strategy, i.e., the amount of intact lignin, the physiological reaction conditions (pH, temperature, mixing), and the concentration of substrate, enzyme, and inhibitors [17]. For an efficient saccharification of the selected biomass/feedstock, process parameters need to be optimized for maximum saccharification and the corresponding sugar yield. There are several methods for optimizing the process of hydrolysis and fermentation of lignocellulosic materials to bioethanol. Statistical methods are considered to be more acceptable by many researchers due to their time-saving advantage, ease of optimization with reduced experimental runs, and precision with less error occurrence. Factorial design, response surface methodology (RSM) based on the central composite design (CCD), and the Box–Behnken design (BBD), to name a few, are being employed for process optimization [18,19,20,21]. These statistical optimizations have been employed for the pretreatment, hydrolysis, and fermentation using different biomasses such as switch grass [22], corn stover [23], prairie cordgrass [24], wheat bran [25], teff straw [26], and sugarcane bagasse [27]. Paper-mill sludge was used as a feedstock for the production of bioethanol [28,29,30]. The statistical method used for the production of bioethanol was found to be based on the CCD design [31]. A review of the literature shows that many research studies have been carried out using paper-mill sludge, but there is a knowledge gap between its proper disposal and valorization for process optimization [32,33,34,35,36]. As pulp and paper industries are prominent among USA, Canada, China Northern Europe, Australia, Brazil, Indonesia, and India [37,38], it is necessary to utilize waste sludge as a value-added product that will have futuristic scope for the country’s economy as well as environmental protection.
The aim of this study was to use pulp and paper-mill sludge as value-added feedstock, a surfactant-based enhancer for improved enzymatic saccharification, BBD as the statistical tool to optimize the parameters of enzymatic saccharification, and to utilize sludge hydrolysate for bioethanol production through yeast fermentation (Figure 1).

2. Materials and Methods

2.1. Substrate, Enzymes, and Chemicals

Primary sludge (PS), the substrate obtained from Indian paper mills, was dried in the oven at 60 °C for 48 h and the dried primary sludge (DPS) was used for the saccharification studies. Thee Cellic CTec2 enzyme was purchased from Novozymes A/S (Bagsvaerd, Denmark). Yeast and mold basal medium (YMB) and the surfactants were purchased from Himedia Laboratories (Mumbai, India). Saccharification experiments were carried out at pH 5 (sodium citrate buffer, 50 mmol/L).

2.2. Microorganisms

The ethanol-producing yeast Saccharomyces cerevisiae ATCC 24860 was purchased from the American Type Culture Collection (ATCC, Manassas, VA, USA). The culture was maintained in yeast and mold agar medium and preserved at 4 °C until further use.

2.3. Substrate (DPS) Composition

The compositional analysis of DPS was performed as per the Technical Association of the Pulp and Paper Industry (TAPPI) Test Methods [39]. Biomass moisture was analyzed using a halogen moisture analyzer (Mettler Toledo, HX204, Mumbai, India). The estimation of sugar composition was carried out with a 0.3 g DPS sample taken in a screw-capped vial, to which 3 mL H2SO4 (72%, w/v) was added. The samples were mixed well, hydrolyzed for 2 h in the water bath at 30 °C and mixed gently (50 rpm). After 2 h, deionized water (84 mL) was added and the solution autoclaved for 60 min. Once the samples reached ambient temperature, they were filtered using Whatman filter paper (0.45 µm). The undigested residue was further used for acid-insoluble lignin and ash analysis. The supernatant was filtered through Whatman filter paper (0.2 µm) and neutralized to a pH range of 5.5–6.0 before the sugar analysis. The diluted samples and standards were analyzed by high-performance liquid chromatography (HPLC) (Model 1260 Infinity, Agilent Technologies, Santa Clara, CA, USA) using an Aminex HPX-87P column (Bio-Rad Laboratories, Hercules, CA, USA). Samples were eluted using HPLC-grade deionized water at a flow rate of 0.6 mL/min. A refractive index (RI) detector (Model G1362A, Agilent Technologies, Santa Clara, CA, USA) was used to record the chromatogram using Open Lab CDS software (Agilent Technologies, Santa Clara, CA, USA). The calculations for cellulose (glucan) and hemicellulose (xylan, mannan, arabinan, galactan) were carried out with standard methods [40,41] and shown in Equations (1)–(5).
C e l l u l o s e   ( g l u c a n ) % = G l u c o s e   ( g ) + C e l l o b i o s e   ( g ) × 1.053 D P S   w e i g h t g × 1.111 × 100
X y l a n % = X y l o s e   ( g ) D P S   w e i g h t × 1.136 × 100
M a n n a n % = M a n n o s e g D P S   w e i g h t × 1.111 × 100
A r a b i n a n % = A r a b i n o s e   ( g ) D P S   w e i g h t g × 1.136 × 100
G a l a c t a n % = G a l a c t o s e g D P S   w e i g h t g × 1.111 × 100
The mass conversion factors for cellobiose to glucose, glucose (mannose or galactose) to cellulose (mannan or galactan), and xylose (arabinose) to xylan (arabinan) were 1.053, 1.111, and 1.136, respectively.

2.4. Enzyme Assay

Cellulolytic activity of the Cellic CTec2 enzyme was analyzed using the method of Adney and Baker [42]. The enzyme activity was measured spectrophotometrically (UV1280, UV-Vis Spectrophotomer, Shimadzu, Kyoto, Japan) at 540 nm as filter paper unit (FPU) per ml or g of enzyme (based on its density).

2.5. Effect of Surfactant and Enzymatic Saccharification

The cellulase enzyme Cellic CTec2 was used for the enzymatic saccharification of DPS at 50 °C and pH 5.0 (sodium citrate buffer, 50 mmol/L). The enzyme assay showed that the cellulase activity of Cellic CTec2 was 120 FPU/mL or 100 FPU/g (1.2 g/mL, enzyme density). The saccharification experiment was performed 24 h before the addition of enzyme with 5% dry solids in screw-cap vials with 50 mmol/L sodium citrate buffer (pH 5) and 1% (w/w) individual surfactant [40]. To facilitate homogeneous mixing during the enzymatic saccharification, 10 g glass beads of size 200–300 µm (ThermoFisher Scientific, Mumbai, India) were added to each experimental vial and autoclaved at 121 °C for 10 min. After the vials had cooled down, they were incubated at 50 °C in an incubator shaker (200 rpm) for 12 h. After incubation, the Cellic CTec2 cellulase enzyme (2% w/v or w/w) was added to each of the vials for saccharification. All experimental vials for the saccharification studies were incubated at 50 °C, 200 rpm in a temperature-controlled shaking incubator. All the experiments were performed in triplicate.

2.6. Saccharification

Saccharification efficiency was analyzed by HPLC using glucose as the standard sugar. Saccharification (%) was calculated using the formula as described by the National Renewable Energy Laboratory (NREL) [43] and is shown in Equation (6):
S a c c h a r i f i c a t i o n % = G l u c o s e   i n   D P S   h y d r o l y s a t e × 0.9 G l u c a n   c o n t e n t   i n   D P S × 100

2.7. BBD-Based Statistical Analysis

Based on the preliminary experimental analysis and available literature [34], four independent variables—solid loading (X1), enzyme loading (X2), PEG-4000 loading (X3), and saccharification time (X4)—were selected for BBD optimization studies [44,45] using Design Expert-13 software (Version 13.05.0, State-Ease, MN, USA). Table 1 shows the range for each of the independent variables for the enzymatic saccharification of DPS: 5–15% (w/w) solid loading, 2–4% (w/w DPS) enzyme loading, 1–3% (w/w DPS) PEG-4000 loading, and saccharification time of 48–96 h.
A total of 27 experimental setups containing 24 factorial and 3 central points were considered for the BBD to study the saccharification efficiency as a response output based on the RSM. The experimental results were used to obtain the optimum levels of all independent variables for the maximum saccharification of DPS. The experimental run results were entered in the software and analyzed based on the BBD–RSM, where the interaction of independent variables for maximum saccharification was analyzed using a second-order polynomial quadratic regression equation (Equation (7)).
Y i = β 0 + i = 1 k β i X i + i = 1 k β i i X i i + i = 1 k 1 j = i + 1 k β i j X i j + ε
where Yi is the predicted response for saccharification in %; β0 is the constant term; and βi, βii, and βij are the regression coefficients of linear, interaction, and quadratic parameters, respectively. X is the independent variable and k is the number of variables. All coefficients (β) are calculated based on the least-square method.
A quadratic polynomial equation represented the mathematical relationship between the observed responses of the dependent variable (saccharification) and four independent variables. The model fitness was evaluated based on the regression coefficient (R2), adjusted R2, and the F-test-based statistical significance (p-value). Analysis of variance (ANOVA) was used to determine the significant factors for their responses. The 3-dimensional-response surface and contour plots were generated and analyzed for interactive effects of the independent variables for the maximum saccharification of DPS. The optimization tool was used to predict the maximum saccharification of DPS at optimum levels of the selected variables. Considering the process viability, maximum saccharification efficiency was optimized.

2.8. Model Validation

Model prediction is a statistical method, where available data is used for the prediction of outcomes using machine learning and data mining. Several model predictions are reported for the enzymatic saccharification of different lignocellulosic biomasses [44,46,47]. The software’s numerical optimization function helps in determining ideal operating conditions. The validation experiment for the enzymatic saccharification of DPS was carried out based on the optimizer-anticipated output along with the desirability: solid loading of 10.43%, enzyme loading of 2.03% (10 FPU/g DPS), PEG-4000 loading of 1%, and a hydrolysis duration of 48 h. All experimental results and calculated standard deviations are from the average of triplicate experiments and triplicate analysis. For determining the actual and predicted responses, a paired t-test was performed using the Statistical Package for Social Sciences (SPSS) for Microsoft Windows Version 23.0 (IBM India Pvt Ltd., Bangaluru, India).

2.9. Yeast Propagation and Ethanol Fermentation

The ethanol-fermenting yeast S. cerevisiae was grown in YMB medium containing dextrose (50 g/L) at 30 °C in Erlenmeyer flasks under shaking conditions (150 rpm) for 24 h. The saccharified DPS solution was centrifuged at 8000 rpm and a volume of 50 mL containing glucose (20 g/L) was supplemented with YMB broth ingredients of yeast extract (9 g/L) and peptone (10 g/L) and autoclaved at 121 °C for 15 min. The sterilized media was inoculated with S. cerevisiae (10%, v/v, 107 cells/mL) that had been grown for 24 h, and the culture was then incubated at 30 °C under shaking conditions (200 rpm). The samples were withdrawn at 0, 4, 8, 12, 16, 20, 24, 48, 72, and 96 h of fermentation and analyzed for the utilization of glucose and ethanol production. Samples were centrifuged and the cell-free supernatants were analyzed using HPLC [34]. The ethanol yield was calculated as g/g of glucose, and the ethanol conversion efficiency in % was calculated using Equation (8) [34],
E t h a n o l   c o n v e r s i o n   e f f i c i e n c y % = g   e t h a n o l   p e r   g   g l u c o s e   p r o d u c e d e   x p e r i m e n t a l l y 0.51 × 100
where 0.51 is the theoretical maximum yield of gram ethanol per gram glucose.

3. Results and Discussion

3.1. Compositional Analysis

The raw primary sludge compositional analysis showed the presence of 29.5 ± 2.6% (w/wet w) solids, mainly consisting of 61.6% (w/w) polysaccharide, 51 ± 3.3% (w/w) cellulose, 10.6 ± 1.7% (w/w) hemicellulose, and 11 ± 1.7% (w/w) lignin (Table 2). A similar type of compositional pattern has been observed in kraft paper mills [8] and primary sludge [34]. Compositional analysis showed the presence of higher amounts of glucose-based sugars, suggesting PS to be a suitable feedstock for biorefinery applications [34,40]. In addition, the presence of 11% lignin can affect the saccharification process. Although lignin is an important structural component that is linked with cellulose and hemicellulose, it prevents the enzyme from having access to cellulosic and hemicellulosic degradation. Furthermore, the lignocellulosic pretreatment generates aromatic/phenolic acids as lignin derivatives, which inhibits the enzyme and microbial fermentation processes [48]. Hence, it is necessary to delignify the substrate for an efficient saccharification process. The ash content was found to be at a high concentration, which can affect the saccharification process, and so has to be further processed for de-ashing using 1 M hydrochloric acid [30]. The earlier results showed a 64% de-ashing of the PS, which helped in obtaining better saccharification efficiency [34].

3.2. Enzymatic Saccharification

3.2.1. Effect of Non-Ionic Surfactants

The non-ionic surfactant is a lignin blocker investigated in several lignocellulosic hydrolysis process developments. Lignin blockers are agents that complex with lignin components and prevent the non-specific binding of the enzyme with lignin [49]. Lignin blockers are proteins, peptides, metal ions, polymers, and surfactants that enhance the efficiency of enzymatic saccharification [50,51,52]. The present study showed that supplementation of different surfactants enhances the enzymatic saccharification of DPS (Figure 2). Enzymatic saccharification of DPS with PEG-4000 supplementation showed a maximal saccharification of 40.9%, which was 12.8% greater than the control (without surfactant). PEG-10000 and 20000 showed 40.2% and 40.7% saccharification efficiencies, whereas the remaining surfactant supplementations showed saccharification efficiencies in the range of 32.5 to 38.7%. PEG-4000 was found to be the best-performing surfactant for improved saccharification (regression coefficient R2 = 0.82). The other two surfactants, PEG-10,000 and PEG-20,000 showed R2 values of 0.80 and 0.52, respectively. Studies by various researchers who prevented the attachment of cellulase to lignin obtained increased cellulase performance [53,54] and improved enzyme stability [55]. The results of DPS hydrolysis showed an improvement in maximum glucose recovery [34]. The PEG-4000 surfactant can complex with the lignin component, resulting in the blockage of enzyme-specific binding sites for lignin; as a result, improved enzyme stability and an enhancement of cellulase hydrolysis was observed [56,57]. A novel technique of enzyme enhancer addition showed 1.73-fold (9.8 g/L to 17.0 g/L) glucose recovery from the paper-mill sludge [31]. Thus, surfactants act as enzyme stabilizers in increasing enzyme absorption onto the substrate as well by preventing the non-specific binding to other substrates and inhibitors [58,59].

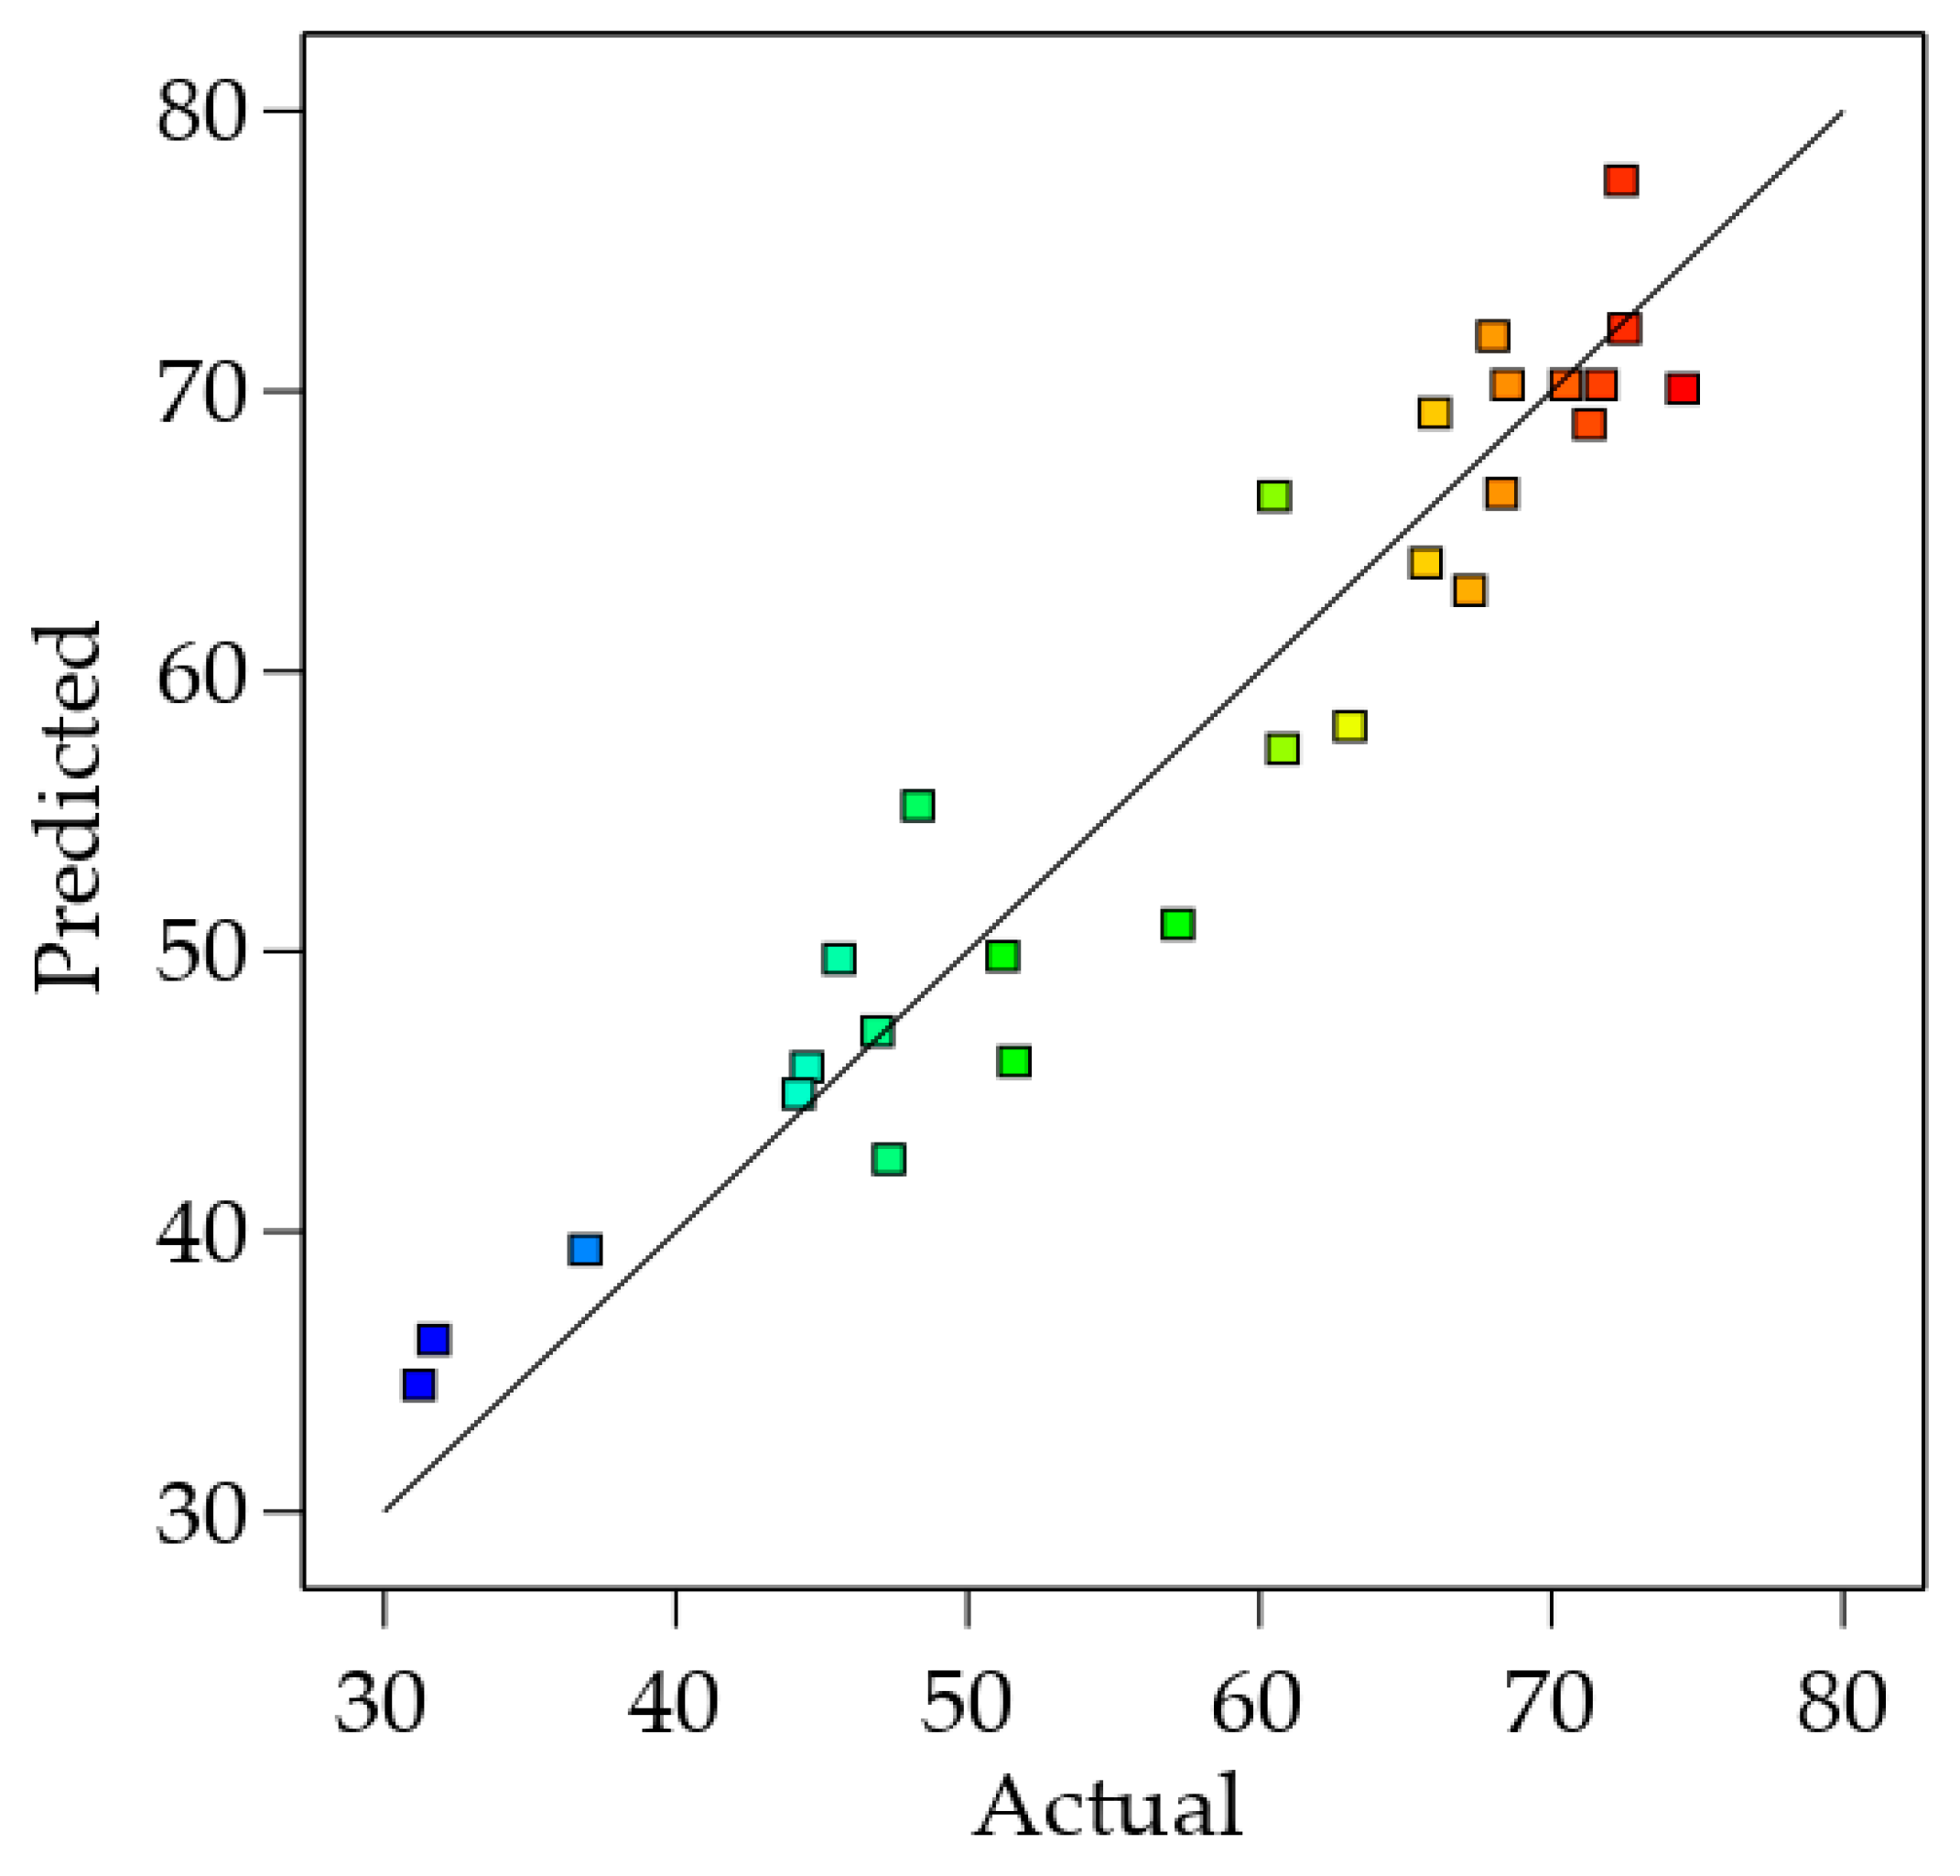
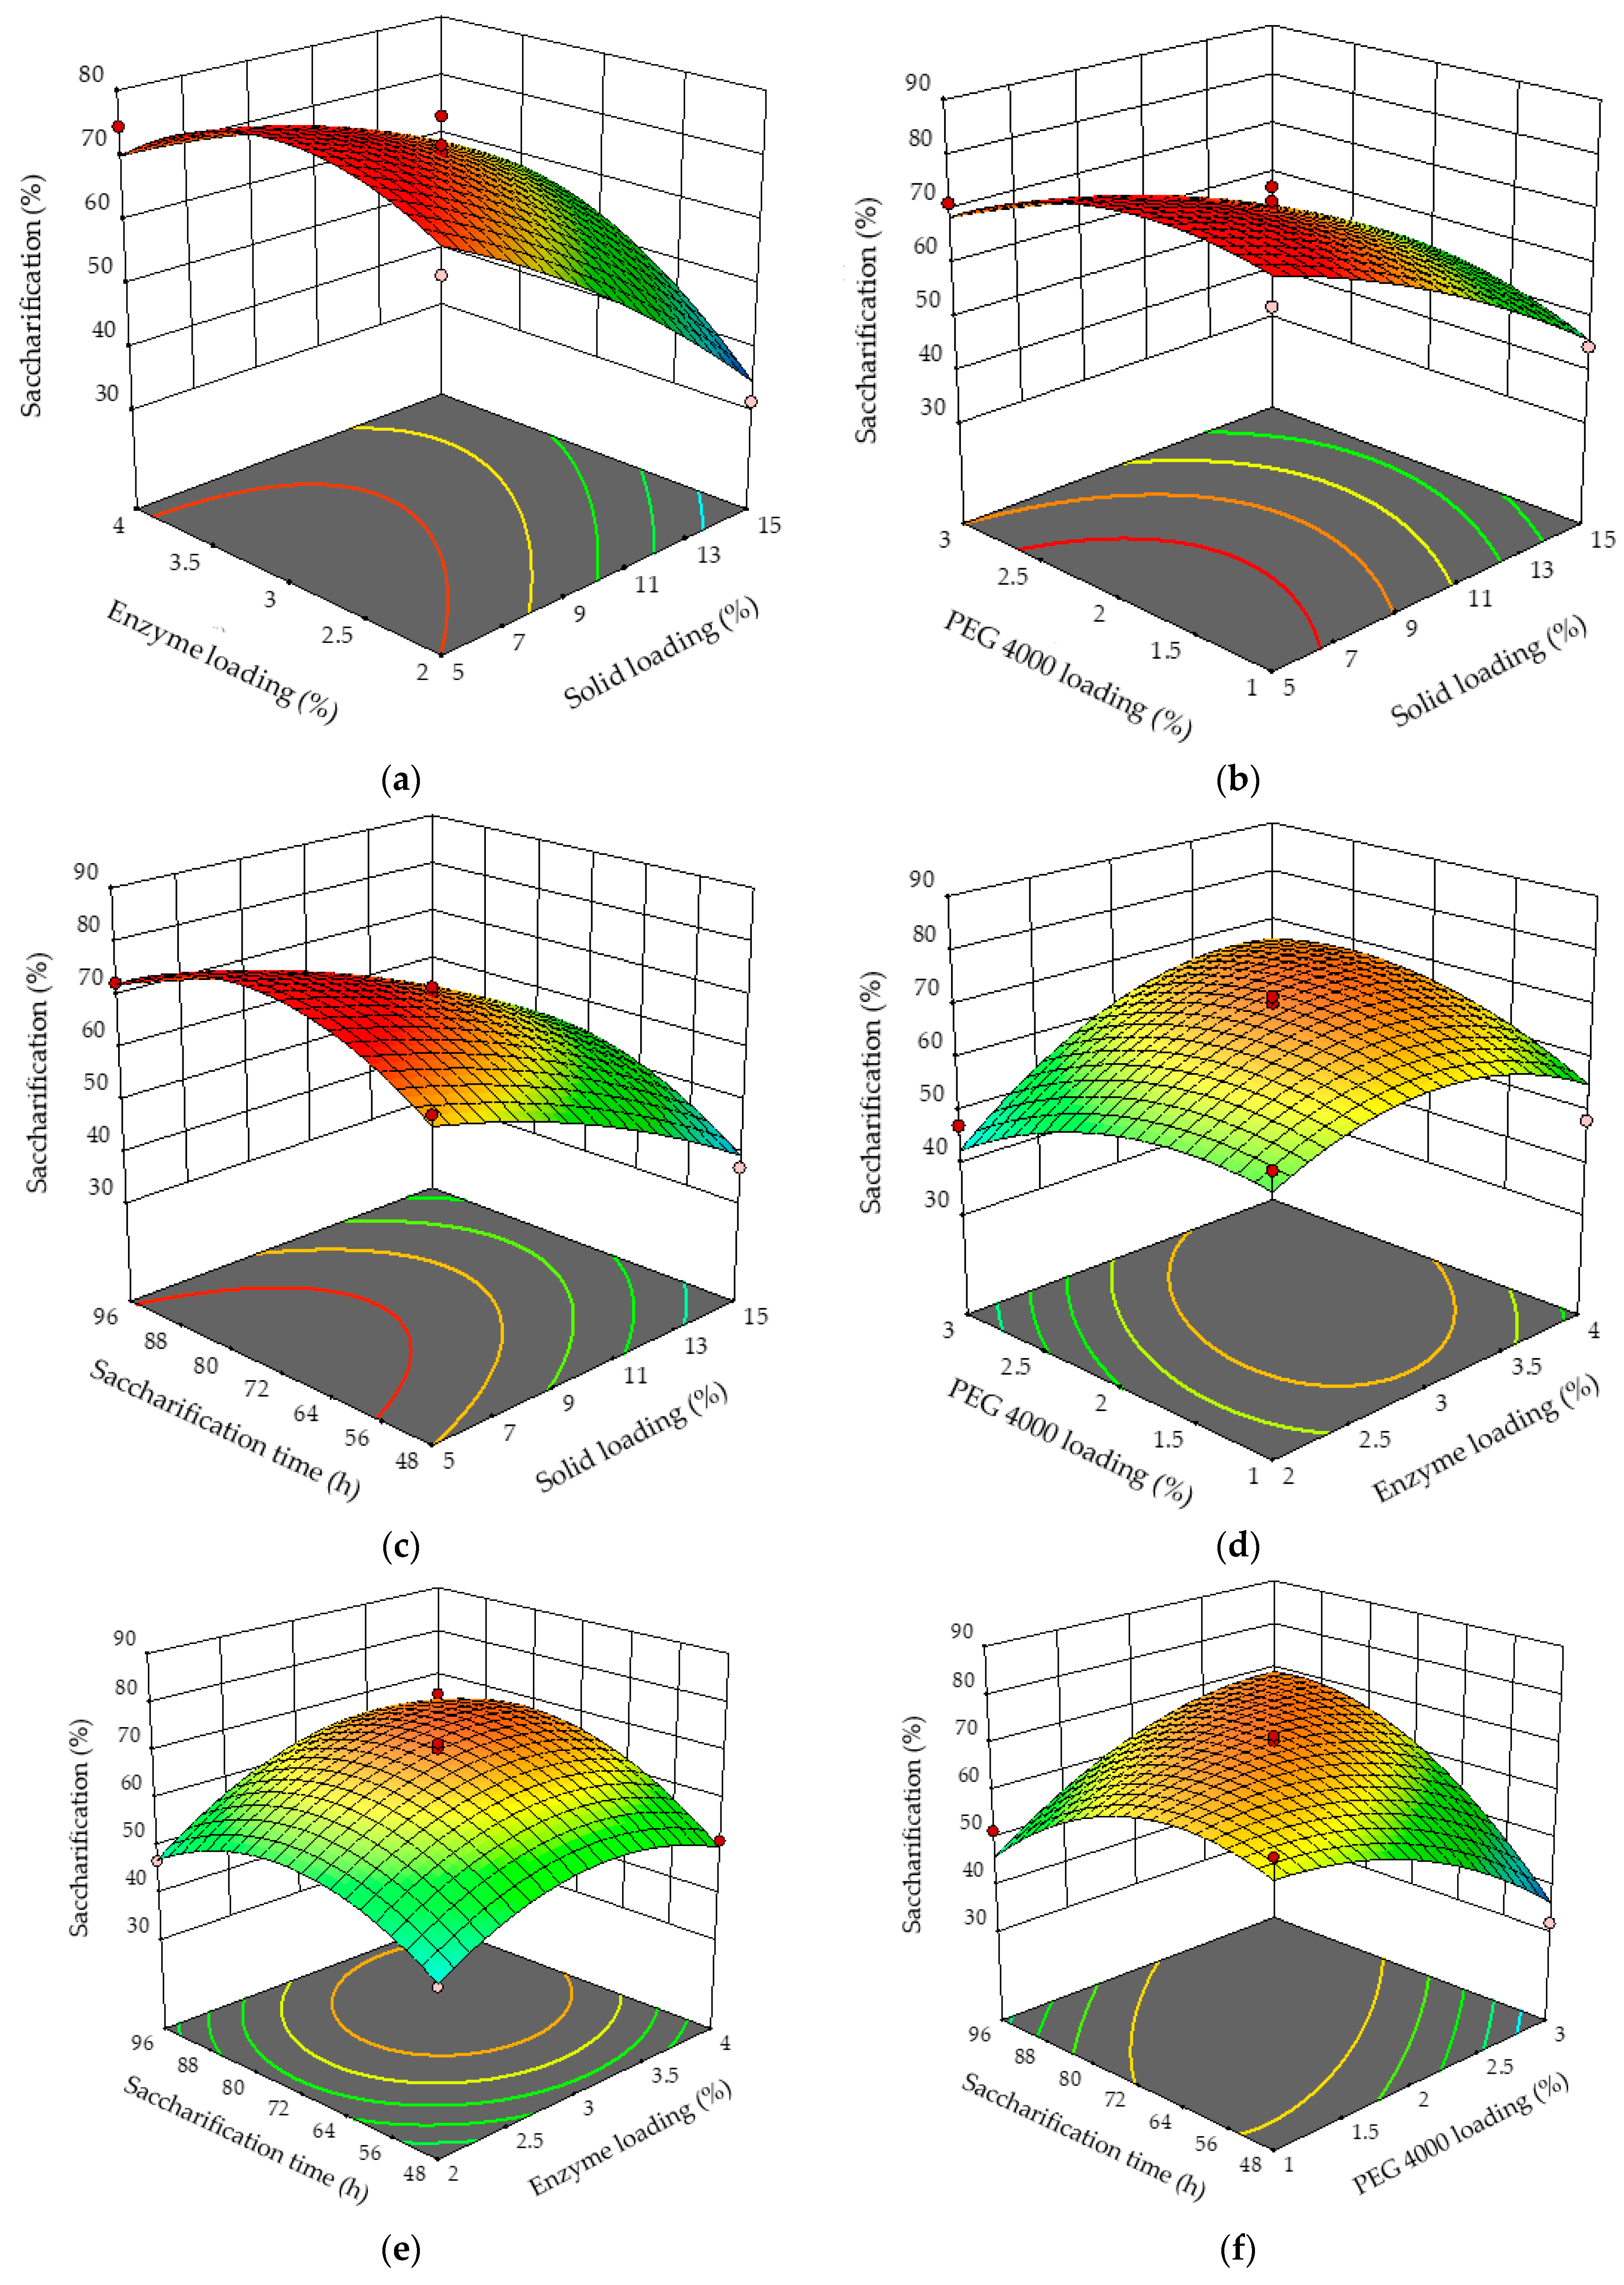
3.2.2. Box–Behnken Design

The observed and theoretical response of % saccharification efficiencies from the statistical analysis of test variables are shown in Table 3. The maximum saccharification (74.5%) was observed using a solid loading of 5% DPS, enzyme loading of 4% (20 FPU/g DPS), 2%, w/w DPS PEG-4000, saccharification time of 72 h (experimental run#3). The equivalent conditions for the minimum saccharification of 31.2% was observed with a solid loading of 15%, enzyme loading of 2% (10 FPU/g DPS), 2% PEG-4000, and saccharification time of 72 h (experimental run#2).
The Analysis of Variance (ANOVA) was used to test the statistical significance of the model equation (Table 4). The results indicated a significant model term (F = 9.52, p > 0.001) at a 99.99% confidence level [24]. The lack-of-fit measured in the model demonstrated a p-value larger than 0.05 (p = 0.0673), showing the best fitness of the regression model with the experimental data, and suggesting that independent factors have a considerable impact on the enzymatic saccharification of DPS [60]. The calculated coefficient of determination (R2) of 91.74% for the saccharification of DPS explains the model responses and variabilities. Equation (4) also includes the coefficients of the response surface model. A p-value greater than 0.05 implies that the words were not significant statistically. In the present study, X1, X2, X4, X1X2, X2X3, X3X4, X2X2, X3X3, and X4X4 terms were found to be the significant model terms affecting the saccharification of DPS. The value of R2 of 0.91 is in agreement with the adjusted R2 (0.82), indicating a good fit with the theoretical and experimental data of the model, where an R2 value close to 1 indicates strong model significance [61,62]. The signal-to-noise ratio was more than 4, suggesting acceptable model discrimination. The sufficient precision of 10.28 showed model navigation in the design space. The regression coefficient of 0.91 showed a linear relationship between the predicted and actual saccharification values (Figure 3).
The regression equation showed a graded connection between saccharification and the independent variables. Equation (9) shows the model-based second-order polynomial equation for the enzymatic saccharification of DPS:
Saccharification (%) = 70.23 − 12.38X1 + 5.41X2 − 0.90X3 + 4.07X4 + 6.35X1X2 + 3.45X1X3 + 1.12X1X4 + 6.43X2X3 + 2.95X2X4 + 12.48X3X4 − 3.05X1X1 − 8.53X2X2 − 6.39X3X3 − 10.26X4X4
where X1 is coded for solid loading (%, w/w), X2 is coded for enzyme loading (%, w/w DPS), X3 is coded for PEG-4000 loading (%, w/w DPS), and X4 is coded for saccharification time (h).
The optimum level of independent variables and their interaction for maximum saccharification of DPS was studied using 3-dimensional graphs, as shown in Figure 4. The overall higher solid loading resulted in lower saccharification efficiency (Figure 4a–c), whereas an increase in enzyme loading resulted in an increase in saccharification efficiency (Figure 4a,d,e). It was observed that a maximum of 80% saccharification was obtained at lower solid loading with 3% enzyme, whereas higher solid loading (15%, w/w) showed 34% saccharification at lower enzyme concentrations (1%). Saccharification increased with increasing enzyme loading, but the saccharification performance was limited to 59% (Figure 4a). On the other hand, a saccharification efficiency of 71% at moderate PEG-4000 loading (2%) and enzyme loading of 3.5% was recorded (Figure 4d). A similar range of saccharification efficiency was observed at 3.5% enzyme loading and saccharification time of 80 h (Figure 4e), PEG-4000 loading (2%, w/w DPS), and saccharification time of 80 h (Figure 4f). Saccharification time showed an increasing trend with time, while PEG-4000 loading showed improved saccharification of DPS with increasing concentration. This lower saccharification is due to the limited mixing of solid substrates with enzymes [63]. From an economical point of view, minimum enzyme and maximum substrate are preferable because feedback inhibition occurs and affects the overall saccharification process. The saccharification efficiency is dependent on the ratio of substate and enzyme for the maximum availability of fibrous substrate for hydrolysis within the speculated saccharification time.
In the model confirmation, the aim was to achieve maximum saccharification of higher solid loading with minimum supplementation of PEG-4000 and enzyme loading at the shortest saccharification time. A model output showed optimal saccharification conditions of 10.43% w/w dry-solid loading, 2.03% enzyme loading (10 FPU/g DPS, and 1% w/w PEG-4000 loading, with the predicted saccharification of 56.76%.

3.2.3. Model Validation

Model validation with an optimum outcome showed 57.66% saccharification after 48 h of saccharification, which is 0.9% higher than the anticipated value, and this could be attributed to the process variation or inappropriate mixing during the experimental operations. The paired t-test does not show any significant difference (t = 1.843, p = 0.113) between the actual and predicted responses on the saccharification of DPS, therefore the proposed model showed excellent accuracy and is validated. The RSM model validation of the enzymatic hydrolysis of maize stover resulted in a 3.4% difference between the actual (57.6%) and anticipated (61.0%) glucose recovery from 10% solid loading with 20% enzyme loading [25]. This is consistent with another study which obtained a glucose recovery of 75% using 10% primary-sludge solid loading, 2% enzyme loading, and 1% PEG-4000 input with a hydrolysis duration of 120 h [34].

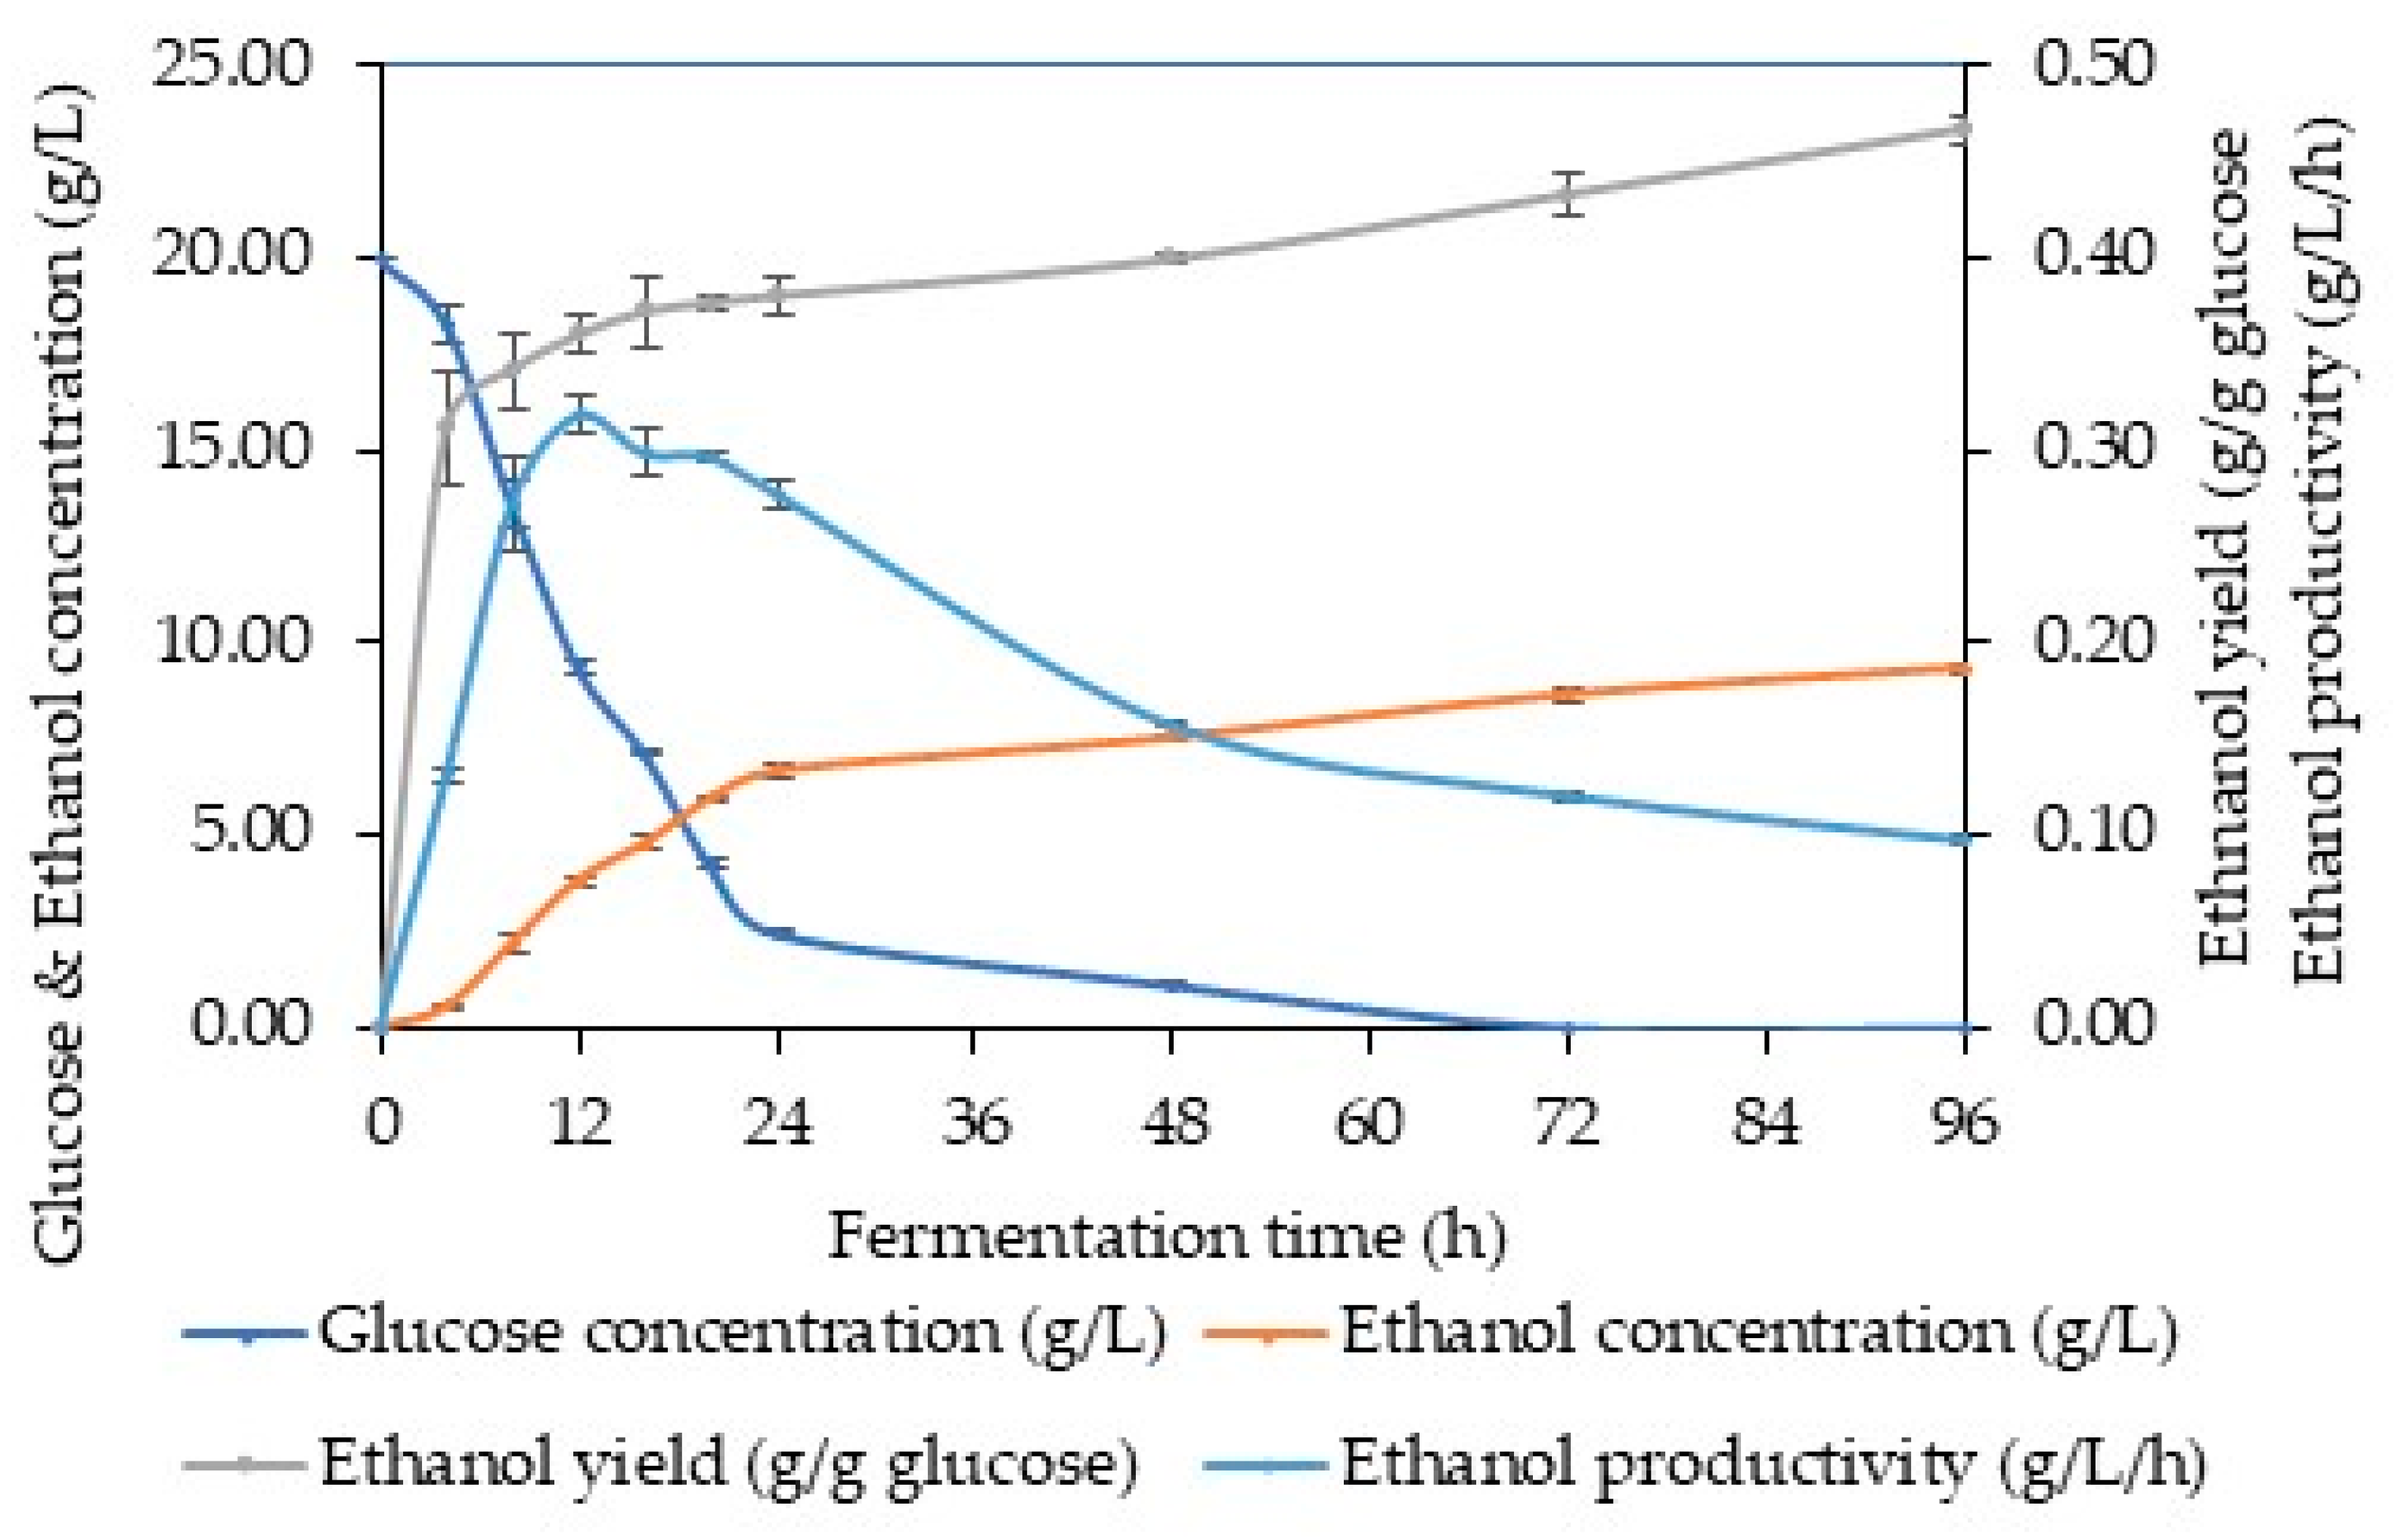
3.3. Ethanol Fermentation

The fermentability of saccharified DPS was studied for bioethanol production using S. cerevisiae D5A ATCC 24860. The ethanol fermentation was studied with saccharified DPS having an initial glucose concentration of 20 g/L, where in 24 h of fermentation time, the glucose concentration decreased to 2.46 g/L. The ethanol production was found to be 6.67 g/L (ethanol yield, 0.38 g/g glucose). An optimum level of ethanol productivity of 0.32 g/L/h was observed at 12 h of fermentation and decreased with time. Overall, 20 g/L of saccharified glucose from DPS resulted in the production of 9.35 g/L of ethanol (ethanol yield, 0.47 g/g glucose), having a conversion efficiency of 91.6% (compared with theoretical maximum) with the ethanol productivity of 0.10 g/L/h (Figure 5). A hydrogen peroxide-accelerated paper-mill sludge showed a 95% theoretical conversion yield of ethanol and higher ethanol productivity in 9 h fermentation time [30].
The sugars derived from the hydrolysis of alkali-pretreated sugarcane bagasse with Cellic CTec2 (6 FPU/g cellulose) and fermented with S. cerevisiae resulted in an ethanol production of 9.07 g/L, with a theoretical yield of 97.92 to 99.85% [64]. Waste-paper hydrolysate showed the highest ethanol production (0.54 g/L/h) with a fermentation conversion efficiency of 90.8% [65]. Overall, the ethanol fermentability of DPS is based on the type of fermenting strain, hydrolyzable substrate, sugar availability, and inhibitors [66]. All these are considered optimal conditions for alcoholic fermentation.

4. Conclusions

This study demonstrated the use of pulp and paper-mill sludge in India as a non-food biomass to produce sugars through enzymatic saccharification and bioethanol through yeast fermentation. The BBD is a useful and reliable tool for finding the best process parameters. The BBD-based optimization study showed the impact of the four process variables, with the process supported by PEG-4000 showing the maximum saccharification efficiency. Consequently, the saccharified hydrolysate containing sugars fermented into bioethanol indicates the potential use of paper-mill sludge as a value-added biomass or substrate that mitigates the sludge disposal associated with a circular economy, which would be an environmentally friendly and sustainable approach.

Author Contributions

Conceptualization, V.Z. and M.F.M.D.; methodology, V.Z.; software, V.Z.; validation, V.Z. and S.J.; formal analysis, V.Z.; investigation, V.Z.; resources, V.Z.; data curation, V.Z.; writing—original draft preparation, V.Z. and S.J.; writing—review and editing, V.Z., S.J., M.F.M.D. and M.P.; visualization, V.Z.; supervision, M.F.M.D.; project administration, V.Z. and M.F.M.D.; funding acquisition, V.Z. and M.F.M.D. All authors have read and agreed to the published version of the manuscript.

Funding

This research was funded by Research Management Center of Universiti Teknologi Malaysia, Malaysia for Fellow Research Grant award number PY/2022/03188.

Institutional Review Board Statement

Not applicable.

Informed Consent Statement

Not applicable.

Data Availability Statement

Data is contained within the article.

Conflicts of Interest

The authors declare no conflict of interest.

References

  1. Anwar, Z.; Gulfraz, M.; Irshad, M. Agro-industrial lignocellulosic biomass a key to unlock the future bio-energy: A brief review. J. Radiat. Res. Appl. Sci. 2014, 7, 163–173. [Google Scholar] [CrossRef]
  2. Isikgor, F.H.; Becer, C.R. Lignocellulosic biomass: A sustainable platform for the production of bio-based chemicals and polymers. Polym. Chem. 2015, 6, 4497–4559. [Google Scholar] [CrossRef] [Green Version]
  3. Sassi, M.; Galarza, M.X.L. Biofuels and Food Security Future Challenges and Opportunities. Energy-Agro-Food Nexus East Africa 2016, 1, 49–65. [Google Scholar]
  4. Future Business Insights. The Global Pulp and Paper Market Is Projected to Grow from $354.39 Billion in 2022 to $372.70 Billion by 2029, at a CAGR of 0.72% in Forecast Period 2022–2029; Future Business Insights: Pune, India, 2022. [Google Scholar]
  5. Statistica. Global Pulp Industry—Statistics & Facts; Statistica: Hamburg, Germany, 2023. [Google Scholar]
  6. Ramos, M.D.N.; Rangel, A.S.; Azevedo, K.S.; Melo, M.G.B.; Oliveira, M.C.; Watanabe, C.M.U.; Pereira, F.F.; Silva, C.M.; Aguiar, A. Characteristics and treatment of Brazilian pulp and paper mill effluents: A review. Environ. Monit. Assess. 2022, 194, 651. [Google Scholar] [CrossRef] [PubMed]
  7. Bajpai, P. Generation of Waste in Pulp and Paper Mills. In Management of Pulp and Paper Mill Waste; Springer International Publishing: Cham, Switzerland, 2015; pp. 9–17. [Google Scholar]
  8. Kang, L.; Wang, W.; Lee, Y.Y. Bioconversion of kraft paper mill sludges to ethanol by SSF and SSCF. Appl. Biochem. Biotechnol. 2010, 161, 53–66. [Google Scholar] [CrossRef] [PubMed]
  9. MOEF. Tehnical EIA Guidance Manual for Pulp and Paper Industries; MOEF: Hyderabad, India, 2010. [Google Scholar]
  10. Salam, M.; Pondith, P.C.; Islam, A.; Khan, M.R.; Uddin, M.R.; Islam, M. Conversion of Cellulosic waste into fermentable sugar: Process optimization. J. Chem. Eng. 2014, 28, 27–31. [Google Scholar] [CrossRef] [Green Version]
  11. Palmqvist, E. Fermentation of Lignocellulosic Hydrolysates: Inhibition and Detoxification. Master’s Thesis, Lund University, Lund, Sweden, 1998. [Google Scholar]
  12. Biswas, R.; Uellendahl, H.; Ahring, B.K. Conversion of C6 and C5 sugars in undetoxified wet exploded bagasse hydrolysates using Scheffersomyces (Pichia) stipitis CBS6054. AMB Express 2013, 3, 42. [Google Scholar] [CrossRef] [Green Version]
  13. Zambare, V.P.; Bhalla, A.; Muthukumarappan, K.; Sani, R.K.; Christopher, L.P. Bioprocessing of agricultural residues to ethanol utilizing a cellulolytic extremophile. Extremophiles 2011, 15, 611–618. [Google Scholar] [CrossRef]
  14. Birgen, C.; Dürre, P.; Preisig, H.A.; Wentzel, A. Butanol production from lignocellulosic biomass: Revisiting fermentation performance indicators with exploratory data analysis. Biotechnol. Biofuels 2019, 12, 167. [Google Scholar] [CrossRef] [Green Version]
  15. Torres-Mayanga, P.C.; Lachos-Perez, D.; Mudhoo, A.; Kumar, S.; Brown, A.B.; Tyufekchiev, M.; Dragone, G.; Mussatto, S.I.; Rostagno, M.A.; Timko, M.; et al. Production of biofuel precursors and value-added chemicals from hydrolysates resulting from hydrothermal processing of biomass: A review. Biomass Bioenergy 2019, 130, 105397. [Google Scholar] [CrossRef]
  16. Cesário, M.T.; Raposo, R.S.; de Almeida, M.C.M.D.; van Keulen, F.; Ferreira, B.S.; da Fonseca, M.M.R. Enhanced bioproduction of poly-3-hydroxybutyrate from wheat straw lignocellulosic hydrolysates. N. Biotechnol. 2014, 31, 104–113. [Google Scholar] [CrossRef] [Green Version]
  17. Leu, S.-Y.; Zhu, J.Y. Substrate-Related Factors Affecting Enzymatic Saccharification of Lignocelluloses: Our Recent Understanding. BioEnergy Res. 2013, 6, 405–415. [Google Scholar] [CrossRef]
  18. Bekele Bayu, A.; Abeto Amibo, T.; Beyan, S.M. Process Optimization for Acid Hydrolysis and Characterization of Bioethanol from Leftover Injera Waste by Using Response Surface Methodology: Central Composite Design. Int. J. Anal. Chem. 2022, 2022, 4809589. [Google Scholar] [CrossRef] [PubMed]
  19. Pereira, L.M.S.; Milan, T.M.; Tapia-Blácido, D.R. Using Response Surface Methodology (RSM) to optimize 2G bioethanol production: A review. Biomass Bioenergy 2021, 151, 106166. [Google Scholar] [CrossRef]
  20. Saleh, A.K.; Abdel-Fattah, Y.R.; Soliman, N.A.; Ibrahim, M.M.; El-Sayed, M.H.; Abd El-Aziz, Z.K.; El-Zawawy, W.K. Box-Behnken design for the optimization of bioethanol production from rice straw and sugarcane bagasse by newly isolated Pichia occidentalis strain AS.2. Energy Environ. 2022, 33, 1613–1635. [Google Scholar] [CrossRef]
  21. Pradhan, D.; Jaiswal, S.; Jaiswal, A.K. Artificial neural networks in valorization process modeling of lignocellulosic biomass. Biofuels Bioprod. Biorefining 2022, 16, 1849–1868. [Google Scholar] [CrossRef]
  22. Zambare, V.P.; Zambare, A.V.; Muthukumarappan, K.; Christopher, L.P. Potential of Thermostable Cellulases in the Bioprocessing of Switchgrass To Ethanol. Bioresources 2011, 6, 2004–2020. [Google Scholar] [CrossRef]
  23. Zambare, V.; Christopher, L. Optimization of enzymatic hydrolysis of corn stover for improved ethanol production. Energy Explor. Exploit. 2012, 30, 193–205. [Google Scholar] [CrossRef] [Green Version]
  24. Zambare, V.P.; Zambare, A.V.; Barh, D.; Christopher, L.P. Optimization of enzymatic hydrolysis of prairie cordgrass for improved ethanol production. J. Renew. Sustain. Energy 2012, 4, 33118. [Google Scholar] [CrossRef]
  25. Qi, B.; Chen, X.; Shen, F.; Su, Y.; Wan, Y. Optimization of enzymatic hydrolysis of wheat straw pretreated by alkaline peroxide using response surface methodology. Ind. Eng. Chem. Res. 2009, 48, 7346–7353. [Google Scholar] [CrossRef]
  26. Bacha, E.G. Response surface methodology modeling, experimental validation, and optimization of acid hydrolysis process parameters for nanocellulose extraction. S. Afr. J. Chem. Eng. 2022, 40, 176–185. [Google Scholar] [CrossRef]
  27. Sasikumar, E.; Viruthagiri, T. Optimization of process conditions using response surface methodology (RSM) for ethanol production from pretreated sugarcane bagasse: Kinetics and modeling. BioEnergy Res. 2008, 1, 239–247. [Google Scholar] [CrossRef]
  28. Gurram, R.N.; Al-Shannag, M.; Lecher, N.J.; Duncan, S.M.; Singsaas, E.L.; Alkasrawi, M. Bioconversion of paper mill sludge to bioethanol in the presence of accelerants or hydrogen peroxide pretreatment. Bioresour. Technol. 2015, 192, 529–539. [Google Scholar] [CrossRef] [PubMed] [Green Version]
  29. Alkasrawi, M.; Al-Othman, A.; Tawalbeh, M.; Doncan, S.; Gurram, R.; Singsaas, E.; Almomani, F.; Al-Asheh, S. A novel technique of paper mill sludge conversion to bioethanol toward sustainable energy production: Effect of fiber recovery on the saccharification hydrolysis and fermentation. Energy 2021, 223, 120018. [Google Scholar] [CrossRef]
  30. Duncan, S.M.; Alkasrawi, M.; Gurram, R.; Almomani, F.; Wiberley-Bradford, A.E.; Singsaas, E. Paper Mill Sludge as a Source of Sugars for Use in the Production of Bioethanol and Isoprene. Energies 2020, 13, 4662. [Google Scholar] [CrossRef]
  31. Alkasrawi, M.; Rajangam, A.S.; Tawalbeh, M.; Kafiah, F.; Al-Othman, A.; Al-Asheh, S.; Sun, Q. Techno-economic analysis and a novel assessment technique of paper mill sludge conversion to bioethanol toward sustainable energy production. Int. J. Energy Res. 2020, 44, 12602–12613. [Google Scholar] [CrossRef]
  32. Zambare, V.P.; Christopher, L.P. Integrated biorefinery approach to utilization of pulp and paper mill sludge for value-added products. J. Clean. Prod. 2020, 274, 122791. [Google Scholar] [CrossRef]
  33. Tawalbeh, M.; Rajangam, A.S.; Salameh, T.; Al-Othman, A.; Alkasrawi, M. Characterization of paper mill sludge as a renewable feedstock for sustainable hydrogen and biofuels production. Int. J. Hydrogen Energy 2021, 46, 4761–4775. [Google Scholar] [CrossRef]
  34. Prasetyo, J.; Naruse, K.; Kato, T.; Boonchird, C.; Harashima, S.; Park, E.Y. Bioconversion of paper sludge to biofuel by simultaneous saccharification and fermentation using a cellulase of paper sludge origin and thermotolerant Saccharomyces cerevisiaeTJ14. Biotechnol. Biofuels 2011, 4, 35. [Google Scholar] [CrossRef] [Green Version]
  35. Yadav, S.; Mohanty, P. Utilization of paper mill sludge as a sustainable source of hydrogen production. Biofuels 2022, 13, 1113–1118. [Google Scholar] [CrossRef]
  36. Kaur, R.; Tyagi, R.D.; Zhang, X. Review on pulp and paper activated sludge pretreatment, inhibitory effects and detoxification strategies for biovalorization. Environ. Res. 2020, 182, 109094. [Google Scholar] [CrossRef] [PubMed]
  37. Statista. Leading Pulp for Paper Producing Countries Worldwide in 2021; Statistica: Hamburg, Germany, 2023. [Google Scholar]
  38. Furszyfer Del Rio, D.D.; Sovacool, B.K.; Griffiths, S.; Bazilian, M.; Kim, J.; Foley, A.M.; Rooney, D. Decarbonizing the pulp and paper industry: A critical and systematic review of sociotechnical developments and policy options. Renew. Sustain. Energy Rev. 2022, 167, 112706. [Google Scholar] [CrossRef]
  39. TAPPI Test Methods. Carbohydrate composition of extractive-free wood and wood pulp by gas liquid chromatograph. Tech. Assoc. Pulp Pap. Ind. 1984, T249 cm-85, 1–8. [Google Scholar]
  40. Alhammad, A.; Adewale, P.; Kuttiraja, M.; Christopher, L.P. Enhancing enzyme-aided production of fermentable sugars from poplar pulp in the presence of non-ionic surfactants. Bioprocess Biosyst. Eng. 2018, 41, 1133–1142. [Google Scholar] [CrossRef] [PubMed]
  41. Gao, X.; Kumar, R.; Wyman, C.E. Fast hemicellulose quantification via a simple one-step acid hydrolysis. Biotechnol. Bioeng. 2014, 111, 1088–1096. [Google Scholar] [CrossRef] [PubMed]
  42. Adney, B.; Baker, J. Measurement of Cellulase Activities Laboratory; National Renewable Energy Laboratory: Golden, CO, USA, 1996; p. 8. [Google Scholar]
  43. Selig, M.; Weiss, N.; Ji, Y. Enzymatic Saccharification of Lignocellulosic Biomass; National Renewable Energy Laboratory: Golden, CO, USA, 2008. [Google Scholar]
  44. Das, S.; Bhattacharya, A.; Haldar, S.; Ganguly, A.; Gu, S.; Ting, Y.P.; Chatterjee, P.K. Optimization of enzymatic saccharification of water hyacinth biomass for bio-ethanol: Comparison between artificial neural network and response surface methodology. Sustain. Mater. Technol. 2015, 3, 17–28. [Google Scholar] [CrossRef] [Green Version]
  45. Kanno, A.; Reungsang, A.; Imai, T.; Higuchi, T.; Sekine, M.; Yamamoto, K.; Phummala, K. Optimization of enzymatic hydrolysis for pretreated wood waste by response surface methodology in fermentative hydrogen production. J. Water Environ. Technol. 2015, 13, 153–166. [Google Scholar] [CrossRef] [Green Version]
  46. Pandiyan, K.; Tiwari, R.; Singh, S.; Nain, P.K.S.; Rana, S.; Arora, A.; Singh, S.B.; Nain, L. Optimization of Enzymatic Saccharification of Alkali Pretreated Parthenium sp. Using Response Surface Methodology. Enzyme Res. 2014, 2014, 764898. [Google Scholar] [CrossRef] [Green Version]
  47. Nag, A.; Sprague, M.A.; Griggs, A.J.; Lischeske, J.J.; Stickel, J.J.; Mittal, A.; Wang, W.; Johnson, D.K. Parameter determination and validation for a mechanistic model of the enzymatic saccharification of cellulose-I β. Biotechnol. Prog. 2015, 31, 1237–1248. [Google Scholar] [CrossRef]
  48. Ladeira Ázar, R.I.S.; Bordignon-Junior, S.E.; Laufer, C.; Specht, J.; Ferrier, D.; Kim, D. Effect of Lignin Content on Cellulolytic Saccharification of Liquid Hot Water Pretreated Sugarcane Bagasse. Molecules 2020, 25, 623. [Google Scholar] [CrossRef] [Green Version]
  49. Ying, W.; Shi, Z.; Yang, H.; Xu, G.; Zheng, Z.; Yang, J. Effect of alkaline lignin modification on cellulase–lignin interactions and enzymatic saccharification yield. Biotechnol. Biofuels 2018, 11, 214. [Google Scholar] [CrossRef] [PubMed]
  50. Huang, C.; Li, R.; Tang, W.; Zheng, Y.; Meng, X. Improve Enzymatic Hydrolysis of Lignocellulosic Biomass by Modifying Lignin Structure via Sulfite Pretreatment and Using Lignin Blockers. Fermentation 2022, 8, 558. [Google Scholar] [CrossRef]
  51. Lin, X.; Qiu, X.; Yuan, L.; Li, Z.; Lou, H.; Zhou, M.; Yang, D. Lignin-based polyoxyethylene ether enhanced enzymatic hydrolysis of lignocelluloses by dispersing cellulase aggregates. Bioresour. Technol. 2015, 185, 165–170. [Google Scholar] [CrossRef]
  52. Chen, Y.-A.; Zhou, Y.; Qin, Y.; Liu, D.; Zhao, X. Evaluation of the action of Tween 20 non-ionic surfactant during enzymatic hydrolysis of lignocellulose: Pretreatment, hydrolysis conditions and lignin structure. Bioresour. Technol. 2018, 269, 329–338. [Google Scholar] [CrossRef] [PubMed]
  53. Zhang, Y.; Xu, X.; Zhang, Y.; Li, J. Effect of adding surfactant for transforming lignocellulose into fermentable sugars during biocatalysing. Biotechnol. Bioprocess Eng. 2011, 16, 930–936. [Google Scholar] [CrossRef]
  54. Sipos, B.; Dienes, D.; Schleicher, Á.; Perazzini, R.; Crestini, C.; Siika-aho, M.; Réczey, K. Hydrolysis efficiency and enzyme adsorption on steam-pretreated spruce in the presence of poly(ethylene glycol). Enzyme Microb. Technol. 2010, 47, 84–90. [Google Scholar] [CrossRef] [Green Version]
  55. Gunjikar, T.P.; Sawant, S.B.; Joshi, J.B. Shear deactivation of cellulase, exoglucanase, endoglucanase, and β-glucosidase in a mechanically agitated reactor. Biotechnol. Prog. 2001, 17, 1166–1168. [Google Scholar] [CrossRef]
  56. Wang, W.; Zhuang, X.; Tan, X.; Wang, Q.; Chen, X.; Yu, Q.; Qi, W.; Wang, Z.; Yuan, Z. Dual effect of nonionic surfactants on improving the enzymatic hydrolysis of lignocellulose. Energy Fuels 2018, 32, 5951–5959. [Google Scholar] [CrossRef]
  57. Rocha-Martín, J.; Martinez-Bernal, C.; Pérez-Cobas, Y.; Reyes-Sosa, F.M.; García, B.D. Additives enhancing enzymatic hydrolysis of lignocellulosic biomass. Bioresour. Technol. 2017, 244, 48–56. [Google Scholar] [CrossRef]
  58. Kaar, W.E.; Holtzapple, M.T. Benefits from Tween during enzymic hydrolysis of corn stover. Biotechnol. Bioeng. 1998, 59, 419–427. [Google Scholar] [CrossRef]
  59. Helle, S.S.; Duff, S.J.B.; Cooper, D.G. Effect of surfactants on cellulose hydrolysis. Biotechnol. Bioeng. 1993, 42, 611–617. [Google Scholar] [CrossRef] [PubMed]
  60. Abdul Manaf, S.F.; Indera Luthfi, A.A.; Md Jahim, J.; Harun, S.; Tan, J.P.; Mohd Shah, S.S. Sequential detoxification of oil palm fronds hydrolysate with coconut shell activated charcoal and pH controlled in bioreactor for xylitol production. Chem. Eng. Res. Des. 2022, 179, 90–106. [Google Scholar] [CrossRef]
  61. Gunawan, E.R.; Basri, M.; Rahman, M.B.A.; Salleh, A.B.; Rahman, R.N.Z.A. Study on response surface methodology (RSM) of lipase-catalyzed synthesis of palm-based wax ester. Enzyme Microb. Technol. 2005, 37, 739–744. [Google Scholar] [CrossRef]
  62. Fang, H.; Zhao, C.; Song, X.Y. Optimization of enzymatic hydrolysis of steam-exploded corn stover by two approaches: Response surface methodology or using cellulase from mixed cultures of Trichoderma reesei RUT-C30 and Aspergillus niger NL02. Bioresour. Technol. 2010, 101, 4111–4119. [Google Scholar] [CrossRef]
  63. Wang, Z.; Wu, S.; Fan, C.; Zheng, X.; Zhang, W.; Wu, D.; Wang, X.; Kong, H. Optimisation of enzymatic saccharification of wheat straw pre-treated with sodium hydroxide. Sci. Rep. 2021, 11, 23234. [Google Scholar] [CrossRef]
  64. Portero Barahona, P.; Bastidas Mayorga, B.; Martín-Gil, J.; Martín-Ramos, P.; Carvajal Barriga, E.J. Cellulosic Ethanol: Improving Cost Efficiency by Coupling Semi-Continuous Fermentation and Simultaneous Saccharification Strategies. Processes 2020, 8, 1459. [Google Scholar] [CrossRef]
  65. Nishimura, H.; Tan, L.; Sun, Z.-Y.; Tang, Y.-Q.; Kida, K.; Morimura, S. Efficient production of ethanol from waste paper and the biochemical methane potential of stillage eluted from ethanol fermentation. Waste Manag. 2016, 48, 644–651. [Google Scholar] [CrossRef]
  66. Branco, R.; Serafim, L.; Xavier, A. Second Generation Bioethanol Production: On the Use of Pulp and Paper Industry Wastes as Feedstock. Fermentation 2018, 5, 4. [Google Scholar] [CrossRef] [Green Version]
Figure 1. Schematic representation of experimental setup for the production of bioethanol.
Sustainability 15 10740 g001
Figure 2. Effect of different surfactants on enzymatic saccharification of DSP under the following conditions: Solid loading—5%; Enzyme loading—2%; Surfactant loading—1%; pH 5 (50 mmol/L, sodium citrate buffer), Saccharification temperature—50 °C; Agitation—200 rpm. Note: Error bars represent the standard deviation of triplicate experiments and triplicate analyses.
Sustainability 15 10740 g002
Figure 3. Actual and predicted response for the saccharification of DPS. Color points by value of saccharification time from 48 h (blue) to 96 h (red).
Sustainability 15 10740 g003
Figure 4. Three-dimensional response surface plots showing the effect of different variables on DPS saccharification: solid and enzyme loading (a), solid loading and PEG-4000 loading (b), solid loading and saccharification time (c), enzyme loading and PEG-4000 (d), enzyme loading and saccharification time, and (e) PEG-4000 loading and saccharification time (f). Green, yellow, and red color showed low, medium, and high % saccharification, respectively.
Sustainability 15 10740 g004
Figure 5. Ethanol fermentation of saccharified DPS (initial glucose concentration of 20 g/L). Error bars represent the standard deviation of triplicate experiments and triplicate analyses.
Sustainability 15 10740 g005
Table 1. Coded levels and decoded values of BBD design.
FactorsNameUnitsLow (−1)High (+1)
X1Solid loading% (w/w *)515
X2Enzyme loading% (w/w *)24
X3PEG-4000 loading% (w/w *)13
X4Saccharification timeh4896
* w/w DPS.
Table 2. The composition of paper-mill primary sludge.
ComponentsComposition
Moisture70.5 ± 3.7% (w/wet w)
Solids29.5 ± 2.6% (w/wet w)
Cellulose (Glucan)51.0 ± 3.3% (w/w dry solids)
Hemicelluloses10.6 ± 1.7% (w/w dry solids)
Lignin11.0 ± 1.7% (w/w dry solids)
Ash13.9 ± 2.0% (w/w dry solids)
Table 3. Box–Behnken design with observed and predicted response of enzymatic saccharification of DPS.
Std.
Run
Point
Type
Actual FactorsObserved
Saccharification
(%)
Predicted
Saccharification
(%)
X1
(%) *
X2
(%) *
X3
(%) *
X4
(h)
1Factorial5227268.072.0
2Factorial15227231.234.5
3Factorial5427274.570.1
4Factorial15427263.158.0
5Factorial10314867.262.9
6Factorial10334831.736.1
7Factorial10319651.646.1
8Factorial10339666.069.2
9Factorial5324868.366.4
10Factorial15324836.939.4
11Factorial5329672.572.2
12Factorial15329645.649.8
13Factorial10217260.857.2
14Factorial10417248.355.2
15Factorial10237247.342.6
16Factorial10437260.566.3
17Factorial5317272.477.5
18Factorial15317244.545.9
19Factorial5337271.368.9
20Factorial15337257.251.0
21Factorial10224844.244.9
22Factorial10424851.249.9
23Factorial10229646.947.2
24Factorial10429665.763.9
25Center10327270.570.2
26Center10327268.570.2
27Center10327271.770.2
X1, Solid loading; X2, Enzyme loading; X3, PEG-4000 loading; X4, Saccharification time; * w/w DPS.
Table 4. ANOVA for the quadratic response surface model (RSM) from the enzymatic saccharification of DPS.
SourceSum of SquaresDFMean SquareF
Value
p-Value (Prob > F)
Model4195.8414299.709.520.0002 *
X1-Solid loading1837.6911837.6958.37<0.0001 *
X2-Enzyme loading351.001351.0011.150.0059 *
X3-PEG-4000 loading9.7219.720.30870.5887
X4-Saccharification time198.451198.456.300.0274 *
X1X2161.291161.295.120.0430 *
X1X347.61147.611.510.2424
X1X45.0615.060.16080.6955
X2X3165.121165.125.240.0409 *
X2X434.81134.811.110.3138
X3X4622.501622.5019.770.0008 *
X1X149.61149.611.580.2333
X2X2387.601387.6012.310.0043 *
X3X3217.601217.606.910.0220 *
X4X4561.701561.7017.840.0012 *
Residual377.831231.49
Lack of Fit372.601037.2614.260.0673
Pure Error5.2322.61
Cor Total4573.6726
* Significant variable at 95% confidence. R2: 0.91, R2Adj: 0.82. Adequate precision ratio:10.28. DF, degree of freedom.
Disclaimer/Publisher’s Note: The statements, opinions and data contained in all publications are solely those of the individual author(s) and contributor(s) and not of MDPI and/or the editor(s). MDPI and/or the editor(s) disclaim responsibility for any injury to people or property resulting from any ideas, methods, instructions or products referred to in the content.

