Article

Profiling Citizens on Perception of Key Factors of Food Security: An Application of K-Means Cluster Analysis

Department of Soil, Plant and Food Sciences (DISSPA), University of Bari Aldo Moro, Via Amendola 165/a, 70126 Bari, Italy
*
Author to whom correspondence should be addressed.
Sustainability 2023, 15(13), 9915; https://doi.org/10.3390/su15139915
Submission received: 3 May 2023 / Revised: 14 June 2023 / Accepted: 20 June 2023 / Published: 21 June 2023

Abstract

:
Cities have been increasingly involved in the development of food policies, becoming key points in achieving food security and fostering the transition to sustainable agri-food systems. The aim of this paper is to identify citizens’ profiles by performing segmentation and profiling according to their socio-economic variables and perception of key factors affecting food security. This is to define appropriate strategies to guide policy makers in a more effective creation of urban food policies. An online survey was filled out by citizens of the Metropolitan City of Bari from July to November 2022. Descriptive analysis, principal component analysis and K-means cluster analysis were applied to the collected data. Four clusters of citizens were obtained and labelled based on socio-economic characteristics and key factors affecting food security perception. Specifically, the “Law-confident” (45% of citizens) and “Hedonist” (36%) clusters revealed the greatest trust in “governance” and “quality certification” aspects. The “Capitalist” (15%) and “Conservatory” (4%) clusters were relatively small groups, characterized respectively by a positive perception of the standardization of food production and governance power, with a focus on strategies regarding food policy implementation, reduction of food loss and waste (FLW) and improvement of food quality certifications systems. The proposed approach and results may support EU policy makers in identifying key macro-areas and matters toward which to direct public funding in order to improve food security in urban areas, and to put in place actions enhancing citizens’ knowledge and awareness of key issues of food security.

1. Introduction

Food is a primary need, and this makes food security a severe problem worldwide [1]. According to the FAO, food security is a “situation that exists when all people, at all times, have physical, social and economic access to sufficient, safe and nutritious food that meets their dietary needs and food preferences for an active and healthy life” [2]. Food security covers four pillars, namely availability, access, utilization and stability [3]. The efficiency and equitable functioning of agri-food systems are key points in achieving not only social and environmental sustainability, but also food security [4]. Agri-food system security has been reported on in recent years [5]. Food security is currently at the centre of global economic and social debates, so it has a crucial role in ensuring economic and physical access to food for present and future generations, one of the dimensions of food security [6]. Conventional agri-food systems actually have limited resilience, being vulnerable to several shocks such as increasing occurrence of extreme natural events [7] such as the COVID-19 pandemic [8] and the current Russia–Ukraine conflict [9]. Even before the COVID-19 crisis and other events, there was an urgent call for sustainable food systems to address food security and nutrition [10]. The COVID-19 crisis affected food demand, food supply and food loss and waste, hence the increased interest in the global agri-food system [11]. The pandemic emergency revealed some of the vulnerabilities of late capitalist economies [12], exacerbating the injustices and weaknesses of the current agri-food system that had already emerged [13]. Unfortunately, the Russian–Ukrainian conflict that started in February 2022 has further increased global vulnerability and food insecurity [14], intensifying current price instability so as to provoke a strong and global rise in commodity prices only a month after the war’s outbreak [9].
The war worsened food insecurity more severely in those countries strongly dependent on Ukraine and Russia for cereal grain supplies (e.g., Egypt and Turkey), and caused difficulties in the supply of fertilizers and chemicals [15]. This situation threatens the achievement of the Sustainable Development Goals (SDGs), particularly the Zero Hunger Goal (SDG 2), aiming at fighting hunger and granting food security and quality food from sustainable farming systems. The situation is critical, not only in relation to developing countries, but globally [16]. Indeed, according to SDG indicator 2.1.2, assessing the level of food insecurity in the population, it was estimated that in 2022 almost 30% of the global population cannot feed itself sufficiently and suffers from food insecurity. In addition, the global prevalence of severe food insecurity constantly increased, reaching about one billion people in 2021 (11.7% of the global population) [17]. Moreover, food insecurity is more difficult to face than other events such as poverty. Some authors found that, in Italy, the share of people threatened by food insecurity and poverty accounts, on average, to 22.3% of the entire population and reaches 29.6% in some regions (e.g., Abruzzo) [18]. Cities are essential for the transition to sustainable food systems [19] and have come to the fore as crucial new actors [20,21].
The urban agro-ecological transition, including food policies, may be crucial in facing environmental emergencies and improving agri-food systems, but is also key in solving political and social issues with an agro-ecological approach [22]. Metropolitan areas are a key point in encouraging food production and must be acknowledged in research and policy [23,24]. The main feature of food policies is being developed on different levels and in different sectors of intervention in a multidisciplinary approach, involving different policy areas and stakeholders belonging to public and private bodies, civil society and NGOs. [25]. The food-planning process is developing in many Italian cities [26]. The first movement of urban food policies began its activities in 2010 with the Food Plan of the province of Pisa (Tuscany), resulting from the joint efforts of the University of Pisa, the Laboratory of Rural Studies Sismondi and the Province of Pisa. This Food Plan offers a valuable opportunity for understanding the specific relationships between local government and food movements [27]. Urban food policies in Italy were implemented through two key factors. The first was the institutionalization of metropolitan cities [28], and second was the World Exposition hosted by Milan in 2015 (EXPO 2015). Indeed, the food policy of Milan was drafted in July 2014. This was a work programme whose main objective was the production of a policy document for the City of Milan [25]. On 15 October 2015, the Milan Urban Food Policy Pact (MUFFP), which is an international protocol aiming to create cooperation on food policies, was established by 138 cities worldwide [29].
The policy of Milan is a strategy based on five priorities: (1) healthy food for everyone; (2) sustainability of the food system; (3) food education; (4) fight against food waste; and (5) scientific research on agri-food systems. This is a particularly interesting case study, as the success of MUFFP has been its integration into the administration and the institutionalisation of food policy [30,31], assuming great relevance in overall planning [25].
Major development of food policies can be observed in the northern and central regions of Europe, due to the influence of MUFFP; other important examples of food policy implementations are being carried out by the municipalities of Lucca, Pisa and Livorno. However, the development of these urban food policies did not occur inside a defined and organic national legal food system framework, so each urban policy is mainly implemented through private corporate and civil society initiatives [32].
The geographical area considered in this research is the Metropolitan City of Bari—MCB (southern Italy), which is one of the nine cities involved in the FoodShift 2030 EU project [33] aimed at fostering the transition of European food systems to efficient resource use and low carbon emissions and also promoting sustainable food diets. The “Manifesto for Sustainable Food Transition” of the MCB [34] was drafted as part of the FoodShift 2030 EU project, which gives evidence of the commitment of the city to setting the right direction for a local and urban food policy.
In light of this multifaceted scenario, the aim of this study is to identify citizens’ profiles of the area of the Metropolitan City of Bari (MCB), based on citizens’ perceptions of the key factors related to food security and their socio-demographic characteristics. This is the first study attempting to classify citizens into different categories based on their viewpoints on food security. The segmentation and classification of these citizens could provide concrete basis to guide policy makers and other stakeholders toward a more effective creation of the MCB and to propose effective long-term measures aimed at ensuring safe, healthy, sustainable and nutritious food for residents and surrounding communities.

2. Materials and Methods

2.1. Data Collection and Participants

Data were collected using an online questionnaire created in Google Forms and shared through social media (e.g., WhatsApp, Facebook, LinkedIn), and an initial sample of 600 citizens of the MCB was obtained. Filling in the questionnaire took about 20 min. The survey was preliminarily tested through a pilot study involving members of the research group and a panel of experts on food security in order to check the validity and reliability of the questionnaire.
For all survey participants, written informed consent was collected in accordance with the national ethical requirement, the Personal Data Protection Code (D.L. no. 196/2003). Data collection took place from July to November 2022. We used a convenience sample, making data collection less costly and time-consuming than other sampling methods [35]. The questionnaire included the concept of food security as established at the World Food Summit in 1996 [36], stating that “food security is characterized as a condition for which all people, at all times, have physical, social and economic access to sufficient, safe and nutritious food that meets their dietary needs and food preferences for an active and healthy life”, as well as the objective of the research. The questionnaire was structured in two parts: the first section contained the instructions to fill in 46 questions containing 46 items on food security taken from the existing thematic scientific literature. For each question corresponding to the item, participants were asked to assign a score through a 10-point Likert rating scale, explained by verbal anchors (−5 to −1 = obstacle; 0 = irrelevant; +1 to +5 = incentive). Starting from a 5-point Likert rating scale, which is considered the one that produces data of higher quality according to the scientific literature [37,38], we also included negative scores for helping the respondents in evaluating items as obstacles. The second section collected data on the socio-demographic characteristics of the respondents, such as age, gender, education level, employment status and average annual income.
Demographic data were collected through questions with fixed response categories [39] in order to select the suitable response (e.g., age by age class). A preliminary analysis showed that most of the respondents aged 20–30 years old and >70 years old gave irrelevant answers (0 score) for at least 70% of the items. This may be due to their limited involvement and/or interest in food security issues. Therefore, these respondents showed a disinterested behaviour and were excluded from the sample, in order not to compromise data quality. The final eligible study sample consisted of 377 respondents.

2.2. Data Analysis

Data were submitted to two types of analyses using IBM SPSS Statistics (version 21). First, a descriptive analysis was carried out to describe the sample, in particular through computation of percentages and cumulative frequencies. Then, two multivariate analyses were conducted: principal component analysis (PCA) and cluster analysis (k-means technique). We defined perception of the achievement of food security using the 46 items, capable of explaining the variability in food security perception.
To better describe the results, we needed to reduce the number of items without losing the variability of the phenomenon under study. PCA is one of the multivariate analysis techniques able to solve this problem, widely used in scientific research [40,41] although mostly applied to topics other than food security, but in this case it proved very effective in addressing the aim of the research. PCA optimizes information about a phenomenon, collecting the initial variables observed into fewer new variables called principal components (PCs), which can explain maximum variability out of total variability [42]. PCs were extracted using an eigenvalue of 1 as a cutoff [43,44] according to the Guttman–Kaiser criterion [45]. PCs are generally estimated either from a correlation matrix or a covariance matrix; in this research a correlation matrix was calculated [46]. When the variables are measured in different units, scale effects can influence the composition of derived components. In such situations, it is desirable to standardize the variables [47]; in this research all the socio-demographic variables were standardized.
Then, the cluster analysis was applied to identify food consumers’ distinctive features, obtaining a limited number of distinct consumer profiles [48]. In this research, the k-means method was applied due to its simplicity and efficiency [49]. The first step of this method relies on calculation of the centroids for each cluster. Subsequently, the distances between the current data vector and each of the centroids are computed, identifying the cluster whose centroid is closest to the current data vector [50]. K-means takes into account an n × d data matrix, where n is the number of data points embedded in a d dimensional feature space to create k clusters, where each data point is assigned to just one cluster and data are grouped using an iterative process [51].
According to [52], the selection of the number of clusters k has to be chosen a priori; in this research four clusters proved to be the optimal number to avoid drawbacks [53]. K-means clustering was carried out based on the resulting PCs; once clusters were obtained, they were characterised [54], taking into account both citizens’ socio-economic characteristics and their perceptions of the key factors related to food security.

3. Results and Discussion

3.1. Sample Description

Table 1 shows the characteristics of the initial study sample, based on the following variables: gender, age, education, level of income and employment. The majority are males (54%) and middle-aged (30% are 30–39 years old), with a middle-class income from 25,100 to 40,000 €/year (45%). The most frequent job descriptions were full-time employment (64%); the unemployed, including housewives, were 2%. The majority hold high school degrees (44%) and university or postgraduate degrees (42%). After the preliminary analysis of the responses, it emerged that most of citizens aged 20–30 years old and >70 years old showed a disinterested attitude, assigning a 0 score (irrelevant) for at least 70% of the items; they were thus excluded from the final sample.
Table 2 shows the frequency (%) of all items within both the initial and final samples (600 vs. 377 respondents). It is to be noted that the majority of citizens attributed a role of incentive to most of the items. In particular, the main items evaluated as incentives to achieve food security were ICT services (91%), food policy (88%), qualification of workforce (84.7%), quality control (84.2%), EU support and food banks (83.7% and 83.5%, respectively). On the contrary, the main items considered as obstacles to achieving food security (from −5 to −1 score) were price volatility (74.1%), climate change and crop genome adaptation (67.4%), market globalization (51.6%) and large-scale retail (LSR) power (47%). Moreover, about one-third of the respondents declared that intensive production systems are also considered an obstacle.

3.2. Principal Component Analysis

PCA, performed using all 46 items and taking into account the final sample, enabled the definition of eight new components. These components showed eigenvalues higher than one, and the cumulative variance explained by the eight new components was 72.2%, as shown in Table 3. Only the first four PCs, reporting total eigenvalues up to 1.6, were considered, due to their highest significant contribution to explained variance, their easier interpretability and labelling. Furthermore, the last four components were able to account for only 10% of the total explained variance, requiring great interpretative efforts for effective labelling. Therefore, we selected the variables mainly affecting the components according to the factor loading in the component matrix (factor loading W|0.5|) [52]. Table 4 shows the effect of each variable on the new components.
The four selected components were labelled according to the factor loading of the variables for each component (Table 4). The first component highlighted that social aspects, such as social certification, fighting illegal hiring and food policy have to be the basis of current and future urban food policy. This component was labelled as a “governance” macro-area.
In the second component, labelled the “market” macro-area, market aspects caused the main drivers of food security. In the third component, environmental certification, quality control and certification of Protected Designation of Origin–Protected Geographical Indications (PDO–PGI) showed factor loading with maximum scores in such a way that this third component was labelled the “quality” macro-area. The fourth component was labelled “sustainability of production systems” because it mainly included sustainable production technology, such as food waste recycling technology, intensive production and food loss and waste strategies variables, with maximum factor loading.
The next step was to use these four main components and related items for the application of the k-means clustering.

3.3. Cluster Analysis

A four-cluster solution according to the components PC-1 (governance), PC-2 (market), PC-3 (quality) and PC-4 (sustainability of production systems) emerged as the optimum for k-means clustering. In particular, cluster 1 was represented by MCB citizens sensitive to components PC-2 (market) and PC-4 (sustainability of production systems), and therefore interested in the market and sustainability aspects of production systems as levers for achieving food security. Cluster 2 was represented by MCB citizens convinced that components PC-1 (governance) and PC-3 (quality) could be drivers for food security. Cluster 3 was represented by MCB citizens believing that only the PC-3 component (quality) was not a driver to achieving food security; finally, MCB citizens belonging to cluster 4 considered the PC-1 component (governance) a driver for food security, while remaining indifferent to other PCA components (Table 5).
The four clusters of MCB citizens were profiled according to the socio-economic variables; only 10 items were considered (Table 6). The items were grouped in four macro-areas: governance (food policy, food loss and waste, EU support), market (LSR power, price volatility, market globalisation), sustainability of production systems (intensive production, FW recycling technology) and quality (PDO–PGI certifications, environmental certification).
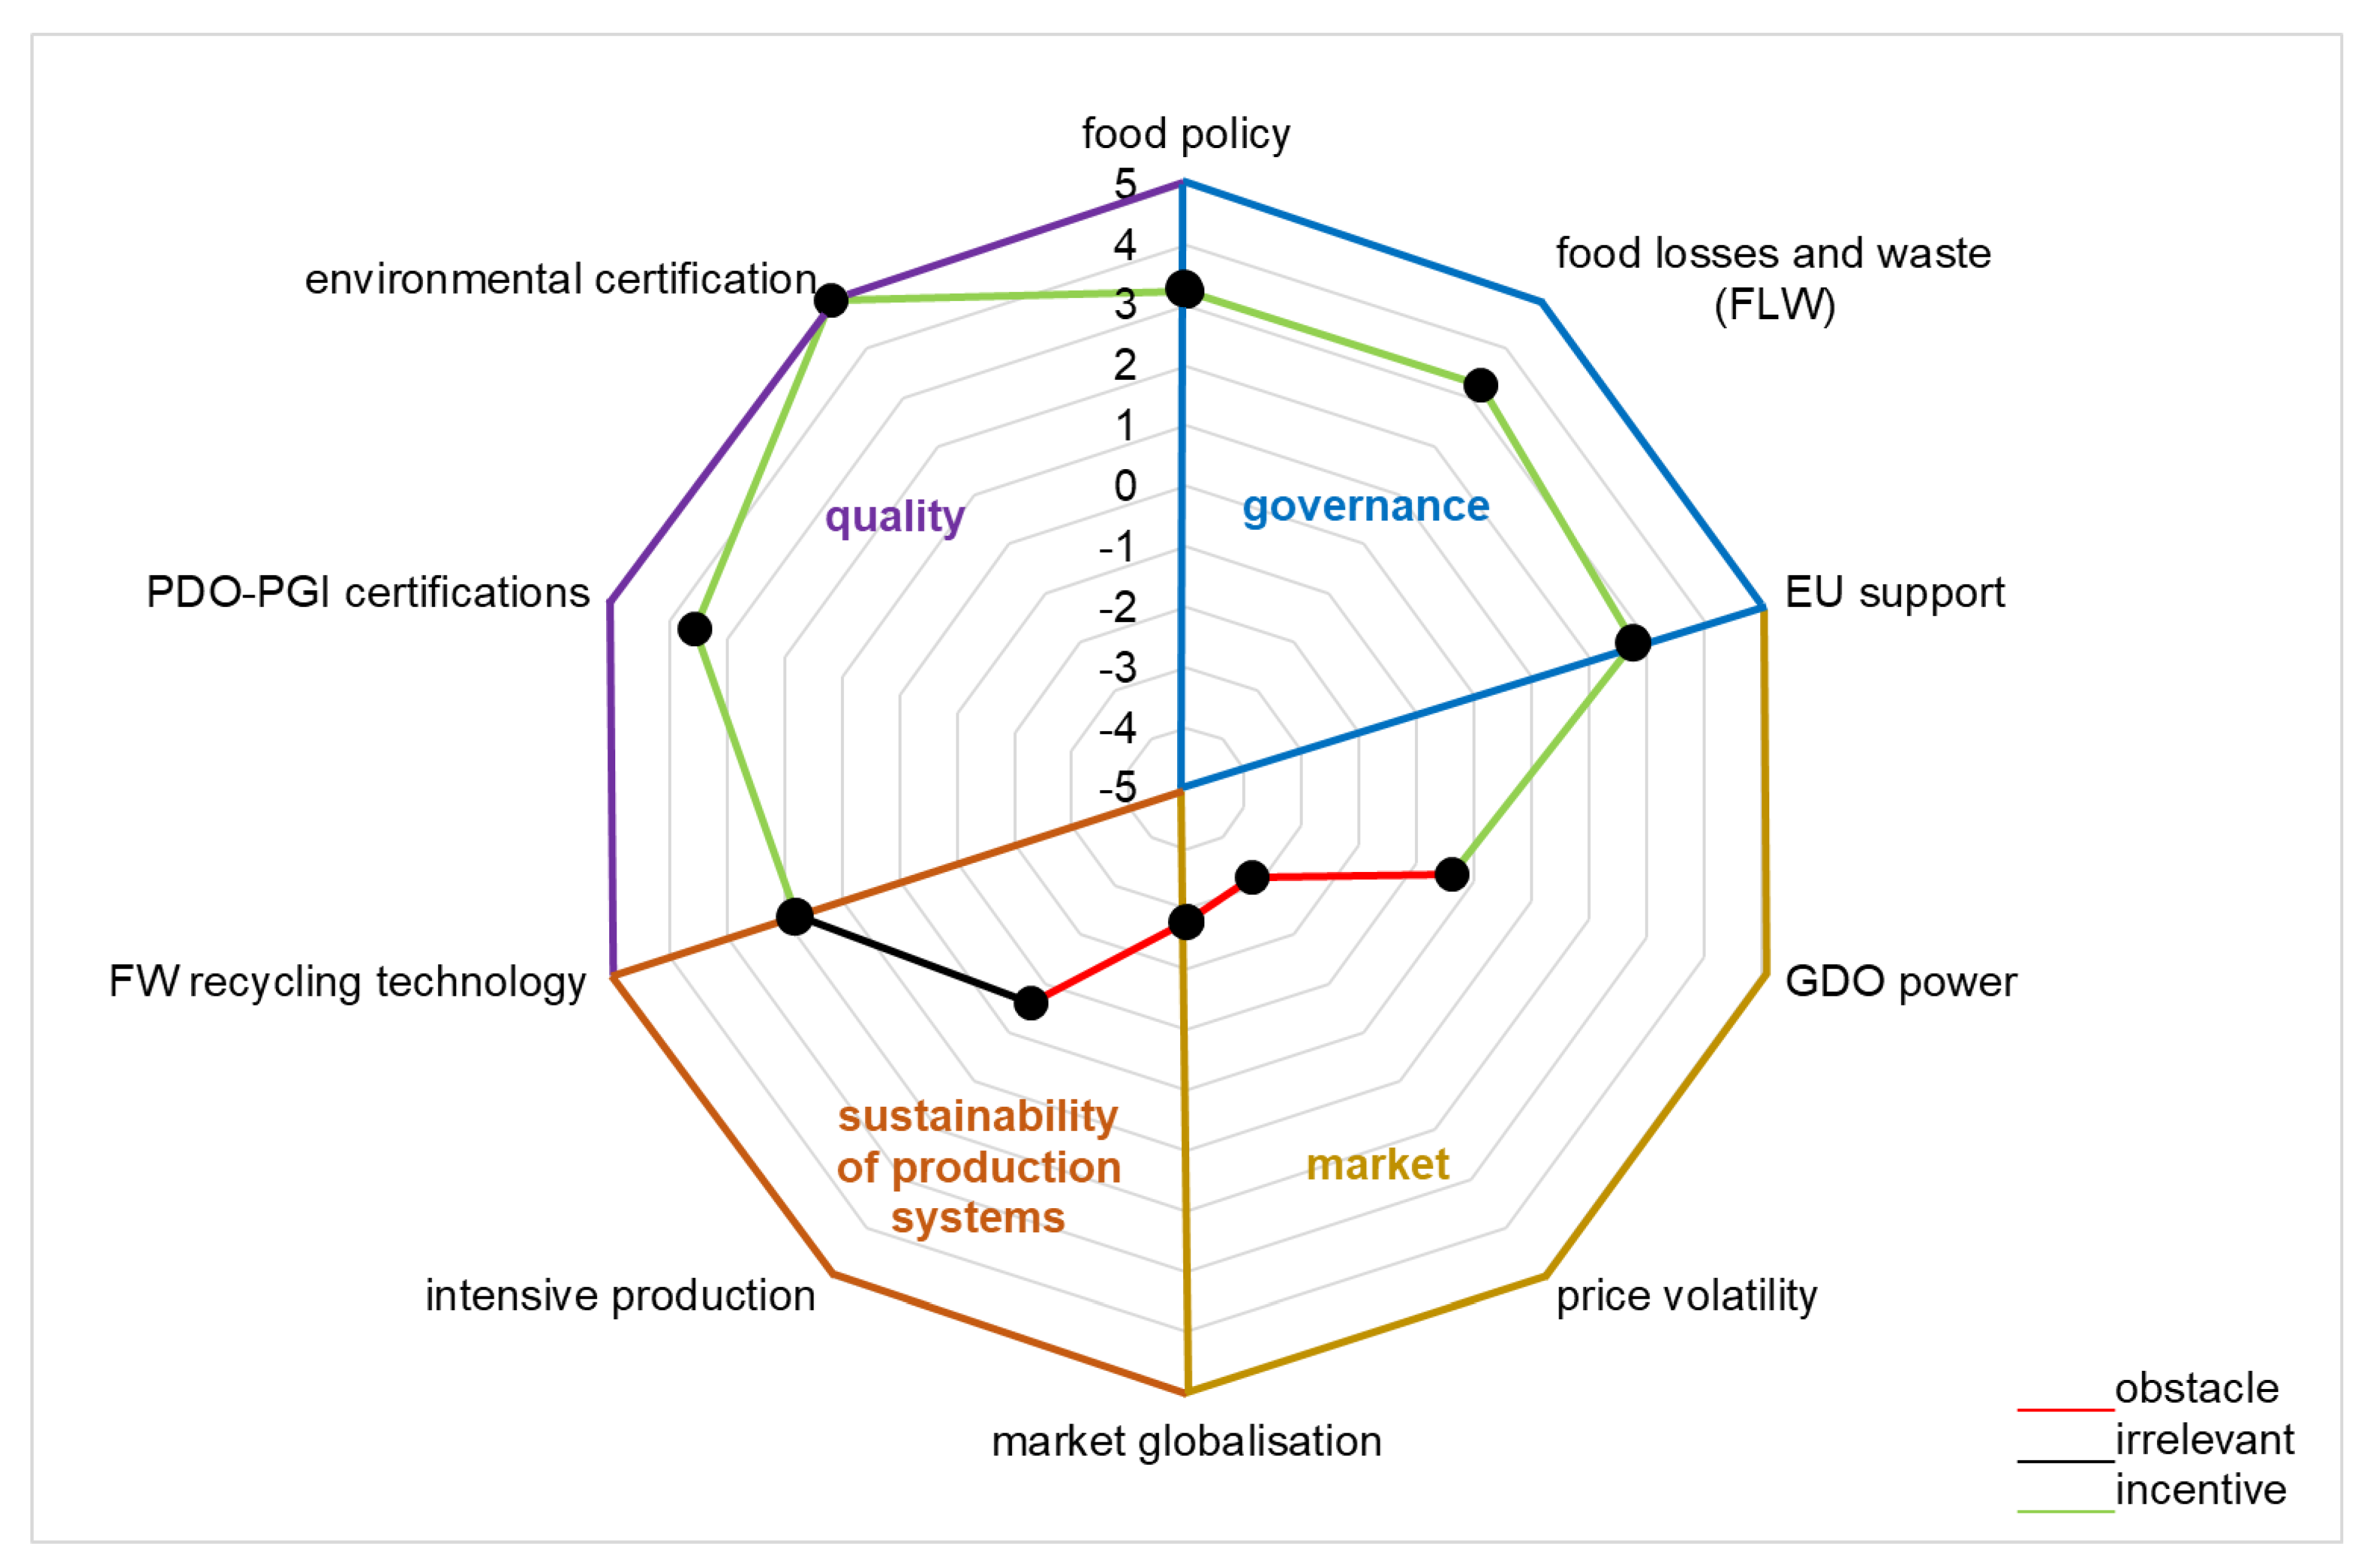
Figure 1, Figure 2, Figure 3 and Figure 4 show the profiles of citizens according to each cluster. The scores and the four macro-areas are highlighted by different colours. The first group of citizens, identified as cluster 1 and labelled as “Capitalists” (Figure 1), represents 15% of the sample. They are mainly males between 30–39 years old, full-time employees with high annual income (more than 60,000 €/year). In relation to the governance macro-area, these citizens showed a negative perception (i.e., barrier to food security achievement) of the items belonging to this area, namely “food policy” (−0.7), “food loss and waste (FLW)” (−0.1) and “EU support” (−0.9). This result is in contrast with findings by other authors [25,55], who defined governance as key factor for development of urban food policies that support sustainable nutrition and diets, food production availability and distribution and management of food waste. Furthermore, these citizens showed, in relation to the “market” macro-area, a perception of irrelevance (score equal to 0) of “LSR power” and negative scores for the items “price volatility” (−2.7) and “market globalisation” (−0.6). This is in line with other scholars, who found that the seasonal variation in food prices leads consumers to uncertainty and risk [56,57,58]. Regarding the “sustainability of production systems” macro-area, these citizens showed a positive score for the item “intensive production” (3.3). Indeed, they assumed that intensive production can improve food availability and liberate these economies from the risk of hunger and poverty [59]. Conversely, they attributed a negative score to the item “food waste recycling technology” (−0.1). Moreover, these citizens attached a negative score for the quality macro-area, in particular for “PDO–PGI certifications” (−0.1 score) and “environmental certification” (−1.0), these items were thus considered barriers to food security achievement.
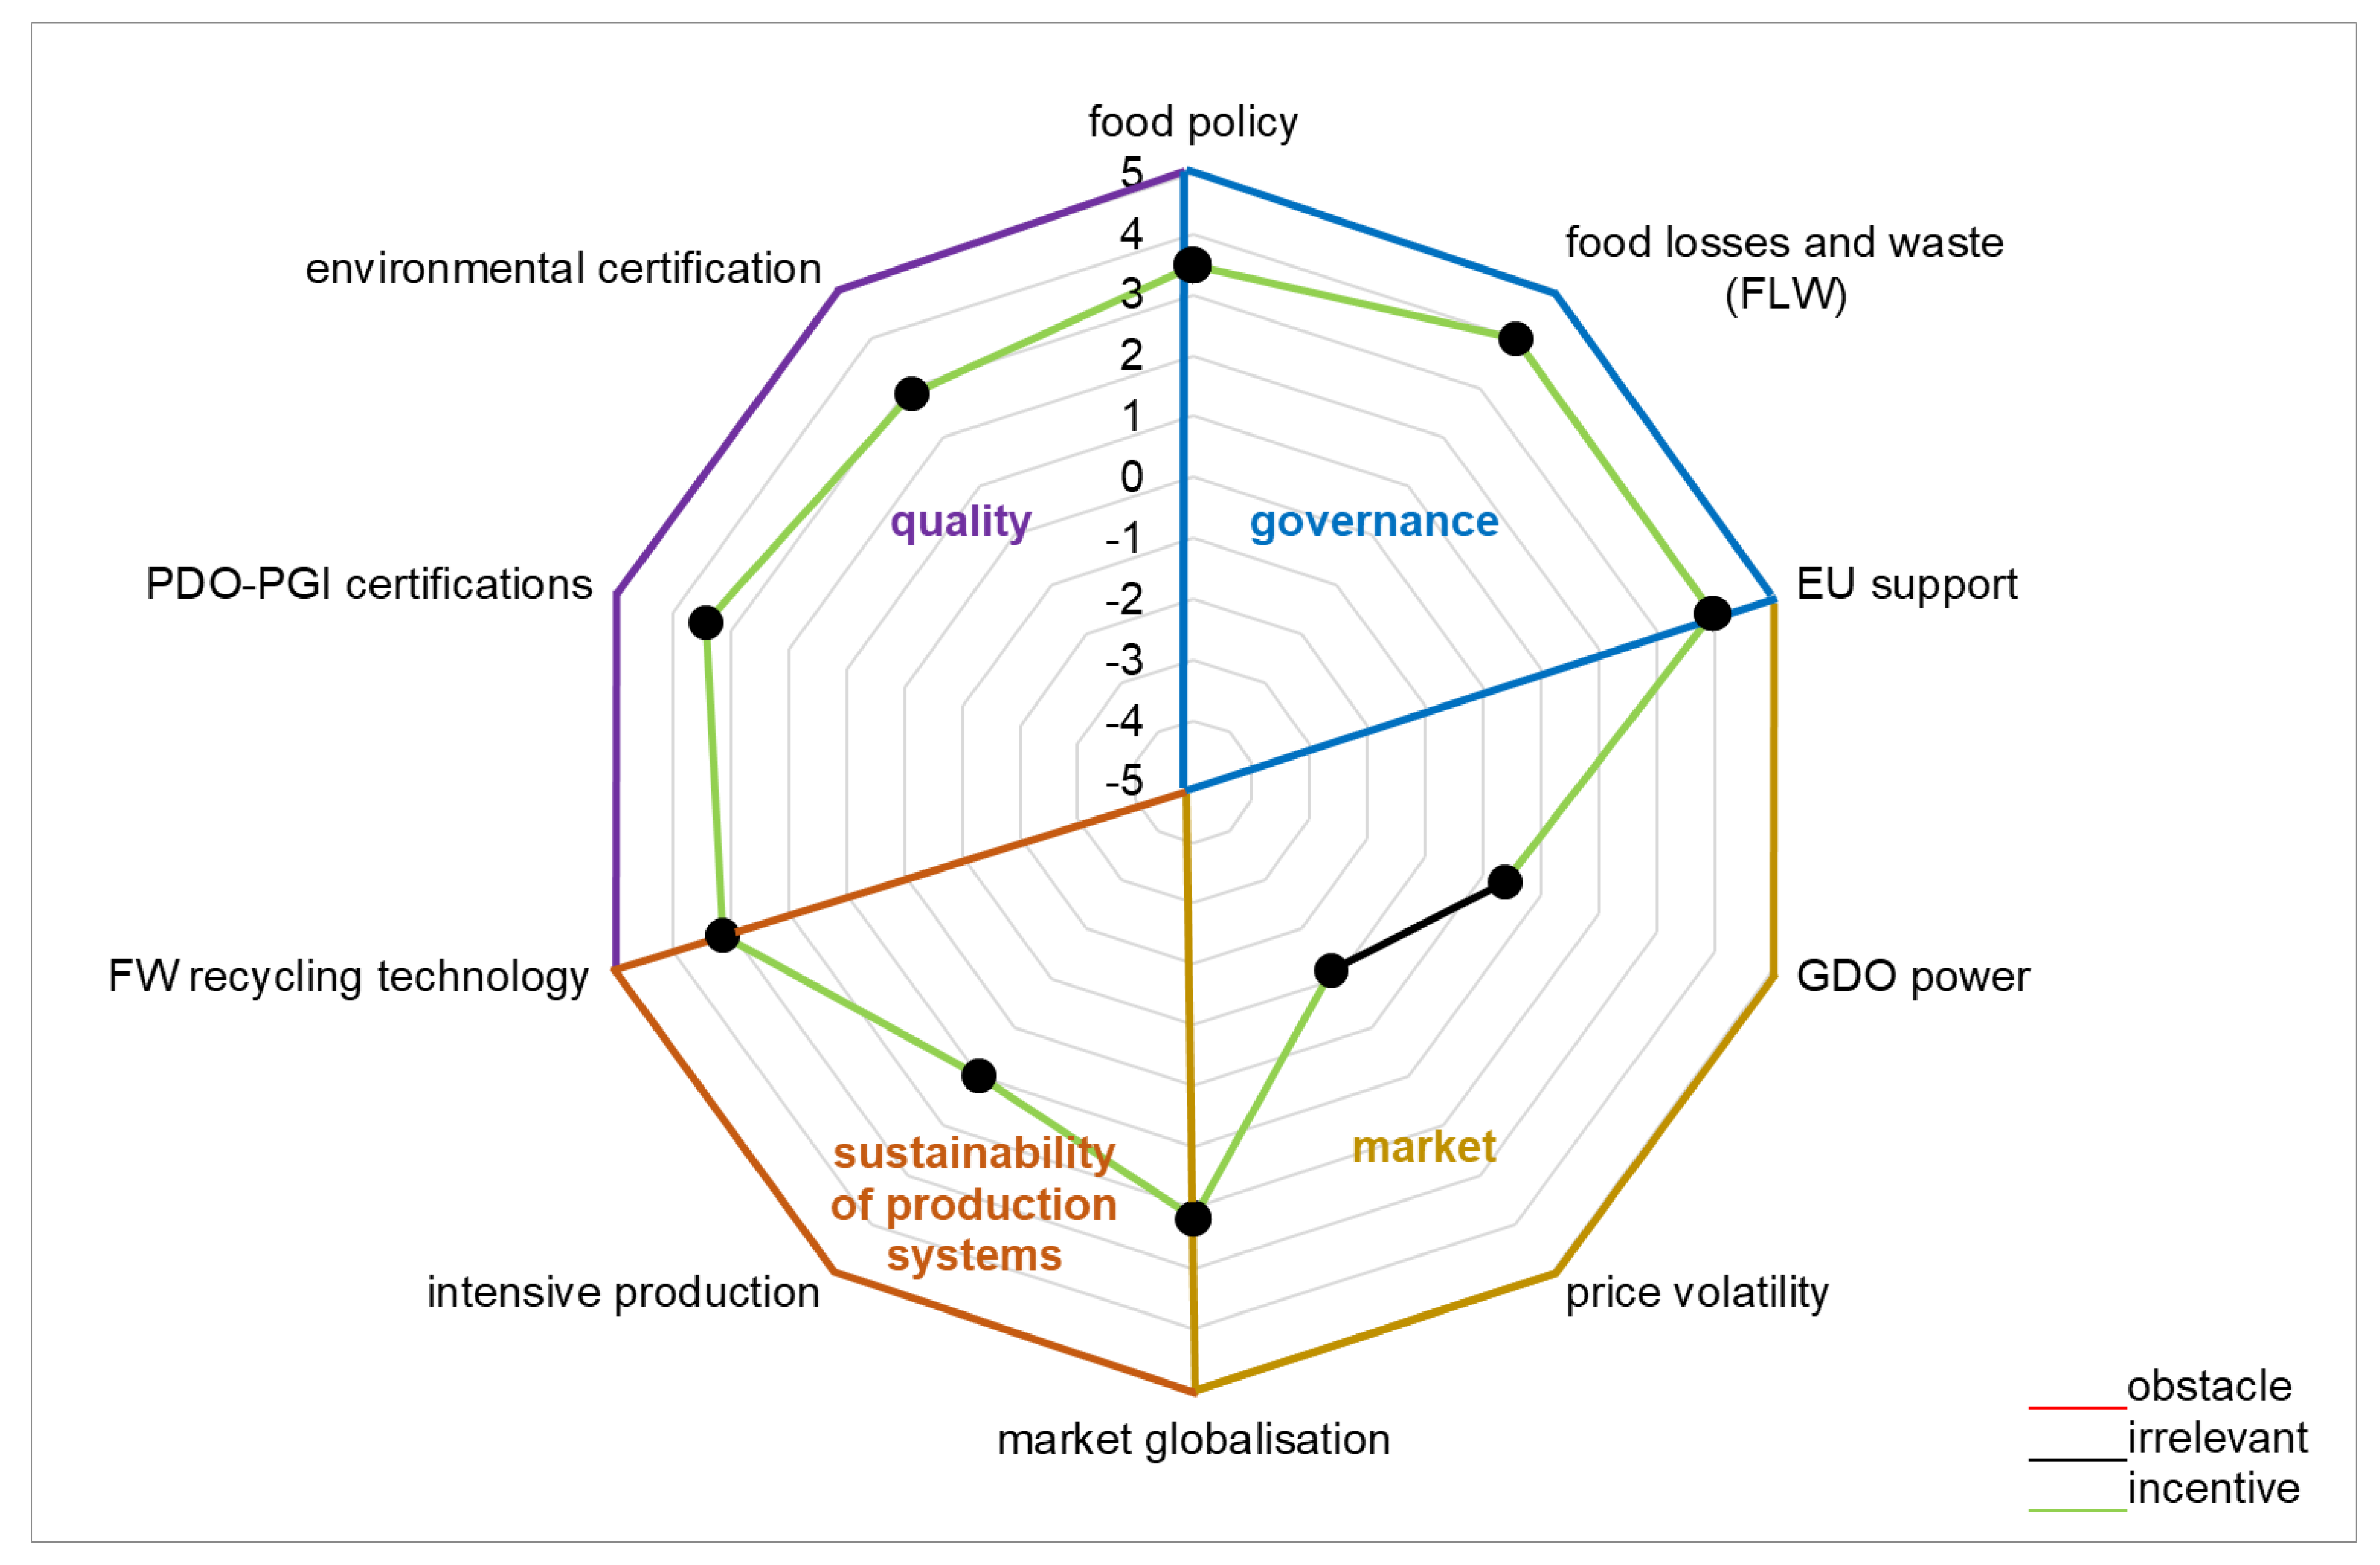
The second group of citizens, identified as cluster 2 and labelled as “Hedonists” (Figure 2), represents 36% of the sample. It includes mainly males with a high education level (university degree or postgraduate) and high-level annual income (more than 60,000 €/year). These citizens showed positive scores for the items within the “governance” macro-area: 3.2 for “food policy”, 3.3 for “food loss and waste (FLW)” and 2.8 for “EU support”; these items were thus considered drivers for achieving food security. As suggested by the literature, governance is a key component of sustainable food systems and a requirement for the development of food policies [60,61]. Moreover, the Hedonists showed negative scores in relation to the “market” macro-area. In particular, the “LSR power” score was −0.4, the “price volatility” score was −3.2 and the score for the “market globalisation” item was −2.8. Therefore, these citizens identified the “market” macro-area as a significant barrier to food security achievement. A further interesting point is related to the “quality” macro-area. In particular, the citizens of MCB assigned positive scores to the items “PDO–PGI certifications” and “environmental certification” (3.6 and 5, respectively). In this regard, quality certification schemes could reduce consumers’ concern for food security [62]. The labelling as “Hedonists” is due also to a negative score attributed to the item “intensive production” (−0.6) as well as to a positive score for “food waste recycling technology” (1.8) within the macro-area “sustainability of production systems”.
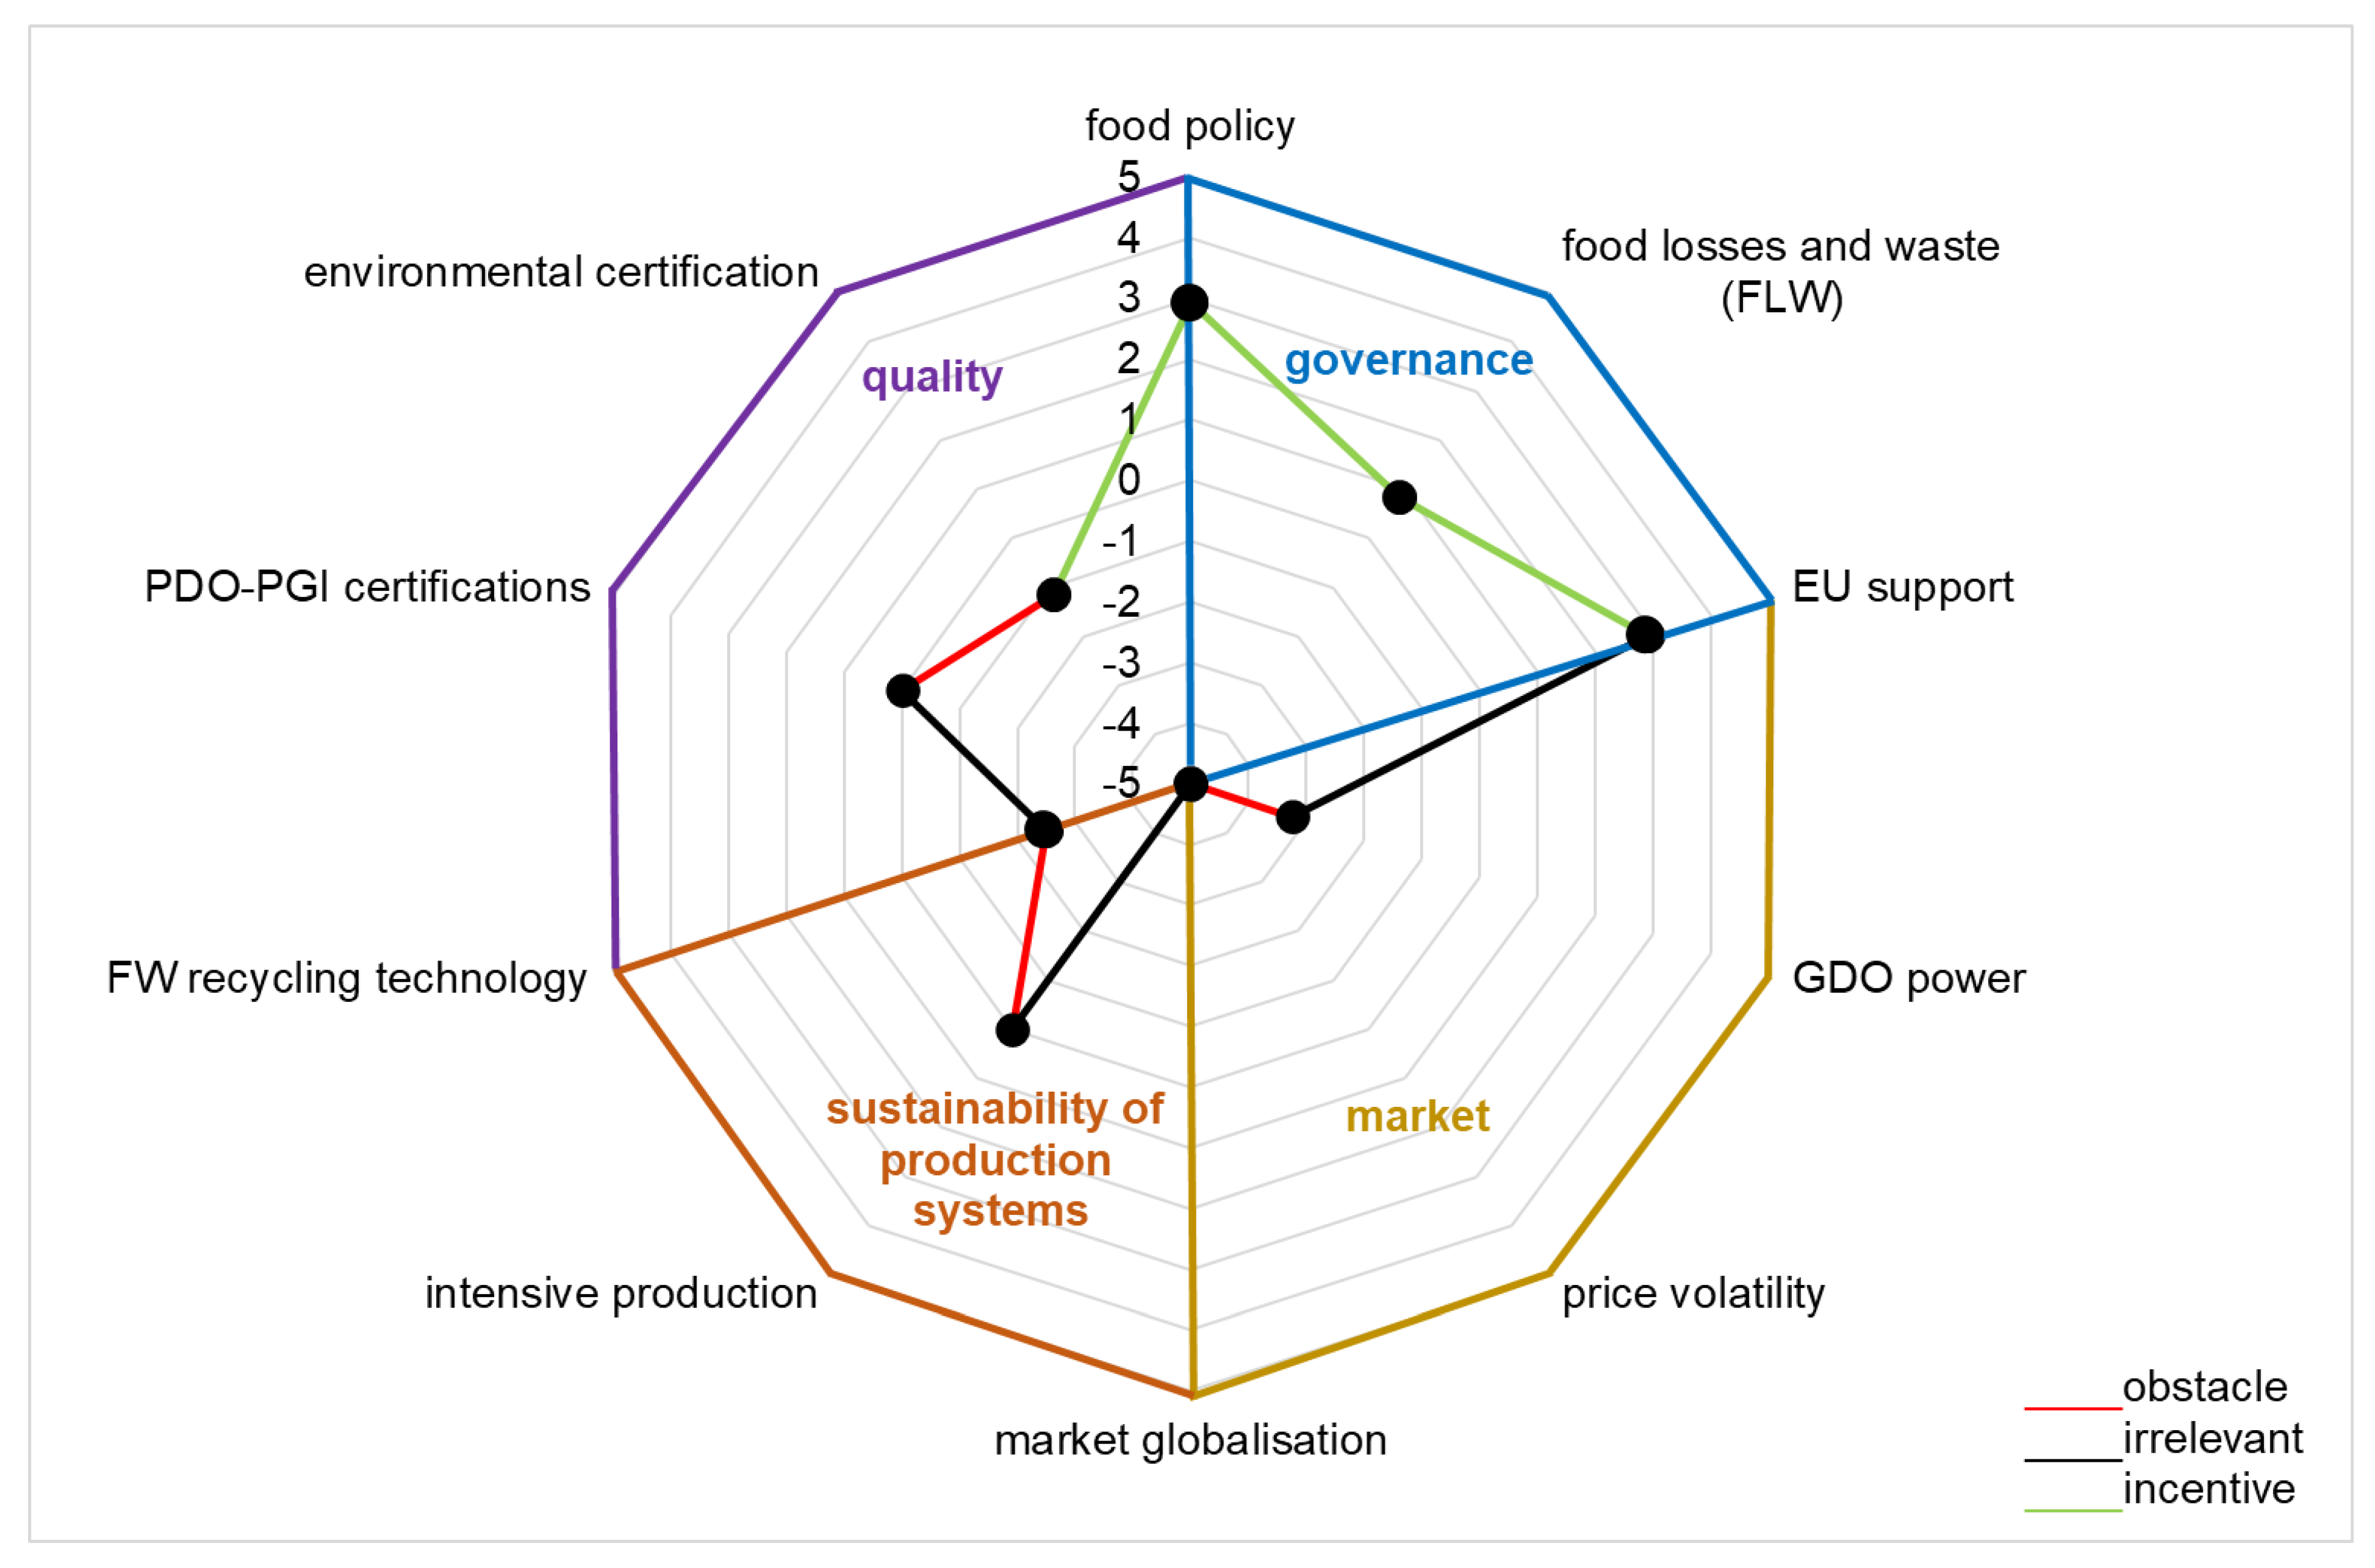
The third group of citizens, identified as cluster 3 and labelled as “Law-confidents” (Figure 3), represents 45% of the sample. It consists of males with an average level of education (high school). These citizens indicated that all the items belonging to the governance macro-area are strong drivers for achieving food security. In fact, the “food policy” score was 3.5, while the scores for both “food loss and waste (FLW)” and “EU support” were 4.0. According to the literature, efficient governance in urban areas can be achieved through the development of EU lighthouse projects focused on food policies and food security issues [63] and the implementation of approaches for sustainable management of biowastes [64]. Moreover, the “Law-confidents” indicated “intensive production” (score 1.1) and “food waste recycling technology” (score 3.2) as drivers to food security achievement. In this regard, some scholars suggested the bioprocessing of food by-products and wastes (FBPW) as a sustainable strategy for food loss and waste management [65]. Positive scores were also assigned to the “quality” macro-area, particularly to the items “PDO–PGI certifications” (3.4) and “environmental certification” (2.9), which are considered important elements for food security achievement.
The fourth group of citizens, identified as cluster 4 and labelled as “Conservatories” (Figure 4) represents 4% of the sample. They are mainly women with a low-to-medium annual income level (from 25,100 to 40,000 €/year). The items belonging to the “governance” macro-area are considered significant drivers for food security achievement: the score for “food policy” was 2.9, while the scores for “food loss and waste (FLW)” and “EU support” were 0.8 and 2.9, respectively. In this regard, urban food policies can represent a key factor in achieving food security in European cities [63]. In addition, strategies and initiatives carried out in EU cities may positively affect the “food waste behaviour” of citizens [66]. Conversely, MCB citizens attached an irrelevant score (0) to the items “intensive production” and “PDO–PGI certifications”; the irrelevance of PDO–PGI certifications may be linked to the contribution of food certification schemes in increasing food sale prices [62]. Moreover, “food waste recycling technology” (score −2.5) and “environmental certification” (score −1.2) are considered barriers to achieving food security. “Conservatories” also considered the market macro-area as an evident obstacle to food security, particularly regarding the item “price volatility” (−5).

4. Conclusions

Today more than ever, food security is undermined by severe events, such as the COVID-19 pandemic and the Ukrainian–Russian conflict. Cities are increasingly involved in the development of food policies, becoming key points in achieving food security and fostering the transition to sustainable agri-food systems. This study is a contribution to advancing knowledge of urban food policies. Four groups of citizens were clearly characterized, taking into account their perceptions of key factors affecting food security within four macro-areas (governance, market, quality and sustainability of production systems). The citizens belonging to the clusters “Hedonists”, “Law-confidents” and “Conservatories” highlighted that the “governance” macro-area is a key factor in achieving food security, while the “quality” macro-area is mainly a driver for achieving food security for citizens with a high level of income and education. On the other hand, citizens’ perceptions within all the four clusters showed that the “market” macro-area is an obstacle to food security achievement. These overall results may be a starting point for setting up tailored strategies in the framework of the food policy of the MCB.
In terms of practical implications, the proposed approach may support EU policy makers in identifying key macro-areas and items to direct public funding to improve food security in urban areas, and to put in place actions to improve citizens’ knowledge and awareness of key issues influencing food security. Indeed, this approach may be replicated to improve food security in metropolitan areas across Europe through a “ready-to-use” system of analysis tools.
However, this study is not free of some limitations. The main shortcoming is related to the length of the questionnaire, which required great interpretative effort by the citizens involved. In this regard, about 220 citizens considered a large number of items irrelevant, probably due to their limited involvement and/or interest in food security issues. Their exclusion from the final sample resulted in less involvement of citizens with low income (who are important beneficiaries of food policies), but at the same time this increased the robustness of the results.

Author Contributions

Conceptualization, R.R.; methodology, A.D.B. and R.R.; software, R.F., G.O.P. and R.R.; validation, R.R., G.O.P. and A.D.B.; formal analysis, R.F., G.O.P., A.D.B., C.A. and R.R.; investigation, R.F. and G.O.P.; data curation, R.F. and C.A.; writing—original draft preparation, R.F., G.O.P., A.D.B., C.A. and R.R.; writing—review and editing, G.O.P., A.D.B., C.A. and R.R.; visualization, C.A.; supervision, R.R.; funding acquisition, A.D.B. and R.R. All authors have read and agreed to the published version of the manuscript.

Funding

This research received no external funding.

Institutional Review Board Statement

Not applicable.

Informed Consent Statement

Not applicable.

Data Availability Statement

Not applicable.

Acknowledgments

Project funded under the National Recovery and Resilience Plan (NRRP), Mission 4 Component 2 Investment 1.3—Call for proposals No. 341 of 15 March 2022 of the Italian Ministry of University and Research, funded by the European Union—NextGenerationEU; Award Number: Project code PE00000003, Concession Decree No. 1550 of 11 October 2022, adopted by the Italian Ministry of Universities and Research, CUP D93C22000890001, project title “ON Foods—Research and innovation network on food and nutrition Sustainability, Safety and Security—Working ON Foods”.

Conflicts of Interest

The authors declare no conflict of interest.

References

  1. Alade, A.V.; Ureki, A.I.; Adekoya, C.O. Reflection on Possible Role of Academic Libraries in Facilitating Post-COVID-19 Food Security. IDD 2023. ahead-of-print. [Google Scholar] [CrossRef]
  2. Food and Agriculture Organization. Rome Declaration on World Food Security and World Food Summit Plan of Action: World Food Summit 13–17 November 1996, Rome, Italy; FAO: Rome, Italy, 1996; ISBN 92-5-103939-9. [Google Scholar]
  3. Kissoly, L.; Fasse, A.; Grote, U. Intensity of Commercialization and the Dimensions of Food Security: The Case of Smallholder Farmers in Rural Tanzania. J. Agribus. Dev. Emerg. Econ. 2020, 10, 731–750. [Google Scholar] [CrossRef]
  4. Ruiz-Almeida, A.; Rivera-Ferre, M.G. Internationally-Based Indicators to Measure Agri-Food Systems Sustainability Using Food Sovereignty as a Conceptual Framework. Food Sec. 2019, 11, 1321–1337. [Google Scholar] [CrossRef]
  5. Ingram, J. A Food Systems Approach to Researching Food Security and Its Interactions with Global Environmental Change. Food Sec. 2011, 3, 417–431. [Google Scholar] [CrossRef]
  6. FAO. The State of Food and Agriculture 2021. Making Agrifood Systems More Resilient to Shocks and Stresses; The State of Food and Agriculture (SOFA): Rome, Italy, 2021. [Google Scholar]
  7. Guo, J.; Mao, K.; Yuan, Z.; Qin, Z.; Xu, T.; Bateni, S.M.; Zhao, Y.; Ye, C. Global Food Security Assessment during 1961–2019. Sustainability 2021, 13, 14005. [Google Scholar] [CrossRef]
  8. Zollet, S.; Colombo, L.; De Meo, P.; Marino, D.; McGreevy, S.R.; McKeon, N.; Tarra, S. Towards Territorially Embedded, Equitable and Resilient Food Systems? Insights from Grassroots Responses to COVID-19 in Italy and the City Region of Rome. Sustainability 2021, 13, 2425. [Google Scholar] [CrossRef]
  9. Nasir, M.A.; Nugroho, A.D.; Lakner, Z. Impact of the Russian–Ukrainian Conflict on Global Food Crops. Foods 2022, 11, 2979. [Google Scholar] [CrossRef]
  10. Zhan, Y.; Chen, K.Z. Building Resilient Food System amidst COVID-19: Responses and Lessons from China. Agric. Syst. 2021, 190, 103102. [Google Scholar] [CrossRef]
  11. Boyacι-Gündüz, C.P.; Ibrahim, S.A.; Wei, O.C.; Galanakis, C.M. Transformation of the Food Sector: Security and Resilience during the COVID-19 Pandemic. Foods 2021, 10, 497. [Google Scholar] [CrossRef] [PubMed]
  12. Van der Ploeg, J.D. From Biomedical to Politico-Economic Crisis: The Food System in Times of COVID-19. J. Peasant Stud. 2020, 47, 944–972. [Google Scholar] [CrossRef]
  13. Sanderson Bellamy, A.; Furness, E.; Nicol, P.; Pitt, H.; Taherzadeh, A. Shaping More Resilient and Just Food Systems: Lessons from the COVID-19 Pandemic. Ambio 2021, 50, 782–793. [Google Scholar] [CrossRef] [PubMed]
  14. Shams Esfandabadi, Z.; Ranjbari, M.; Scagnelli, S.D. The Imbalance of Food and Biofuel Markets amid Ukraine-Russia Crisis: A Systems Thinking Perspective. Biofuel Res. J. 2022, 9, 1640–1647. [Google Scholar] [CrossRef]
  15. Feng, F.; Jia, N.; Lin, F. Quantifying the Impact of Russia–Ukraine Crisis on Food Security and Trade Pattern: Evidence from a Structural General Equilibrium Trade Model. CAER 2023, 15, 241–258. [Google Scholar] [CrossRef]
  16. FAO. Information Note—The Importance of Ukraine and the Russian Federation for Global Agricultural Markets and the Risks Associated with the War in Ukraine; FAO: Rome, Italy, 2022; p. 41. [Google Scholar]
  17. FAO. The State of Food Security and Nutrition in the World 2022; FAO: Rome, Italy, 2022; ISBN 978-92-5-136499-4. [Google Scholar]
  18. Marchetti, S.; Secondi, L. The Economic Perspective of Food Poverty and (In)Security: An Analytical Approach to Measuring and Estimation in Italy. Soc. Indic. Res. 2022, 162, 995–1020. [Google Scholar] [CrossRef] [PubMed]
  19. Fattibene, D.; Mazzocchi, G.; Antonelli, M.; Marino, D.; Romagnoli, L. Modelling Food Policies in Italian Urban Agendas in the Time of COVID-19: Experiences, Challenges and Opportunities. Cities 2023, 135, 104199. [Google Scholar] [CrossRef]
  20. Weerabahu, S.K.; Samaranayake, P.; Dasanayaka, S.W.S.; Wickramasinghe, C.N. Challenges of Agri-Food Supply in City Region Food Systems: An Emerging Economy Perspective. J. Agribus. Dev. Emerg. Econ. 2022, 12, 161–182. [Google Scholar] [CrossRef]
  21. Artioli, F.; Acuto, M.; McArthur, J. The Water-Energy-Food Nexus: An Integration Agenda and Implications for Urban Governance. Political Geogr. 2017, 61, 215–223. [Google Scholar] [CrossRef]
  22. Isaac, M.; Isakson, S.; Dale, B.; Levkoe, C.; Hargreaves, S.; Méndez, V.; Wittman, H.; Hammelman, C.; Langill, J.; Martin, A.; et al. Agroecology in Canada: Towards an Integration of Agroecological Practice, Movement, and Science. Sustainability 2018, 10, 3299. [Google Scholar] [CrossRef] [Green Version]
  23. Zasada, I.; Schmutz, U.; Wascher, D.; Kneafsey, M.; Corsi, S.; Mazzocchi, C.; Monaco, F.; Boyce, P.; Doernberg, A.; Sali, G.; et al. Food beyond the City—Analysing Foodsheds and Self-Sufficiency for Different Food System Scenarios in European Metropolitan Regions. City Cult. Soc. 2019, 16, 25–35. [Google Scholar] [CrossRef]
  24. Filippin, D.; Sarni, A.R.; Rizzo, G.; Baroni, L. Environmental Impact of Two Plant-Based, Isocaloric and Isoproteic Diets: The Vegan Diet vs. the Mediterranean Diet. Int. J. Environ. Res. Public Health 2023, 20, 3797. [Google Scholar] [CrossRef]
  25. Minotti, B.; Affinita, V.; Calori, A.; Federici, F. The Integration of Food Policies in a Local Administration System: The Case of the Milan Food Policy. Agroecol. Sustain. Food Syst. 2022, 46, 1087–1109. [Google Scholar] [CrossRef]
  26. Minotti, B.; Cimini, A.; D’Amico, G.; Marino, D.; Mazzocchi, G.; Tarra, S. Food Policy Processes in the City of Rome: A Perspective on Policy Integration and Governance Innovation. Front. Sustain. Food Syst. 2022, 5, 786799. [Google Scholar] [CrossRef]
  27. Cretella, A. Alternative Food and the Urban Institutional Agenda: Challenges and Insights from Pisa. J. Rural Stud. 2019, 69, 117–129. [Google Scholar] [CrossRef]
  28. Calafati, A. Cittt e Aree Metropolitane in Italia (Cities and Metropolitan Areas in Italy). SSRN J. 2013. [Google Scholar] [CrossRef]
  29. Milan Urban Food Policy Pact (MUFPP). Available online: https://www.milanurbanfoodpolicypact.org/ (accessed on 24 April 2023).
  30. Arcuri, S.; Minotti, B.; Galli, F. Food Policy Integration in Small Cities: The Case of Intermunicipal Governance in Lucca, Italy. J. Rural Stud. 2022, 89, 287–297. [Google Scholar] [CrossRef]
  31. Sibbing, L.V.; Candel, J.J.L. Realizing Urban Food Policy: A Discursive Institutionalist Analysis of Ede Municipality. Food Sec. 2021, 13, 571–582. [Google Scholar] [CrossRef]
  32. Mazzocchi, G.; Marino, D. Rome, a Policy without Politics: The Participatory Process for a Metropolitan Scale Food Policy. Int. J. Environ. Res. Public Health 2020, 17, 479. [Google Scholar] [CrossRef] [PubMed] [Green Version]
  33. FoodSHIFT 2030. Transforming the European Food System towards a Low Carbon, Circular and Plant-Based Future. 2016. Available online: https://foodshift2030.eu/ (accessed on 8 June 2023).
  34. The Manifesto for Sustainable Food Transition. Available online: https://www.ciba2030.it/ (accessed on 24 April 2023).
  35. Bimbo, F.; Viscecchia, R.; De Devitiis, B.; Seccia, A.; Roma, R.; De Boni, A. How Do Italian Consumers Value Sustainable Certifications on Fish?—An Explorative Analysis. Sustainability 2022, 14, 3654. [Google Scholar] [CrossRef]
  36. Mechlem, K. Food Security and the Right to Food in the Discourse of the United Nations. Eur. Law J. 2004, 10, 631–648. [Google Scholar] [CrossRef]
  37. Revilla, M.A.; Saris, W.E.; Krosnick, J.A. Choosing the Number of Categories in Agree–Disagree Scales. Sociol. Methods Res. 2014, 43, 73–97. [Google Scholar] [CrossRef]
  38. Robinson, M.A. Using Multi-Item Psychometric Scales for Research and Practice in Human Resource Management: Multi-Item Psychometric Scales. Hum. Resour. Manag. 2018, 57, 739–750. [Google Scholar] [CrossRef] [Green Version]
  39. Festing, M.; Knappert, L.; Kornau, A. Gender-Specific Preferences in Global Performance Management: An Empirical Study of Male and Female Managers in a Multinational Context. Hum. Resour. Manag. 2015, 54, 55–79. [Google Scholar] [CrossRef]
  40. Wilk-Woźniak, E.; Ligęza, S.; Shubert, E. Effect of Water Quality on Phytoplankton Structure in Oxbow Lakes under Anthropogenic and Non-Anthropogenic Impacts: Effect of Water Quality on Phytoplankton Structure in Oxbow Lakes. Clean Soil Air Water 2014, 42, 421–427. [Google Scholar] [CrossRef]
  41. Behera, P.P.; Singh, S.K.; Sivasankarreddy, K.; Majhi, P.K.; Reddy, B.J.; Singh, D.K. Yield Attributing Traits of High Zinc Rice (Oryza sativa L.) Genotypes with Special Reference to Principal Component Analysis. Environ. Conserv. J. 2022, 23, 458–470. [Google Scholar] [CrossRef]
  42. Lever, J.; Krzywinski, M.; Altman, N. Principal Component Analysis. Nat. Methods 2017, 14, 641–642. [Google Scholar] [CrossRef] [Green Version]
  43. Akbar, T.A.; Javed, A.; Ullah, S.; Ullah, W.; Pervez, A.; Akbar, R.A.; Javed, M.F.; Mohamed, A.; Mohamed, A.M. Principal Component Analysis (PCA)–Geographic Information System (GIS) Modeling for Groundwater and Associated Health Risks in Abbottabad, Pakistan. Sustainability 2022, 14, 14572. [Google Scholar] [CrossRef]
  44. Brejda, J.J.; Karlen, D.L.; Smith, J.L.; Allan, D.L. Identification of Regional Soil Quality Factors and Indicators II. Northern Mississippi Loess Hills and Palouse Prairie. Soil Sci. Soc. Am. J. 2000, 64, 2125–2135. [Google Scholar] [CrossRef] [Green Version]
  45. Yeomans, K.A.; Golder, P.A. The Guttman-Kaiser Criterion as a Predictor of the Number of Common Factors. Statistician 1982, 31, 221. [Google Scholar] [CrossRef]
  46. Jolliffe, I.T.; Cadima, J. Principal Component Analysis: A Review and Recent Developments. Phil. Trans. R. Soc. A 2016, 374, 20150202. [Google Scholar] [CrossRef] [PubMed] [Green Version]
  47. Ramette, A. Multivariate Analyses in Microbial Ecology: Multivariate Analyses in Microbial Ecology. FEMS Microbiol. Ecol. 2007, 62, 142–160. [Google Scholar] [CrossRef] [PubMed] [Green Version]
  48. Beane, T.P.; Ennis, D.M. Market Segmentation: A Review. Eur. J. Mark. 1987, 21, 20–42. [Google Scholar] [CrossRef]
  49. Han, J.; Pei, J.; Tong, H. Data Mining: Concepts and Techniques; Morgan Kaufmann: Burlington, MA, USA, 2022; ISBN 0-12-811761-3. [Google Scholar]
  50. Carvalho, M.J.; Melo-Gonçalves, P.; Teixeira, J.C.; Rocha, A. Regionalization of Europe Based on a K-Means Cluster Analysis of the Climate Change of Temperatures and Precipitation. Phys. Chem. Earth Parts A/B/C 2016, 94, 22–28. [Google Scholar] [CrossRef] [Green Version]
  51. Javadi, S.; Hashemy, S.M.; Mohammadi, K.; Howard, K.W.F.; Neshat, A. Classification of Aquifer Vulnerability Using K-Means Cluster Analysis. J. Hydrol. 2017, 549, 27–37. [Google Scholar] [CrossRef]
  52. Tleis, M.; Callieris, R.; Roma, R. Segmenting the Organic Food Market in Lebanon: An Application of k-Means Cluster Analysis. Br. Food J. 2017, 119, 1423–1441. [Google Scholar] [CrossRef]
  53. Weatherill, G.; Burton, P.W. Delineation of Shallow Seismic Source Zones Using K -Means Cluster Analysis, with Application to the Aegean Region. Geophys. J. Int. 2009, 176, 565–588. [Google Scholar] [CrossRef] [Green Version]
  54. Callieris, R.; Rocco, R.; BRAHIM, S. Different Consumer Behaviours for Organic Food in Tunisia. A Cluster Analysis Application. New Medit. 2016, 15, 53. [Google Scholar]
  55. Calori, A.; Dansero, E.; Pettenati, G.; Toldo, A. Urban Food Planning in Italian Cities: A Comparative Analysis of the Cases of Milan and Turin. Agroecol. Sustain. Food Syst. 2017, 41, 1026–1046. [Google Scholar] [CrossRef]
  56. Amolegbe, K.B.; Upton, J.; Bageant, E.; Blom, S. Food Price Volatility and Household Food Security: Evidence from Nigeria. Food Policy 2021, 102, 102061. [Google Scholar] [CrossRef]
  57. Mahmoud Sayed Agbo, H. Forecasting Agricultural Price Volatility of Some Export Crops in Egypt Using ARIMA/GARCH Model. Rev. Econ. Political Sci. 2023, 8, 123–133. [Google Scholar] [CrossRef]
  58. Duarte, G.V.; Ozaki, V.A. Pricing Crop Revenue Insurance Using Parametric Copulas. Rev. Bras. Econ. 2019, 73, 325–343. [Google Scholar] [CrossRef]
  59. Giller, K.E.; Delaune, T.; Silva, J.V.; Descheemaeker, K.; van de Ven, G.; Schut, A.G.T.; van Wijk, M.; Hammond, J.; Hochman, Z.; Taulya, G.; et al. The Future of Farming: Who Will Produce Our Food? Food Sec. 2021, 13, 1073–1099. [Google Scholar] [CrossRef]
  60. Boylan, S.; Sainsbury, E.; Thow, A.-M.; Degeling, C.; Craven, L.; Stellmach, D.; Gill, T.P.; Zhang, Y. A Healthy, Sustainable and Safe Food System: Examining the Perceptions and Role of the Australian Policy Actor Using a Delphi Survey. Public Health Nutr. 2019, 22, 2921–2930. [Google Scholar] [CrossRef] [PubMed]
  61. Del Valle, M.M.; Shields, K.; Alvarado Vázquez Mellado, A.S.; Boza, S. Food Governance for Better Access to Sustainable Diets: A Review. Front. Sustain. Food Syst. 2022, 6, 784264. [Google Scholar] [CrossRef]
  62. Tran, D.; Goto, D. Impacts of Sustainability Certification on Farm Income: Evidence from Small-Scale Specialty Green Tea Farmers in Vietnam. Food Policy 2019, 83, 70–82. [Google Scholar] [CrossRef]
  63. Martin, C.; Evans, J.; Karvonen, A.; Paskaleva, K.; Yang, D.; Linjordet, T. Smart-Sustainability: A New Urban Fix? Sustain. Cities Soc. 2019, 45, 640–648. [Google Scholar] [CrossRef]
  64. De Boni, A.; Melucci, F.M.; Acciani, C.; Roma, R. Community Composting: A Multidisciplinary Evaluation of an Inclusive, Participative, and Eco-Friendly Approach to Biowaste Management. Clean. Environ. Syst. 2022, 6, 100092. [Google Scholar] [CrossRef]
  65. Minervini, F.; Comitini, F.; De Boni, A.; Fiorino, G.M.; Rodrigues, F.; Tlais, A.Z.A.; Carafa, I.; De Angelis, M. Sustainable and Health-Protecting Food Ingredients from Bioprocessed Food by-Products and Wastes. Sustainability 2022, 14, 15283. [Google Scholar] [CrossRef]
  66. Mondéjar-Jiménez, J.-A.; Ferrari, G.; Secondi, L.; Principato, L. From the Table to Waste: An Exploratory Study on Behaviour towards Food Waste of Spanish and Italian Youths. J. Clean. Prod. 2016, 138, 8–18. [Google Scholar] [CrossRef]
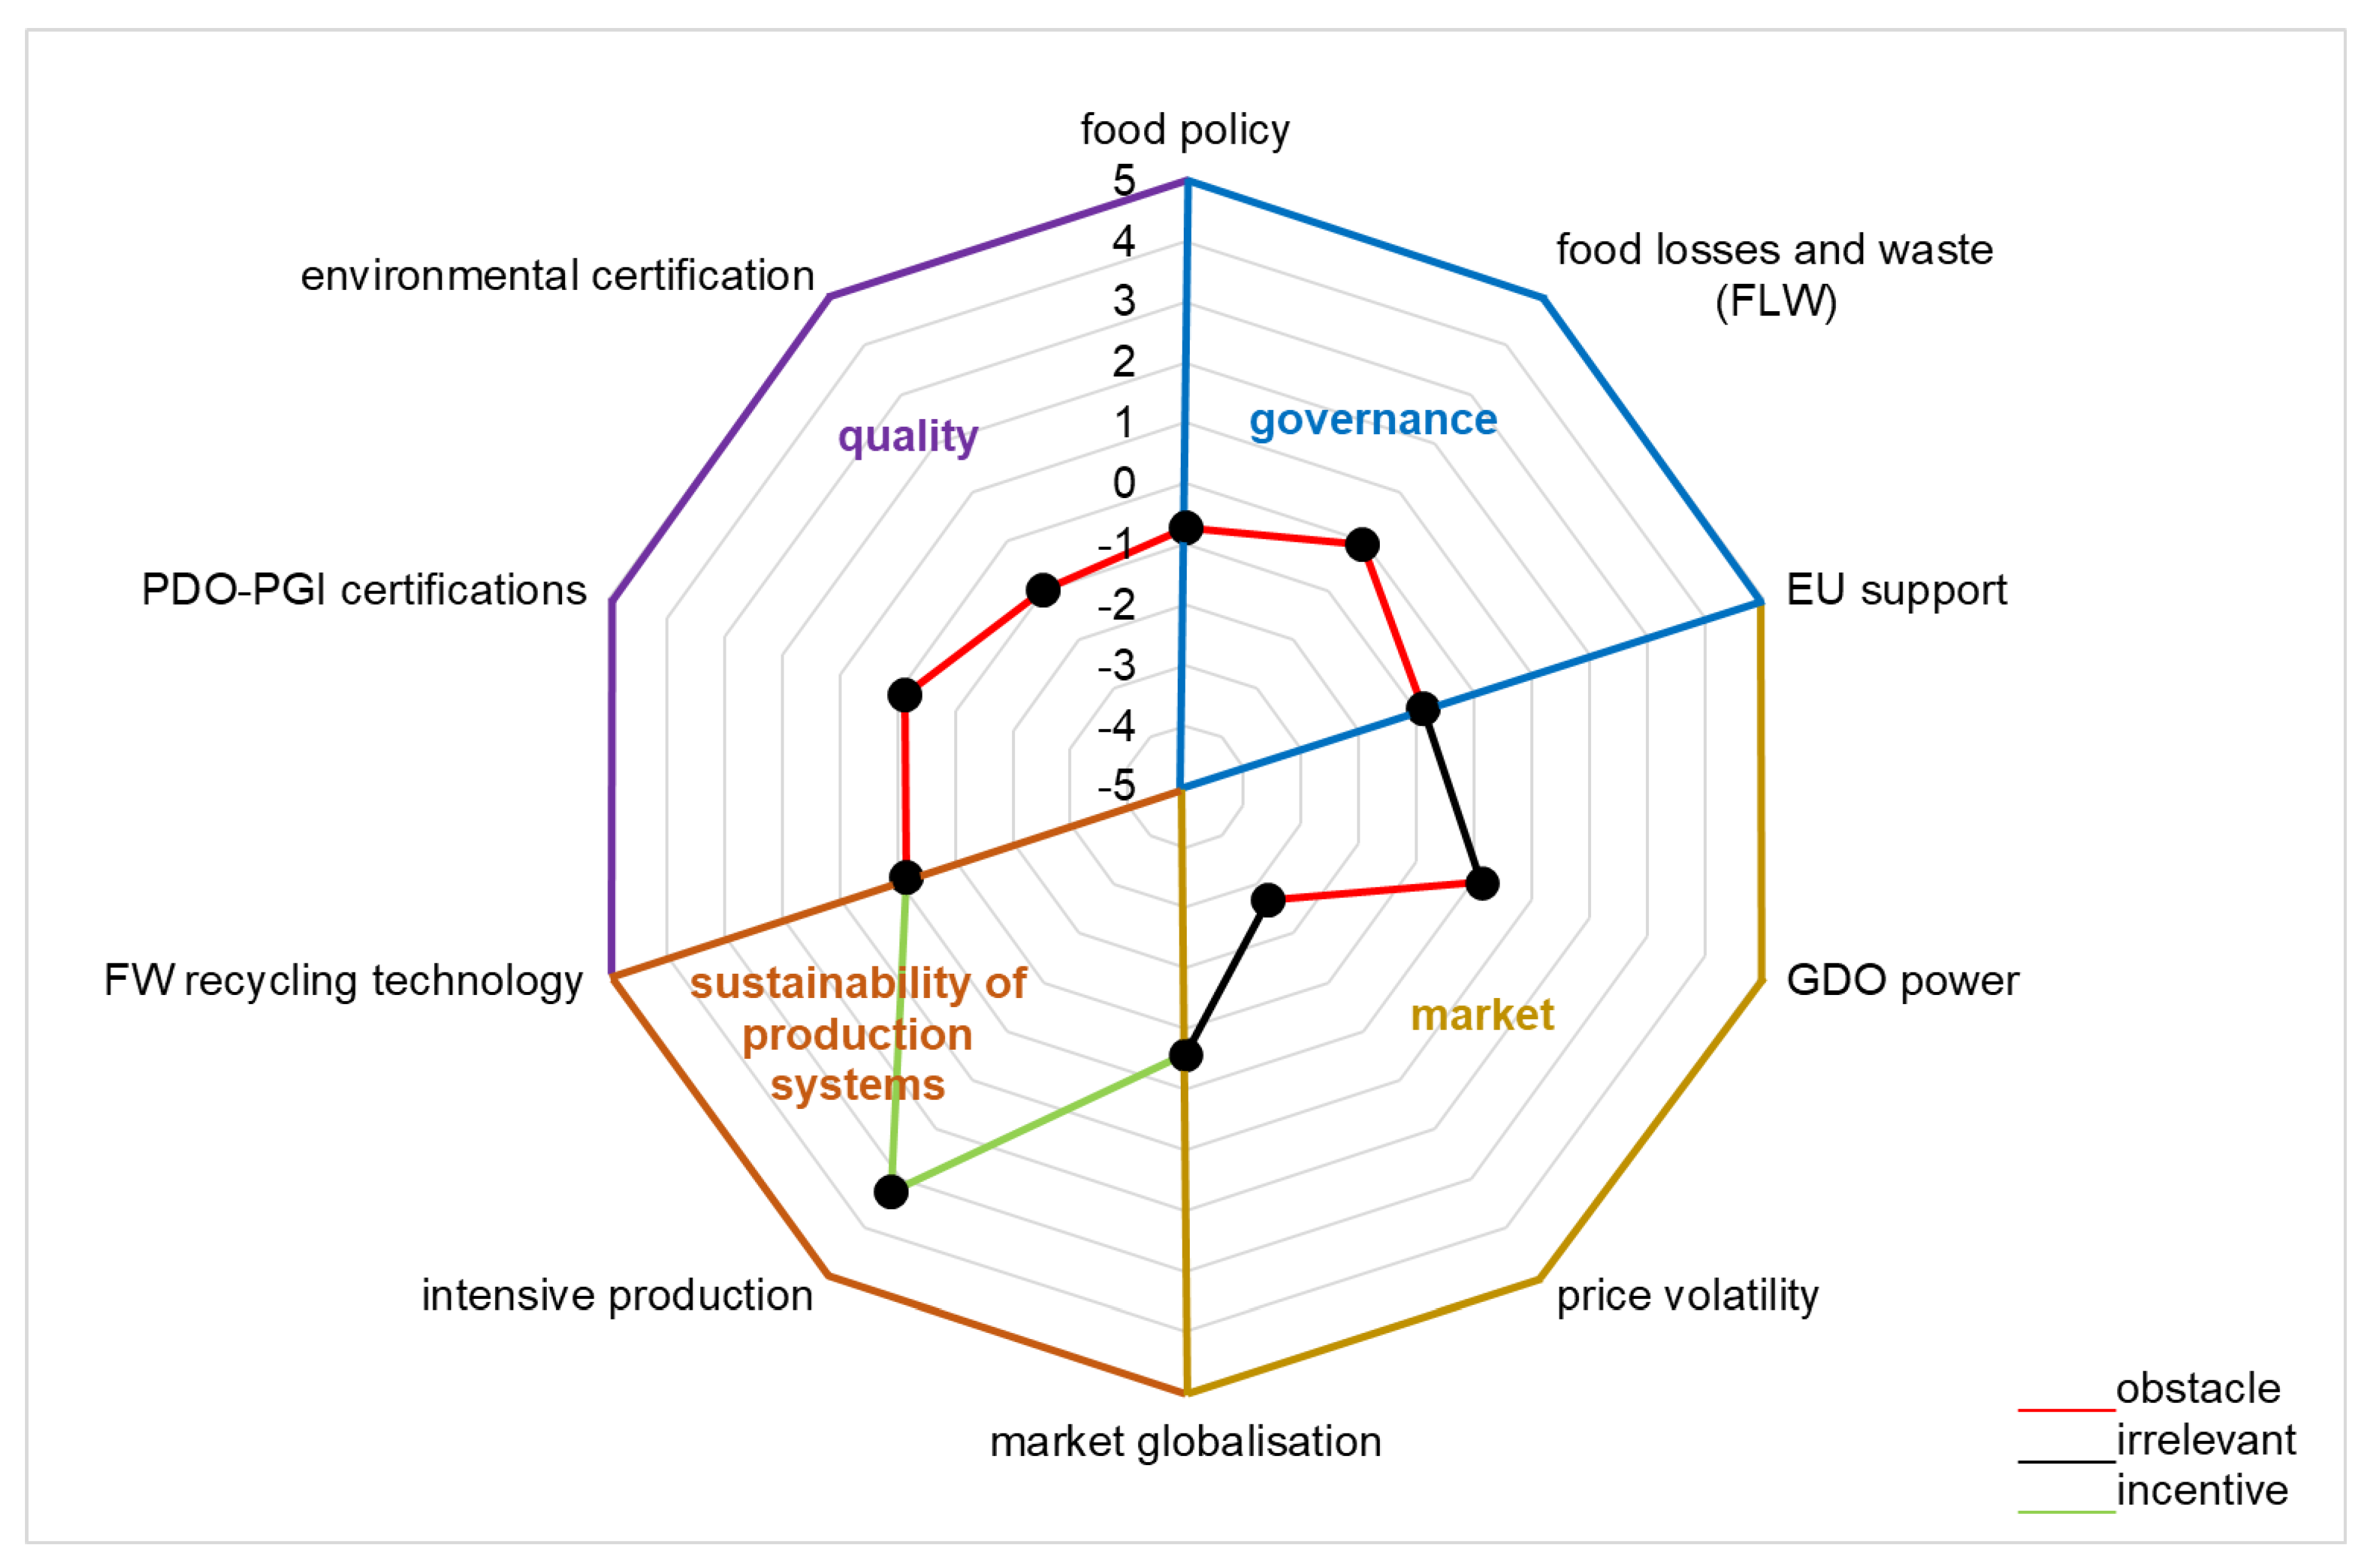
Figure 1. Radar chart showing the scores of the “Capitalists”.
Sustainability 15 09915 g001
Figure 2. Radar chart showing the scores of the “Hedonists”.
Sustainability 15 09915 g002
Figure 3. Radar chart showing the scores of the “Law-confidents”.
Sustainability 15 09915 g003
Figure 4. Radar chart showing the scores of the “Conservatories”.
Sustainability 15 09915 g004
Table 1. Distribution of the initial study sample.
Socio-Economic VariableFrequency (No.)Frequency (%)Cumulative Frequency (%)
genderMale3235454
Female2293892
No answer488100
Tot.600100
age (years)20–291352323
30–391803053
40–49821467
50–591101885
60–69851499
>7081100
Tot.600100
educationCompulsory school881515
High school2614458
University or postgraduate degree25142100
Tot.600100
incomeLess than 25,000 €/year1582626
From 25,100 to 40,000 €/year2714572
From 40,100 to 60,000 €/year1342294
More than 60,000 €/year376100
Tot.600100
employmentEmployee3826464
Worker771377
Unemployed14279
Freelancer751391
Student529100
Tot.600100
Table 2. Frequency (%) of the 46 items of the initial and final samples, taking into account the items’ role in achieving food security.
ItemFrequency
of the Initial Sample (%)
Frequency
of the Final Sample (%)
ObstacleIrrelevantIncentiveObstacleIrrelevantIncentive
agricultural diversification5.259.535.310.329.460.3
banking service22.329.748.021.328.050.7
blockchain5.744.050.35.520.673.9
BRC certification5.262.332.58.912.278.9
climate change9.536.254.367.45.527.1
cloud online34.549.715.85.020.474.6
community-supported agriculture (CSA)/farmers market6.053.240.86.914.978.2
consumer services6.559.733.88.912.278.9
corporate social responsibility3.542.054.514.47.877.8
credit assurance21.043.535.511.015.673.4
crop genome adaptation37.742.320.067.45.527.1
environmental certification5.520.574.05.319.075.7
EU support10.018.072.05.311.083.7
food banks7.341.051.75.311.283.5
food loss and waste (FLW)7.29.383.513.815.870.4
food policy6.25.488.56.25.888.0
food waste recycling technology12.515.572.07.619.073.4
LSR power46.510.543.047.08.544.5
generational handover28.830.740.512.415.472.2
governance22.539.238.312.411.975.7
green energy20.868.810.47.124.368.6
ICT services5.249.745.15.33.791.0
illegal hiring6.861.831.38.720.071.3
innovation transfer4.753.741.76.212.481.4
intensive production34.316.049.732.617.250.2
local varieties10.018.371.78.912.278.9
market globalisation51.78.240.251.66.741.7
nutrition label15.648.535.96.714.778.6
organic food21.734.344.021.812.665.6
PDO–PGI5.810.883.36.016.177.9
price volatility73.511.015.574.111.014.9
private labels6.053.240.812.225.262.6
protected land5.582.811.710.317.072.7
public support7.370.122.69.217.073.8
QR codes20.054.225.85.525.069.5
qualification of the workforce12.051.536.55.79.684.7
quality control7.255.237.68.07.884.2
quality diversification10.033.756.319.316.564.2
rating online12.249.038.819.031.949.1
research and development (R&D)15.363.321.44.612.483.0
risk management8.556.135.416.56.477.1
social certification12.043.045.06.717.975.4
stable supply chain13.251.135.720.911.967.2
traceability7.375.017.77.124.368.6
urban agriculture5.574.020.521.328.050.7
value-added20.532.247.310.313.576.2
Note: obstacle (total frequency of scores from −5 to −1); irrelevant (total frequency of scores equal to 0); incentive (total frequency of scores from 1 to 5).
Table 3. Total variance explained by the PCA.
Principal
Component (PC)
Initial Eigenvalues
TotalVariance (%)Cumulative (%)
PC-116.543.443.4
PC-22.66.850.2
PC-31.94.955.1
PC-41.64.259.3
PC-51.54.063.3
PC-61.43.663.8
PC-71.02.769.6
PC-81.02.672.2
Note: Extraction method: PCA.
Table 4. Component matrix showing factor loading.
VariablePC-1 (Governance)
food policy0.803
social certification0.751
illegal hiring0.667
VariablePC-2 (Market)
price volatility0.705
LSR power0.661
market globalisation0.582
VariablePC-3 (Quality)
environmental certification0.408
quality control0.381
PDO–PGI certifications0.300
VariablePC-4 (Sustainability of production systems)
food waste recycling technology0.516
intensive production0.452
food loss and waste (FLW)0.329
Notes: Extraction method: PCA. Factor loading (W|0.5|) with maximum score between variables and component.
Table 5. PCs and their distance from the final cluster centres.
PCCluster 1Cluster 2Cluster 3Cluster 4
PC-1 (Governance)−1.80.10.50.5
PC-2 (Market)0.6−0.70.4−0.7
PC-3 (Quality)−0.10.6−0.2−2.8
PC-4 (Sustainability of production systems)0.0−0.40.5−2.9
Table 6. Profiling of citizens according to each cluster (average scores).
VariableClusters
CapitalistsHedonistsLaw-ConfidentsConservatories
Governance macro-area
food policy−0.73.23.52.9
food loss and waste (FLW)−0.13.34.00.8
EU support−0.92.84.02.9
Market macro-area
LSR power0.1−0.40.4−3.3
price volatility−2.7−3.2−1.2−5.0
market globalisation−0.6−2.82.2−5.0
Sustainability of production systems macro-area
intensive production3.3−0.61.10.0
food waste recycling technology−0.11.83.2−2.5
Quality macro-area
PDO–PGI certifications−0.13.63.40.0
environmental certification−1.05.02.9−1.2
cluster size (%)1536454
Disclaimer/Publisher’s Note: The statements, opinions and data contained in all publications are solely those of the individual author(s) and contributor(s) and not of MDPI and/or the editor(s). MDPI and/or the editor(s) disclaim responsibility for any injury to people or property resulting from any ideas, methods, instructions or products referred to in the content.