Abstract
This paper theoretically analyzes the bilateral mechanism of ESG responsibility fulfillment on green innovation of industrial enterprises and decomposes the promotion effect, inhibition effect and the net effect of mutual influence of ESG responsibility fulfillment on green innovation of Chinese industrial enterprises based on the data of 615 industrial enterprises in China from 2012 to 2021, and it analyzes the regular characteristics of them using bilateral stochastic frontier model. The study shows that (1) ESG responsibility fulfillment can drive green innovation in industrial enterprises. The interaction between the facilitation effect (24.49%) and the inhibiting effect (20.71%) of ESG responsibility fulfillment in industrial enterprises eventually leads to the actual green innovation level being higher than the frontier green innovation level by 3.78%. (2) The driving effect of ESG responsibility on green innovation of industrial enterprises has room for growth; the driving effect of ESG on green innovation gradually increases and turns from negative to positive with the improvement of ESG performance; and the net effect of ESG responsibility on the level of green innovation of industrial enterprises from 2012 to 2020 shows a continuous growth. (3) The driving effect of industrial enterprises’ ESG responsibility fulfillment on green innovation is the highest in the western region, followed by the eastern region, and it is the lowest in the central region. (4) Compared with industrial enterprises in regions with high managerial short-sightedness, non-heavy pollution and low marketization, the driving effect of ESG responsibility fulfillment on green innovation of industrial enterprises in regions with low managerial short-sightedness, heavy pollution and high marketization is stronger.
1. Introduction
In order to address climate change, China has put forward solemn goals and commitments, such as “carbon dioxide emissions strive to peak before 2030 and strive to achieve carbon neutrality before 2060” [1,2]. Green technology innovation and clean energy use have become the key to promoting the green transformation, upgrading the economic structure and achieving the synergistic development of the environment, economy and society. Industry is in a leading position in the national economy and has a pivotal influence on the level of innovation and economic development in China, which requires industrial enterprises to play a major role in enhancing green technology innovation. Environmental, social and governance (ESG) is derived from responsible investment and emphasizes that companies should consider ESG in their operations. ESG is essentially a sustainable concept, which further extends corporate social responsibility (CSR). The CSRC issued the Guidelines on Investor Relations Management for Listed Companies in April 2022, which included ESG information disclosure for the first time, implying that domestic listed companies have accelerated the process of standardized information disclosure. Given the enormous energy consumption and pollution emissions caused by industrial companies in the process of producing and manufacturing products, the focus of ESG responsibility for industrial companies falls mainly on improving the environmental and social performance. Industrial companies’ ESG responsibility fulfillment makes a catalytic difference to corporate green innovation. On the one hand, based on the stakeholder theory and resource-based theory, industrial enterprises’ fulfillment of ESG responsibilities can meet stakeholders’ demands and strengthen their communication links with stakeholders, thus providing scarce resources for corporate green innovation, such as innovative talents, the funds required for R&D, etc. [3,4,5]. On the other hand, from the connotation of ESG, industrial enterprises can enhance both environmental and social performance through green innovation, which coincides with the fulfillment of ESG responsibilities by industrial enterprises [6]. Based on the cost–benefit theory, industrial companies find that the benefits of undertaking environmental responsibility are higher than social responsibility and corporate governance responsibility; when the costs are the same, then they are more willing to perform green R&D activities when they fulfill their ESG responsibilities, thus promoting green innovation. At the same time, the fulfillment of ESG responsibilities by industrial enterprises has a dampening effect on corporate green innovation on the one hand; due to the characteristics of high pollution and high energy loss, green innovation requires more resources than general innovation activities, and under the condition of certain funds, enterprises have to take into account the environment, society and corporate governance when fulfilling ESG responsibilities, and the allocation of resources will inevitably crowd out green innovation funds [5]. On the other hand, due to the existence of the principal–agent problem, industrial enterprises will provide opportunities for executives to make personal gains when performing ESG fulfillment, which will take away the funds for green R&D, thus affecting the performance of green innovation of enterprises [7,8,9,10].
In summary, the role of ESG responsibility fulfillment of industrial enterprises in green innovation is manifested in both positive and negative cases; therefore, what are the mechanisms that generate these two effects? What impact does the fulfillment of ESG responsibilities in both roles ultimately have on green innovation in industrial companies? Based on this, this paper analyzes the mechanism of the effect of ESG responsibility fulfillment of industrial enterprises on green innovation from the viewpoint of the stakeholder theory, signaling theory, resource dependence theory, resource allocation theory and principal–agent theory; selects the data of Chinese listed industrial enterprises in Shanghai and Shenzhen A-shares from 2011 to 2021 as research samples; adopts bilateral stochastic frontier model to investigate the bilateral effect of ESG responsibility fulfillment of industrial enterprises on green innovation; decomposes the promotion effect, inhibition effect and net effect size of mutual influence of ESG responsibility fulfillment on green innovation of industrial enterprises; and analyzes its regular characteristics. The possible contributions of this paper are as follows: (1) The existing literature examines the influence of ESG responsibility on green innovation by focusing only on the unilateral effects, ignoring the bilateral effects, and paying little attention to industrial firms [5,9,10]. This paper not only analyzes theoretically the mechanism of the impact of ESG responsibility fulfillment on green innovation in industrial enterprises, but it also further investigates empirically the promotional and inhibitory effects of ESG responsibility fulfillment in industrial companies, expanding the relevant research field. (2) The existing literature has not yet measured in detail the two effects of ESG on green innovation in industrial enterprises [3,4]. Based on decomposing the promotion and compensation effects of ESG on green innovation of industrial enterprises with bilateral stochastic frontier model, this paper measures the net effect of their mutual influence, so as to identify the net effect of ESG responsibility fulfillment of industrial enterprises on green innovation and enrich the related research in terms of research methods. (3) The results of this paper’s analysis of the regular characteristics of industrial enterprises’ ESG responsibility fulfillment affecting green innovation provide some insights into how enterprises and governments can realize ESG-fulfillment-driven green innovation.
2. Theoretical Background and Hypotheses
2.1. Promotion Effect of Industrial Enterprises’ ESG Responsibility Fulfillment on Green Innovation
The industrial companies’ implementation of ESG responsibility has a catalytic impact on green innovation through the following mechanisms:
(1) Accessing capital. Industrial companies engage in R&D activities, which consume large amounts of resources and require a stable source of cash flow to ensure the success of their green innovation [11,12]. The stakeholder theory considers all groups affected by organizational decisions, including shareholders, owners, customers, the public and the natural environment, as stakeholders of the enterprise. Industrial enterprises are prone to pollution emissions, safety accidents, employee health damage and relative disorder in governance in the process of achieving business goals [13,14,15]. Therefore, active ESG responsibility by industrial companies helps them build closer ties with a wide range of stakeholder groups and thus obtain R&D funding at a lower cost in an interactive exchange [16,17]. The fulfillment of ESG responsibilities by industrial companies has an impact on corporate access to capital mainly through financing and operating profits. In terms of financing, the benefits of ESG compliance of industrial enterprises are mainly reflected in three aspects. Firstly, based on the signaling theory, industrial enterprises with good ESG compliance send positive signals to the stock market, indicating that the enterprise actively undertakes environmental, social and corporate governance responsibilities in the long-term interests, thus boosting investors’ confidence and gaining market value premiums [18,19]; secondly, the ESG responsibility of industrial enterprises is a legal act, which can strengthen the political association of enterprises and thus obtain government support in terms of financing, such as granting subsidies, tax incentives and opening green channels for credit, which can help broaden the external financing channels of enterprises [20,21,22,23]; thirdly, the industrial companies’ fulfillment of ESG responsibility reflects the concept of long-term sustainable development, which coincides with equity investors’ focus on the future growth of enterprises, thus giving industrial companies an advantage in equity financing [24,25]. In terms of operating profit, ESG compliance by industrial companies can add value to existing businesses [26,27,28]. ESG responsibility helps companies build their social reputation, and reputation as a unique intangible resource helps companies build a competitive advantage, which leads to improved financial performance and excess profits [29,30]. At the same time, the ESG responsibility of industrial companies will focus on and protect the interests of stakeholders upstream and downstream of the supply chain, which not only makes the company’s transaction costs lower but also attracts more partners [31,32,33,34].
(2) Attracting talent. Based on the resource dependence theory, industrial enterprises need not only abundant capital investment for green innovation but also a large number of R&D talents. R&D talent is a scarce resource for corporate innovation and can play a key role. The ESG responsibility of industrial companies is inevitably focused on employee benefits, such as career prospects, physical and mental health, working environment, long-term benefits, etc. These make the company very competitive in the talent market, not only in easily attracting quality talent to join, but also in reducing employee turnover, significantly improving the stability of the development process and the success rate of R&D activities [35,36].
(3) Embracing failure. Green innovation, as a special innovation activity, is more obviously characterized by high risk and time consumption [37]. ESG responsibility fulfillment in industrial companies not only enhances employees’ sense of security, but the external stakeholders are also more patient based on their expectation of future prospects and will therefore tolerate failures in green innovation activities, thus enhancing the corporate innovation climate and ultimately promoting green innovation [38,39,40].
Based on this, this paper proposes Hypothesis H1: Industrial enterprises’ fulfillment of ESG responsibility has a facilitation effect on green innovation by acquiring funds, attracting talent and accommodating failure, i.e., there is a promotional effect of industrial enterprises’ fulfillment of ESG responsibility on green innovation.
2.2. The Inhibition Effect of Industrial Enterprises’ ESG Responsibility Fulfillment on Green Innovation
The industrial firms’ fulfillment of ESG responsibility can have a disincentivizing influence on green innovation, with the mechanism of action being mainly the crowding out of funds. Due to the characteristics of industrial enterprises with high pollution and high energy loss, their green innovation requires more resources than general innovation activities.
Based on the resource allocation theory, when enterprises have limited capital, they have to take into account the environmental, social and corporate governance aspects to fulfill their ESG responsibilities, which will crowd out the R&D capital for green innovation and thus have a dampening effect on their green innovation [41]. Delegated agency problems and excessive responsibility can increase the cost of fulfilling ESG responsibilities for industrial firms, which in turn enhances this disincentive. The principal–agent theory assumes that the owners of a firm seek to maximize profits, while the managers seek personal compensation and reputation, which can lead to managers seeking personal gain and engaging in internal conflict. When industrial companies carry out green innovation activities, they often choose to reduce the information disclosure of relevant activities and increase information asymmetry in order to prevent imitation by competitors and ensure first-mover advantage [13]. Not all stakeholders are beneficiaries of corporate ESG responsibility, and in the case of information asymmetry, managers may use company resources for personal gain, thus increasing the cost of ESG responsibility implementation. Executives spend capital unnecessarily on ESG activities to meet their own needs or preferences or those of the board of directors, such as maintaining personal reputation, gaining social status, etc., increasing costs [42,43,44]. Further, if ESG activities are understood as on-the-job spending, then managers will all increase ESG expenses to the detriment of the company in order to benefit from them. For industrial companies in regions with high political affiliation or governmental directives, the phenomenon of “coercion” to fulfill ESG responsibilities may occur, and managers may take unreasonable ESG decisions and excessive responsibilities in order to strengthen such political affiliation or to meet governmental demands, which will inevitably tie up corporate capital significantly [45,46,47].
Based on this, this paper proposes Hypothesis H2: Industrial enterprises’ fulfillment of ESG responsibility has an inhibition effect on green innovation through crowding out funds, i.e., there is a suppressive effect of industrial enterprises’ fulfillment of ESG responsibility on green innovation.
According to the above analysis, the implementation of ESG responsibility by industrial enterprises has both positive and negative effects on green innovation, i.e., there are both promoting and inhibiting effects, and the net effect is positive or negative depending on the contrast of the two effects (Figure 1).
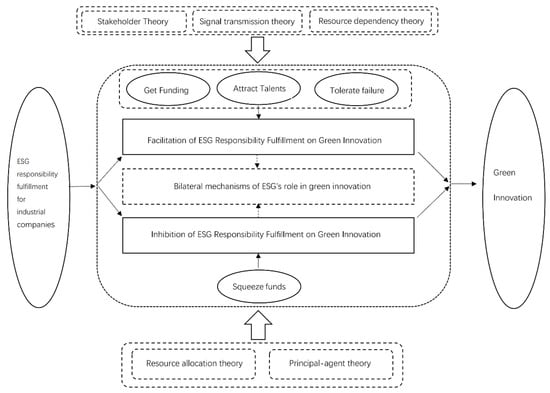
Figure 1.
Theoretical framework of ESG responsibility fulfillment and green innovation in industrial companies.
3. Methods
3.1. Bilateral Stochastic Frontier Model Setting
From the previous theoretical analysis, it is found that the ESG responsibility fulfillment of industrial enterprises has both promoting and inhibiting effects on green innovation, i.e., the impact of ESG responsibility fulfillment of industrial enterprises on green innovation is bilateral. In contrast to traditional estimation methods, the bilateral stochastic frontier model proposed by Kumbhakar and Parmeter (2009) [48] can identify both these positive and negative effects and their net effects. Accordingly, this paper identifies the impact of industrial firms’ ESG responsibility fulfillment on green innovation based on a bilateral stochastic frontier model. The decomposition model of corporate green innovation is
where c() denotes the level of green innovation of firms under perfectly competitive market conditions when individual firm characteristics are given, i.e., the level of green innovation of frontier firms. is the individual characteristics of the sample firms, including other factors, such as firm size, gearing ratio, cash flow ratio, operating income growth rate, nature of ownership and firm age. δ is the parameter vector to be estimated. The composite residual term consists of three components. is the disturbance term of the random residual term, reflecting the deviation of the ESG responsibility fulfillment of industrial firms from the innovation level of frontier firms due to unobservable factors; indicates the promotional effect of ESG responsibility fulfillment on green innovation of industrial companies ≥ 0; indicates the disincentivizing effect of ESG responsibility fulfillment on green innovation in industrial firms ≥ 0. When = 0, green innovation is only influenced by the inhibitory effect of ESG responsibility fulfillment of industrial enterprises; when = 0, green innovation is only influenced by the facilitative effect of ESG responsibility fulfillment of industrial enterprises. When either of the above is the case, the model is a one-sided stochastic frontier model; meanwhile, when and are both 0, the model is a general multiple regression model. From model (1), it can be seen that the actual green innovation level of industrial companies is ultimately the result of the bilateral effect of the facilitating and inhibiting effects generated by ESG responsibility fulfillment, and the deviation of the actual green innovation level of companies can be measured by calculating the net effect of the joint impact of these two positive and negative effects.
In order to measure both effects of the δ-parameter vector and ESG compliance of industrial firms on green innovation, this paper uses the maximum likelihood estimation (MLE) to estimate the model (1). Kumbhakar and Lovell (2000) [49] found that the disturbance terms and adopt different distribution assumptions, which have no substantial effect on the estimation results, so this paper assumes that both obey the exponential distribution of the simplest form, i.e., , . Assume that the random disturbance term follows a normal distribution, i.e., Additionally, this paper assumes that the disturbance terms are independent of each other and of the individual characteristics of the firm . On the basis of the above assumptions, the probability density function of the composite residual term can be further derived as Equation (2).
where Φ(•) and φ(•) represent the cumulative distribution function and the probability density function of the standard normal distribution, respectively, and the other parameters are set as follows:
For a sample containing n observations, the log-likelihood function can be expressed as Equation (4):
where π = [β,,,]. The maximum likelihood estimated values of all parameters are obtained by maximizing the log-likelihood function. In addition, it is necessary to derive the conditional density functions of and .
Using Equations (5) and (6) above as a basis, the conditional expectations of and can be further estimated as Equations (7) and (8), respectively:
Further, the conditional expectations based on and can be estimated to obtain the absolute degree of deviation from the frontier green innovation level of industrial firms facing facilitative and inhibitory effects. The following Equations (9) and (10) are used to convert the absolute degree values to the percentage of ESG responsibility fulfillment promoting and inhibiting effects above or below the frontier level, as follows:
Further derive the net effect of the facilitative and inhibitory effects of industrial firms in fulfilling their ESG responsibilities in influencing green innovation:
3.2. Data Description
This paper selects the data of industrial enterprises listed in Shanghai and Shenzhen A-shares from 2012 to 2021 in China as the research sample, and the ESG data and other data used are obtained from Wind database, CSMAR database and State Intellectual Property Office, and the following treatments are applied to the sample data: (1) exclude companies with missing data; (2) exclude companies with special treatment status; (3) exclude companies listed in the current year. A final valid sample of 615 firms was obtained, and 11 years of balanced panel data were used for parameter estimation. Drawing on the method of Martínez et al. (2023) [50], the total amount of current R&D capital investment and the total number of current R&D personnel were used as the measures of R&D capital (lnCapital) and R&D personnel (lnLabor), respectively, and they were processed by adding 1 to take the natural logarithm. Since the quality of patent applications varies significantly among enterprises, Song and Han (2022) [51] used the number of green patents granted to enterprises to measure their R&D output level (lnGrPat), and considering that R&D activities need a certain amount of time, this paper takes the number of green patents granted to enterprises in the latter period as a measure of green innovation output and performs a natural logarithm processing by adding 1. The core explanatory variables are ESG performance (ESG), derived from the CSI ESG score in the Wind database, which is assigned to companies on a scale of “1 to 9”, from low to high, according to the “C to AAA scale” of the CSI ESG evaluation system. Corporate characteristics include company size (Size), expressed as the natural logarithm of total assets at the end of the period; gearing ratio (Lev), expressed as total liabilities as a percentage of period-end total assets; cash flow ratio (Cashflow), expressed as net cash flow from operations as a percentage of total assets; operating income growth rate (Grow), expressed as the proportion of operating income in the current and previous periods to operating income in the previous period; corporate nature (Soe): 1 for state-owned enterprises, 0 otherwise; company age (Firmage), expressed as the number of years of company establishment plus 1, taking the natural logarithm; likewise, external factors of the company, such as year, industry and regional characteristics, also have an effect on green innovation of industrial companies. The results of descriptive statistics are shown in Table 1.

Table 1.
Descriptive statistics of variables.
4. Analysis of Empirical Results
4.1. Bilateral Stochastic Frontier Model Estimation
4.1.1. Analysis of the Factors Influencing Green Innovation in Industrial Companies
The estimation results for model (1) are shown in Table 2. Column (1) in Table 2 is estimated using the least squares method, and columns (2) to (5) are all estimated using the MLE under bilateral stochastic frontier. Columns (3) and (4) consider the inhibitory and facilitative effects of ESG responsibility fulfillment of industrial enterprises, respectively, and column (5) considers both the inhibitory and facilitative effects of ESG responsibility fulfillment. The regression results in Table 2 show that the corresponding effect value is 0.004 when only the inhibitory effect of ESG responsibility fulfillment is considered and 0.021 when only the facilitative effect is considered, and the results are still significant when both the positive and negative effects of ESG responsibility fulfillment on green innovation of industrial enterprises are considered. Thus, it can be seen that ESG responsibility fulfillment of industrial companies has a significant promoting effect and inhibiting effect on green innovation. By comparing the log-likelihood ratios and log-likelihood values of each column, this paper will conduct a follow-up study based on the variables and measures in column (5).
Table 2.
Bilateral stochastic frontier model regression results.
4.1.2. Variance Decomposition: Measurement of the Promotion and Inhibition Effects of ESG Responsibility Fulfillment on Green Innovation in Industrial Enterprises
The results of the analysis of the innovation effect of ESG responsibility fulfillment are shown in Table 3. The measured coefficient of inhibition effect of ESG responsibility fulfillment on green innovation by industrial enterprises is 0.6976, and for the facilitation and inhibition effects, the measured coefficient of the promotion effect is 0.8516, which results in (ω − u) = = −0.154. The net effect indicates that the positive impact of ESG compliance by industrial companies on green innovation exceeds the negative impact. Meanwhile, the total variance of the unexplained part of corporate green innovation is 1.2707. By comparing the weight of the effect of bilateral effects, it is clear that ESG responsibility fulfillment explains 95.37% of the total variance that fails to be explained, which shows that ESG responsibility fulfillment has an important impact on green innovation in industrial firms. Among them, the proportions of the inhibitory effect and promotional effect of ESG responsibility fulfillment are 40.15% and 59.85%, respectively. The variance decomposition results show that, overall, the promotion effect of ESG responsibility fulfillment of industrial enterprises dominates, which makes the level of green innovation positively deviate from the level of frontier green innovation.
Table 3.
Variance decomposition: promotion and inhibition effects of ESG responsibility fulfillment of industrial enterprises.
4.1.3. The Extent of the Promotion and Inhibition Effects of ESG Responsibility Fulfillment of Industrial Enterprises on Green Innovation
In this section, Equations (9)–(11) are estimated to calculate the extent to which the facilitative and inhibitory effects of ESG responsibility fulfillment of industrial firms on the level of green innovation deviate from the level of frontier green innovation. The percentage of green innovation deviation from the frontier green innovation level by the inhibitory and facilitative effects of ESG responsibility fulfillment is first measured, and then, the final net effect of the two effects is calculated. The estimation results in Table 4 show that, on average, the promotion effect of ESG responsibility fulfillment of industrial enterprises makes the actual green innovation level higher than the frontier green innovation level by 24.49%, and the suppression effect of ESG responsibility fulfillment makes the actual green innovation level lower than the frontier green innovation level by 20.71%, and the interaction of the two effects finally leads to the industrial enterprises’ green innovation level being higher than the frontier green innovation level by 3.78%.
Table 4.
Estimated effects of the promotion and inhibition effects of ESG responsibility fulfillment of industrial firms on financial performance.
Columns 4 to 6 of Table 4 also report in detail the proportional distribution characteristics of the inhibitory and facilitative effects of ESG responsibility fulfillment and the net effect of both under different ESG performances of industrial firms. Specifically, from the first quartile of the statistics, it can be found that the net effect of the inhibitory and facilitative effects of ESG responsibility fulfillment leads to a 7.94% decrease in the actual level of green innovation for 1/4of the firms. This section of the companies may be influenced by the short-sightedness of managers, who are psychologically and behaviorally resistant to improving the performance of ESG responsibility fulfillment, which eventually leads to perfunctory ESG actions not only squeezing part of the original funds used for R&D but also failing to obtain compensation benefits in the end, which ultimately leads to the decline of the level of green innovation of companies. The actual green innovation level of another 1/4 of the enterprises is higher than the frontier green innovation level by 14.42%. These enterprises fulfill their ESG responsibilities well and are influenced by the nature of pollution in the industry and the degree of marketization in the region they are located in, which, on the one hand, significantly improves their social reputation through good ESG performance, attracting excellent talents; on the other hand, they can alleviate financing constraints, provide financial security for their own innovation activities, retain talent, stimulate innovation and thus enhance the level of green innovation.
Overall, the net effect of industrial enterprises’ ESG responsibility fulfillment on green innovation gradually increases with the improvement of ESG performance and turns from negative to positive, switching the net effect from inhibiting to promoting. This indicates that ESG responsibility fulfillment of industrial enterprises can drive green innovation, but a small proportion of industrial enterprises have poor ESG performance and fail to reap the dividends.
Figure 2, Figure 3 and Figure 4 show the distribution characteristics of the promotion, suppression and net effects of ESG responsibility on green innovation by industrial enterprises. From Figure 2 and Figure 3, it can be seen that the distributions of both the promoting and inhibiting effects of ESG compliance on green innovation show a right trailing feature, which indicates that only a small proportion of industrial enterprises’ green innovation is more sensitive to the fluctuation of ESG compliance. It is noteworthy that the impact of the inhibitory effect of ESG responsibility fulfillment disappears at around 82%; however, the impact of the promotion effect of ESG responsibility fulfillment still trails at 100%, which indicates that the promotion effect of ESG responsibility fulfillment of industrial enterprises has a greater impact on green innovation. The distribution characteristics of the net effect of ESG responsibility fulfillment in Figure 4 show that the net effect of the interaction of the inhibitory and facilitative effects of ESG responsibility fulfillment is significantly greater than zero. Statistical analysis shows that the net effect of ESG compliance on approximately more than 57% of the industrial enterprises in the sample is greater than zero, indicating that these enterprises effectively fulfill their ESG responsibilities and that the benefits derived from the significant resources invested by enterprises in ESG compliance feed into their green innovation activities. This also implies that no more than 43% of industrial enterprises fulfilling ESG responsibilities inhibit corporate green innovation. Figure 2, Figure 3 and Figure 4 show that the ESG compliance of Chinese industrial companies in general promotes the level of green innovation.
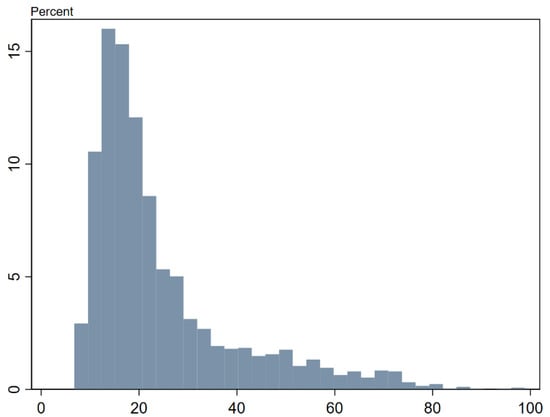
Figure 2.
Distribution of the promotion effect of ESG responsibility fulfillment of industrial enterprises.
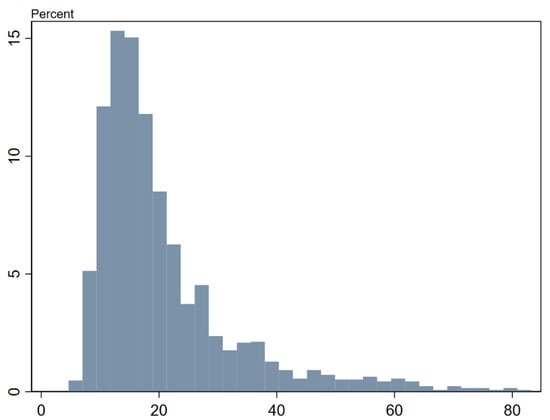
Figure 3.
Distribution of inhibition effects of ESG responsibility fulfillment of industrial enterprises.

Figure 4.
Distribution of the net effect of ESG responsibility fulfillment of industrial enterprises.
4.2. Temporal Characteristics of the Promotion and Inhibition Effects of ESG Responsibility Fulfillment in Industrial Enterprises
In order to analyze the temporal characteristics of industrial firms’ ESG responsibility fulfillment affecting green innovation and to enhance the robustness of the estimated conclusions, the annual effects of ESG responsibility fulfillment affecting green innovation of industrial firms are decomposed. Table 5 shows the trend of the temporal distribution of the net effect of ESG responsibility fulfillment. According to the estimation results in Table 5, it can be seen that the net effect of the interaction between the inhibitory and promotional effects of industrial enterprises’ fulfillment of ESG responsibility is positive in the sample years and is distributed between 2.71% and 4.90%, i.e., the promotional effect of industrial enterprises’ fulfillment of ESG responsibility exceeds the inhibitory effect. Overall, the net effect of industrial companies’ fulfillment of ESG responsibility on the impact of corporate green innovation level shows a continuous increase between 2012 and 2020, i.e., the growth of the promoting effect achieved by industrial enterprises fulfilling ESG responsibility gradually expands compared with the inhibiting effect, which, at the same time, indicates that there is more room for growth of industrial enterprises’ fulfillment of ESG responsibility to drive green innovation.
Table 5.
Characteristics of the annual distribution of the net effect of ESG responsibility fulfillment on the impact of green innovation in industrial enterprises.
4.3. Regional Characteristics of the Promotion and Inhibition Effects of ESG Responsibility Fulfillment by Industrial Enterprises
Considering the differences in resource endowment and marketization degree among provinces in China, the regional characteristics of industrial enterprises’ fulfillment of ESG responsibility affecting green innovation were further analyzed. Drawing on Huang et al. (2023) [52], the provinces were divided into three regions—East, Central and West—for separate studies. As shown in Table 6, the net effect of ESG responsibility fulfillment by industrial enterprises in all three regions is positive, which indicates that industrial enterprises in all three regions can drive green innovation by fulfilling ESG responsibility. In terms of the magnitude of the effect in different regions, the region with the largest contribution to green innovation from the fulfillment of ESG responsibilities by industrial enterprises is the western region, followed by the eastern region and the central region. The explanations for this regional difference are the following. (1) Most of the heavily polluting industrial enterprises are concentrated in the western region, and since their production and operation cannot be separated from the high input and consumption of energy and resources, the fulfillment of ESG responsibility indicates that their focus on environmental performance and green transformation will be more likely to be favored by stakeholders, and the difficulty of internal and external financing will be significantly reduced, so that they can more easily obtain funds for green innovation. (2) The policy advantage and marketization degree in the eastern region are higher than those in the central region, and enterprises can obtain advantages from both cost and benefit perspectives in fulfilling ESG responsibility. On the one hand, the strong financial strength of governments in the eastern region can effectively support local industrial enterprises in fulfilling their ESG responsibilities through strong government subsidies, loan support and tax breaks, which can alleviate the R&D costs for enterprises to a certain extent; on the other hand, the high degree of marketization in the eastern region can make industrial enterprises’ ESG responsibilities be responded to by the market quickly and effectively, which can increase their social reputation, attract outstanding talents and alleviate market financing constraints, thus obtaining scarce resources for innovation.
Table 6.
Characteristics of the regional distribution of the net effect of ESG responsibility fulfillment of industrial enterprises on the impact of green innovation.
4.4. Further Tests of the Impact of Managerial Short-Sightedness, the Nature of Industry Pollution and the Degree of Marketization
From the analysis of the differences in the spatial and temporal characteristics of the promoting and inhibiting effects of ESG responsibility fulfillment by industrial firms in the previous Section 2 and Section 3, it is clear that the role of ESG responsibility fulfillment in green innovation by industrial firms is supposed to be influenced by factors such as executive myopia, the nature of pollution in the industry in which they are located and the degree of regional marketization. In order to further clarify whether executive myopia, the nature of pollution in the industry and the degree of marketization really play a role in the chain of industrial enterprises’ ESG responsibility fulfillment affecting green innovation, the latter paper further examines the differential impact of industrial firms’ ESG responsibility fulfillment on green innovation in terms of managerial short-termism, the nature of industry pollution and differences in the degree of marketization.
4.4.1. Managerial Short-Sightedness
Managers have a decisive influence on the business development of the company through the development of corporate strategy. Managers’ characteristics influence their strategic choices and leadership behaviors, which in turn affect the process and results of the company in achieving its business goals, including the company’s green innovation activities [53]. Managers who focus only on immediate interests and ignore the future development of the company will be short-sighted. Corporate ESG responsibility is based on a long-term vision, and this will obviously be resisted by short-sighted managers. This will eventually lead to two phenomena: first, short-sighted managers will win and lead to companies not paying attention to ESG responsibility, and poor ESG performance will be punished by stakeholders, resulting in financing difficulties and brain drain; second, short-sighted managers will be forced to compromise on ESG actions due to internal and external pressures, and they will not be effectively compensated for the squeezed R&D funds due to inadequate implementation, ultimately reducing green innovation performance. Hu et al. (2021) [54] combined text analysis and machine learning to propose a new textual metric for measuring managers’ short-sightedness and determined that the final word set contained 43 “short-term horizons”. Referring to their method, this paper measures managers’ short-termism by multiplying the ratio of the total word frequency of “short-term perspective” to the total word frequency of management discussion and analysis (MD&A) in the annual reports of listed companies by 100, and it divides the results into high and low groups. The results of the group regression are shown in Table 7.
Table 7.
The effect of ESG responsibility fulfillment on green innovation in industrial firms: managerial myopia.
The mean value of the group shows that the fulfillment of ESG responsibility by industrial enterprises with low managerial myopia makes the level of green innovation higher than the level of frontier green innovation by 4.18%; and the fulfillment of ESG responsibility by industrial enterprises with high managerial myopia makes the level of green innovation higher than the level of frontier green innovation by 3.39%; and the mean value of both groups is positive, and the difference is 0.79%. Thus, although the promotion effect of ESG responsibility fulfillment on green innovation in industrial firms dominates regardless of the high or low degree of managerial short-sightedness, the promotion effect of ESG responsibility fulfillment on green innovation in industrial firms with high degree of managerial short-sightedness is significantly weakened by the interaction of the promotion and suppression effects of ESG responsibility fulfillment.
4.4.2. Industry Pollution Nature
With the importance of environmental protection coming to the fore, strengthening ecological civilization and balancing ecological construction and economic development have gradually become the focus of the government’s work. As heavy polluters cause direct or indirect damage to the environment and ecology, they will face stricter regulation and environmental control. Environmental moral risks and regulatory costs put the survival and development of polluting enterprises in crisis, so that they will be more proactive in implementing environmental strategies and green transformation. ESG, as a new sustainable development concept, can reflect the environmental, social and corporate governance performance of a company in an integrated manner. The positive impact of heavy polluters’ ESG responsibility on green innovation is obvious. Improving the ESG performance of heavy polluters means that they reduce harm to the natural environment, reduce safety accidents, etc. This not only concerns the life and health of the public, but it also fits perfectly with the general policy of the country, which will undoubtedly increase the goodwill of stakeholders and gain the recognition of the market, government and consumers, etc., thus helping enterprises obtain funds and talents and positively impacting corporate green innovation. To summarize, the ESG performance of heavy polluters has a more significant promotion effect on green innovation. To verify the reliability, the industrial enterprises whose industry codes are C15, C17, C18, C19, C22, C25, C26, C27, C28, C29, C31, C32, D44, D45 are defined as heavily polluting enterprises, and the rest are non-heavily-polluting enterprises, according to the 2012 revised Industry Classification Guidelines for Listed Companies, and the grouping regression results are shown in Table 8.
Table 8.
The effect of ESG responsibility fulfillment of industrial enterprises on green innovation: the nature of industry pollution.
The mean value of the group shows that the ESG responsibility fulfillment of industrial enterprises in the non-heavily-polluting group makes the green innovation level higher than the frontier green innovation level by 2.99%, and the ESG responsibility fulfillment of industrial enterprises in the heavily polluting group makes the green innovation higher than the frontier green innovation level by 4.57%, and the mean value of the two groups is positive, and the difference is 1.58%. It can be seen that although the promotion effect of ESG responsibility fulfillment on green innovation is dominant for both heavily polluting industrial enterprises and non-heavily-polluting industrial enterprises, the promotion effect of ESG responsibility fulfillment on green innovation is greater for heavily polluting industrial enterprises under the interaction of the promotion and inhibition effects of ESG responsibility fulfillment.
4.4.3. Degree of Marketization
The level of marketization directly reflects the degree of regulation of the business growth environment in the region, which indirectly has an influence on corporate green innovation. Regions with a high degree of marketization are characterized by less government intervention, mature product factor markets, a well-developed legal system and multiple financing channels.
On the one hand, the market is highly concerned about every move of the enterprise, and once the business style and value concept of the enterprise meet the requirements of the stakeholders, it will quickly receive a positive response from the market and quickly establish social reputation and gain moral capital. Moreover, a high degree of marketization can inhibit corporate disclosure falsification, which will enhance stakeholders’ positive response to positive information on corporate ESG performance, thus broadening the financing channels for corporate R&D, attracting top talents and increasing their legitimacy. On the other hand, a high degree of marketization indicates that the government has low allocation power over scarce resources and relatively abundant financial resources, so that enterprises can independently control the scale of ESG decision making without having to bear excessive social responsibilities and inefficient expenditures to maintain the relationship between government and enterprises, and they can receive government support in terms of subsidies and tax incentives for their legitimate behaviors, which reduces the cost of engaging in green innovation activities to a certain extent. To sum up, the fulfillment of ESG responsibility by industrial enterprises in high-market-oriented regions has a greater role in promoting green innovation. To verify the reliability, this paper uses the marketability index data [55] to equate them into two groups, high and low, and the regression results are shown in Table 9.
Table 9.
The effect of ESG responsibility fulfillment of industrial enterprises on green innovation: the degree of marketization.
The mean value of the group shows that the ESG responsibility fulfillment of industrial enterprises in the low marketization group makes the green innovation level higher than the frontier green innovation level by 2.97%; and the ESG responsibility fulfillment of industrial enterprises in the high marketization group makes the green innovation higher than the frontier green innovation level by 4.59%; and the mean value of the two groups is positive, and the difference is 1.62%. It can be seen that the promotion effect of ESG responsibility fulfillment on green innovation dominates both industrial enterprises in high-market-oriented regions and low-market-oriented regions. However, with the interaction of the facilitative and inhibitory effects of ESG compliance, the promotion of green innovation by ESG compliance of industrial firms with high marketability is greater.
4.5. Robustness Tests
(1) Replacing the ESG performance and green innovation output metrics of industrial firms. One method is to use the SynTao Green Finance ESG score (SDESG) of sample industrial enterprises to measure the ESG performance of enterprises; the other method is to use the number of green patent applications (SqG) of enterprises plus one to take the logarithm to measure the level of R&D output of enterprises. The corresponding decomposition of bilateral effects after using the above indicator substitution is shown in Table 10. After replacing the measure of ESG performance of industrial enterprises, the bilateral impact of ESG responsibility fulfillment is different from the previous paper; in particular, the positive net effect is lower, while the net effect after measuring the level of corporate R&D output through the number of corporate green patent applications is higher than the previous paper through the number of green patents granted, indicating the quantitative rather than qualitative effect of ESG responsibility fulfillment of industrial enterprises on innovation output. However, in general, the impact of industrial enterprises’ ESG responsibility fulfillment on green innovation is bilateral in character, and the promotion role plays a dominant role. These are consistent with the previous conclusions and indicate that the conclusions of this paper are robust.
Table 10.
The effect of ESG responsibility fulfillment on green innovation in industrial firms: replacement variables.
(2) Lagged explanatory variables alleviate the endogeneity problem of two-way causality. The above estimation results show that the impact of ESG compliance on green innovation has a positive and negative “bilateral character”, and the promotion effect of ESG compliance plays a dominant role, so that ESG compliance of industrial enterprises drives green innovation in general. However, ESG is a factor that affects long-term business operation, and the dynamics of corporate green innovation changes will have a reverse impact on ESG responsibility fulfillment, especially when companies create green innovations that have positive externalities for the society, which will enhance corporate ESG performance. In view of this, this paper treats ESG lags 1 to 3 (LESG, L2ESG and L3ESG) as explanatory variables, respectively, and the corresponding bilateral effect decomposition results are shown in Table 11. As the number of ESG lags increases, both the promotion and inhibition effects of ESG responsibility fulfillment on industrial enterprises’ green innovation rise, but the net effect decreases. Although there are some differences in the bilateral effects of industrial enterprises’ fulfillment of ESG responsibility, in general, the impact of industrial enterprises’ fulfillment of ESG responsibility on green innovation is bilateral, and the promotion effect plays a dominant role, which is consistent with the results of previous studies and indicates the robustness of the conclusions of this paper.
Table 11.
The impact of industrial firms’ ESG responsibility fulfillment on green innovation: lagged explanatory variables.
5. Conclusions and Policy Implications
Regarding the impact of corporate fulfillment of ESG responsibilities on green innovation, the existing literature focuses only on its unilateral effects while ignoring the bilateral effects of ESG. This paper uses the data of Chinese listed industrial enterprises in Shanghai and Shenzhen A-shares from 2012 to 2021 as a research sample to verify the bilateral effects of industrial enterprises’ fulfillment of ESG responsibility on the impact of green innovation through theoretical and empirical evidence. Based on a bilateral stochastic frontier model, this paper measures the promotion effect, the inhibition effect and the net effect size of the interaction between the fulfillment of ESG responsibility and green innovation by Chinese industrial firms. The research results show that (1) the promoting effect of industrial enterprises’ fulfillment of ESG responsibility makes the actual green innovation level higher than the frontier green innovation level by 24.49%; and the inhibiting effect of fulfilling ESG responsibility makes the actual green innovation level lower than the frontier green innovation level by 20.71%; and the interaction of the two finally leads to the industrial enterprises’ green innovation level being higher than the frontier green innovation level by 3.78%. (2) The analysis of temporal characteristics shows that there is room for growth in the promotion effect of ESG responsibility fulfillment on green innovation of industrial enterprises. Overall, the net effect of ESG responsibility fulfillment by industrial enterprises on the green innovation level of enterprises from 2012 to 2020 shows a continuous growth trend. The net effect of the interaction between the inhibitory and promotional effects of industrial enterprises’ fulfillment of ESG responsibility is positive in the sample years, with a distribution between 2.71% and 4.90%, i.e., the promotional effect of industrial enterprises’ fulfillment of ESG responsibility exceeds the inhibitory effect. (3) The analysis of regional characteristics shows that the net effect of industrial enterprises’ fulfillment of ESG responsibility is positive in the three regions of East, West and Central, indicating that industrial enterprises in all three regions can promote green innovation by fulfilling ESG responsibility. In terms of the effect size in different regions, the promotion effect of industrial enterprises’ fulfillment of ESG responsibility on green innovation is the largest in the western region, the second largest in the eastern region and the lowest in the central region. (4) Further examining the differential impact of industrial firms’ ESG responsibility fulfillment on green innovation, it is found that the promotion effect of ESG responsibility fulfillment on green innovation is greater for industrial firms in regions with low managerial short-termism, heavy pollution and high marketization compared to industrial firms in regions with high managerial short-termism, non-heavy pollution and low marketization.
Based on the above findings, the policy recommendations of this paper are as follows. (1) At the present stage, Chinese industrial enterprises must actively fulfill their ESG responsibilities and improve their ESG performance, which can not only help to positively drive corporate innovation but also concern the long-term survival and development of enterprises. In the context of the “double carbon” target, ESG, as a sustainable development concept for operating companies, is receiving increasing attention from the government and the public. It is necessary for enterprises to disclose ESG information to enhance their legitimacy, especially for industrial enterprises in heavily polluted and highly market-oriented areas. Corporate managers should also abandon their short-sightedness and actively implement ESG decisions well in the long-term interest of their companies, so that the fulfillment of ESG responsibilities can energize their green innovation rather than become a constraint. (2) For the government, it should actively support, encourage and guide enterprises to fulfill their ESG responsibilities. First, it should improve the regulation and information disclosure system for enterprises’ ESG responsibility fulfillment, strengthen the punishment for enterprises’ ESG inaction and increase their penalty costs; second, it should improve regional marketization, create a fair, legal and transparent business environment, prevent enterprises’ excessive social responsibility and non-efficient expenditure, maintain the relationship between the government and enterprises, and ensure that enterprises’ ESG responsibility fulfillment for green innovation promotion role is not weakened; third, we should provide financial support for enterprises through government subsidies, tax breaks and opening green channels for loans to reduce the cost of fulfilling ESG responsibilities, encourage enterprises to fulfill ESG responsibilities and further promote the development of ESG.
Author Contributions
Software, Z.Y.; Formal analysis, X.X.; Data curation, B.Z.; Writing—original draft, S.Z.; Funding acquisition, H.S. All authors have read and agreed to the published version of the manuscript.
Funding
The research was financially supported by the National Natural Science Foundation of China (71963030), The Major project of the Ministry of Science and Technology of China (SQ2021xjkk01800), and China’s Xinjiang Uygur Autonomous Region Social Science Fund Project (Fund number: 21BJY050).
Institutional Review Board Statement
Not applicable.
Informed Consent Statement
Not applicable.
Data Availability Statement
Not applicable.
Conflicts of Interest
The authors declare no conflict of interest.
References
- Wang, Y.; Guo, C.-H.; Du, C.; Chen, X.-J.; Jia, L.-Q.; Guo, X.-N.; Chen, R.-S.; Zhang, M.-S.; Chen, Z.-Y.; Wang, H.-D. Carbon peak and carbon neutrality in China: Goals, implementation path, and prospects. China Geol. 2021, 4, 720–746. [Google Scholar] [CrossRef]
- Sun, L.L.; Cui, H.J.; Ge, Q.S. Will China achieve its 2060 carbon neutral commitment from the provincial perspective? Adv. Clim. Chang. Res. 2022, 13, 169–178. [Google Scholar] [CrossRef]
- Qiang, S.; Gang, C.; Dawei, H. Environmental cooperation system, ESG performance and corporate green innovation: Empirical evidence from China. Front. Psychol. 2023, 14, 1096419. [Google Scholar] [CrossRef] [PubMed]
- Tan, Y.; Zhu, Z. The effect of ESG rating events on corporate green innovation in China: The mediating role of financial constraints and managers’ environmental awareness. Technol. Soc. 2022, 68, 101906. [Google Scholar] [CrossRef]
- Yuan, B.; Cao, X. Do corporate social responsibility practices contribute to green innovation? The mediating role of green dynamic capability. Technol. Soc. 2022, 68, 101868. [Google Scholar] [CrossRef]
- Zheng, M.; Feng, G.-F.; Jiang, R.-A.; Chang, C.-P. Does Environmental, Social, and Governance Performance Move Together with Corporate Green Innovation in China? Bus. Strategy Environ. 2023, 32, 1670–1679. [Google Scholar] [CrossRef]
- Chen, L.; Wang, Y.; Jin, S. How Green Credit Guidelines Policy Affect the Green Innovation in China? Environ. Eng. Manag. J. 2022, 21, 469–481. [Google Scholar]
- Wang, B.; Peng, C.; Wu, J.; Liao, F. The Impact of Political Connections on Corporate Green Innovation: The Mediating Ef-fect of Corporate Social Responsibility and the Moderating Effect of Environmental Public Opinion. Sustainability 2022, 14, 4708. [Google Scholar] [CrossRef]
- Zhang, C.; Jin, S. What Drives Sustainable Development of Enterprises? Focusing on ESG Management and Green Technology Innovation. Sustainability 2022, 14, 11695. [Google Scholar] [CrossRef]
- Xu, J.; Liu, F.; Shang, Y. R&D investment, ESG performance and green innovation performance: Evidence from China. Kybernetes 2021, 50, 737–756. [Google Scholar]
- Sasaki, T. Financial cash flows and research and development investment. Pac.-Basin Financ. J. 2016, 39, 1–15. [Google Scholar] [CrossRef]
- Sidhoum, A.A.; Serra, T. Corporate social responsibility and dimensions of performance: An application to U.S. electric utilities. Util. Policy 2017, 48, 1–11. [Google Scholar] [CrossRef]
- Wang, W.; Liang, S.; Yu, R.; Su, Y. Theoretical Evidence for Green Innovation Driven by Multiple Major Shareholders: Empirical Evidence from Chinese Listed Companies. Sustainability 2022, 14, 4736. [Google Scholar] [CrossRef]
- Lund-Thomsen, P.; Lindgreen, A.; Vanhamme, J. Industrial Clusters and Corporate Social Responsibility in Developing Countries: What We Know, What We do not Know, and What We Need to Know. J. Bus. Ethics 2016, 133, 9–24. [Google Scholar] [CrossRef]
- Fayyaz, A.; Lund-Thomsen, P.; Lindgreen, A. Industrial Clusters and CSR in Developing Countries: The Role of Interna-tional Donor Funding. J. Bus. Ethics 2017, 146, 619–637. [Google Scholar] [CrossRef]
- Chang, Y.-J.; Lee, B.-H. The Impact of ESG Activities on Firm Value: Multi-Level Analysis of Industrial Characteristics. Sustainability 2022, 14, 14444. [Google Scholar] [CrossRef]
- Lee, M.T.; Raschke, R.L. Stakeholder Legitimacy in Firm Greening and Financial Performance: What about Greenwashing Temptations? J. Bus. Res. 2023, 155, 113393. [Google Scholar] [CrossRef]
- Liu, M.; Luo, X.; Lu, W.-Z. Public perceptions of environmental, social, and governance (ESG) based on social media data: Evidence from China. J. Clean. Prod. 2023, 387, 135840. [Google Scholar] [CrossRef]
- Zhang, F.; Qin, X.; Liu, L. The Interaction Effect between ESG and Green Innovation and Its Impact on Firm Value from the Perspective of Information Disclosure. Sustainability 2020, 12, 1866. [Google Scholar] [CrossRef]
- Dimson, E.; Karakas, O.; Li, X. Active Ownership. Rev. Financ. Stud. 2015, 28, 3225–3268. [Google Scholar] [CrossRef]
- DasGupta, R. Financial performance shortfall, ESG controversies, and ESG performance: Evidence from firms around the world. Finance Res. Lett. 2022, 46, 102487. [Google Scholar] [CrossRef]
- Tampakoudis, I.; Anagnostopoulou, E. The effect of mergers and acquisitions on environmental, social and governance performance and market value: Evidence from EU acquirers. Bus. Strat. Environ. 2020, 29, 1865–1875. [Google Scholar] [CrossRef]
- Zhong, Z.; Peng, B. Can environmental regulation promote green innovation in heavily polluting enterprises? Empirical evidence from a quasi-natural experiment in China. Sustain. Prod. Consum. 2022, 30, 815–828. [Google Scholar] [CrossRef]
- Arvidsson, S.; Dumay, J. Corporate ESG Reporting Quantity, Quality and Performance: Where to Now for Environmental Policy and Practice? Bus. Strategy Environ. 2022, 31, 1091–1110. [Google Scholar] [CrossRef]
- Chang, X.; Chen, Y.; Wang, S.Q.; Zhang, K.; Zhang, W. Credit default swaps and corporate innovation. J. Financial Econ. 2019, 134, 474–500. [Google Scholar] [CrossRef]
- Chen, C.-J.; Guo, R.-S.; Hsiao, Y.-C.; Chen, K.-L. How business strategy in non-financial firms moderates the curvilinear effects of corporate social responsibility and irresponsibility on corporate financial performance. J. Bus. Res. 2018, 92, 154–167. [Google Scholar] [CrossRef]
- Kim, J.W.; Park, C.K. Can ESG Performance Mitigate Information Asymmetry? Moderating Effect of Assurance Services. Appl. Econ. 2022, 55, 2993–3007. [Google Scholar] [CrossRef]
- Madison, N.; Schiehll, E. The Effect of Financial Materiality on ESG Performance Assessment. Sustainability 2021, 13, 3652. [Google Scholar] [CrossRef]
- Barnett, M.L.; Salomon, R.M. Does it pay to be really good? addressing the shape of the relationship between social and financial performance. Strateg. Manag. J. 2012, 33, 1304–1320. [Google Scholar] [CrossRef]
- Son, S.; Kim, J. Environment, Social, and Governance Performance and Financial Performance With National Pension Fund Investment: Evidence From Korea. Front. Psychol. 2022, 13, 893535. [Google Scholar] [CrossRef]
- Ferrell, A.; Liang, H.; Renneboog, L. Socially Responsible Firms. J. Financ. Econ. 2016, 122, 585–606. [Google Scholar] [CrossRef]
- Cai, L.; Cooper, R.; He, D. Socially Responsible Investing and Factor Investing, Is There an Opportunity Cost? J. Portf. Manag. 2022, 48, 181–197. [Google Scholar] [CrossRef]
- Wang, W.; Yu, Y.; Li, X. ESG performance, auditing quality, and investment efficiency: Empirical evidence from China. Front. Psychol. 2022, 13, 113393. [Google Scholar] [CrossRef]
- Filippou, I.; Taylor, M.P. Pricing ethics in the foreign exchange market: Environmental, Social and Governance ratings and currency premia. J. Econ. Behav. Organ. 2021, 191, 66–77. [Google Scholar] [CrossRef]
- Dentchev, N.A. Corporate Social Performance as a Business Strategy. J. Bus. Ethics 2004, 55, 397–412. [Google Scholar] [CrossRef]
- Wang, H.; Lu, W.; Ye, M.; Chau, K.; Zhang, X. The curvilinear relationship between corporate social performance and corporate financial performance: Evidence from the international construction industry. J. Clean. Prod. 2016, 137, 1313–1322. [Google Scholar] [CrossRef]
- Huang, Y.; Yang, S.; Zhu, Q.; Wang, Y.; Tian, Y. Corporate Environmental Responsibility and Managerial Learning: Evidence from U.S. Listed Firms. Sustain. Prod. Consum. 2021, 27, 1961–1974. [Google Scholar] [CrossRef]
- Liu, H.; Lyu, C. Can ESG Ratings Stimulate Corporate Green Innovation? Evidence from China. Sustainability 2022, 14, 12516. [Google Scholar] [CrossRef]
- Broadstock, D.C.; Matousek, R.; Meyer, M.; Tzeremes, N.G. Does corporate social responsibility impact firms’ innovation capacity? The indirect link between environmental & social governance implementation and innovation performance. J. Bus. Res. 2020, 119, 99–110. [Google Scholar]
- De Lucia, C.; Pazienza, P.; Bartlett, M. Does Good ESG Lead to Better Financial Performances by Firms? Machine Learning and Logistic Regression Models of Public Enterprises in Europe. Sustainability 2020, 12, 5317. [Google Scholar] [CrossRef]
- Halkos, G.; Skouloudis, A. Corporate Social Responsibility and Innovative Capacity: Intersection in a Macro-Level Perspective. J. Clean. Prod. 2018, 182, 291–300. [Google Scholar] [CrossRef]
- Asante-Appiah, B.; Lambert, T.A. The role of the external auditor in managing environmental, social, and governance (ESG) reputation risk. Rev. Account. Stud. 2022, 1–53. [Google Scholar] [CrossRef]
- Jia, M.; Zhang, Z. The CEO’s Representation of Demands and the Corporation’s Response to External Pressures: Do Politically Affiliated Firms Donate More? Manag. Organ. Rev. 2013, 9, 87–114. [Google Scholar] [CrossRef]
- Uyar, A.; Kuzey, C.; Karaman, A.S. ESG Performance and CSR Awards: Does Consistency Matter? Financ. Res. Lett. 2022, 50, 103276. [Google Scholar] [CrossRef]
- DesJardine, M.R.; Shi, W.; Westphal, J. Shareholder Politics: The Influence of Investors’ Political Affiliations on Corporate Social Responsibility. J. Manag. 2023, 1–30. [Google Scholar] [CrossRef]
- Fan, J.P.H.; Wong, T.J.; Zhang, T. Politically Connected CEOs, Corporate Governance, and Post-IPO Performance of China’s Newly Partially Privatized Firms. J. Financ. Econ. 2007, 84, 330–357. [Google Scholar] [CrossRef]
- Terzani, S.; Turzo, T. Religious social norms and corporate sustainability: The effect of religiosity on environmental, social, and governance disclosure. Corp. Soc. Responsib. Environ. Manag. 2021, 28, 485–496. [Google Scholar] [CrossRef]
- Kumbhakar, S.C.; Parmeter, C.F. The effects of match uncertainty and bargaining on labor market outcomes: Evidence from firm and worker specific estimates. J. Prod. Anal. 2009, 31, 1–14. [Google Scholar] [CrossRef]
- Kumbhakar, S.; Lovell, K. Stochastic Frontier Analysis; Cambridge University Press: Cambridge, UK, 2000. [Google Scholar]
- Martínez-Alonso, R.; Martínez-Romero, M.J.; Rojo-Ramírez, A.A. R&D collaboration breadth and family-firm innovation efficiency: The role of family management and generational stage. Technol. Econ. Dev. Econ. 2023, 29, 677–695. [Google Scholar]
- Song, W.; Han, X. The Bilateral Effects of Foreign Direct Investment on Green Innovation Efficiency: Evidence from 30 Chinese Provinces. Energy 2022, 261, 125332. [Google Scholar] [CrossRef]
- Huang, H.; Xu, E.; Fan, F. The impact of environmental regulations on the performance of regional collaborative innovation—In case of China’s 30 provinces. Environ. Sci. Pollut. Res. 2023, 30, 47985–48001. [Google Scholar] [CrossRef] [PubMed]
- Liu, L.; Zhou, Y. The Impact of Managers’ Environmental Cognition on Urban Public Service Innovation from the Perspective of Green Ecology. Int. J. Environ. Res. Public. Health 2022, 19, 15945. [Google Scholar] [CrossRef] [PubMed]
- Hu, N.; Xue, F.J.; Wang, H.N. Does Managerial Myopia Affect Long-term Investment? Based on Text Analysis and Machine Learning. J. Manag. World. 2021, 37, 139–156+11+19–21. [Google Scholar]
- Ju, Y.; Jeon, S.Y.; Sohn, S.Y. Behavioral technology credit scoring model with time-dependent covariates for stress test. Eur. J. Oper. Res. 2015, 242, 910–919. [Google Scholar] [CrossRef]


Disclaimer/Publisher’s Note: The statements, opinions and data contained in all publications are solely those of the individual author(s) and contributor(s) and not of MDPI and/or the editor(s). MDPI and/or the editor(s) disclaim responsibility for any injury to people or property resulting from any ideas, methods, instructions or products referred to in the content. |
© 2023 by the authors. Licensee MDPI, Basel, Switzerland. This article is an open access article distributed under the terms and conditions of the Creative Commons Attribution (CC BY) license (https://creativecommons.org/licenses/by/4.0/).