Abstract
Electricity consumption is a crucial source of carbon emissions. Many studies have focused on the emissions relevant to electricity generation, yet it is also important to evaluate the carbon intensity of final electricity use for the emission assessment of various industries. Considering fossil fuel consumption, regional exchange, and transmission loss, this study proposed a method to assess the emission intensities of electricity generation, supply, and use. Based on statistical data, the carbon intensities of North, Northeast, East, Central, Northwest, and South China power grids were evaluated during the period from 2005 to 2020, and the driving factors including energy structure, energy intensity, clean production, supply structure, and power loss effects were discussed using Logistic Mean Divided Index (LMDI) decomposition. An overall descending trend was observed for the carbon intensity, and the national average carbon intensities of electricity generation, supply, and use were 0.599, 0.599, and 0.622 kgCO2e/kWh, respectively. The carbon intensity of South China gird was the lowest at 0.425 kgCO2e/kWh in 2020. Moreover, the energy intensity effect and clean production effect were identified as the most influential factors of carbon intensity. The proposed method and results can be helpful to assess carbon emissions relevant to final electricity use.
1. Introduction
As one of the largest greenhouse gas emitters, China contributed approximately 31% of the energy-related emissions worldwide in 2021 [1]. Despite the challenge in economic development, the Chinese government has committed to reaching a CO2 emission peak before 2030 [2], which demonstrates China’s determination to undertake emission reduction responsibilities. With the progress of urbanization and industrialization, electricity generation and demand have continuously grown over the past decades [3]. In 2021, the installed power generation capacity was 2.38 billion kW in China according to China Statistical Yearbook [4]. At the same time, the total electricity generation and consumption reached 8.53 and 8.33 trillion kWh, respectively, and coal-fired thermal electricity generation is still widely used in China [5]. Consequently, the electricity industry accounts for nearly 40% of the national carbon emissions [6,7]. Therefore, it is crucial to reduce carbon emissions from the electricity industry.
Accurate calculation of carbon emissions from the electricity industry is the foundation for achieving emission reduction. Previous studies have made attempts to investigate the total carbon emissions from electricity generation and the carbon intensity of electricity. For example, Ari and Koksal [8] investigated the carbon emissions from the Turkish electricity sector based on the fossil fuel combustion of power plants. Cao et al. [9] calculated the carbon emissions and energy consumption of distributed generation and proposed an approach to predict the carbon intensity of provincial power grids. Lindner et al. [10] considered electricity transfer and compared the carbon emissions of China’s provincial power grid from consumption and production perspectives. Harmsen and Graus [11] proposed a method to estimate the marginal carbon intensity of electricity, and compared the carbon reduction from electricity saving with the average carbon intensity of electricity generation. Ang and Su [12] investigated the carbon intensity in electricity production globally. They proposed an indicator named “aggregate carbon intensity”, which was defined as the ratio of total carbon emissions from electricity generation to the total electricity production. The indicator has been widely used in recent studies [13,14].
Based on the assessment of carbon emissions from electricity generation using historical data, potential approaches to reduce the carbon emissions from electricity generation, especially thermal power generation were explored and discussed. Considering the balance between economic development and environmental concerns, clean power generation technology such as the application of renewable energy has been regarded as a significant pathway toward the low-carbon electricity industry [15,16,17]. In this context, many studies have made efforts to predict the potential emission reduction from using clean power generation technology, which usually considered economic factors, technical improvements, and management measures [18,19,20,21]. Moreover, other than analyzing the benefits of replacing thermal electricity with renewable energy, previous studies have also concentrated on identifying and quantifying the driving factors of carbon emissions from electricity. Among the various decomposition models, Logistic Mean Divided Index (LMDI) decomposition has been widely applied [22,23,24]. Table 1 summarizes the studies on carbon emissions of the electricity sector and relevant driving factors [13,14,25,26,27,28,29,30,31]. With respect to electricity generation in China, the main driving factors considered in previous research can be classified as follows: (1) social and economic factors, including gross domestic product, population, electricity consumption per capita, and electricity generation scale [25,26,27]; (2) energy structure factors including share of clean power generation and fossil fuel types for thermal power generation [28,29]; and (3) technical factors, including electricity production efficiency, line loss rate, and geographic distribution [13,14]. Moreover, a few studies also investigated the driving factors of carbon intensity. Ang and Goh [31] studied the aggregate carbon intensity of electricity generation and suggested that thermal efficiency is a key factor to reduce carbon intensity from a global perspective. Wang et al. [13] analyzed the driving forces of aggregate carbon intensity in China and the results indicated that the proportion of clean power generation was also an influential factor.

Table 1.
A summary of studies on carbon emissions of the electricity sector.
Although many studies have been conducted to investigate the carbon emissions of electricity generation and relevant driving factors, there are still some knowledge gaps. First, the aggregate carbon intensity of electricity generation was evaluated on global, national, and provincial scales, which can be useful for policy-making on the low-carbon electricity industry. However, from the consumer’s view, it is also important to know the quantity of carbon emissions relevant to electricity use. In this context, it is necessary to investigate the carbon intensity of electricity consumption. Second, previous studies have concentrated on the driving factors of carbon emissions and carbon intensity from electricity generation, yet relatively few studies have considered the driving factors of the carbon intensity of electricity consumption. Hence, with consideration of electricity generation, regional power exchanges, and transmission loss, this study aims to propose a method to evaluate the carbon emission intensity of electricity consumption for the regional power grid in China and explore its driving factors, which covers the period from 2005 to 2020. The assessed transmission loss can provide fundamental data for electricity consumers to evaluate carbon emissions. The remainder of this paper is organized as follows: Section 2 introduces the method for evaluating the carbon emission intensity and LMDI decomposition; Section 3 describes the data on electricity generation and use, fossil fuel consumption for thermal power generation, and emission factors of fuel combustion; Section 4 presents and discusses the results; and Section 5 concludes the main findings and limitations of this study.
2. Methodology
2.1. Carbon Intensity Assessment
2.1.1. System Boundary
The climate change department of the Ministry of Ecological Environment of China divides the national power grids into the North, Northeast, East, Central, Northwest, and South grids [32]. Table 2 summarizes the geographical scope of each regional grid. Tibet, Taiwan, Hong Kong, and Macao were not studied because of data scarcity.
Table 2.
Geographical scopes of regional power grids in China.
Various energy sources, including thermal power, nuclear power, solar power, hydropower, and wind power, are currently applied for electricity generation. For thermal power generation, coal, oil products, and gaseous fuels are used for energy transformation, and, accordingly, fossil fuel combustion is the critical source of carbon emissions for electricity generation [13]. However, for the abovementioned clean power generation, although supply-chain carbon emissions from the equipment production, operation maintenance, and disposal processes are identified from a life cycle perspective, the energy transformation process produces almost no carbon emissions [33]. To maintain the consistency of the system boundary between thermal and clean power generation systems, this study considered only the energy transformation process for the assessment of carbon intensities.
With respect to the carbon intensity associated with regional power grids, the fundamental concept of this indicator can be described as follows [12]:
where EFi, Ci, and Ei are the carbon intensity, total carbon emissions, and gross electricity generation, supply, or final consumption, respectively, of power grid i.
As shown in Figure 1, the above description indicates that the carbon intensity of electricity can have multiple definitions. First, Ei may represent the generated, supplied, and final consumed electricity, and the relevant carbon intensities can be the aggregate carbon intensity of electricity generation, the carbon intensity of electricity supply, and the associate carbon intensity of final electricity consumption, respectively. The electricity production includes both thermal electricity and electricity generated from clean energy; the electricity supply includes locally generated electricity and imported electricity for local use; and the electricity consumption included corresponds to the regional final electricity consumption, which excludes the transmission loss from the electricity supply. The clear energy in this study refers to renewable energy (such as solar, wind, and hydro energy) and nuclear power. Second, Ci may be quantified using production-based and consumption-based methods. For the production-based method, carbon emissions of imported electricity from other regional grids or abroad are not included, and carbon emissions of exported electricity are not excluded. However, for the consumption-based method, the opposite is true. In this study, the carbon intensity of final electricity consumption was analyzed using the consumption-based accounting method, which could reflect the real level of carbon emissions from final energy use (such as energy use of the industry and building sectors).
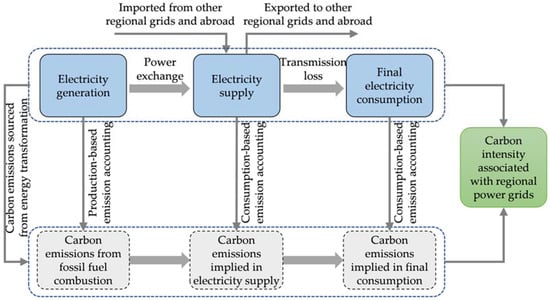
Figure 1.
System boundary for the assessment of carbon intensity associated with regional power grids.
2.1.2. Assessment Method
As shown in Figure 2, the carbon intensities of electricity generation, supply, and final use are evaluated according to the procedure as follows:
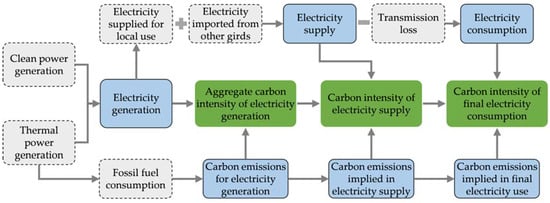
Figure 2.
Framework for evaluating the carbon intensities of electricity generation, supply, and final consumption.
- (1)
- Obtain the data on electricity generation for each regional power grid considering both clean and thermal power generation.
- (2)
- Obtain the data on fossil fuel consumption for thermal power production, and calculate the relevant carbon emissions.
- (3)
- Assess the aggregate carbon intensity of electricity generation based on the gross electricity generation and carbon emissions.
- (4)
- Evaluate the electricity supply, which encompasses the electricity generated for local use and the electricity imported from other regional grids.
- (5)
- Evaluate the carbon emissions relevant to electricity supply and assess the relevant carbon intensity.
- (6)
- Subtract transmission loss from the electricity supply to obtain the final electricity use.
- (7)
- Evaluate the carbon emissions relevant to final electricity use and assess the associate carbon intensity.
According to Intergovernmental Panel on Climate Change (IPCC) Guidelines for National Greenhouse Gas Inventories [34], carbon emissions from fossil fuel combustion can be calculated as the product of energy consumption and relevant emission factor. The emission factor of a certain type of fossil fuel is generally measured as follows:
where EFe is the emission factor of the fuel, Cc is the carbon content per unit calorific value, Ro is the oxidation rate of the fuel, and are the methane (CH4) and nitrous oxide (N2O) emitted during fuel combustion, respectively, and are the global warming potential (GWP) of CH4 and N2O, respectively, and is the net calorific value.
Based on the above method, carbon emissions from thermal power generation in each year can be calculated as follows:
where Qij and Qpj are the consumption of fuel j used for energy transformation in power grid i and province p, respectively, is the emission factor of fuel j, and J is the total number of fuel types.
Moreover, considering that carbon emissions from clean electricity production are assumed to be zero [13,14,33], the total carbon emissions for electricity generation in power grid i, are equal to . Hence, the aggregate carbon intensity of electricity generation in power grid i, can be estimated as:
where is total electricity generation in power grid i, and are the thermal and clean electricity generation in power grid i, respectively. Notably, the electricity generated by a power station can be divided into (1) electricity supply to the power grids and (2) electricity used by the operation of the power station. Herein, , , and are net electricity generation accessed to the power grids that the electricity demanded by the station itself have been excluded.
Considering the power exchange, the electricity generation in power grid i can be divided into three components, including electricity supplied for local use, electricity supplied to other regional grids in China, and electricity exported abroad. In this context, the gross electricity supply in power grid i, is calculated as follows:
where represents the electricity supplied to power grid i by power grid q, represents the electricity supplied to power grid q by power grid i, represents the electricity imported from country or region r abroad, represents the electricity exported to country or region r abroad, and R is the total number of involved countries and regions.
Considering consumption-based carbon emission accounting, the total carbon emissions for electricity supply in power grid i, can be assessed using Equation (6), and the relevant carbon intensity for electricity supply, can be estimated using Equation (7).
where and represent the carbon intensities of electricity generation in power grid q and country or region r abroad, respectively.
It should be emphasized that the imported and exported electricity abroad were not considered in this study for two main reasons. First, the power exchange between China and other countries (regions) is relatively small compared to the gross power supply nationwide. Second, aggregate carbon intensities of electricity generation abroad are difficult to obtain. Therefore, the above method of estimating the carbon intensity of electricity supply is simplified as follows:
For conciseness and clarity, the numerator (namely, ) in Equation (8) can be further rewritten as follows:
where is the aggregate carbon intensity of electricity generation in power grid k, represents the electricity supplied to power grid i by power grid k, and when k = i, the term equals to the term .
Furthermore, the electricity for final consumption is lower than the electricity supply considering the loss during power transmission, and the loss rate is defined as:
where is the loss rate of electricity transmission in power grid i, is the final electricity consumption in power grid i, and is the corresponding gross electricity loss, which can be calculated as the difference between electricity supply and final consumption.
Hence, the associate carbon intensity of final electricity consumption, can be obtained by correcting as follows:
Moreover, combining Equations (3), (4), (7), (9) and (11), the above equation can be rewritten as:
where represents the contribution of fuel j consumption in power grid k to the implied carbon emissions of final electricity consumption in power grid i.
2.2. LMDI Decomposition
Based on the additive LMDI method suggested by Ang [35], the abovementioned associate carbon intensity of final electricity consumption is decomposed as follows:
where Qkj is the consumption of fuel j in terms of standard coal in power grid k, Qk is the comprehensive energy input for electricity transformation in power grid k, is the thermal power generation in power grid k, and is the total electricity generation in power grid k.
Furthermore, Equation (13) shows that is decomposed using six influencing factors: is the emission factor of fuel j, incorporating emission factor effect; is the contribution of fuel j to the total fuel consumption for thermal energy generation in power grid k, incorporating the production energy structure effect; is the ratio of total fuel consumption to thermal electricity generation in power grid k, incorporating the production energy intensity effect; is the proportion of thermal electricity generation in total electricity generation in power grid k, incorporating the clean energy utilization effect; is the proportion of electricity supplied by power gird k in the total electricity supply in power grid i, incorporating the energy supply structure effect; and is the ratio of final electricity consumption to total electricity supply in power grid i, incorporating power transmission loss effect.
Generally, emission factors of fuels are considered as constant values. Hence, the change in between the adjacent two years t and t − 1 can be decomposed into five parts as shown in Equation (14), and the individual effect by each influencing factor can be calculated using Equations (15)–(20).
where represents the total change in during the period from year t − 1 to year t, and , , , , and are the corresponding changes in caused by the production energy structure, production energy intensity, clean energy utilization, energy supply structure, and power transmission loss effects, respectively.
Moreover, to avoid failure of calculating logarithms in the decomposition, zero values were replaced with small numbers (10−20), as suggested by Ang and Liu [36].
3. Data Collection and Processing
3.1. Electricity Generation, Supply, and Consumption
This study covers a research period from 2005 to 2020. Electricity generated from both thermal power transformation and clean energy sources of each province are collected from regional energy balance sheets in China Energy Statistical Yearbook (CESY) [37], and the electricity generation in each power grid was calculated according to the geographical scope as shown in Table 2. Raw data on electricity exchanged between different power grids are obtained from China Power Statistical Yearbook (CPSY) [38]. Based on the electricity generation and exchange data, the electricity supply of each power grid was calculated according to Equation (5). Moreover, the final electricity consumption was obtained from CESY to estimate transmission loss rates using Equation (10). Electricity generation, supply, and final consumption are summarized in Table 3.
Table 3.
Electricity generation, supply, and final consumption (106 MWh) from 2005 to 2020.
3.2. Fossil Fuel Consumption
For thermal power generation, coal, liquid fuels, and gaseous fuels are usually used, yet for clean power generation, primary energy such as solar and wind energy is used. In this study, only the fossil fuels used for power transformation were considered for carbon emission assessment, and the upstream energy consumption for the construction of power generation facilities was not included. Fuel consumption for provincial power generation in China was obtained from regional energy balance tables in CESY [37]. Sixteen kinds of fossil fuels were considered including raw coal, cleaned coal, other washed coal, briquettes, gangue, coke oven gas, blast furnace gas, converter gas, crude oil, diesel oil, fuel oil, petroleum coke, refinery gas, other petroleum products, natural gas, and liquefied natural gas. The original provincial data were merged into the fuel consumption of six power grids according to Table 2. The total fossil fuel consumption for electricity generation measured by standard coal equivalent (ce) is shown in Table 4. Notably, “1 tce” refers to 1 ton of standard coal equivalent which equals 7000 kcal when expressed in calorific value [38]. This standard coal equivalent can be used to generalize the unit of fossil fuel consumption, and, therefore, it is possible to compare the energy use for electricity generation in different years.
Table 4.
Fossil fuel consumption for electricity generation (106 tce) from 2005 to 2020.
3.3. Emission Factor of Fossil Fuels
Emission factors of the abovementioned fossil fuels were evaluated based on Equation (2), and the results are presented in Table 5. The sources of carbon content, oxidation rate, and net calorific value are as follows: (1) the values of carbon content and oxidation rate were obtained from Guidelines for Provincial Greenhouse Gas Inventories [39]; (2) the methane and nitrous oxide emission were obtained from IPCC Guideline for National Greenhouse Gas Inventories [33]; and (3) the net calorific values of fuels were obtained from CESY, which was consistent with the source of fuel consumption data.
Table 5.
Emission factors of fossil fuels.
4. Results and Discussion
4.1. Carbon Intensity of Electricity in Regional Power Grids
The aggregate carbon intensity of electricity generation in each power grid was evaluated according to Equation (4), and the results are shown in Figure 3. An overall descending trend was observed for the carbon intensity in all power grids, especially during the period from 2011 to 2016. The carbon intensities of electricity generation in 2005 were 1.024, 1.063, 0.801, 0.693, 0.761, and 0.708, respectively, in the NC, NEC, EC, CC, NWC, and SC power grids. The values decreased to 0.825,0.757,0.603,0.396,0.617, and 0.407, respectively, in 2020. The national average carbon intensity changed from 0.837 in 2005 to 0.599 in 2020, and the total decrease rate reach 28.5%. Moreover, based on the relevant values and trends, the carbon intensity of power generation in the six regional grids can be divided into three groups as follows: (1) the first group includes the NC and NEC grids, of which the carbon intensity was relatively high; (2) the second group includes the EC and NWC grids, of which the carbon intensity was closed to the national average level in recent year, whereas the changes were relatively gentle in the assessment period; and (3) the third group includes the CC and SC grids, of which the carbon intensity was relatively low and the decrease rate was relatively high (42.7% on average from 2005 to 2020).
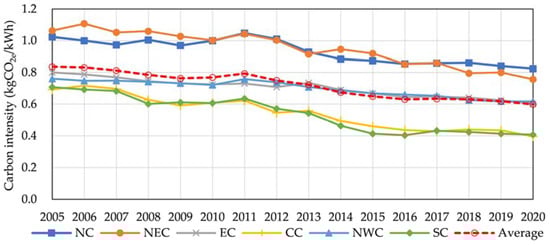
Figure 3.
Aggregate carbon intensity of electricity generation.
Considering power exchanges among the regional grids, the carbon intensity of electricity supply in each power grid was evaluated according to Equation (8). The difference in carbon intensities between electricity generation and supply was analyzed, and the results are shown in Figure 4. For the NEC, NWC, and SC grids, the electricity supplied by other grids was not considerable, and, therefore, the carbon intensities of electricity generation and supply were similar. For the CC grid, the carbon intensity of electricity supply was higher than that of electricity generation, and the difference between them increased in recent years. The reason was that the CC grid used more electricity supplied by the NWC gird, of which the aggregate carbon intensity of electricity generation was relatively high. For similar reasons, the carbon intensities of electricity supply were lower than those of electricity generation in the NC and EC grids.
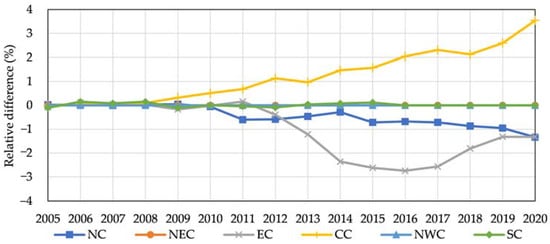
Figure 4.
Relative difference of the carbon intensity between electricity generation and supply.
Based on the analysis of electricity supply and transmission loss, the associate carbon intensity of final electricity consumption was evaluated according to Equation (11), and the results are summarized in Table 6. The associate carbon intensity of final electricity consumption in SC grid was the lowest at 0.425 kgCO2e/kWh in 2020, and the highest value at 0.879 kgCO2e/kWh occurred in the NC grid. Descending trends were observed in the associate carbon intensities, especially after 2011. Moreover, the difference between the carbon intensities of electricity generation and use are compared in Figure 5. There was a fluctuation in the difference between the two emission factors, yet an overall descending trend was observed in the difference, which indicated that the transmission loss was better controlled in recent years.
Table 6.
Associate carbon intensity of final electricity consumption (kgCO2e/kWh).
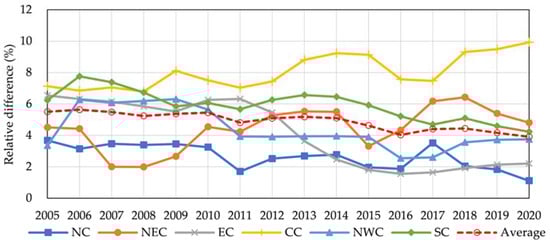
Figure 5.
Relative difference of the carbon intensity between electricity generation and use.
4.2. LMDI Decomposition of the Associate Carbon Intensity of Electricity Use
Detailed results of LMDI decomposition for each regional power gird are demonstrated in Figure 6. As indicated in Figure 6, the assessment period was divided into three stages: (a) Stage 1 including a 5-year period from 2005 to 2010; (b) Stage 2, including a 5-year period from 2010 to 2015; and (c) Stage 3, including a 5-year period from 2015 to 2020. The characteristics of the five driving factors varied considering different regional grids and stages.
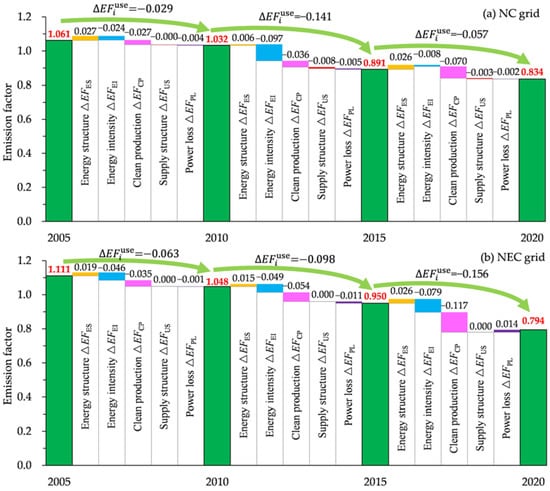
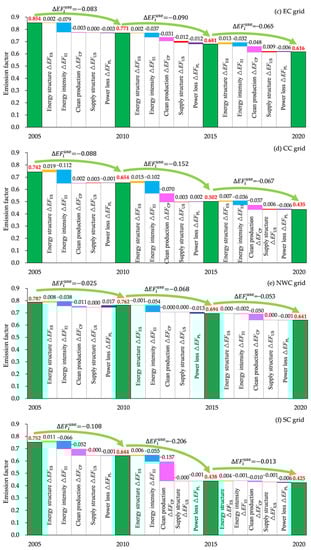
Figure 6.
Decomposition of the associate carbon intensity of electricity use (kgCO2e/kWh) in regional power girds: (a) NC grid; (b) NEC gird; (c) EC grid; (d) CC grid; (e) NWC grid; and (f) SC grid. The red text represents the associate carbon intensity of final electricity consumption in this year.
For the NC gird (Figure 6a), the decreases of the associate carbon intensity in the three stages were 0.029, 0.141, and 0.057 kgCO2e/kWh, respectively. All driving factors except for the energy structure effect indicated positive influences on the decrease during the assessment period. In Stage 1, the change in the associate carbon intensity was not significant, and the energy intensity effect and clean production effect contributed equally. In Stage 2, the energy intensity effect dominated the change with a contribution of nearly 70%, and the associate carbon intensity experienced a rapid decrease. In Stage 3, the application of clean power generation was promoted, and the most influential factor became the clean production effect.
For the NEC grid (Figure 6b), the decreases of the associate carbon intensity in the three stages were 0.063, 0.098, and 0.156 kgCO2e/kWh, respectively. The energy structure effect showed an inhibiting influence on the changes during the assessment period. Moreover, the supply structure effect was zero because the electricity demand was self-sufficient by the NEC grid itself. In Stages 1 and 2, both the energy intensity effect and clean production effect contributed positively to the reduction of associate carbon intensity, and their contribution were similar. In Stage 3, an approximately 16.5% decrease was realized, of which the influence of the clean production effect was more considerable than the energy intensity effect.
For the EC grid (Figure 6c), the decreases of the associate carbon intensity in the three stages were 0.083, 0.090, and 0.065 kgCO2e/kWh, respectively. In Stage 1, the only considerable factor was the energy intensity effect. In Stage 2, while the energy structure effect was negligible, the other driving factors showed a positive impact on the reduction of associate carbon intensity. In Stage 3, the energy intensity effect and the clean production effect continued to play active roles, yet the energy structure effect and supply structure became inhibiting factors.
For the CC grid (Figure 6d), the decreases of the associate carbon intensity in the three stages were 0.088, 0.152, and 0.067 kgCO2e/kWh, respectively. In all stages, the influence of the energy intensity effect was significant, which led to a 0.25 kgCO2e/kWh reduction of associate carbon intensity, yet the energy structure effect slightly inhibited the decrease. In Stages 2 and 3, the clean production effect also became an important factor, with a total contribution of 0.107 kgCO2e/kWh to the reduction of associate carbon intensity.
For the NWC grid (Figure 6e), the decreases of the associate carbon intensity in the three stages were 0.025, 0.068, and 0.053 kgCO2e/kWh, respectively. The energy intensity effect played a positive role in Stages 1 and 2, but its influence in Stage 3 was very limited. The clean production effect was an influential factor only in Stage 3. For the same reason as the NEC grid, the impact of the supply structure effect was zero. Overall, although the associate carbon intensity of the NWC gird was relatively low in 2005, the relevant decrease trend was not as considerable as other regional grids.
For the SC grid (Figure 6f), the decreases of the associate carbon intensity in the three stages were 0.108, 0.206, and 0.013 kgCO2e/kWh, respectively. In Stages 1 and 2, the energy intensity effect and clean production effect showed strong influences, they contributed 0.121 and 0.209 kgCO2e/kWh reduction to the reduction of associate carbon intensity, respectively. The associate carbon intensity of electricity use has already reached a relatively low value of 0.438 kgCO2e/kWh in 2015, and in Stage 3, the change in the associate carbon intensity is not considerable.
Overall, the results of LMDI decomposition indicated that the associate carbon intensities of electricity use decreased by 0.227, 0.317, 0.237, 0.307, 0.146, and 0.327 kgCO2e/kWh, respectively, in the NC, NEC, EC, CC, NWC, and SC grids during the period from 2005 to 2020. As shown in Table 7, the decreases in associate carbon intensity can mainly be attributed to the energy intensity effect and clean production effect. The influence of the supply structure effect and power loss effect varied in different regional grids, yet they both showed very limited impacts on the results. The energy structure effect was an inhibiting factor in the decrease in associate carbon intensity, especially in the NC and NEC grids. the reasons for this result can be as follows: (1) the share of coal in all fossil fuels for thermal power generation slightly increased in some regions, and (2) in other regions, coal-fired electricity generation was reduced and the share of blast furnace gas and converter gas increased. However, their net calorific values are relatively low, and more carbon dioxide will be emitted when provided with the same amount of thermal energy for power generation. Despite the inhibiting factors, the actual decreases in the associate carbon intensities were 0.286, 0.380, 0.255, 0.360, 0.157, and 0.349 kgCO2e/kWh, respectively, in the NC, NEC, EC, CC, NWC, and SC grids, of which the contribution of the energy intensity effect and clean production effect was more than 95%. It should be noted that the emission factors of fossil fuels were considered time-invariant, and the relevant influence is not considered in this study.
Table 7.
Driving factors in the changes of associate carbon intensity of electricity use (kgCO2e/kWh).
5. Conclusions
This study proposed a comprehensive method to assess the carbon intensities of electricity generation, supply, and use in the six regional power grids of China. The emission factors were evaluated covering the period from 2005 to 2020, and an LMDI decomposition model was developed to investigate the influence of driving factors including energy structure effect, energy intensity effect, clean production effect, supply structure effect, and power loss effect. The main findings of this study are as follows:
- (1)
- The associate carbon intensities of electricity use were 0.834, 0.794, 0.616, 0.435, 0.641, and 0.425 kgCO2e/kWh, respectively, in the NC, NEC, EC, CC, NWC, and SC grids in 2020. The national average carbon intensities of electricity generation, supply, and use were 0.599, 0.599, and 0.622 kgCO2e/kWh, respectively.
- (2)
- The carbon intensities of electricity generation, supply, and use experienced an overall descending trend during the assessment period. Total decreases of the associate carbon intensity of electricity use reached 0.227, 0.317, 0.237, 0.307, 0.146, and 0.327 kgCO2e/kWh, respectively, in the NC, NEC, EC, CC, NWC, and SC grids. A national average 30% decrease was observed by comparing the results in 2020 and 2005.
- (3)
- Although the driving factors and trends of the changes in carbon intensity varied among different regional power grids in China, the energy intensity effect and clean production effect were determined as the most influential factors for the decrease in the carbon intensity, which can be mainly attributed to the efforts in upgrading production technology and equipment and promoting clean energy utilization.
The proposed method provided a helpful approach to evaluating the carbon intensity of electricity in regional power grids. The results of carbon intensities for electricity generation, supply, and use during the assessment period can be widely applied to assess the carbon emissions relevant to electricity use in China. It is worth noting that the proposed method was developed based on statistical data. Considering the changing production ways and final demands of electricity, the carbon intensity can be evaluated based on the latest data to ensure applicability and timeliness.
Author Contributions
Conceptualization, X.Z. (Xiaocun Zhang) and X.Z. (Xueqi Zhang); data curation, Q.Z.; Funding acquisition, X.Z. (Xiaocun Zhang); investigation, X.Z. (Xueqi Zhang); methodology, X.Z. (Xiaocun Zhang); supervision, X.Z. (Xiaocun Zhang); validation, X.Z. (Xueqi Zhang); visualization, Q.Z.; writing—original draft, X.Z. (Xiaocun Zhang); writing—review and editing, X.Z. (Xiaocun Zhang). All authors have read and agreed to the published version of the manuscript.
Funding
This work was funded by the Zhejiang Provincial Natural Science Foundation of China (LQ22E080001) and National Natural Science Foundation of China (52108152).
Institutional Review Board Statement
Not applicable.
Informed Consent Statement
Not applicable.
Data Availability Statement
Research data have been introduced in the published article. Further data can be accessed from the corresponding author on reasonable request.
Conflicts of Interest
The authors declare no conflict of interest.
Nomenclature
| Notations | |
| Ci | Total carbon emissions of power grid i |
| Cc | Carbon content per unit calorific value |
| Methane emitted during fuel combustion | |
| Nitrous oxide emitted during fuel combustion | |
| Total carbon emissions for electricity generation in power grid i | |
| Total carbon emissions for electricity supply in power grid i | |
| Contribution of fuel j consumption in power grid k to the implied carbon emissions of final electricity consumption in power grid i | |
| Ei | Gross electricity generation, supply, or final consumption of power grid i |
| Total electricity generation in power grid i | |
| Electricity supplied to power grid i by power grid k | |
| Clean electricity generation in power grid i | |
| Gross electricity supply in power grid i | |
| Thermal electricity generation in power grid i | |
| Electricity exported from power gird i to country or region r abroad | |
| Electricity imported from country or region r abroad to power gird i | |
| Electricity supplied to power grid i by power grid q | |
| Electricity supplied to power grid q by power grid i | |
| Gross electricity loss in power grid i | |
| Final electricity consumption in power grid i | |
| Thermal power generation in power grid k | |
| Total electricity generation in power grid k | |
| EFe | Emission factor of the fuel |
| Emission factor of fuel j | |
| EFi | Carbon intensity of power grid i |
| Carbon intensity of electricity generation in power grid i | |
| Carbon intensity of electricity generation in power grid k | |
| Carbon intensity of electricity generation in power grid q | |
| Carbon intensity of electricity supply in power grid i | |
| Carbon intensity of electricity generation in country or region r abroad | |
| Associate carbon intensity of final electricity consumption in power grid i | |
| Global warming potential of CH4 | |
| Global warming potential of N2O | |
| J | Total numbers of fuel types. |
| Qcv | Net calorific value of the fuel |
| Qij | Consumption of fuel j used for energy transformation in power grid i |
| Qpj | Consumption of fuel j used for energy transformation in province p |
| Qk | Comprehensive energy input for electricity transformation in power grid k |
| Qkj | Consumption of fuel j in terms of standard coal in power grid k |
| R | Total number of countries and regions. |
| Ro | Oxidation rate of the fuel |
| Contribution of fuel j to the total fuel consumption for thermal energy generation in power grid k | |
| Ratio of total fuel consumption to thermal electricity generation in power grid k | |
| Proportion of thermal electricity generation in total electricity generation in power grid k | |
| Proportion of electricity supplied by power gird k in the total electricity supply in power grid i | |
| Ratio of final electricity consumption to total electricity supply in power grid i | |
| Total change in | |
| Change in caused by production energy structure effect | |
| Change in caused by production energy intensity effect | |
| Change in caused by clean energy utilization effect | |
| Change in caused by energy supply structure effect | |
| Change in caused by power transmission loss effect | |
| Loss rate of electricity transmission in power grid i | |
| Abbreviations | |
| LMDI | Logistic Mean Divided Index |
| NC | North China |
| NEC | Northeast China |
| EC | East China |
| CC | Central China |
| NWC | Northwest China |
| SC | South China |
| CESY | China Energy Statistical Yearbook |
| CPSY | China Power Statistical Yearbook |
| GWP | Global warming potential |
| ce | Standard coal equivalent |
References
- British Petroleum (BP). Statistical Review of World Energy; British Petroleum (BP): London, UK, 2020; Available online: https://www.bp.com/content/dam/bp/business-sites/en/global/corporate/pdfs/energy-economics/statistical-review/bp-stats-review-2022-full-report.pdf (accessed on 20 May 2023).
- State Council Information Office (SCIO) of China. Energy in China’s New Era. 2020. Available online: http://english.scio.gov.cn/whitepapers/2020-12/21/content_77035604.htm (accessed on 20 May 2023).
- Zhang, C.; Su, B.; Zhou, K.; Yang, S. Analysis of Electricity Consumption in China (1990–2016) using index decomposition and decoupling approach. J. Clean. Prod. 2019, 209, 224–235. [Google Scholar] [CrossRef]
- National Bureau of Statistics. China Statistical Yearbook; China Statistics Press: Beijing, China, 2022. Available online: http://www.stats.gov.cn/sj/ndsj/2022/indexeh.htm (accessed on 20 May 2023).
- Yuan, J.; Na, C.; Lei, Q.; Xiong, M.; Guo, J.; Hu, Z. Coal use for power generation in China. Resour. Conserv. Recycl. 2018, 129, 443–453. [Google Scholar] [CrossRef]
- Ma, J.J.; Du, G.; Xie, B.C. CO2 emission changes of China’s power generation system: Input-output subsystem analysis. Energy Policy 2019, 124, 1–12. [Google Scholar] [CrossRef]
- Cui, H.; Zhao, T.; Wu, R. CO2 emissions from China’s power industry: Policy implications from both macro and micro perspectives. J. Clean. Prod. 2018, 200, 746–755. [Google Scholar] [CrossRef]
- Ari, I.; Koksal, M.A. Carbon dioxide emission from the Turkish electricity sector and its mitigation options. Energy Policy 2011, 39, 6120–6135. [Google Scholar] [CrossRef]
- Cao, Y.; Wang, X.; Li, Y.; Tan, Y.; Xing, J.; Fan, R. A comprehensive study on low-carbon impact of distributed generations on regional power grids: A case of Jiangxi provincial power grid in China. Renew. Sustain. Energy Rev. 2016, 53, 766–778. [Google Scholar] [CrossRef]
- Lindner, S.; Liu, Z.; Guan, D.; Geng, Y.; Li, X. CO2 emissions from China’s power sector at the provincial level: Consumption versus production perspectives. Renew. Sustain. Energy Rev. 2013, 19, 164–172. [Google Scholar] [CrossRef]
- Harmsen, R.; Graus, W. How much CO2 emissions do we reduce by saving electricity? A focus on methods. Energy Policy 2013, 60, 803–812. [Google Scholar] [CrossRef]
- Ang, B.W.; Su, B. Carbon emission intensity in electricity production: A global analysis. Energy Policy 2016, 94, 56–63. [Google Scholar] [CrossRef]
- Wang, J.; He, S.; Qiu, Y.; Liu, N.; Li, Y.; Dong, Z. Investigating driving forces of aggregate carbon intensity of electricity generation in China. Energy Policy 2018, 113, 249–257. [Google Scholar] [CrossRef]
- Liu, N.; Ma, Z.; Kang, J. A regional analysis of carbon intensities of electricity generation in China. Energy Econ. 2017, 67, 268–277. [Google Scholar] [CrossRef]
- Popescu, G.H.; Andrei, J.V.; Nica, E.; Mieilă, M.; Panait, M. Analysis on the impact of investments, energy use and domestic material consumption in changing the Romanian economic paradigm. Technol. Econ. Dev. Econ. 2019, 25, 59–81. [Google Scholar] [CrossRef]
- Simionescu, M.; Albu, L.L.; Raileanu, M.; Bilan, Y. The impact of biofuels utilization in transport on the sustainable development in the European Union. Technol. Econ. Dev. Econ. 2017, 23, 667–686. [Google Scholar] [CrossRef]
- Zhao, Q.R.; Chen, Q.H.; Xiao, Y.T.; Tian, G.Q.; Chu, X.L.; Liu, Q.M. Saving forests through development? Fuelwood consumption and the energy-ladder hypothesis in rural Southern China. Transform. Bus. Econ. 2017, 16, 199–219. [Google Scholar]
- Saysel, A.K.; Hekimoğlu, M. Exploring the options for carbon dioxide mitigation in Turkish electric power industry: System dynamics approach. Energy Policy 2013, 60, 675–686. [Google Scholar] [CrossRef]
- Telsnig, T.; Tomaschek, J.; Özdemir, E.D.; Bruchof, D.; Fahl, U.; Eltrop, L. Assessment of selected CCS technologies in electricity and synthetic fuel production for CO2 mitigation in South Africa. Energy Policy 2013, 63, 168–180. [Google Scholar] [CrossRef]
- Mago, P.J.; Luck, R. Potential reduction of carbon dioxide emissions from the use of electric energy storage on a power generation unit/organic Rankine system. Energy Convers. Manag. 2017, 133, 67–75. [Google Scholar] [CrossRef]
- Van den Bergh, K.; Delarue, E.; D’haeseleer, W. Impact of renewables deployment on the CO2 price and the CO2 emissions in the European electricity sector. Energy Policy 2013, 63, 1021–1031. [Google Scholar] [CrossRef]
- Beidari, M.; Lin, S.J.; Lewis, C. Decomposition analysis of CO2 emissions from coal–sourced electricity production in South Africa. Aerosol. Air. Qual. Res. 2017, 17, 1043–1051. [Google Scholar] [CrossRef]
- Karmellos, M.; Kopidou, D.; Diakoulaki, D. A decomposition analysis of the driving factors of CO2 (Carbon dioxide) emissions from the power sector in the European Union countries. Energy 2016, 94, 680–692. [Google Scholar] [CrossRef]
- Sumabat, A.K.; Lopez, N.S.; Yu, K.D.; Hao, H.; Li, R.; Geng, Y.; Chiu, A.S.F. Decomposition analysis of Philippine CO2 emissions from fuel combustion and electricity generation. Appl. Energy 2016, 164, 795–804. [Google Scholar] [CrossRef]
- Chen, G.J.; Hou, F.J.; Chang, K.L.; Zhai, Y.B.; Du, Y.Q. Driving factors of electric carbon productivity change based on regional and sectoral dimensions in China. J. Clean. Prod. 2018, 205, 477–487. [Google Scholar] [CrossRef]
- Liao, C.Y.; Wang, S.G.; Zhang, Y.Y.; Song, D.; Zhang, C.H. Driving forces and clustering analysis of provincial-level CO2 emissions from the power sector in China from 2005 to 2015. J. Clean. Prod. 2019, 240, 118026. [Google Scholar] [CrossRef]
- Chen, G.J.; Hou, F.J.; Li, J.Q.; Chang, K.L. Decoupling analysis between carbon dioxide emissions and the corresponding driving forces by Chinese power industry. Environ. Sci. Pollut. Res. 2021, 28, 2369–2378. [Google Scholar] [CrossRef] [PubMed]
- Peng, X.; Tao, X.M. Decomposition of carbon intensity in electricity production: Technological innovation and structural adjustment in China’s power sector. J. Clean. Prod. 2018, 172, 805–818. [Google Scholar] [CrossRef]
- Wang, Q.; Jiang, X.T.; Li, R.R. Comparative decoupling analysis of energy-related carbon emission from electric output of electricity sector in Shandong Province, China. Energy 2017, 127, 77–78. [Google Scholar] [CrossRef]
- Steenhof, P.A.; Weber, C.J. An assessment of factors impacting Canada’s electricity sector’s GHG emissions. Energy Policy 2011, 39, 4089–4096. [Google Scholar] [CrossRef]
- Ang, B.W.; Goh, T. Carbon intensity of electricity in ASEAN: Drivers, performance and outlook. Energy Policy 2016, 98, 170–179. [Google Scholar] [CrossRef]
- The Climate Change Department of the Ministry of Ecological Environment of China. Baseline for Emission Factors of China’s Regional Power Grid. 2020. Available online: https://www.mee.gov.cn/ywgz/ydqhbh/wsqtkz/202012/W020201229610353340851.pdf (accessed on 12 June 2023). (In Chinese)
- He, Y.; Xing, Y.; Zeng, X.; Ji, Y.; Hou, H.; Zhang, Y.; Zhu, Z. Factors influencing carbon emissions from China’s electricity industry: Analysis using the combination of LMDI and K-means clustering. Environ. Impact Assess. Rev. 2022, 93, 106724. [Google Scholar] [CrossRef]
- Intergovernmental Panel on Climate Change. IPCC Guidelines for National Greenhouse Gas Inventories. 2006. Available online: http://www.ipcc-nggip.iges.or.jp/public/2006gl/index.html (accessed on 20 May 2023).
- Ang, B.W. The LMDI approach to decomposition analysis: A practical guide. Energy Policy 2005, 33, 867–871. [Google Scholar] [CrossRef]
- Ang, B.W.; Liu, N. Handling zero values in the logarithmic mean Divisia index decomposition approach. Energy Policy 2007, 35, 238–246. [Google Scholar] [CrossRef]
- National Bureau of Statistics. China Energy Statistical Yearbook, 2006–2021; China Statistics Press: Beijing, China, 2006–2021. (In Chinese) [Google Scholar]
- China Electricity Council. China Power Statistical Yearbook, 2006–2021; China Statistics Press: Beijing, China, 2006–2021. (In Chinese) [Google Scholar]
- National Development and Reform Commission of China. Guidelines for Provincial Greenhouse Gas Inventories. 2011. Available online: http://www.cbcsd.org.cn/sjk/nengyuan/standard/home/20140113/download/shengjiwenshiqiti.pdf (accessed on 20 May 2023). (In Chinese).


Disclaimer/Publisher’s Note: The statements, opinions and data contained in all publications are solely those of the individual author(s) and contributor(s) and not of MDPI and/or the editor(s). MDPI and/or the editor(s) disclaim responsibility for any injury to people or property resulting from any ideas, methods, instructions or products referred to in the content. |
© 2023 by the authors. Licensee MDPI, Basel, Switzerland. This article is an open access article distributed under the terms and conditions of the Creative Commons Attribution (CC BY) license (https://creativecommons.org/licenses/by/4.0/).