Article

A Rental Platform Service Supply Chain Network Equilibrium Model Considering Digital Detection Technology Investment and Big Data Marketing

School of Management, Jiangsu University, Zhenjiang 212003, China
*
Author to whom correspondence should be addressed.
Sustainability 2023, 15(13), 9955; https://doi.org/10.3390/su15139955
Submission received: 10 May 2023 / Revised: 2 June 2023 / Accepted: 20 June 2023 / Published: 22 June 2023
(This article belongs to the Special Issue Big-Data-Driven Sustainable Manufacturing)

Abstract

:
Digital transformation is reshaping the decision making management of the rental service mode in the manufacturing industry, and improving digital detection technology and big data marketing have become effective ways to create value. Based on the three-level rental platform service supply chain network structure composed of manufacturers, rental platform operators and the demand market, a supply chain network equilibrium model considering the digital detection technology input and big data marketing is constructed by using variational inequality and the Nash equilibrium theory, and the optimal decision making conditions of the manufacturers and rental platform operators are derived. Combined with the Euler algorithm design procedure and numerical examples, the influences of the digital detection technology level, big data marketing cost coefficient and cost sharing ratio on the equilibrium state are analyzed. The results show that the input of digital detection technology leads to the increase in profits of each participant in the rental platform service supply chain network and promotes a more coordinated development of the supply chain. When the rental platforms implement big data marketing, the manufacturers share the cost, which can continuously improve the profits of both partners and make the cooperation more stable and efficient.

1. Introduction

In the past few years, driven by the acceleration in technological iteration and the upgrade of consumption transformation, rental services that provide equipment usage rights rather than ownership have gradually become a significant way for manufacturing enterprises to transform into service-oriented businesses [1]. More and more manufacturers are opening service channels to offer equipment through rental services. A rental service is a “use-oriented” service model, which separates the right to use products from ownership so that consumers only need to pay for the current user needs, thus reducing the use cost for consumers. The distance between manufacturers and demand markets in time and space has led to the emergence of platforms as a new model, ultimately forming a rental platform service supply chain structure makeup of “manufacturer-rental platform operator-demand market”. The booming development of digital technology has impacted the operation of rental platforms, leading the members of the rental platform service supply chain network into a new era characterized by digitization [2]. In this situation, it is urgently necessary to provide a systematic explanation of how the participants of the rental platform service supply chain network decide and allocate benefits under the background of digitization, to ensure the benign operation of the whole rental service process.
The development of digitalization has promoted the rise of new business models represented by rental platforms. There are two main applications in the supply chain of rental platforms under the digital economy, namely, digital detection technology input and big data marketing [3,4,5]. However, the application of digital technology is not always beneficial. On the one hand, the rental platform is facing an increasingly complex and changeable business environment. While the operation, maintenance and management of equipment are optimized [6], the continuous input in digital detection technology will bring about an uneven distribution of benefits. On the other hand, under the current background that digitalization touches almost all aspects of human beings in the world, it is the general trend for participants in various industries to increase the market share through big data marketing [7], but with the increasing cost in the marketing process, the platform may be reluctant to carry out marketing in a later period. For example, Pangyuan Rental establishes intelligent system remote control machinery, realizes the digitalization of the whole process and enables the whole process of marketing through big data, but overall, the high cost is a more prominent pain point. Therefore, how digital detection technology input and big data marketing jointly affect the network equilibrium is the core issue of this study. On the theoretical plane, scholars’ research about the rental service supply chain is mainly focused on the positive impacts of different digital technologies on the development of manufacturing and rental service models, such as blockchain technology, artificial intelligence, big data technology [8,9,10] and other factors that influence the supply chain members’ profits. Studies found that different digital technologies can strengthen the collaboration between the levels, promote the platform’s sustainability, increase consumers’ willingness to use rental services, etc. [11]. These documents have begun to provide other value-adding services based on rental services, but they used to study a single chain in the past. Still, they did not deeply analyze the balance in the supply chain network of the rental platform services. Therefore, from the perspective of the supply chain network, this paper studies the decision making behaviors of supply chain members and how the input and output of digital detection technology reach network equilibrium after digital detection technology is conducted. With regard to the supply chain network equilibrium, although scholars have considered the background of the service-oriented manufacturing industry, they are still in the “product-oriented” mode of thinking [12,13], and have not considered the supply chain network equilibrium of the “use-oriented” rental service mode of the manufacturing industry. Consequently, this paper discusses how manufacturers share costs and how rental platform operators distribute benefits after big data marketing so as to maximize the profits of the supply chain members. Based on the background mentioned above, this research establishes a three-level rental PSSC network structure comprising manufacturers, demand markets and rental platform operators. In the basic structure, manufacturers produce new equipment and use the rental platform operator to rent the equipment to the demand market at the price and service level of each use; the rental platform operator uses big data for personalized marketing (such as producing equipment according to customer requirements, intelligently recommending products according to customer interests, etc.) to increase the probability of rental services to capture more economic benefits. This study considers the problem of balanced supply chain networks for digital detection technology investments and big data marketing strategies.
The contribution of this research is mainly embodied in three aspects. First, unlike the previous research on a single chain, this article uses the viewpoint of the supply chain network to explore its balance among rental platforms. Second, in the context of digitalization, this paper jointly considers the impact of manufacturers’ digital detection technology investment on the profits of network members, and the impact of big data marketing of rental platform operators on the equilibrium state of the entire network. Third, this study found that digital detection technology input would lead to rising profits of members in the rental platform service supply chain network. When manufacturers share the cost of big data marketing with rental platform operators, it is good for the profits of both parties.
The rest of this study is structured as follows. We conducted reviews on the relevant literature, which are outlined in Section 2. The symbols and supposition of the former are stated in Section 3. Next, we used variational inequalities to derive the equilibrium conditions of the manufacturer and the rental platform operator. Finally, we obtained the equilibrium requirements of the rental PSSC network, which are detailed in Section 4. The numerical calculations are given in Section 5, which aims to prove the effectiveness of our model and dissect the effects exerted by the related factors on the outcomes of equilibrium. We provide a couple of discussions about the computational results and views of economics and management in Section 6. Finally, we summarize this research in Section 7, come up with precise propositions for distinct subjects, point out some deficiencies of this research and show future study directions.

2. Literature Review

The summary of Section 2 includes the following three aspects: (1) related research review on the manufacturing rental service model, (2) research on supply chain digital technologies and (3) related research review on the supply chain network.

2.1. Manufacturing Rental Service Model

In recent years, customers have paid more attention to whether their demand was met rather than their possession of products. This trend promoted the development of the manufacturing rental service model [14]. The rental service industry is an important way to promote the integration of productive services and manufacturing. It can also push the extension of the manufacturing industry to the high end of the value chain. The development of a new generation of digital technologies such as big data, cloud computing and blockchain provides technical support to the development of the manufacturing and rental service model and further assists the manufacturing industry in obtaining higher value-adding points to stimulate and accelerate the transformation of the manufacturing industry from manufacturing to production and service [15]. Cai et al. [16] studied the moral risk of retailers in reporting the number of leased products. They pointed out that using blockchain technology and “discount” price reduction sponsorship contracts could help solve such moral risks. Information has important value for enterprises, and with the development of information technology, informatization has become the key point for the success of supply chain operations [17]. Choi [18] believes that using digital technology in the rental service process can help customers understand the product’s relevant information, thereby increasing the customers’ willingness to lease and help manufacturers to better achieve value creation. Auer et al. [19] proposed that the platform could facilitate rental services through digital technology to further promote the collaboration between the levels and minimize the trust issues between different stakeholders. In response to the manufacturing rental service model, scholars mainly studied digital technology problems. Scholars first explored the concept of rental services and pointed out the trend of renting purchases; regarding digital technology issues, scholars discussed the impacts of different digital technologies on all levels of the supply chain. This article selects digital testing technology and the big data marketing strategy, and applies them to the rental service model to ease the risk of lease service failure.

2.2. Research on Supply Chain Digital Technologies

In the current global business environment, the adoption of digital technologies in the supply chain is becoming increasingly important. Over the past decade, manufacturing companies have been exploring how to use emerging digital technologies such as the Internet of Things (IoT), big data analytics (BDA) and artificial intelligence (AI) in their supply chains [20]. Some studies put forward digital technology strategies to collect data from platforms to provide various services to keep the supply chain in a positive steady state [21], and to acquire or enhance the overall capability of the supply chain through the application of data and digital technologies [22]. The use of digital technology helps the platform service supply chain to obtain benefits in visibility, traceability and security [3] so that the transaction costs and risks in the supply chain service can be sufficiently alleviated [23]. In some cases, it is necessary to use digital technology to solve the problem of information asymmetry between enterprises. Manufacturers can predict the quality issues of the equipment in advance, and the demand market can also understand the situation in real time [8] to reduce concerns about service uncertainty. Throughout the process, with the continuous penetration of data and digital technology, digital technology also brings a “connection dividend” so that the entire data path of the demand market can be tracked and recorded in real time [24]. At this time, a big data marketing strategy must be adopted. Based on these accumulated data, we must portray the demanding market search behaviors [25], correctly infer consumers’ intentions and preferred actions [26] while accurately gaining insight into consumers’ changes in a timely manner and using big data to help the business make better decisions [9,10], enhance consumers’ experience [5,27], use digging and analyzing data to understand consumers’ demand preferences more clearly, enhance the conversion for the entire supply chain network management [28] and, finally, transform the big data marketing strategy into economic benefits. In addition, the service supply chain indicates, forecasts, analyzes and guides consumer behaviors based on data-driven analysis [29]. After the development of data-driven marketing [4], the profit growth rate is higher [5]. Aiming at the supply chain’s digital technologies, scholars combine the service supply chain and the digital technology. An empirical analysis and case analysis are usually adopted, and digital technology can help the platform service supply chain to reap benefits in visibility, transparency and security. These studies provide ideas for us to understand the digital technology category and to build digital-technology-related service supply chains; regarding the big data marketing strategies, scholars first pointed out the connotation of big data marketing and then revealed their mechanisms and the economic benefits brought by the supply chain of the platform. This study combines the service supply chain and digital technology and builds digital-technology-related functions, thereby increasing profits.

2.3. Supply Chain Network Equilibrium Model

The description of the network equilibrium model can be traced back to the field of transportation modeling, which was first proposed by Dafermos [30]. Nagurney et al. [31] creatively combined the limited dimensional, unlimited and equilibrium theories. They proposed the use of the supply chain network equilibrium model to the optimization problems of the supply chain management. Since the supply chain network equilibrium model can well explore the decision making interaction between the upstream and downstream members and the balanced conditions of interest distribution, it has attracted widespread attention from scholars. First of all, concentrating on the environmental damage and resource shortage, Nagurney and Toyasaki [12] took the lead in building a supply chain network equilibrium model by considering electronic waste recycling. Then, scholars also followed with a supplement in different perspectives such as policies and regulations [32], corporate social responsibility [33], consumers’ green preferences [34,35] and multi-cyclical planning [36]. Secondly, due to the growth of consumers’ demand and the intensification of the market competition, the volatility of the market demand has continued to increase. To this end, Dong et al. [37] promoted the balanced supply chain network to the scene of random demands and conducted research that was closer to the actual market situations. Moreover, with the gradual deepening of scholars’ research on the influence of behaviors and psychology on decision making subjects, limited rational behaviors such as regret avoidance [38] and altruistic preferences [39] were included in the consideration. The literature closely related to this article is a balanced study of supply chain networks under the background of the manufacturing service. Peng et al. [40] built a “product + service” supply chain network balance model based on the background of the manufacturing service. Peng et al. [41] incorporated risk management issues under the influence of the new crown epidemic into the study of the balanced model of the product service supply chain network. Xiao et al. [13] built a balanced supply chain network model taking account of the after-sales service and product quality. At present, scholars have conducted a lot of research on the “product-oriented” problem under the equilibrium of supply chain networks. However, in the context of digitalization, few studies in the literature have considered the supply chain network balancing of the “use-oriented” manufacturing rental service model.

3. Problem Statement and Formulation

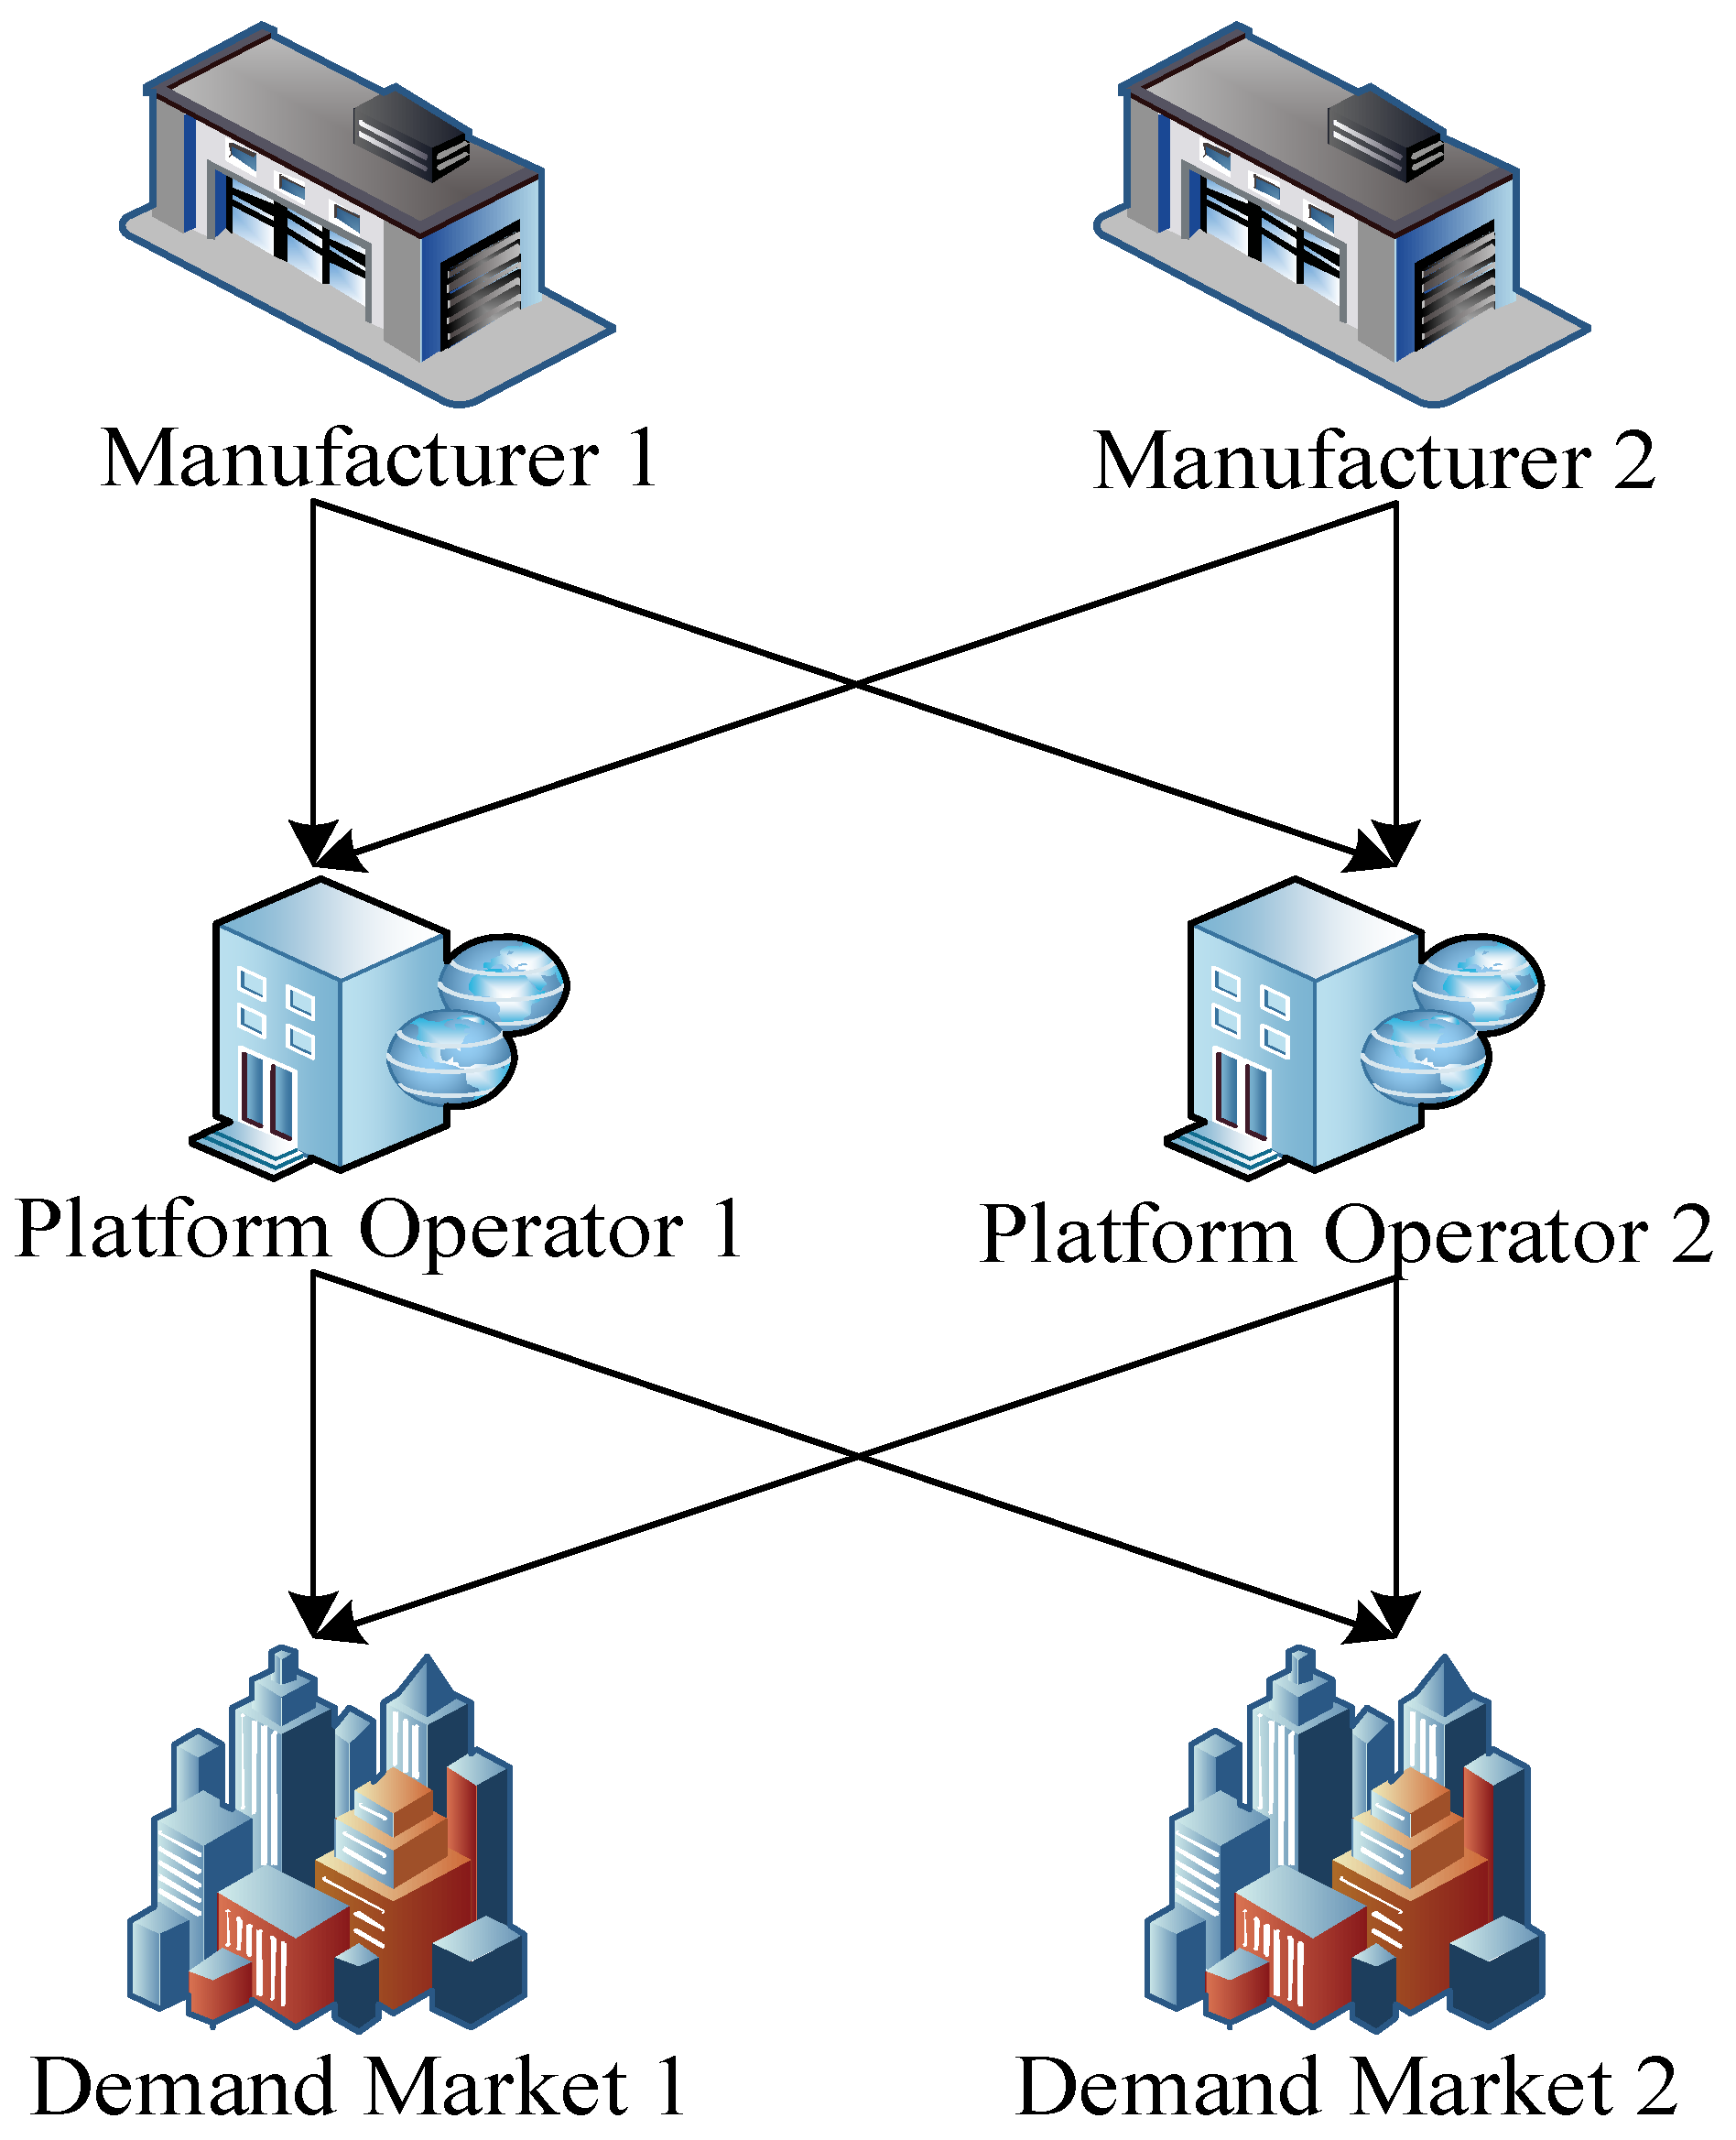
3.1. Problem Statement

This study intends to build a network topology structure of a rental platform to serve the supply chain. This system describes the behaviors of manufacturers, rental platform operators and demand markets, as shown in Figure 1. Assuming there are m manufacturers, typical manufacturers are expressed as i; n rental platform operators and typical rental platform operators are expressed as j; o expresses the demand market and the typical demand market is expressed as k. Members in the network conduct vertical cooperation due to common interest goals and to maximize their interests. In terms of details, the m manufacturers are responsible for providing specific functional services, and typical manufacturers are i; n rental platform operators are intermediary agencies that sell the manufacturers’ service and typical rental platform operators are j. o demand markets can choose services provided by different manufacturers from different rental platform operators, and the typical demand markets are k. Please note that manufacturers, rental platform operators and demand markets are located in the upper, middle and lower parts of the network. In this game, members of the same level in the network are guided by their profits to form a competitive relationship; adjacent non-similar members interact with each other to form a cooperative relationship.
Manufacturers provide rental services (for example, manufacturers are responsible for providing actual rental services for mechanical equipment). The rental platform operators (such as the Caterpillar rental store, Ctrip car rental, etc.) sell the services of manufacturers through the websites, mobile terminal APPs and other forms, and collect a certain amount of commission. Users can choose services provided by different manufacturers in different rental platform operators. However, during the rental service process, the imbalances of the input and output may restrict its benign operation. In addition, with the continuous increase in costs during the marketing process of the rental platforms, they may not be willing to carry out marketing in the later period. Therefore, the manufacturers need to use digital detection technology and share the platform’s cost to avoid the risk of rental service failures as much as possible to ensure that the supply chain members’ profits are maximized. The specific structure of the model is shown in Figure 1 below.

3.2. Notation Description

For promoting the building of the model and the analysis of the problem, the related notation descriptions are shown in Table 1.

3.3. Model Assumptions

Assumption 1.
In the structure of the rental PSSC network, all nodes of the manufacturers, the rental platform operators and the demand market are all rational decision makers who pursue their own profit or utility maximization, and the supply chain network reaches equilibrium through Nash non-cooperative competition among members at the same level and cooperation and interaction among members at different levels [40,41].
Assumption 2.
Consistent with the existing literature on the supply chain network equilibrium, all the related cost functions of the manufacturers and rental platform operators are continuously differentiable convex functions [40,41].
Assumption 3.
Assuming the probability of the risk of rental service failure (1-si), the higher the level of investment in the digital detection technology, the more risks that can be avoided. The level of digital inspection technology for each manufacturer i must meet si ≥ 0, referring to Daultani et al. and Nagurney et al. [42,43].
Assumption 4.
The rental platform agents sell the services of the manufacturer and charge a certain amount of commission. At the same time, the rental platform has consumer data, which can use data analysis technology to mine consumers’ demand and preference information, and then carry out precise marketing activities. The cost of the marketing efforts of the rental platform operator’s big data marketing is W j b j = 𝓁 b j 2 𝓁 b j , where 𝓁 > 0 is the cost factor and b j is the level of data marketing efforts needed to meet the increasing laws of marginal costs, referring to Ma et al. [27].

4. Model Building

4.1. Analysis of the Decision Making Behavior and Equilibrium Requirements of the Manufacturers

Manufacturers are rational decision makers, and their profits maximize their decision making behavior. The profit function expression of manufacturer i; i = 1, ..., m is shown below.
M a x U i 1 = ρ i j k Q i j k f i Q i j k c i j k 1 Q i j k v i s i , Q i j k 1 s i × r Q i j k π i j k
The constraint is as follows:
Q i j k 0
Among them, the first item of Formula (1) represents the benefits obtained by the manufacturer i who sells the rental service to the demand market through the rental platform operator. The second item provides the service provision cost (for example, the labor cost, resource cost, etc., of the rental service provision process) that correlates with Qijk. The third item is the rental service transaction cost (such as communication costs during transactions, etc.). The fourth item represents the digital detection technology input cost, which is related to the production quantity Qijk and the digital detection technology investment level si. The fifth item is the risk loss cost, which is correlated to the level of the digital detection technology input si. The last item is a rental commission. Constraint (2) guarantees that the decision making variables Qijk are not negative. We try to identify a pattern in which all manufacturers play a non-cooperative competitive Nash equilibrium game, where the optimization goal of each manufacturer is to maximize profits, and the associated cost function is a continuously differentiable convex function, referring to Daultani et al., Nagurney et al. and Nagurney and Wolf [42,43,44]. The simultaneous attainment of optimal requirements by all manufacturers can be expressed by the following variational inequality:
i = 1 m j = 1 n k = 1 o f i Q i j k Q i j k ρ i j k + c i j k 1 s i , Q i j k * Q i j k + v i Q i j k * Q i j k + π i j k * × Q i j k Q i j k * 0

4.2. Analysis of Decision Making Behavior and Equilibrium Conditions of the Layer of the Rental Platform Operators

Platform operators are also rational decision makers, using their profits as the goal. The platform operator j; j = 1, ..., ‘n’s profit function is as follows:
M a x U j 2 = Q i j k π i j k c i j k 2 Q i j k o c i j k π i j k w j b j
The constraints are the following:
π i j k 0 b j 0
Among them, the first item in Formula (4) represents the commission received by the rental platform operator j from the manufacturer. The second item represents the transaction cost generated during the rental service process, which is correlated to Qijk. The third item is the platform operator’s opportunity cost. The opportunity cost may include, for instance, the expected supervision cost and the losses of potential income when the price is too high, etc., which are related to the unit rental service commission π i j k received by the rental platform operator j from the manufacturer k. The last item is the big data marketing cost, and the specific expression is W j ( b j ) = a 2 ( b j ) 2 , which is proportional to the level of big data marketing, referring to Ma et al. and Nagurney et al. [27,43,44]. Finally, the restrictions shown in (5) ensure that the decision making variables π i j k and bj are non-negative.
Similar to the manufacturer’s analysis process, each rental platform operator performs a non-cooperative competition Nash equilibrium game between them, and the optimization function of every single rental platform operator can be converted into the following form based on the variational inequality theory:
i = 1 m j = 1 n k = 1 o π i j k * + c i j k 2 Q i j k * Q i j k × Q i j k Q i j k * + i = 1 m j = 1 n k = 1 o Q i j k * + o c i j k π i j k * π i j k × π i j k π i j k * + j = 1 n w j b j * b j × b j b j * 0

4.3. Analysis of Decision Making Behavior and Equilibrium Conditions of the Layer of the Demand Markets

ρk is the unit price that needs to be paid for the market consumers to obtain the rental service through the rental platform. dk is the market demand function of the rental service provided by the consumer market and k is a function of the price of the rental service, which is the function of the price, that is, dkj,si,bj).
ρijk is an endogenous variable for the transaction price of the consumer market through the rental platform and the manufacturer’s transaction price. The price of the rental service unit accepted by consumers, coupled with the cost of the unit during the rental service, is equivalent to the market demand prices. The success of the transaction, that is, the number of services (flow), is greater than 0. If not, the transaction is unsuccessful, and the number of services (flow) is 0, referring to Nagurney et al. [31], as follows:
ρ i j k * + c ^ i j k 3 Q i j k * = ρ k * , i f Q i j k * > 0 ρ k * , i f Q i j k * = 0
d k ρ k * , s i , b j * = Q i j k * , i f ρ k * > 0 Q i j k * , i f ρ k * = 0
Converting the above conditions into variational inequalities satisfies the following:
i = 1 m j = 1 n k = 1 o ρ i j k * + c ^ i j k 3 Q i j k * ρ k * × Q i j k Q i j k * + i = 1 m j = 1 n k = 1 o Q i j k * d k ρ k * , s i , b j * × ρ k ρ k * 0

4.4. Analysis of Equilibrium Conditions of the Entire Rental Platform Service Supply Chain Network

The meaning of the supply chain network equilibrium is that each panel point’s decision making acts in the network reach equilibrium together, meanwhile, the price level and the rate of the flow at equilibrium satisfy the sum of all the variational inequalities above. In other words, the optimum decision is born while the other panel points make the best decisions. The network is in equilibrium when the sum of the variational inequalities for each decision variable between the members of a node, from the manufacturer to the rental platform operator to the demand market, is satisfied. Therefore, by summing the above three variational inequalities (3), (6) and (9), we obtain the Nash equilibrium condition for the rental platform service supply chain network as follows: to determine Q i j k * , π i j k * , b j * , ρ k * Ω , we must make it meet
i = 1 m j = 1 n k = 1 o f i Q i j k Q i j k + c i j k 1 Q i j k * Q i j k + v i s i , Q i j k * Q i j k + c i j k 2 Q i j k * Q i j k + c ^ i j k 3 Q i j k * ρ k × Q i j k Q i j k * + i = 1 m j = 1 n k = 1 o Q i j k * + o c i j k π i j k * π i j k × π i j k π i j k * + j = 1 n w j b j * b j × b j b j * + i = 1 m j = 1 n k = 1 o Q i j k * d k ρ k * , s i , b j * × ρ k ρ k * 0
The variational inequality (9) is the result of adding and simplifying the variational inequalities (3), (6) and (9). In the course calculation, the unit rental service commission received by the rental platform operator j from manufacturer i is excluded. At last, we obtain the equilibrium requirements for the whole rental PSSC network.
We convert variational inequality (10) into the standard form as follows:
F i j k 1 X = f i Q i j k Q i j k + c i j k 1 Q i j k * Q i j k + v i s i , Q i j k * Q i j k + c i j k 2 Q i j k * Q i j k + c ^ i j k 3 Q i j k * ρ k F i j k 2 X = Q i j k * + o c i j k π i j k * π i j k F i j k 3 X = w j b j * b j F i j k 4 X = Q i j k * d k ρ k * , s i , b j *

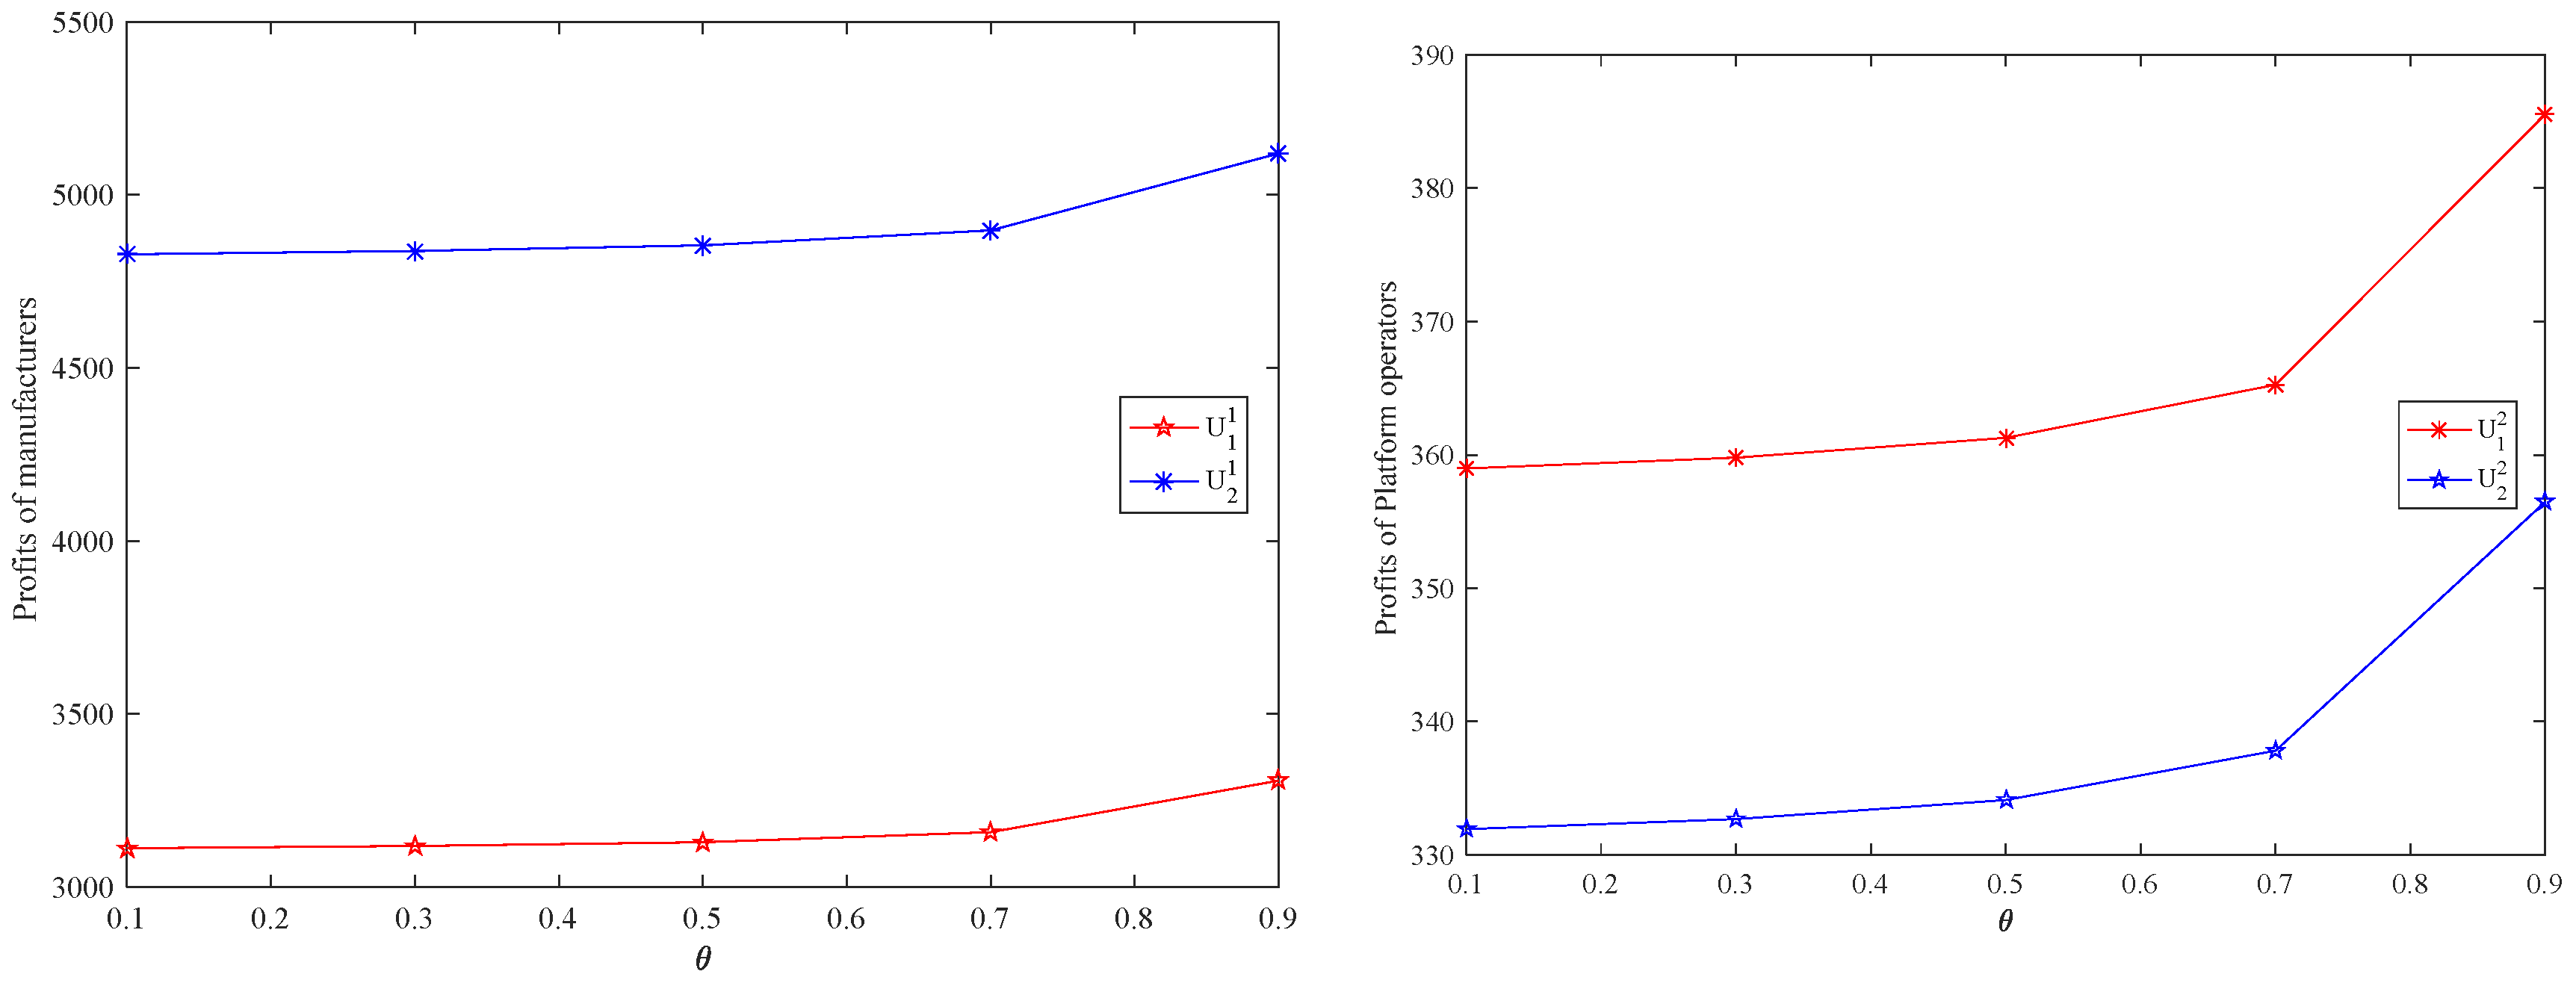
5. Numerical Analysis

Variational inequalities, which improve the classical variational problems, have been widely used in practical applications such as traffic network modeling and economic equilibrium. There are many algorithms that are used to solve variational inequality problems, among which the Euler algorithm is common. The Euler algorithm was derived from the iterative method proposed by Dupuis and Nagurney (1993), and its convergence was proven by scholars (Nagurney and Wolf, 2014; Nagurney et al., 2017). Because the Euler algorithm is convenient and fast to solve, easy to converge, and suitable for dealing with large-scale problems, this article uses the Euler algorithm to solve our model. Specifically, the iteration of the Euler algorithm τ is used as follows:
X τ + 1 = P κ X τ a τ F X τ
Among them, Pκ is the projection on the feasible set κ, and F is a function of an equilibrium condition of each decision variable.
We are preparing to apply the above Euler algorithm to the numerical calculations of this article to obtain the equilibrium requirements of the supply chain network and discuss the ways in which members in the network make decisions about their economic trading activities. We focus on the impact of the digital detection technology input cost coefficients, big data marketing cost coefficients and the proportion of the big data marketing cost sharing on the network equilibrium status. We set the sequence a τ = 1 1 , 1 2 , 1 2 , 1 3 , 1 3 , 1 3 , . By applying the matlabR2016a software package for the solution, the ending conditions are the absolute difference between the two continuous iterations, which does not exceed 0.001. To facilitate the solution of the model and the subsequent discussions, we suppose that each level of the rental PSSC network only includes two participants, and the precise structure is displayed in Figure 2.
The function expression in our paper and the related parameter settings chiefly refer to the study conducted by Nagurney and Wolf, etc., and are specifically shown below.
The production costs of manufacturers 1 and 2 are expressed as follows:
f 1 Q 1 , q 1 1 = 2 × Q 111 + Q 112 + Q 121 + Q 122 2 + Q 111 + Q 112 + Q 121 + Q 122
f 2 Q 2 , q 2 1 = Q 211 + Q 212 + Q 221 + Q 222 2 + Q 211 + Q 212 + Q 221 + Q 222
The costs of the rental services of manufacturers 1 and 2 are expressed as follows:
c 1 j k 1 Q 1 j k = 5 Q 1 j k + 3
c 1 j k 1 Q 1 j k = 7 Q 1 j k + 5
The costs of the rental services for rental platform operators 1 and 2 are expressed as follows:
c i 1 k 2 Q i 1 k = 0.5 Q i 1 k 2 + 2
c i 2 k 2 Q i 2 k = 0.5 Q i 2 k 2
The transaction costs of demand markets 1 and 2 are expressed as follows:
c i j 1 3 Q i j 1 = 0.1 Q i j 1 2 + 2
c i j 2 3 Q i j 2 = 0.2 Q i j 2 2 + 1
The digital detection technology input cost functions of manufacturers 1 and 2 are expressed as follows:
v 1 ( s 1 , Q 1 j k ) = α 2 s 1 2 Q 111 + Q 112 + Q 121 + Q 122
v 2 ( s 2 , Q 2 j k ) = β 2 s 2 2 Q 211 + Q 212 + Q 221 + Q 222
The costs of rental platform operators 1 and 2 are expressed as follows:
o c 111 π 111 = 0.5 π 111 2 o c 112 π 112 = 0.25 π 112 2 o c 121 π 121 = 0.1 π 121 2 o c 122 π 122 = 0.1 π 122 2 o c 211 π 211 = 0.25 π 211 2 o c 212 π 212 = 0.5 π 212 2 o c 221 π 221 = 0.1 π 221 2 o c 222 π 222 = 0.1 π 222 2
The rental platform operator big data marketing costs are expressed as follows:
w 1 b 1 = 𝓁 b 1 2 𝓁 b 1
w 2 b 2 = γ b 2 2 γ b 2
The demand functions are the following:
d 1 = 0.5 ρ 1 + 0.5 s 1 + s 2 + 0.7 b 1 + b 2 + 100
d 2 = 0.6 ρ 2 + 0.7 s 1 + s 2 + 0.5 b 1 + b 2 + 150
Example 1: The Euler algorithm converged in the iterative iterations 339 times and obtained the approximation value of the equilibrium solution shown in the table.
We analyze the impact of changes in the level of digital detection technology of leasing platform service supply chain network members on the equilibrium state of the network by changing s i .
Suppose α = β = 0.1, φ = 1, 𝓁 = γ = 0.1. Set s1 = s2 from 0.1 to increase it to 0.9. After iteration and convergence, the related value alterations are shown in Table 2 in the state of equilibrium.
The alterations of the values associated with manufacturers 1 and 2 and platform operators 1 and 2 are shown in Figure 3.
From Table 2, we can see that when investing the digital detection technology, all the main bodies benefit from this process, which means that the manufacturers increase the level of input in the digital detection technology to promote the profit of the rental platform service supply chain network. When the level of the digital detection technology input si increases from 0.1 to 0.9, the number of rental services of manufacturer 1 and manufacturer 2 Q i j k continues to increase. The rental service commissions π i j k of rental platform operator 1 and 2 have continued to rise. The rental platform operator big data marketing levels A and B remain unchanged during the increase in the digital detection technology investment levels, and the big data marketing levels of platform operators b 1 and b 2 are the same. The prices of demand market 1 and demand market 2 rental services ρ 1 and ρ 2 show an upward trend. In Figure 3, the profits of manufacturer 1 and manufacturer 2 gradually increase when si increases from 0.1 to 0.9. The profits of rental platform operator 1 and 2 gradually increase when si ∈ [0.1,0.9]. This shows that increasing the investment in the digital detection technology can stimulate the rental willingness of the downstream demand market and add vitality to the rental platform service supply chain. The profit of the manufacturers is much larger than the profit of the platform operators, and with the increase in the digital detection technology investment level si, the increase in the profits of the manufacturers is greater than the increase in the profits of the platform operators. In terms of profit, the profit of the manufacturers is always greater than that of the rental platform operators, which is in line with the current situation of rental in China’s manufacturing industry. In addition, the risk loss only affects the manufacturer’s profit. When the risk loss continues to increase, the profits of manufacturer 1 and manufacturer 2 continue to decline. In general, the greater the input in the digital detection technology, the more profitable the rental platform service supply chain network is as a whole, and the stronger its ability to avoid risks.
Example 2: While calculating Example 2, we discuss the influence of the rental platform operator’s big data marketing cost coefficient changes on the equilibrium state.
Suppose parameters s1 = s2 = 0.1, α = β = 0.1, φ = 1. Set 𝓁 = γ from 0.1 to increase it to 0.9. After iteration and convergence, the associated value alterations are shown in Table 3 in the state of equilibrium.
From Table 3, we can see that the big data marketing of the rental platform operators is conducive to the improvement in the total profit of the rental platform service supply chain, but the rental platform operators only need to carry out moderate marketing efforts, and do not have to increase the input all the time, as an input level that is too high will be counterproductive. In the context of digitalization, with the continuous improvement in the cost coefficient 𝓁 on the big data marketing level, the number of rental services of manufacturer 1 and manufacturer 2 Q i j k first rose and then remained unchanged. The prices of demand market 1 and demand market 2 rental services ρ 1 and ρ 2 increased as 𝓁 increased from 0.1 to 0.5, and remained unchanged. The profits of manufacturer 1 and manufacturer 2 rose when 𝓁 increased from 0.1 to 0.7 and remained unchanged. The profits of the rental platform operators 1 and 2 rose at 𝓁 ∈ [0.1,0.3], and continued to decline at 𝓁 ∈ [0.3,0.9], indicating that too much big data marketing by the rental platform operators will have the opposite effect.
With the initial increase in the big data marketing costs, the manufacturers and rental platform operators’ profits show an upward trend. The direct reason is that the number of rental services brought by the big data marketing increases, and the increase in the price of leasing services. It is obvious that big data marketing is efficient and necessary for manufacturers and rental platform operators. Of course, the high marketing level of the network platform operators will result in higher commissions for the manufacturers, leading to an increase in the cost of manufacturers. There may be a phenomenon of a short-term profit decline, but the overall trend is still upward.
Example 3: Variation of Example 2.
In Example 3, we used the same data as Example 2. Still, the big data marketing cost function of our rental platform operator allows manufacturers to share the cost of the rental platforms to discuss the effect of the proportion of big data marketing cost sharing θ on the equilibrium state.
The profit function of the new manufacturer is as follows:
M a x U i 1 = ρ i j k Q i j k f i Q i j k c i j k 1 Q i j k v i s i , Q i j k 1 s i × r Q i j k π i j k θ w j b j
The profit function of the new manufacturer is as follows:
M a x U j 2 = Q i j k π i j k c i j k 2 Q i j k o c i j k π i j k ( 1 θ ) w j b j
The algorithm was iterated 340 times and obtained the equilibrium mode shown in Figure 4.
Suppose parameters s1 = s2 = 0.1, α = β = 0.1, 𝓁 = γ = 0.1. The setting θ increases from 0.1 to 0.9 with an increase of 0.2. After iteration and convergence, the associated profit alterations are shown in Figure 4 in the state of equilibrium.
From Figure 4, we can see that as the cost-sharing ratio of the big data marketing increases from 0.1 to 0.2 to 0.9, the profits of manufacturer 1 and manufacturer 2, as well as the profits of rental platform operators 1 and 2, have an increasing trend. By comparing Example 2, it can be seen that after the manufacturer shares the cost of the rental platform, part of the big data marketing cost of the rental platform operator was shared, and the profits of both sides increase. Moreover, the higher the proportion of the cost shared by the manufacturer to the total cost, the greater the profit growth of both sides. It can be seen that the manufacturer strengthens the connection with the rental platform through cost sharing, and further strengthens the supply chain collaboration among the manufacturers, the rental platform operators and the demand market for the purpose of improving the profit and sustainability of the supply chain.

6. Discussion

In this section, we discuss the calculation results of the above three examples. Here, we discuss the impact of the digital detection technology investment in the digital background on the membership value creation of the rental platform service supply chain network. This section mainly focuses on the interpretation of the calculation results and provides corresponding management opinions.

6.1. Discussion of Theoretical Significance

By observing Table 2 and Figure 3 in Example 1, it can be seen that with the continuous improvement in the digital detection technology, the number of rental services, commissions, prices and profits of the entire rental platform service supply chain network are rising. We can conclude that in the context of digitalization, digital testing technology investment is an important factor in which the risk of rental services is alleviated, and the reliability of rental services increases, thereby enhancing the stability of the supply chain. In the mechanical and equipment rental industry, using digital detection technology for the data collection and management of the entire business process can effectively reduce the lease accident rate, ensure security and achieve sustainable business. This discovery is similar to that of Auer et al. [19]. Therefore, increasing the cost of digital detection technology is conducive to the entire rental platform service supply chain network to actualize value creation.
By observing Table 3 in Example 2, it can be seen that the number of rental services remained unchanged after a certain growth because the total market capacity and penetration rate (MPI) may have reached a specific limit. To change, it is difficult to further increase the conversion rate under the marketing methods of the same model, so the market share is relatively fixed. In addition, in a more mature and transparent market environment, it is more difficult for the premium situation to occur, and the sales price tends to stabilize. In the long run, the manufacturers’ profits are still increasing. In the process of sustainable development in the later market, the number of operators of rental platforms increase, and the increasingly fierce competition between them has caused a continuous decrease in commissions, leading to a reduction in the cost of the manufacturer. We found that when the 𝓁 was around 0.3, the profit of the rental platform operator peaked, and big data marketing could not further expand the market. If the rental platform operator continues to invest in big data marketing costs, the additional costs invested did not lead to additional leasing revenue, resulting in a decline in the profit of the rental platform operators. In order for the rental platform to be willing to carry out big data marketing work, it is necessary for manufacturers to share the cost with the platform to restore it.
By observing Figure 4 in Example 3, it can be seen that the operator of the rental platform can complete the marketing work with previous equal amounts at a lower cost after sharing the cost. Platform operators will have a greater willingness to carry out marketing work, and the more manufacturers share, the more the rental platform operators will increase their marketing efforts. For manufacturers, the continuous growth in the lease services represents a higher market share and larger sales. Therefore, although the manufacturer increased the marketing costs, the profit that this brings is generous [45].

6.2. Realistic Management Discussion

Digital testing technology eliminates the concerns of the demand market regarding the uncertainty of rental services, which helps manufacturers reveal the advantages of improving the market satisfaction and expanding the market share. This is one of the main reasons for the demand market to increase the willingness of rental services. In order to obtain more profits, on the one hand, members of the rental platform service supply chain can efficiently manage a business through the expansion of digital detection technology and improve the collaboration efficiency between the levels. For example, the construction machinery rental platform of the Siecheng Bing Machinery Network automatically collects the time and data of the equipment, opens it with the financial system of the enterprise, automatically generates accounting, and improves the efficiency of the equipment settlement. When these measures can enrich the digital detection technology functions, the entire rental platform service supply chain network digital detection technology input level and profit will “jump”. On the other hand, the members of the rental platform service supply chain can expand target customers through big data collection and analysis functions to open source. For example, rental platform operators portray user portraits through big data marketing methods and conduct targeted advertising, search and promotion activities, etc. [46]. In the long run, expanding the cost of digital detection technology can balance the income brought by customers and the cost of digital detection technology. Manufacturers that provide rental services, service quality and stability are the most important, to some extent, to determine the market performance of their equipment. Expanding the scope of digital detection technology can improve the efficiency of the collaboration among different levels within manufacturers and detect, solve and prevent problems early on. With the deepening of market digitalization, enriching digital detection technology may bring profit growth from multiple perspectives.
From a practical viewpoint, the growth of total sales has benefited from the growth of the advertising base, and the precise investment of information under big data analysis has significantly improved the common role of the advertising conversion rate (CVR). In addition, due to the accuracy delivery of information,, the positioning of the user’s demand is strong, and the decision making time is short. Therefore, the sensitivity to the price is low, and it is easier to accept the proper premium that may exist. When the rental platform service supply chain members conduct big data marketing, they should first accurately judge the market capacity and increase the marginal output brought about by the large data marketing cost. Therefore, accurate big data marketing means can efficiently expand the rental market and tap more potential benefits, thereby increasing the profits at all levels of the supply chain system. The key competitiveness of the rental platform operators in selling the manufacturers’ services lies in their mastery of the market information and the accuracy of their decision making. The market is changing, and the data are floating all the time. Only by grasping and analyzing the key data, such as the market capacity, product penetration rate and customer conversion rate at any time, can we make accurate marketing decisions and improve the marginal benefit of the cost input. Moreover, when the profits of the platform operators reach the preset peak, they should not stop their efforts, but work with the manufacturers to develop and innovate, adapt to market changes and explore more possibilities for development. In addition, the study shows that when the manufacturer shares the cost of big data marketing, the profits of the manufacturer and the rental platform operator increase at the same time, and the higher the proportion of the cost shared by the manufacturer to the total cost, the greater the profit growth of both sides. Therefore, we suggest that manufacturers and platforms share the cost of big data marketing. This study provides a basis for the distribution of benefits of the rental platform supply chain.

7. Conclusions

Under the background of digitalization, manufacturers and rental platform operators provide efficient services to consumers through digital detection technology input and big data marketing. Some scholars combine rental services with digital technology, and propose that the adoption of digital technology can help the rental service supply chain gain benefits in terms of visibility, transparency and security; in the past, it was a single chain seldom viewed from the perspective of the supply chain network, and at the same time, the technical elements of the digital detection technology input and big data marketing were incorporated into the balanced network research of the rental platform service supply chain [15,16,17]. This paper combines the characteristics of the rental platform service supply chain, and considers the rental platform service supply chain network structure, which comprises multiple competing manufacturers and multiple competing rental platform operators. Variational inequalities were used to characterize the equilibrium conditions of the decisions of the manufacturers and the rental platform operators, respectively. An equilibrium model of the rental platform service supply chain network is established in the context of digitalization, considering the input of digital detection technology and big data marketing. A modified projection algorithm is used to solve the model. Through numerical examples, this paper discusses the impact of the input level of digital detection technology, the cost coefficient of the big data marketing level and the cost-sharing ratio of big data marketing on the equilibrium state of the PSSC network’s participants. The results show that increasing the input in digital detection technology can effectively improve the level of equipment management and operation and allow manufacturers to better operate and maintain their equipment, thereby improving customers’ rental satisfaction, obtaining more profits for enterprises and platforms and promoting more benign development of the industry. For rental platform operators, big data marketing plays a leading role in the supply chain; if the manufacturer shares the cost of big data marketing, the profits of both partners can continuously improve, which will make their cooperation more stable and efficient.
This study still has certain limitations. Future research can expand this study in the following two aspects. First of all, this research did not consider the budget constraints of digital detection technology investment and big data marketing. Considering the financial restrictions of members of the leasing platform service supply chain network, it is also an interesting research direction to take budget constraints into account. Second, the model of this study assumes that the decisions made by all the members of the rental platform service supply chain network are completely rational. Future research should take limited rationality (such as fairness and concern, altruistic preferences, etc.) into consideration based on this thesis.

Author Contributions

This research was developed by both authors (Y.P. and H.L.). All authors have read and agreed to the published version of the manuscript.

Funding

This research was supported by the National Natural Science Foundation of China (grant No. 71802099), the Social Science Foundation of Jiangsu Province (grant No. 21GLC005) and the Key Project of Philosophy and Social Science Research in Colleges and Universities in Jiangsu Province (grant No. 2020SJZDA062).

Institutional Review Board Statement

Not applicable.

Informed Consent Statement

Not applicable.

Data Availability Statement

Not applicable.

Conflicts of Interest

The authors declare no conflict of interest.

References

  1. Martinelli, E.M.; Farioli, M.C.; Tunisini, A. New companies’ DNA: The heritage of the past industrial revolutions in digital transformation. J. Manag. Gov. 2021, 25, 1079–1106. [Google Scholar] [CrossRef]
  2. Etemadi, N.; Borbon-Galvez, Y.; Strozzi, F.; Etemadi, T. Supply chain disruption risk management with blockchain: A dynamic literature review. Information 2021, 12, 70. [Google Scholar] [CrossRef]
  3. Ma, J.Y.; Shi, L.; Kang, T.W. The Effect of Digital Transformation on the Pharmaceutical Sustainable Supply Chain Performance: The Mediating Role of Information Sharing and Traceability Using Structural Equation Modeling. Sustainability 2023, 15, 649. [Google Scholar] [CrossRef]
  4. Liu, W.; Yan, X.; Li, X.; Wei, W. The impacts of market size and data-driven marketing on the sales mode selection in an Internet platform based supply chain. Transp. Res. Part E Logist. Transp. Rev. 2020, 136, 101914. [Google Scholar] [CrossRef]
  5. Li, K.; Dai, G.; Xia, Y.; Mu, Z.; Zhang, G.; Shi, Y. Green Technology Investment with Data-Driven Marketing and Government Subsidy in a Platform Supply Chain. Sustainability 2022, 14, 3992. [Google Scholar] [CrossRef]
  6. Jankovic-Zugic, A.; Medic, N.; Pavlovic, M.; Todorovic, T.; Rakic, S. Servitization 4.0 as a Trigger for Sustainable Business: Evidence from Automotive Digital Supply Chain. Sustainability 2023, 15, 2217. [Google Scholar] [CrossRef]
  7. Balakrishnan, A.S.; Usha, R. The role of digital technologies in supply chain resilience for emerging markets’ automotive sector. Supply Chain. Manag. 2021, 26, 654–671. [Google Scholar]
  8. Xu, Q.; He, Y. Optimal information disclosure strategies for a retail platform in the blockchain technology era. Int. J. Prod. Res. 2021, 61, 3781–3792. [Google Scholar] [CrossRef]
  9. Chong, A.Y.L.; Ch’ng, E.; Liu, M.J.; Li, B. Predicting consumer product demands via Big Data: The roles of online promotional marketing and online reviews. Int. J. Prod. Res. 2017, 55, 5142–5156. [Google Scholar] [CrossRef] [Green Version]
  10. Sweetwood, A. The Analytical Marketer: How to Transform Your Marketing Organization; Harvard Business Review Press: Boston, MA, USA, 2016. [Google Scholar]
  11. Khan, S.A.R.; Godil, D.I.; Jabbour, C.J.C.; Shujaat, S.; Razzaq, A.; Yu, Z. Green data analytics, blockchain technology for sustainable development, and sustainable supply chain practices: Evidence from small and medium enterprises. Ann. Oper. Res. 2021, 1–25. [Google Scholar] [CrossRef]
  12. Nagurney, A.; Toyasaki, F. Reverse supply chain management and electronic waste recycling: A multitiered network equilibrium framework for e-cycling. Transp. Res. Part E Logist. Transp. Rev. 2005, 41, 1–28. [Google Scholar] [CrossRef]
  13. Xiao, Y.X.; Zhang, R.Q. Supply chain network equilibrium considering coordination between after-sale service and product quality. Comput. Ind. Eng. 2023, 175, 108848. [Google Scholar] [CrossRef]
  14. Tan, X.; Yuan, Z.; Wang, Y. Financial leasing, factor circulation and supply chain competitiveness: Taking equipment manufacturing enterprises as an example. Int. J. Logist. Res. Appl. 2022, 1–26. [Google Scholar] [CrossRef]
  15. Ren, X.; Herty, M.; Zhao, L. Optimal price and service decisions for sharing platform and coordination between manufacturer and platform with recycling. Comput. Ind. Eng. 2020, 147, 106586. [Google Scholar] [CrossRef]
  16. Cai, Y.J.; Choi, T.M.; Zhang, J. Platform supported supply chain operations in the blockchain era: Supply contracting and moral hazards. Decis. Sci. 2021, 52, 866–892. [Google Scholar] [CrossRef]
  17. Qu, S.J.; Shu, L.L.; Yao, J.Y. Optimal pricing and service level in supply chain considering misreport behavior and fairness concern. Comput. Ind. Eng. 2023, 174, 108759. [Google Scholar] [CrossRef]
  18. Choi, T.M.; Feng, L.; Li, R. Information disclosure structure in supply chains with rental service platforms in the blockchain technology era. Int. J. Prod. Econ. 2020, 221, 107473. [Google Scholar] [CrossRef]
  19. Auer, S.; Nagler, S.; Mazumdar, S.; Mukkamala, R.R. Towards blockchain-IoT based shared mobility: Car-sharing and leasing as a case study. J. Netw. Comput. Appl. 2022, 200, 103316. [Google Scholar] [CrossRef]
  20. Yang, M.; Fu, M.; Zhang, Z. The adoption of digital technologies in supply chains: Drivers, process and impact. Technol. Forecast. Soc. Chang. 2021, 169, 120795. [Google Scholar] [CrossRef]
  21. Liang, L.; Han, Z.; Xie, J.; Wang, J.; Shi, N.; Zhu, W. S&T Innovation Platform Sharing Service Contract Mechanism to Achieve Supply Chain Resilience. Sustainability 2022, 14, 14124. [Google Scholar]
  22. Peng, Y.; Chen, B.; Veglianti, E. Platform Service Supply Chain Network Equilibrium Model with Data Empowerment. Sustainability 2022, 14, 5419. [Google Scholar] [CrossRef]
  23. De Giovanni, P. Blockchain and smart contracts in supply chain management: A game theoretic model. Int. J. Prod. Econ. 2020, 228, 107855. [Google Scholar] [CrossRef]
  24. Peng, Y.; Chen, B.; Lee, C.C. Equilibrium in platform service supply chain network with quality and innovation considering digital economy. Ann. Oper. Res. 2023, 1–30. [Google Scholar] [CrossRef]
  25. Kim, J.B.; Albuquerque, P.; Bronnenberg, B.J. Mapping online consumer search. J. Mark. Res. 2011, 48, 13–27. [Google Scholar] [CrossRef] [Green Version]
  26. Wang, L.; Li, Q.; Lam, J.; Wang, Z.; Zhang, Z. Intent inference in shared-control teleoperation system in consideration of user behavior. Complex Intell. Syst. 2021, 8, 2971–2981. [Google Scholar] [CrossRef]
  27. Ma, D.; Hu, J. Research on collaborative management strategies of closed-loop supply chain under the influence of big-data marketing and reference price effect. Sustainability 2020, 12, 1685. [Google Scholar] [CrossRef] [Green Version]
  28. Li, X. Reducing channel costs by investing in smart supply chain technologies. Transp. Res. Part E Logist. Transp. Rev. 2020, 137, 101927. [Google Scholar] [CrossRef]
  29. Figueiredo, F.; Gonçalves, M.J.A.; Teixeira, S. Information Technology Adoption on Digital Marketing: A Literature Review. Informatics 2021, 8, 74. [Google Scholar] [CrossRef]
  30. Dafermos, S. Isomorphic multiclass spatial price and multimodal traffic network equilibrium models. Reg. Sci. Urban Econ. 1986, 16, 197–209. [Google Scholar] [CrossRef]
  31. Nagurney, A.; Dong, J.; Zhang, D. A supply chain network equilibrium model. Transp. Res. Part E Logist. Transp. Rev. 2002, 38, 281–303. [Google Scholar] [CrossRef]
  32. Zhang, G.; Cheng, P.; Sun, H.; Shi, Y.; Zhang, G.; Kadiane, A. Carbon reduction decisions under progressive carbon tax regulations: A new dual-channel supply chain network equilibrium model. Sustain. Prod. Consum. 2021, 27, 1077–1092. [Google Scholar] [CrossRef]
  33. Hsueh, C.F.; Chang, M.S. Equilibrium analysis and corporate social responsibility for supply chain integration. Eur. J. Oper. Res. 2008, 190, 116–129. [Google Scholar] [CrossRef]
  34. Cheng, P.; Ji, G.; Zhang, G.; Shi, Y. A closed-loop supply chain network considering consumer’s low carbon preference and carbon tax under the cap-and-trade regulation. Sustain. Prod. Consum. 2022, 29, 614–635. [Google Scholar] [CrossRef]
  35. Li, D.; Cruz, J.M. Multiperiod supply chain network dynamics under investment in sustainability, externality cost, and consumers’ willingness to pay. Int. J. Prod. Econ. 2022, 247, 108441. [Google Scholar] [CrossRef]
  36. Duan, C.; Yao, F.; Li, Z.; Yu, H. Multi-period closed-loop supply chain network equilibrium considering CSR investment and sharing mechanism. Manag. Decis. Econ. 2022, 43, 1579–1595. [Google Scholar] [CrossRef]
  37. Dong, J.; Zhang, D.; Nagurney, A. A supply chain network equilibrium model with random demands. Eur. J. Oper. Res. 2004, 156, 194–212. [Google Scholar] [CrossRef]
  38. Chan, C.K.; Zhou, Y.; Wong, K.H. An equilibrium model of the supply chain network under multi-attribute behaviors analysis. Eur. J. Oper. Res. 2019, 275, 514–535. [Google Scholar] [CrossRef]
  39. Wan, X.; Jiang, B.; Li, Q.; Hou, X. Dual-channel environmental hotel supply chain network equilibrium decision under altruism preference and demand uncertainty. J. Clean. Prod. 2020, 271, 122595. [Google Scholar] [CrossRef]
  40. Peng, Y.; Xu, D.; Li, Y.; Wang, K. A product service supply chain network equilibrium model considering capacity constraints. Math. Probl. Eng. 2020, 2020, 1295072. [Google Scholar] [CrossRef]
  41. Peng, Y.; Xu, D.; Veglianti, E.; Magnaghi, E. A product service supply chain network equilibrium considering risk management in the context of COVID-19 pandemic. J. Ind. Manag. Optim. 2023, 19, 3459–3482. [Google Scholar] [CrossRef]
  42. Daultani, Y.; Kumar, S.; Vaidya, O.S.; Tiwari, M.K. A supply chain network equilibrium model for operational and opportunism risk mitigation. Int. J. Prod. Res. 2015, 53, 5685–5715. [Google Scholar] [CrossRef]
  43. Nagurney, A.; Daniele, P.; Shukla, S. A supply chain network game theory model of cybersecurity investments with nonlinear budget constraints. Ann. Oper. Res. 2017, 248, 405–427. [Google Scholar] [CrossRef]
  44. Nagurney, A.; Wolf, T. A Cournot–Nash–Bertrand game theory model of a service-oriented Internet with price and quality competition among network transport providers. Comput. Manag. Sci. 2014, 11, 475–502. [Google Scholar] [CrossRef]
  45. Chen, H.; Song, L.; Liu, S.; Fang, Z.; He, L. An optimal cost-sharing incentive model of main manufacturer-suppliers for complex equipment under grey information. J. Grey Syst. 2013, 25, 41. [Google Scholar]
  46. Xiang, Z.; Xu, M. Dynamic cooperation strategies of the closed-loop supply chain involving the internet service platform. J. Clean. Prod. 2019, 220, 1180–1193. [Google Scholar] [CrossRef]
Figure 1. Rental PSSC network structure.
Sustainability 15 09955 g001
Figure 2. Network structure diagram of numerical examples.
Sustainability 15 09955 g002
Figure 3. The effect of digital detection technology input level on manufacturers’ and rental platform operators’ profit.
Sustainability 15 09955 g003
Figure 4. The impact of changes in the sharing ratio of big data marketing costs in rental platform operations on the number and profit of rental services.
Sustainability 15 09955 g004
Table 1. Notation description.
NotationDefinition
i 1 , 2 , , m A typical manufacturer; there is a total of m manufacturers
j 1 , 2 , , n A typical rental platform operator; there are n rental platform operators
k 1 , 2 , , o A typical demand market; there is a total of o demand markets
Q i j k The number of rental services
ρ i j k The price of rental services
s i The digital detection technology investment level of manufacturer i
π i j k Rental platform operator j’s unit rental service commission received from manufacturer i
φ The proportion of risk loss cost undertaken by the manufacturer
b j The big data marketing level of rental platform operator j
θThe allocation ratio of big data marketing cost
f i Q i j k The rental service provision cost
c i j k 1 Q i j k The transaction cost of manufacturer i
o c i j k π i j k The opportunity cost of platform operator j
v i s i , Q i j k The digital detection technology investment cost of manufacturer i
R i j s i The risk loss cost
c i j k 2 Q i j k The transaction cost of rental platform operator j
W j b j The big data marketing cost of rental platform operator j
Table 2. The impact of the coefficient of the manufacturer’s digital detection technology on the equilibrium of the network.
s i 0.10.30.50.70.9
Q i j k Q1jk37.438137.497837.55737.615637.6738
Q2jk68.653668.764868.874968.984169.0921
π i j k π 111 13.403313.413913.424313.434613.4447
π 112 18.106818.157318.207418.257118.3065
π 121 16.134216.149216.164016.178616.1931
π 122 6.50506.52076.53626.55166.5669
π 211 50.997451.058351.118651.178251.2371
π 212 18.505418.546118.586518.626518.6663
π 221 26.535626.567626.599226.630526.6614
π 222 10.699010.721810.744410.766810.7890
b j b 1 0.48610.48610.48610.48610.4861
b 2 0.48610.48610.48610.48610.4861
ρ k ρ 1 180.3552180.6254180.8971181.1702181.4449
ρ 2 175.2124175.5024175.7937176.0865176.3807
Notes: Q 1 j k , Q 2 j k are the rental services of manufacturer 1 and manufacturer 2; π i 1 k , π i 2 k are the rental services for manufacturer 1 and manufacturer 2 units; b 1 , b 2 are the big data marketing levels of rental platform operator 1 and rental platform operator 2; ρ 1 , ρ 2 are the prices of demand market 1 and demand market 2 rental services; U 1 1 , U 2 1 are the profits of manufacturer 1 and manufacturer 2 and U 1 2 , U 2 2 are the profits of the rental platform operators 1 and 2.
Table 3. The impact of big data marketing cost coefficient changes on the equilibrium state.
𝓁 0.10.30.50.70.9
Q i j k Q1jk37.438137.443437.443437.443437.4434
Q2jk68.653668.663968.663968.663968.6639
π i j k π 111 13.403313.406913.406913.406913.4069
π 112 18.106818.106818.106818.106518.1065
π 121 16.134216.137916.138016.137816.1378
π 122 6.50506.50576.50576.50576.5057
π 211 50.997451.007451.007851.006951.0069
π 212 18.505418.507818.507918.507918.5079
π 221 26.535626.541026.541126.540826.5408
π 222 10.699010.700510.700510.700510.7005
b j b 1 0.48610.50000.50000.50000.5000
b 2 0.48610.50000.50000.50000.5000
ρ k ρ 1 180.3552180.3812180.3813180.3813180.3813
ρ 2 175.2124175.2360175.2361175.2361175.2361
U i 1 U 1 1 3109.91213110.8155 3110.81843110.82273110.8227
U 2 1 4825.22614826.53984826.53334826.56034826.5603
U j 2 U 1 2 358.6209358.7222358.6972358.6722358.6472
U 2 2 331.6001331.6955331.6718331.6434331.6184
Notes: Q 1 j k , Q 2 j k are the rental services of manufacturer 1 and manufacturer 2; π i 1 k , π i 2 k are the rental services for manufacturer 1 and manufacturer 2 units; ρ 1 , ρ 2 are the prices of demand market 1 and demand market 2 rental services; U 1 1 , U 2 1 are the profits of manufacturer 1 and manufacturer 2 and U 1 2 , U 2 2 are the profits of rental platform operators 1 and 2.
Disclaimer/Publisher’s Note: The statements, opinions and data contained in all publications are solely those of the individual author(s) and contributor(s) and not of MDPI and/or the editor(s). MDPI and/or the editor(s) disclaim responsibility for any injury to people or property resulting from any ideas, methods, instructions or products referred to in the content.

