Article

Multi-Objective Energy Optimization with Load and Distributed Energy Source Scheduling in the Smart Power Grid

1
Electrical Engineering Department, College of Engineering, Najran University, Najran 11001, Saudi Arabia
2
Department of Electrical Engineering, University of Engineering and Technology, Mardan 23200, Pakistan
3
Department of Telecommunication Engineering, University of Engineering and Technology, Mardan 23200, Pakistan
4
Department of Electrical Engineering, Lahore College for Women University, Lahore 51000, Pakistan
5
Department of Electrical Engineering, University of Engineering and Technology, Peshawar 25000, Pakistan
6
Department of Electrical Engineering, CECOS University of IT and Emerging Sciences, Peshawar 25100, Pakistan
7
Air Conditioning and Refrigeration Techniques Engineering Department, Al-Mustaqbal University College, Babylon 51001, Iraq
*
Author to whom correspondence should be addressed.
Sustainability 2023, 15(13), 9970; https://doi.org/10.3390/su15139970
Submission received: 27 April 2023 / Revised: 8 June 2023 / Accepted: 12 June 2023 / Published: 22 June 2023

Abstract

:
Multi-objective energy optimization is indispensable for energy balancing and reliable operation of smart power grid (SPG). Nonetheless, multi-objective optimization is challenging due to uncertainty and multi-conflicting parameters at both the generation and demand sides. Thus, opting for a model that can solve load and distributed energy source scheduling problems is necessary. This work presents a model for operation cost and pollution emission optimization with renewable generation in the SPG. Solar photovoltaic and wind are renewable energy which have a fluctuating and uncertain nature. The proposed system uses the probability density function (PDF) to address uncertainty of renewable generation. The developed model is based on a multi-objective wind-driven optimization (MOWDO) algorithm to solve a multi-objective energy optimization problem. To validate the performance of the proposed model a multi-objective particle swarm optimization (MOPSO) algorithm is used as a benchmark model. Findings reveal that MOWDO minimizes the operational cost and pollution emission by 11.91% and 6.12%, respectively. The findings demonstrate that the developed model outperforms the comparative models in accomplishing the desired goals.

1. Introduction

Around the globe, pollution emissions and global warming are major concerns to the environment and sustainability causing climate change [1,2]. The demand response (DR) and renewable energy sources (RES) emerged to control pollution emissions from power system networks [3,4]. Thus, power sector regulatory bodies are attempting to proliferate and penetrate RESs, such as wind, solar, fuel cell, etc., to meet growing electricity demand with low pollution emissions [5,6]. With the emergence of the smart power grid (SPG) [7], the utility can accommodate RESs and initiate DR programs, contribute to reducing pollution emissions, operation cost minimization, power loss reduction, and improved reliability [8]. The utility involves consumers in DR programs to engage in the electricity market with the aim of addressing energy optimization issues, including contingency problems, RES output forecast errors, pollution emissions, operational cost, and distributed grounding [9]. The DR programs encourage consumers to adapt their energy consumption profile, including shifting load, and curtailing load during high-price hours, to minimize pollution emissions and operation costs [10,11].
Numerous studies have been undertaken regarding energy optimization in the SPG, covering various aspects and viewpoints such as dynamic pricing policies [12], recognition methods [13], DFT phasor estimators [14], control algorithms [15], etc. However, RES modelling, scheduling, and optimization are necessary before addressing the above aspects and viewpoints in the literature. For instance, authors developed a model to cater for the erratic and uncertain behaviour of RESs, such as the wind [16]. Likewise, PDF and CDF are studied in [17,18] for the uncertainty modelling perspectives of RESs such as wind and solar. Similarly, distributed generation and microgrid equal power sharing and control are addressed in [19,20]. Moreover, consumers can reduce their bills by participating in DR programs. DR programs are implemented in [21] for SPG cost and carbon emission reduction. The DR motivate domestic, industrial, and commercial consumers to schedule their load demand and optimize energy via incentive-based payments for energy cost minimization. Optimization methods such as Lyapunov optimization and distributed algorithm are used to optimize the cost of microgrids with the high proliferation of RESs [22,23]. A multi-objective optimization model for hybrid systems haseen developed using multi-criterion decisions for environmental and economic aspect optimization [24]. Similarly, the NSGA-II model was developed considering rural home’s flexible load scheduling for financial benefit and user comfort maximization [25]. The authors of [26] introduced shuffle frog leaping and teaching/learning-based optimization algorithms for different prospectives of optimization such as energy utilization, energy cost reduction, and creating energy balance between utility and consumers. A robust optimization via Monte Carlo simulations (MCS) was introduced in [27] to accommodate the high penetration of RESs using storage batteries. The primary goal of this research included reducing energy consumption, minimizing PAR, optimizing electricity expenses at peak demand, and minimizing energy wastage through various techniques: real-time pricing (RTP), time of use (TOU), optimum load management (OLM), decision support tool (DST) and critical peak pricing (CPP). A multi-objective optimization model was introduced in [28] for microgrid carbon capturing. Likewise, a multi-objective approach was developed for intelligent decision making of PMU placement in the grid [29].
The authors of [30] developed a residential sector energy optimization model to control consumer load behaviour, balance supplied power, reduce electricity bills, and improve reliability. A distributed algorithm was introduced in [31,32] to solve economic dispatch problems via a multi-objective approach. The authors of [33] introduced a model considering electric vehicle (EV) scheduling for the charge and discharge process using an adaptive simulated annealing particle swarm optimization algorithm to provide financial relief and reduce emissions. A mixed integer non-linear programming (MINLP) model was proposed to minimize pollution emissions and operational costs in a microgrid [34]. The obtained results of the MINLP were compared with existing algorithms for validation. Optimizing energy purchasing and selling with storage batteries was discussed in [35]. An optimization model for DSM in a SPG was studied, optimizing the operation of shiftable/adjustable electrical and thermal load considering RESs, battery storage, etc., to minimize cost and shave peaks [36]. A stochastic multi-objective model considering RESs and EVs was presented in [37] to minimize operating costs and voltage deviation. A fuzzy control mechanism was introduced in [38,39,40] to balance microgrid and power grid voltage and current sharing. Electricity theft detection and residential load decomposition was addressed in [41,42]. The authors of [43] developed a chaotic hybrid sine cosine pattern search algorithm to solve the optimization problem in power system stabilizers. The authors of [44] addressed the golden search optimization algorithm for numerical function optimization. The developed model scheduled load using stochastic techniques under DR. Findings illustrated that the developed model outperformed with/without DR in minimizing cost and peak energy consumption. GA and MOGA were adopted in [45] for the single/multi-objective optimization of environmental and economic aspects. Similarly, multi-objective stochastic algorithms considering DR, energy storage, and RESs for retailer energy cost minimization and clean energy utilization maximization were discussed in [46]. In the work [47], an optimization model was implemented, modelling the erratic behaviour/uncertainty of solar and wind energy. In [48], MOPSO was developed to minimize pollution emissions and operational costs in the SPG. Both operating expenses and emissions were decreased at the same time. The proposed model successfully optimized the operating expenses and emissions compared to existing models. The model developed in this study is compared with previously published models, as listed in Table 1.
The above-discussed works comprehensively analyse the existing literature, investigating different aspects, perspectives, and methodologies, and develop an in-depth understanding of achieving objectives including operating cost, pollution emission, etc. Nevertheless, how the multi-objective optimization problem is addressed differs from the existing literature in terms of methodology, techniques, scenario, and validation. This work develops a multi-objective optimization model for scheduling load and distributed energy sources in the SPG to minimize operational costs and pollution emissions. Furthermore, this work employs the multi-objective wind-driven optimization (MOWDO) method, incorporating the Pareto criterion and non-linear sorting based on a fuzzy mechanism to solve the multi-objective optimization problem. The novelty and technical advancements of this research are summarized below.
  • The PDF is used to address the uncertainty of wind and PV renewable energy to participate effectively in energy optimization.
  • Optimization model using the MOWDO technique is devised with a fuzzy approach to solve multi-objective optimization issues of industrial, residential, and commercial consumers.
  • The developed model’s results are better than the benchmark model in terms of both operational expenses and pollution emissions.
This paper is structured as follows: Section 2 extensively describes the developed system. The created multi-objective optimization algorithm MOWDO is presented in Section 3. Finally, the simulation results are discussed in Section 4, followed by the conclusion in Section 5.

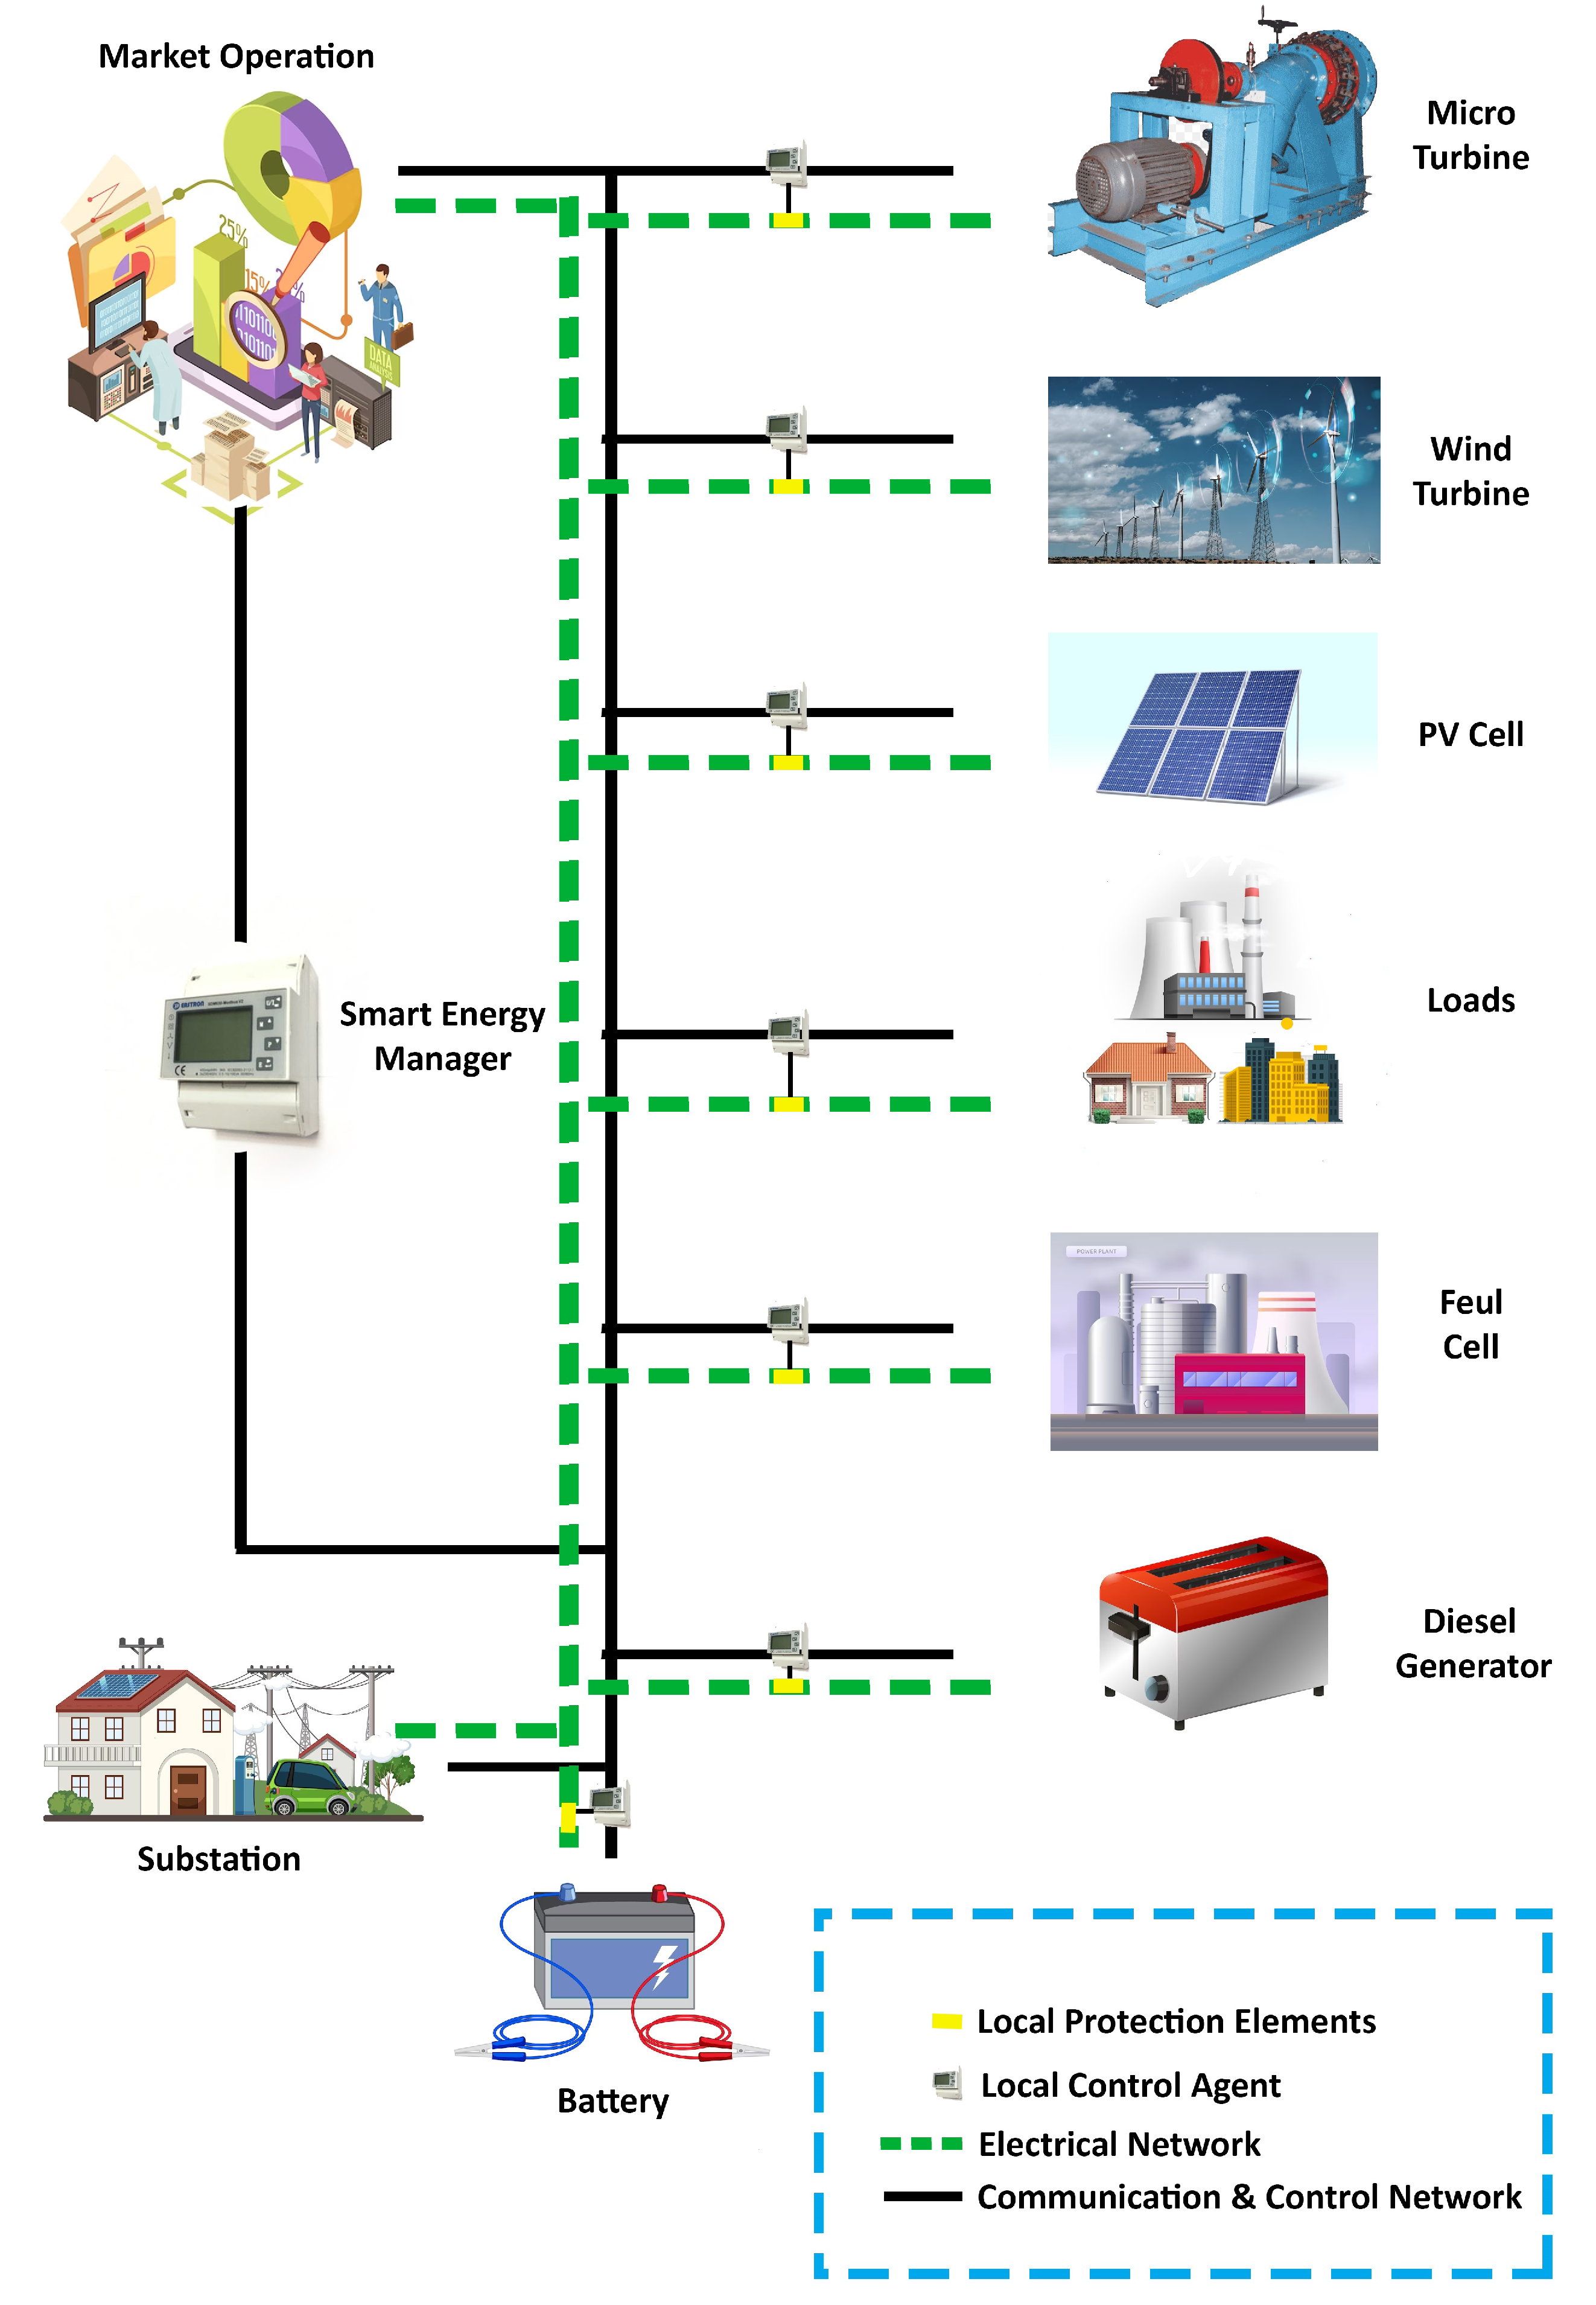
2. Proposed System Model

Due to the growing need for energy, the world is evolving from traditional energy sources to RESs and combined RESs, forming distributed generation (DG). The SPG accommodates DG and facilitates bidirectional communication between the energy source and the load for energy optimization. This two-way/bidirectional communication is possible with the advanced metering infrastructure (AMI) of the SPG that stores and processes data from consumers and sources through smart meters and sends it back to the service provider. This real-time information exchange allows users to balance power generation and load consumption via DR incentives. A microgrid can either work in solitary mode or be mixed with renewable energy in harmony to provide energy. The developed system model is shown in Figure 1.

2.1. Consumers

The developed model considers three types of consumers:
  • Domestic;
  • Industrial;
  • Commercial.
where ( RC ) : RP ( r , t ) = RC ( r , t ) , ( I C ) : I P ( i , t ) = I C ( i , t ) , and CP ( c , t ) = CC ( c , t ) are for the above consumers, respectively. There are different load categories for consumers, shiftable and non-shiftable loads. Non-shiftable loads are used around the clock and cannot be turned off or shifted. These types of loads include fans, bulbs, refrigerators, etc. A domestic consumer can change home appliances, such as washing machines, iron, and air conditioner, to avoid high prices. The utility service provider provides cost incentives for consumers to shift load from on-peak hours (bearing high cost) to off-peak hours where the tariff rate is relatively lower. This helps in peak shaving and reduces power demand over peak hours.

2.2. RES Uncertainty Modelling

This study considers two types of RESs, namely solar and wind, that exhibit uncertainty, stochasticity, and intermittency due to their dependence on environmental factors. To smooth-out RES fluctuations, batteries are used with RES [56,57]. In contrast, to model the uncertainty of RESs, probabilistic models are developed because wind speed and solar irradiance are stochastic variables that use meteorological data to estimate their generation potential. A detailed discussion on wind and solar energy uncertainty modelling is as follows.

2.2.1. Wind Energy Modelling

The wind is a renewable source used to run wind turbines (WTs) to convert wind speed into electrical energy [58,59,60]. The energy generated from WTs depends upon the turbine’s size and shape, wind availability, and wind speed quotient [61]. The bigger the turbine blades, the more energy is produced from the turbine [62]. Likewise, WTs in higher wind speeds generates more energy. Due to the stochastic nature of wind speed, we propose a probabilistic model for estimating the amount of energy it can produce. To model the behaviour of wind speed, the PDF is presented in [63], where α ω , β w , etc. are scale/shape parameter, which assumed to be 2. Wind speed is modelled using PDF, depicted in Figure 2.
Let v m be the mean wind speed, then the scale parameter of a particular site is given below [54].
F v v wind = 1 exp v w i n d α ω 2
f v v w i n d = 2 α ω 2 v w i n d exp v w i n d α w 2
Substituting a w as an average wind speed in PDF, the Rayleigh distribution function for wind energy of the above equations is obtained as follows [54].
F v v wind = π 2 v w i n d v m 2 exp π 4 v w i n d v m 2
f v v w i n d = 1 exp π 4 v w i n d v m 2
The output characteristic of wind energy can be obtained using Equation (5) adopted from [54,64] and modelled below.
p w v w i n d = 0 v w i n d < v c i P R = v wind v c i v r v c i v c i v w i n d < v r P R v r v w i n d < v c o 0 v wind v c o
where v r , v c i and v wind are the rated, cut in, and factual wind speed, respectively. The P R is the rated power of WTs. The parameters used for WTs used in this proposed model have v c i = 3.5 m s ; v c o = 18 m s ; v r = 17.5 m s . Figure 3 shows wind speed profile used in wind energy generation.

2.2.2. Solar Photovoltaic Modelling

Solar is a form of renewable energy that produces energy from solar radiation and temperature via the PV effect [65]. The solar-generated energy depends on the intensity of the sunlight: solar radiation and temperature [66,67]. The solar irradiance uncertainty is modelled via PDF functions in Equation (6) as [54].
f B ( s i ) = r ( α + β ) r ( α ) r ( β ) s i α 1 ( 1 s i ) β 1 0 s i 1 , α 0 0 otherwise
F B = 0 s i r ( α + β ) r ( α ) r ( β ) s i α 1 ( 1 s i ) β 1 d s i β
where s i denotes solar radiations. The α / β are parameters, where the average solar irradiance and standard deviation from the PDF are calculated and used below [54].
α = μ μ ( 1 + μ ) σ 2 1 β = ( 1 μ ) μ ( 1 + μ ) σ 2 1
Solar output power is obtained using Equation (9) [68,69,70].
p h ( s i ) = A c × η × s i
where p h ( s i ) denotes the PV output power obtained from the solar irradiance s i , η represents PV module efficiency, and A c PV module is surface area. The uncertainty of the PV output power with PDF is modelled in Equation (10).
f P p v P p v = r α + β r α r β p h s i α 1 1 p h s i β 1 i f P p v 0 , p h s i 0 o t h e r w i s e
The solar PV output power is depicted in Figure 4. The bids and emissions coefficient of PV are listed in Table 2.

2.3. Objective Functions

The developed model balances demand and generation to optimize pollution emission and operational cost as objectives considering DGs and demands like residential, industrial, and commercial. Objectives are defined as follows.

2.3.1. Operational Cost

The first objective function is operational cost optimization. For all the sources participating in energy production, the cost function is subdivided into energy reserve cost and exchange with the utility grid as well as the cost of starting up and shutting down energy production units. Our energy production unit, which includes diesel generators, fuel cells, microturbines, wind, and solar energy systems, operates in coordination to supply energy consistently and meet energy demands. The cost function is modelled as follows [71].
minf 1 ( x ) = t = 1 T S T D G ( t ) + c o s t D G ( t ) + c o s t Gd ( t ) + c o s t s ( t )
S T D G ( t ) = i = 1 N g S D G i U i ( t ) U i ( t 1 )
cos t Gd ( t ) = U B y ( t ) P Gd By ( t ) B Gd By ( t ) U sell ( t ) P Gd sell ( t ) B Gd sell ( t )
Cos t D G ( t ) = i = 1 N g U i ( t ) P D G i ( t ) B D G i ( t )
cos t s ( t ) = j = 1 N s u j ( t ) × P s j ( t ) × B s j ( t ) + S s j ( t ) × u j ( t ) u j ( t 1 )
S D G i ( t ) and S s j ( t ) denote the startup or shutdown costs for the turbine and storage units, respectively, P Gd - By ( t ) indicates the real power purchased from the utility, and P Gd - sell ( t ) refers to the real power sold to the utility. The bids trade (purchase and sell) with the power company are B Gd - By ( t ) and B Gd - sell ( t ) , respectively, are listed in Table 2. P D G i ( t ) and P s j ( t ) are the actual output power of the generators and battery storage, respectively. Likewise, B s j ( t ) and B D G i ( t ) are the bids of the storage devices and DGs, respectively.

2.3.2. Pollution Emissions

Pollution emissions comprise the quantity of pollution emitted from DGs, generators, and utility grids, mathematically modelled in the pollution function below [71].
min f 2 ( x ) = i = 1 N g U i ( t ) P D G i ( t ) E D G i ( t ) + j = 1 N s U j ( t ) P s j ( t ) E s j ( t ) + P G d ( t ) E G d ( t )
where E s i ( t ) , E D G i ( t ) , and E G d ( t ) are pollution emissions measured in kgMWh 1 for the generator units, DGs, and utility, respectively.

2.4. Constraints

The developed model ensures optimal energy optimization of the SPG by considering the following constraints.

2.4.1. Energy Balancing Constraints

The power generation (DGs, generator, power grid, etc.) must equal the net load demand to ensure energy balance. Energy balancing constraints are defined as follows [71].
i = 1 N g P D G i ( t ) + j = 1 N s P s j ( t ) + U By ( t ) P By ( t ) P Gd By ( t ) = L = 1 N L P Demand ( t ) + U sell ( t ) P Gd sell ( t )
where N L is demand levels number and P D e m a n d ( t ) represents power demand to be met by the SPG.

2.4.2. Power Threshold Constraint

The power originating from each source is limited by the source’s minimum and maximum power capacity thresholds, mathematically modelled as follows [71].
P D G i , min ( t ) P D G i ( t ) P D G i , max ( t ) P s j , min ( t ) P s j ( t ) P s j , max ( t ) p Gd , min ( t ) P G d ( t ) P G d , max ( t )
where P D G i , max ( t ) , P s j , max ( t ) , and P Gd , max ( t ) is the maximum real power-generating units of i t h D G s , j t h storage system and the utility, respectively. Furthermore, P D G i , min ( t ) , P s j , min ( t ) , and P Gd , min ( t ) are minimum power from the aforementioned sources, respectively.

2.4.3. Battery Constraints

Batteries charging and discharging are limited by their minimum and maximum charging and discharging capacity limits, modelled below.
B e s s t = B e s s t 1 + η c h g ( t ) P c h g ( t ) Δ Δ t × I c h g 1 η d i s c h g ( t ) Δ t × I d i s c h g + I c h g ( t ) B e s s , min B e s s t B e s s , max P c h g ( t ) P c h g , max ; P d i s c h g ( t ) P d i s c h g , max
B e s s represents stored energy in battery. Likewise, P c h g and P d i s c h g show the charge and discharge power for duration δ t , respectively, while η c h g and η d i s c h g denote the battery charging/discharging efficiency, respectively. B e s s , m i n and B e s s , m a x show the lower and upper limits for energy storage in the battery, respectively, and P c h g , m a x and P d i s c h g , m a x denote maximum charge/discharge battery power for a period of δ t , respectively.
The bids and emissions coefficient of sources, such as WTs, PVs, batteries, generators, and power grids, are listed in Table 2.

3. Developed Multi-Objective Optimization Algorithms

The developed model adopted the MOWDO algorithm due to its capability of handling conflicting constraints, equality/inequality constraints, and multi-conflict functions to achieve the desired objectives. The air parcels in the MOWDO algorithm have positions and velocities with five benchmark functions: Kita, Schaffer, Kursawe, ZDT1, and ZDT4, for solving optimization problems, as illustrated in Algorithm 1.
Algorithm 1: MOWDO algorithm for multi-objective energy optimization.
Sustainability 15 09970 i001
MOWDO uses Pareto-front ranks to determine the global best solution [16].

3.1. Schaffer Benchmark Function

This function’s lower/upper bounds for variables are [ 10 3 , 10 3 ] , and the optimal solution is bounded as [0, 2]. The Schaffer function is modelled as follows.
f 1 ( k ) = k 2 , f 2 ( k ) = ( k 2 ) 2

3.2. Kita Function

This function’s variable is bounded as [ 0 , 7 ] , and the multi-objective functions are defined as follows.
f 1 ( k 1 , k 2 ) = k 1 2 + k 2
and
f 2 ( k 1 , k 2 ) = k 1 2 + k 2 + 1
subject to:
k 1 6 + k 2 13 2 , k 1 2 + 15 2 , 5 k 1 + k 2 30
The function is designed to mitigate the impact of pressure.

3.3. Kursawe Function

This function’s bounded variables are [ 5 , 5 ] , and their multi-objective function is defined below:
f 1 ( k ) = j = 1 N 1 ( 10 exp ( 0.2 k 2 i + k 2 j + 1 ) )
f 2 ( k ) = j = 1 N | k j | 0.8 + 5 sin ( k 3 j ) )

3.4. ZDT1 Function

ZDT1 variables are bounded as [ 0 , 1 ] , and its multi-objective function is defined below.
f 1 ( k ) = k 1 a n d f 2 ( k ) = g ( k [ 1 k 1 g ( k ) ] ) w h e r e g ( k ) = 1 + 9 ( j = 2 N k i ( N 1 ) )

3.5. ZDT4 Function

This function’s variables are bounded as k j = [ 5 , 5 ] , j = 2 , 3 , . . , n and k 1 = [ 0 , 1 ] , and its multi-objective function is defined below.
f 1 ( k ) = k 1 a n d f 2 ( x ) = g ( k ) 1 k 1 g ( k ) a n d , g ( k ) = 1 + 10 ( N 1 ) + i = 2 N ( k 2 j 10 cos ( 4 π k j ) )
Step-wise detail of the MOWDO algorithm is illustrated in the flowchart in Figure 5.

4. Simulation Results and Discussion

The developed model was tested via experiments for multi-objective energy optimization considering power generation sources, such as DGs, power grid, generators, etc., and load, such as domestic, industrial, and commercial, as depicted in Figure 6. The price signal of the energy market used by the developed model is displayed in Figure 7.
We have power-generating sources, such as solar, WT, diesel generators, hydroelectric power, electric vehicles, and fuel cells on the generation side. The developed model under these sources optimizes the operational costs and pollution emissions. On the consumer side, we have different kinds of industrial, residential, and commercial loads. The electricity demand for the loads mentioned above is 50, 33 and 10%, respectively. To address the multi-objective optimization problems, the MOWDO technique was utilized. The defined objectives were fed into the benchmark functions of the MOWDO algorithm. The objective function took x as a variable function, as this problem was set for 24 h since the number of variables was set to 24. RESs, such as solar and wind, are subject to high levels of uncertainty. To model this uncertainty of renewable energy, the PDF was used. The predicted behaviour of solar and wind is shown in Figure 8 and Figure 9, respectively. The results are presented in Table 3. The energy from these sources is subjected to three types of consumers: domestic, commercial, and industrial.
Domestic are loads used in daily households, e.g., fans, light bulbs, TV, room cooler, etc. In comparison, commercial loads include loads used by shops, restaurants, malls, etc., meant for commercial use. In the same way, industrial loads are heavy machinery, and motors used all day. Simulation results were conducted to solve the optimization problem of pollution emissions and operational costs. These objectives are conflicting and tradeoff exists between them. The MOWDO is employed to achieve both objectives simultaneously. Hence, we take minimal and optimal points at Pareto-fronts to draw our results.
The wind power data presented in Table 3 is taken from [72]. The solar energy system is comprises 25 kW SOLAREX MSX type, including a solar array of 10 × 2.5 kW with s = 10 m 2 and h = 18.6 % . For storage purposes, batteries are used with a minimum and maximum capacity of 10% and 100%, respectively, adopted from [73]. The daily load demand curve for the commercial, residential, and industrial consumer is illustrated in Figure 6, taken from [74] as the daily average load demand curve. Energy used for the span of 24 h is shown to be 1695 kWh [75]. However, these sources have uncertainty and rigid operation constraints due to dependence on environment [76,77]. It is seen that all sources participate actively to meet the demand in compliance with the smooth functioning of the SPG. The detailed evaluation and discussion are presented in the subsequent section.
The MOWDO algorithm minimizes the pollution emissions and operational costs. All the generation units participated in supplying energy to the load. The grid is shown to provide excess energy during the daytime when demand is high. Still, as it is subjected to more carbon constraints, RESs, such as wind and solar systems, actively produce energy that reduces pollution emissions and increases power production. Furthermore, wind and solar systems have low operational costs, thus contributing to achieving both objectives simultaneously. From simulation results, it can be deduced that the optimal values of the developed MOWDO for pollution emission and operational cost are 316 , 400 Kg / kWh and 339.4 USD, respectively, as shown in Figure 10. In contrast, the existing MOPSO algorithm optimal values of pollution emission and operational cost are 336 , 400 kg / KWh and 382.4 USD, respectively, as illustrated in Figure 11. The proposed MOWDO and existing MOPSO numerical findings are presented in Table 4. The above findings show that the proposed MOWDO algorithm best suits this problem and reduces the cost and emissions by 11.91% and 6.12%, respectively, compared to the existing MOPSO algorithm.

5. Conclusions

This study developed an optimization model considering both the generation side (DGs, diesel generators, batteries, and utility) and the demand side (residential, commercial, and industrial) for two objectives: pollution emission and operational cost optimization using multi-objective techniques. The consumers in the developed model are engaged in DR programs as coverage for the uncertainties associated with load demand, and PDF is used to handle the uncertainty associated with solar and wind generation. The developed optimization model using the MOWDO was implemented in MATLAB to solve the multi-objective problem via a fuzzy mechanism for both objectives. For validation, the developed model utilizing the MOWDO approach was compared to the MOPSO. The findings reveal that the MOWDO algorithm reduced pollution emissions and the operational cost by 6.12% and 11.91%, respectively, compared to the MOPSO algorithm. Hence, in resolving the multi-objective optimization problem concerning operational expense and pollution emissions, the MOWDO algorithm performs better than the MOPSO algorithm.

Author Contributions

Conceptualization, methodology, formal analysis, investigation, data curation, A.A., S.M., G.H. and S.A.; software, validation, writing—original draft preparation, resources, A.A. and G.H.; writing—review and editing, supervision, visualization, G.H.; project administration, resources funding acquisition, A.A. and G.H., software, validation, writing—review and editing, resources, funding acquisition, M.I.K., K.R. and A.M.A. All authors have read and agreed to the published version of the manuscript.

Funding

This research was funded by the Deanship of Scientific Research at Najran University under the Distinguished Research funding Program grant code (NU/DRP/SERC/12/1).

Institutional Review Board Statement

Not applicable.

Informed Consent Statement

Not applicable.

Data Availability Statement

Not applicable.

Acknowledgments

The authors are thankful to the Deanship of Scientific Research, Najran University, Kingdom of Saudi Arabia, for funding this work under the Distinguished Research funding program grant code number NU/DRP/SERC/12/1.

Conflicts of Interest

The authors declare no conflict of interest.

Nomenclature

SPG    Smart power grid
PDFProbability density function
PSOParticle swarm optimization
MOPSOMulti-objective particle swarm optimization
MOWDO     Multi-objective wind-driven optimization
DRDemand response
RESRenewable energy sources
CDFCumulative distribution function
MCSMonte Carlo simulations
ToUTime of use
RTPReal-time pricing
OLMOptimum load management
DSTDecision support tool
CPPCritical peak pricing
EVsElectric vehicles
MILPMixed integer linear programming
MINLPMixed integer non-linear programming
GAGenetic algorithm
DSMDemand-side management
MOGAMulti-objective genetic algorithm
DGsDistributed generations
AMIAdvanced metering infrastructure
WTWind turbines
PVPhotovoltaic
α σ Wind speed prediction scale parameters
α σ Wind speed prediction shape parameters
v m Mean value of wind speed
P w ( V w i n d ) WTs’ net generated power
P R WTs’ rated power
v r Rated speed
v c _ i Cut-in speed
v w i n d Wind speed
v c _ o Cut-off speed
p h s i PV output power
η Panel efficiency
A c PV panel surface area
s i         Solar irradiance
S D G i ( t ) Startup or shutdown cost of DGs
S s j ( t ) Startup or shutdown cost of storage units
P Gd - By ( t ) Real power purchased from the utility
P Gd - sell ( t ) Real power sold to the utility
B Gd - By ( t ) Bids trade (purchase) with power company
B Gd - sell ( t ) Bids trade (sell) with power company
B s j ( t ) Bids of storage devices
B D G i ( t ) Bids of DGs
E s i ( t ) Pollution emissions measured in kgMW h 1 for generator units
E D G i ( t ) Pollution emissions measured in kgMW h 1 for DGs
E G d ( t ) Pollution emissions measured in kgMW h 1 for utility
N L Total number of demand levels
P D e m a n d ( t ) Power demand to be met by SPG
P D G i , max ( t ) Maximum real power generation of DGs
P s j , max ( t ) Maximum real power generation of storage
P Gd , max ( t ) Maximum real power generation of utility
P D G i , m i n ( t ) Minimum real power generation of DGs
P s j , m i n ( t ) Minimum real power generation of storage
P Gd , min ( t ) Minimum real power generation of utility
B e s s ( t ) Energy stored in battery at time t
B e s s ( t 1 ) Energy stored in battery at time t-1
P c h g Charge power for duration δ t
P d i s c h g Charge power for duration δ t
η c h g Battery charging efficiency
η d i s c h g Battery discharging efficiency
B e s s , m i n Lower limits for energy storage in the battery
B e s s , m a x Upper limits for energy storage in the battery
P c h g , m a x Maximum charge power of battery for a period of δ t
P d i s c h g , m a x Maximum discharge power of battery for a period of δ t

References

  1. Abdul, R.; Alam, M.M.; Ozturk, I.; Alvarado, R.; Murshed, M.; Işık, C.; Ma, H. Globalization and renewable energy use: How are they contributing to upsurge the CO2 emissions? A global perspective. Environ. Sci. Pollut. Res. 2023, 30, 9699–9712. [Google Scholar]
  2. Haiying, L.; Zafar, M.W.; Sinha, A.; Khan, I. The path to sustainable environment: Do environmental taxes and governance matter? Sustain. Dev. 2023. [Google Scholar] [CrossRef]
  3. Mohamed, L.; Monteiro, C.; Shafie-Khah, M.; Catalão, J.P.S. Evolution of demand response: A historical analysis of legislation and research trends. In Proceedings of the 2018 Twentieth International Middle East Power Systems Conference (MEPCON), Cairo, Egypt, 18–20 December 2018; pp. 968–973. [Google Scholar]
  4. Cai, T.; Dong, M.; Chen, K.; Gong, T. Methods of participating power spot market bidding and settlement for renewable energy systems. Energy Rep. 2022, 8, 7764–7772. [Google Scholar] [CrossRef]
  5. Mark, D.; Taylor, R. Transitioning the Energy System. In The Path to a Sustainable Civilisation: Technological, Socioeconomic and Political Change; Springer: Singapore, 2023; pp. 53–88. [Google Scholar]
  6. Yu, D.; Duan, C.; Gu, B. Design and evaluation of a novel plan for thermochemical cycles and PEM fuel cells to produce hydrogen and power: Application of environmental perspective. Chemosphere 2023, 334, 138935. [Google Scholar] [CrossRef] [PubMed]
  7. Alzahrani, A.; Sajjad, K.; Hafeez, G.; Murawwat, S.; Khan, S.; Khan, F.A. Real-time energy optimization and scheduling of buildings integrated with renewable microgrid. Appl. Energy 2023, 335, 120640. [Google Scholar] [CrossRef]
  8. Asghar, R.; Sulaiman, M.H.; Saeed, S.; Wadood, H.; Mehmand, T.K.; Ullah, Z. Application of linear and nonlinear control schemes for the stability of Smart Grid. In Proceedings of the 2022 International Conference on Emerging Technologies in Electronics, Computing and Communication (ICETECC), Jamshoro, Sindh, Pakistan, 7–9 December 2022; pp. 1–6. [Google Scholar] [CrossRef]
  9. Xiao, S.; Cao, Y.; Wu, G.; Guo, Y.; Gao, G.; Chen, S.; Sykulski, J.K. Influence of the distributed grounding layout for intercity trains on the ‘train-rail’ circumflux. IEEE Trans. Circuits Syst. II Express Briefs 2022, 70, 22725997. [Google Scholar] [CrossRef]
  10. Mohammad, S.; Yamin, H.; Li, Z. Market Operations in eLectric Power Systems: Forecasting, Scheduling, and Risk Management; John Wiley and Sons: Hoboken, NJ, USA, 2003. [Google Scholar]
  11. Noam, L. Energy resources and use: The present situation and possible paths to the future. Energy 2008, 33, 842–857. [Google Scholar]
  12. Wu, H.; Jin, S.; Yue, W. Pricing Policy for a Dynamic Spectrum Allocation Scheme with Batch Requests and Impatient Packets in Cognitive Radio Networks. J. Syst. Sci. Syst. Eng. 2022, 31, 133–149. [Google Scholar] [CrossRef]
  13. Gao, J.; Sun, H.; Han, J.; Sun, Q.; Zhong, T. Research on Recognition Method of Electrical Components Based on FEYOLOv4-tiny. J. Electr. Eng. Technol. 2022, 17, 3541–3551. [Google Scholar] [CrossRef]
  14. Song, J.; Mingotti, A.; Zhang, J.; Peretto, L.; Wen, H. Fast iterative-interpolated DFT phasor estimator considering out-of-band interference. IEEE Trans. Instrum. Meas. 2022, 71, 22067292. [Google Scholar] [CrossRef]
  15. Gu, Q.; Tian, J.; Yang, B.; Liu, M.; Gu, B.; Yin, Z.; Zheng, W. A Novel Architecture of a Six Degrees of Freedom Parallel Platform. Electronics 2023, 12, 1774. [Google Scholar] [CrossRef]
  16. Ali, S.; Ullah, K.; Hafeez, G.; Khan, I.; Albogamy, F.R.; Haider, S.I. Solving day-ahead scheduling problem with multi-objective energy optimization for demand side management in smart grid. Eng. Sci. Technol. Int. J. 2022, 36, 101135. [Google Scholar] [CrossRef]
  17. Dhople, V.S.; Domínguez-García, A.D. A framework to determine the probability density function for the output power of wind farms. In Proceedings of the 2012 North American Power Symposium (NAPS), Champaign, IL, USA, 9–11 September 2012; pp. 1–6. [Google Scholar]
  18. Khorramdel, B.; Zare, A.; Chung, C.Y.; Gavriliadis, P.N. A Generic Convex Model for a Chance-Constrained Look-Ahead Economic Dispatch Problem Incorporating an Efficient Wind Power Distribution Modeling. IEEE Trans. Power Syst. 2019, 35, 873–886. [Google Scholar] [CrossRef]
  19. Chen, J.; Sun, B.; Li, Y.; Jing, R.; Zeng, Y.; Li, M. Credible capacity calculation method of distributed generation based on equal power supply reliability criterion. Renew. Energy 2022, 201, 534–547. [Google Scholar] [CrossRef]
  20. Zhao, P.; Ma, K.; Yang, J.; Yang, B.; Guerrero, J.M.; Dou, C.; Guan, X. Distributed Power Sharing Control Based on Adaptive Virtual Impedance in Seaport Microgrids with Cold Ironing. IEEE Trans. Transp. Electrif. 2022, 9, 2. [Google Scholar] [CrossRef]
  21. Qin, Z.; Li, J. Demand response in electricity markets: A review. In Proceedings of the 2012 9th International Conference on the European Energy Market, Florence, Italy, 10–12 May 2012; pp. 1–8. [Google Scholar]
  22. Albogamy Fahad, R.; Paracha, M.Y.I.; Hafeez, G.; Khan, I.; Murawwat, S.; Rukh, G.; Khan, S.; Khan, M.U.A. Real-Time Scheduling for Optimal Energy Optimization in Smart Grid Integrated with Renewable Energy Sources. IEEE Access 2022, 10, 35498–35520. [Google Scholar] [CrossRef]
  23. Ghasem, D.; Shayanfar, H.A.; Kazemi, A. The optimization of demand response programs in smart grids. Energy Policy 2016, 94, 295–306. [Google Scholar]
  24. Hamed, Y.; Baneshi, M.; Yaghoubi, M. Techno-economic and environmental design of hybrid energy systems using multi-objective optimization and multi-criteria decision making methods. Energy Convers. Manag. 2023, 282, 116873. [Google Scholar]
  25. Xi, L.; Yang, Y.; Liu, Y.; Zhao, T. Classification of energy use patterns and multi-objective optimal scheduling of flexible loads in rural households. Energy Build. 2023, 283, 112811. [Google Scholar]
  26. Kunal, P.; Khosla, A. Home energy management systems in future smart grid networks: A systematic review. In Proceedings of the 2015 1st International Conference on Next Generation Computing Technologies (NGCT), Dehradun, India, 4–5 September 2015; pp. 479–483. [Google Scholar]
  27. Ana, S.; Antunes, C.H.; Oliveira, C.; Gomes, Á. A multi-objective genetic approach to domestic load scheduling in an energy management system. Energy 2014, 77, 144–152. [Google Scholar]
  28. Zhang, Z.; Altalbawy, F.M.A.; Al-Bahrani, M.; Riadi, Y. Regret-based multi-objective optimization of carbon capture facility in CHP-based microgrid with carbon dioxide cycling. J. Clean. Prod. 2023, 384, 135632. [Google Scholar] [CrossRef]
  29. Cao, B.; Yan, Y.; Wang, Y.; Liu, X.; Lin, J.C.W.; Sangaiah, A.K.; Lv, Z. A Multiobjective Intelligent Decision-Making Method for Multistage Placement of PMU in Power Grid Enterprises. IEEE Trans. Ind. Inform. 2022, 19, 7636–7644. [Google Scholar] [CrossRef]
  30. Refaat, S.S.; Abu-Rub, H. Implementation of smart residential energy management system for smart grid. In Proceedings of the 2015 IEEE Energy Conversion Congress and Exposition (ECCE), Montreal, QC, Canada, 20–24 September 2015; pp. 3436–3441. [Google Scholar]
  31. Li, P.; Hu, J.; Qiu, L.; Zhao, Y.; Ghosh, B.K. A Distributed Economic Dispatch Strategy for Power-Water Networks. IEEE Trans. Control Netw. Syst. 2022, 9, 356–366. [Google Scholar] [CrossRef]
  32. Duan, Y.; Zhao, Y.; Hu, J. An initialization-free distributed algorithm for dynamic economic dispatch problems in microgrid: Modeling, optimization and analysis. Sustain. Energy Grids Netw. 2023, 34, 101004. [Google Scholar] [CrossRef]
  33. Yu, M.; Li, B.; Wang, H.; Wang, X.; Negnevitsky, M. Multi-objective optimal scheduling of microgrid with electric vehicles. Energy Rep. 2022, 8, 4512–4524. [Google Scholar]
  34. Alireza, Z.; Jadid, S.; Siano, P. Economic-environmental energy and reserve scheduling of smart distribution systems: A multiobjective mathematical programming approach. Energy Convers. Manag. 2014, 78, 151–164. [Google Scholar]
  35. Shimaa, B.; Ibrahim, H.; Elbaset, A.A. Multi-objective optimization of grid-connected PV-wind hybrid system considering reliability, cost, and environmental aspects. Sustain. Cities Soc. 2020, 60, 102178. [Google Scholar]
  36. Elham, S.; Jadid, S. Cost reduction and peak shaving through domestic load shifting and DERs. Energy 2017, 124, 146–159. [Google Scholar]
  37. Farhad, Z.S.; Guzman, C.P.; Pozos, A.T.; Quiros-Tortos, J.; Franco, J.F. Stochastic multi-objective optimal energy management of grid-connected unbalanced microgrids with renewable energy generation and plug-in electric vehicles. Energy 2022, 241, 122884. [Google Scholar]
  38. Taghieh, A.; Mohammadzadeh, A.; Zhang, C.; Kausar, N.; Castillo, O. A type-3 fuzzy control for current sharing and voltage balancing in microgrids. Appl. Soft Comput. 2022, 129, 109636. [Google Scholar] [CrossRef]
  39. Shao, B.; Xiao, Q.; Xiong, L.; Wang, L.; Yang, Y.; Chen, Z.; Guerrero, J.M. Power coupling analysis and improved decoupling control for the VSC connected to a weak AC grid. Int. J. Electr. Power Energy Syst. 2023, 145, 108645. [Google Scholar] [CrossRef]
  40. Xu, S.; Huang, W.; Huang, D.; Chen, H.; Chai, Y.; Ma, M.; Zheng, W.X. A Reduced-Order Observer-Based Method for Simultaneous Diagnosis of Open-Switch and Current Sensor Faults of a Grid-Tied NPC Inverter. IEEE Trans. Power Electron. 2023, 38, 9019–9032. [Google Scholar] [CrossRef]
  41. Yan, Z.; Wen, H. Electricity theft detection base on extreme gradient boosting in AMI. IEEE Trans. Instrum. Meas. 2021, 70, 2504909. [Google Scholar] [CrossRef]
  42. Lin, L.; Shi, J.; Ma, C.; Zuo, S.; Zhang, J.; Chen, C.; Huang, N. Non-intrusive residential electricity load decomposition via low-resource model transferring. J. Build. Eng. 2023, 73, 106799. [Google Scholar] [CrossRef]
  43. Mahdiyeh, E.; Neshat, M.; Khalid, S.A. A novel hybrid sine cosine algorithm and pattern search for optimal coordination of power system damping controllers. Sustainability 2022, 14, 541. [Google Scholar]
  44. Mohammad, N.; Mohammadi, H.; Efatinasab, E.; Lashgari, A.; Eslami, M.; Khan, B. Golden search optimization algorithm. IEEE Access 2022, 10, 37515–37532. [Google Scholar]
  45. János, M.M.; Szilágyi, A.; Gróf, G. Environmental and economic multi-objective optimization of a household level hybrid renewable energy system by genetic algorithm. Appl. Energy 2020, 269, 115058. [Google Scholar]
  46. Shenbo, Y.; Tan, Z.; Liu, Z.; Lin, H.; Ju, L.; Zhou, F.; Li, J. A multi-objective stochastic optimization model for electricity retailers with energy storage system considering uncertainty and demand response. J. Clean. Prod. 2020, 277, 124017. [Google Scholar]
  47. Zakaria, A.; Ismail, F.B.; Lipu, M.S.H.; Hannan, M.A. Uncertainty models for stochastic optimization in renewable energy applications. Renew. Energy 2020, 145, 1543–1571. [Google Scholar] [CrossRef]
  48. Aghajani, G.R.; Shayanfar, H.A.; Shayeghi, H. Demand side management in a smart micro-grid in the presence of renewable generation and demand response. Energy 2017, 126, 622–637. [Google Scholar] [CrossRef]
  49. Heydar, C.; Derakhshan, G.; Hakimi, S.M.; Bahramara, S. Tri-objective optimal scheduling of smart energy hub system with schedulable loads. J. Clean. Prod. 2019, 236, 117584. [Google Scholar]
  50. Kalim, U.; Khan, T.A.; Hafeez, G.; Khan, I.; Murawwat, S.; Alamri, B.; Ali, F.; Ali, S.; Khan, S. Demand Side Management Strategy for Multi-Objective Day-Ahead Scheduling Considering Wind Energy in Smart Grid. Energies 2022, 15, 6900. [Google Scholar]
  51. Heydar, C.; Derakhshan, G.; Hakimi, S.M.; Bahramara, S. Multi-objectives optimal scheduling in smart energy hub system with electrical and thermal responsive loads. Environ. Clim. Technol. 2020, 24, 209–232. [Google Scholar]
  52. Heydar, C.; Derakhshan, G.; Hakimi, S.M.; Bahramara, S. Tri-objective scheduling of residential smart electrical distribution grids with optimal joint of responsive loads with renewable energy sources. J. Energy Storage 2020, 27, 101112. [Google Scholar]
  53. Heydar, C.; Derakhshan, G.; Bahramara, S. Multi-objective performance of smart hybrid energy system with Multi-optimal participation of customers in day-ahead energy market. Energy Build. 2020, 216, 109964. [Google Scholar]
  54. Kalim, U.; Ali, S.; Khan, T.A.; Khan, I.; Jan, S.; Shah, I.A.; Hafeez, G. An optimal energy optimization strategy for smart grid integrated with renewable energy sources and demand response programs. Energies 2020, 13, 5718. [Google Scholar]
  55. Heydar, C.; Bahramara, S.; Derakhshan, G. Day-ahead scheduling problem of smart micro-grid with high penetration of wind energy and demand side management strategies. Sustain. Energy Technol. Assess. 2020, 40, 100747. [Google Scholar]
  56. Zhang, X.; Wang, Y.; Yuan, X.; Shen, Y.; Lu, Z.; Wang, Z. Adaptive Dynamic Surface Control with Disturbance Observers for Battery/Supercapacitor-based Hybrid Energy Sources in Electric Vehicles. IEEE Trans. Transp. Electrif. 2022. [Google Scholar] [CrossRef]
  57. Dang, W.; Liao, S.; Yang, B.; Yin, Z.; Liu, M.; Yin, L.; Zheng, W. An encoder-decoder fusion battery life prediction method based on Gaussian process regression and improvement. J. Energy Storage 2023, 59, 106469. [Google Scholar] [CrossRef]
  58. Saeed, S.; Asghar, R.; Mehmood, F.; Saleem, H.; Azeem, B.; Ullah, Z. Evaluating a Hybrid Circuit Topology for Fault-Ride through in DFIG-Based Wind Turbines. Sensors 2022, 22, 9314. [Google Scholar] [CrossRef]
  59. Azeem, B.; Rehman, F.; Mehmood, C.A.; Ali, S.M.; Khan, B.; Saeed, S. Exact Feedback Linearization (EFL) and De-Couple Control of Doubly Fed Induction Generator Based Wind Turbine. In Proceedings of the 2016 International Conference on Frontiers of Information Technology (FIT), Islamabad, Pakistan, 19–21 December 2016; pp. 330–335. [Google Scholar] [CrossRef]
  60. Asghar, R.; Anwar, M.J.; Wadood, H.; Saleem, H.; Rasul, N.; Ullah, Z. Promising Features of Wind Energy: A Glance Overview. In Proceedings of the 2023 4th International Conference on Computing, Mathematics and Engineering Technologies (iCoMET) Sukkur, Pakistan, 17–8 March 2023; pp. 1–6. [Google Scholar] [CrossRef]
  61. Azeem, B.; Ullah, Z.; Rehman, F.; Ali, S.M.; Haider, A.; Saeed, S.; Khan, B. Levenberg–Marquardt SMC control of grid-tied Doubly Fed Induction Generator (DFIG) using FRT schemes under symmetrical fault. In Proceedings of the 2018 1st International Conference on Power, Energy and Smart Grid (ICPESG), Mirpur Azad Kashmir, Pakistan, 9–10 April 2018; pp. 1–6. [Google Scholar] [CrossRef]
  62. Huang, N.; Chen, Q.; Cai, G.; Xu, D.; Zhang, L.; Zhao, W. Fault Diagnosis of Bearing in Wind Turbine Gearbox Under Actual Operating Conditions Driven by Limited Data With Noise Labels. IEEE Trans. Instrum. Meas. 2021, 70, 1–10. [Google Scholar] [CrossRef]
  63. Eity, S.; Halder, P. Mehdi Seyedmahmoudian, Elmira Jamei, Ben Horan, Saad Mekhilef, and Alex Stojcevski. Progress on the demand side management in smart grid and optimization approaches. Int. J. Energy Res. 2021, 45, 36–64. [Google Scholar]
  64. Wind Speed Weather Data. Available online: http://wind.willyweather.com.au (accessed on 16 September 2022).
  65. Ahmed, S.U.; Affan, M.; Raza, M.I.; Hashmi, M.H. Inspecting Mega Solar Plants through Computer Vision and Drone Technologies. In Proceedings of the 2022 International Conference on Frontiers of Information Technology (FIT), Islamabad, Pakistan, 12–13 December 2022; pp. 18–23. [Google Scholar] [CrossRef]
  66. Ge, L.; Du, T.; Li, C.; Li, Y.; Yan, J.; Rafiq, M.U. Virtual Collection for Distributed Photovoltaic Data: Challenges, Methodologies, and Applications. Energies 2022, 15, 8783. [Google Scholar] [CrossRef]
  67. Huang, N.; Zhao, X.; Guo, Y.; Cai, G.; Wang, R. Distribution network expansion planning considering a distributed hydrogen-thermal storage system based on photovoltaic development of the Whole County of China. Energy 2023, 278, 127761. [Google Scholar] [CrossRef]
  68. Duan, P.F.; Soleimani, H.; Ghazanfari, A.; Dehghani, M. Distributed energy management in smart grids based on cloud-fog layer PHEVs. IEEE Trans. Ind. Appl. 2020. [Google Scholar] [CrossRef]
  69. The Solar Power Group Company. Available online: http://thesolarpowergroup.com.au (accessed on 18 September 2022).
  70. Reconstruction and Short-Term Forecast of the Solar Irradiance. Available online: http://lpc2e.cnrs-orleans.fr/~soteria/ (accessed on 18 September 2022).
  71. Aghajani, G.R.; Shayanfar, H.A.; Shayeghi, H. Presenting a multi-objective generation scheduling model for pricing demand response rate in micro-grid energy management. Energy Convers. Manag. 2015, 106, 308–321. [Google Scholar] [CrossRef]
  72. Qing, L.; Zhang, Z.; Lü, S. Home energy management in smart households: Optimal appliance scheduling model with photovoltaic energy storage system. Energy Rep. 2020, 6, 2450–2462. [Google Scholar]
  73. Arezoo, H.; Hakimi, S.M. Stochastic energy management of smart microgrid with intermittent renewable energy resources in electricity market. Energy 2021, 219, 119668. [Google Scholar]
  74. Rocha, H.R.; Honorato, I.H.; Fiorotti, R.; Celeste, W.C.; Silvestre, L.J.; Silva, J.A. An Artificial Intelligence based scheduling algorithm for demand-side energy management in Smart Homes. Appl. Energy 2021, 282, 116145. [Google Scholar] [CrossRef]
  75. Lu, C.; Xu, Q.; Yang, Y.; Song, J. Optimal energy management of smart building for peak shaving considering multi-energy flexibility measures. Energy Build. 2021, 241, 110932. [Google Scholar]
  76. Judge, M.A.; Manzoor, A.; Maple, C.; Rodrigues, J.J.; ul Islam, S. Price-based demand response for household load management with interval uncertainty. Energy Rep. 2021, 7, 8493–8504. [Google Scholar] [CrossRef]
  77. Manzoor, A.; Judge, M.A.; Ahmed, F.; ul Islam, S.; Buyya, R. Towards simulating the constraint-based nature-inspired smart scheduling in energy intelligent buildings. Simul. Model. Pract. Theory 2017, 118, 102550. [Google Scholar] [CrossRef]
Figure 1. The developed multi-objective model for optimizing energy usage in the SPG.
Sustainability 15 09970 g001
Figure 2. PDF for wind speed uncertainty modelling.
Sustainability 15 09970 g002
Figure 3. The wind speed measured in meter per second pattern.
Sustainability 15 09970 g003
Figure 4. Solar irradiance profile.
Sustainability 15 09970 g004
Figure 5. MOWDO algorithm implementation flow chart.
Sustainability 15 09970 g005
Figure 6. Demand load of domestic, commercial, and industrial consumers.
Sustainability 15 09970 g006
Figure 7. Real-time price of energy market.
Sustainability 15 09970 g007
Figure 8. Predicted power of PVs using PDF.
Sustainability 15 09970 g008
Figure 9. Predicted power of wind using PDF.
Sustainability 15 09970 g009
Figure 10. Optimization of the operational costs and pollution emissions using the proposed MOWDO algorithm.
Sustainability 15 09970 g010
Figure 11. Optimization of the operational costs and pollution emissions using the existing MOPSO algorithm.
Sustainability 15 09970 g011
Table 1. Comparison of the developed model with existing models in the discussed literature.
Refs.ObjectivesTechniquesLoadsOptimizationUncertainty
[16]Operation cost, pollution emission, and load curtailment cost minimizationMOWDO and MOGAResponsive and non-responsiveMulti-objectivePDF
[22,23]Energy cost minimizationTLBO, SFL, EDGEResidential loadSingle-objective
[49]Environmental, economic, and optimal shiftingAugmented ϵ -constraintThermal and electrical shiftable loadMulti-objectivePDF
[50]Operation expenses and environmental pollution minimizationMOWDO and MOGAResponsive and non-responsiveMulti-objectivePDF
[27]Purchase cost and user’s dissatisfaction minimizationMOGADomestic loadMulti-objective
[33]Operating cost and environmental governance cost minimizationAdaptive simulated annealing particle swarm optimization algorithmResidential, commercial, and industrialMulti-objectivePDF
[34]Economic and environmental cost minimizationMINLPResidentialMulti-objective
[51]Operation costs, emission pollution, loss of energy supply probability ϵ -constraintThermal and electrical loadMulti-objective
[35]Loss of power supply probability and energy cost minimization, and maximizing renewable generation availabilityMOPSOVillage loadMulti-objective
[36]Peak shaving and cost curtailmentMINLPElectrical and thermal loadSingle-objective
[37]Operating cost and voltage deviation minimization ϵ -constraintIEEE 34-bus test systemMulti-objectiveRoulette wheel
[52]Emission, cost, LOLE, and deviation ϵ -constraintThermal and electrical loadMulti-objective
[45]Least cost and least environmental footprintGA and MOGAResidentialSingle/Multi-objective
[46]Retailers energy cost minimization and clean energy utilization maximizationStochastic algorithmElectricity retailersMulti-objective
[53]Operation costs, emission pollution and customer satisfactionShuffled frog leaping algorithmThermal and electrical loadMulti-objectiveLog normal distribution function
[48]Economical and environmental situation optimizationMOPSODomestic, industrial, and commercialMulti-objectivePDF
[54]Operation cost and pollution emissionMOGA and MOPSODomestic, industrial, and commercialMulti-objectivePDF
[55]Environment and economic, and load curtailment cost ϵ -constraintThermal and electrical loadMulti-objective
This workOperational cost, clean energy utilization, pollution emission, uncertainty handling of generation and loadMOWDO and MOPSODomestic, industrial, and commercialMulti-objectiveMCS and PDF
Table 2. Bids and emissions coefficient of the sources considered in the developed model.
SourceBidStart/Shut Cost CO 2 SO 2 NO x P min P mx
WT1.0730000015
PV2.5840000025
Bat0.380100.00020.001−30−30
MT0.4570.967200.00360.1630
Grid-09500.52.1−3030
Table 3. WT and solar PV prediction analysis.
Hours WT (kW) PV (kW)Hours WT (kW) PV (kW)
11.78500133.915023.90
21.78500142.370021.05
31.78500151.78507.875
41.78500161.30504.225
51.78500171.78500.550
60.91500181.78500
71.78500191.30200
81.30500.200201.78500
91.78503.750211.30050
103.09007.525221.30050
118.775010.45230.91500
1210.41011.95240.61500
Table 4. Numerical outcomes of the operational and emission optimization obtained through the developed MOWDO and existing MOPSO algorithm.
TechniquesOperational CostPollution Emissions
MOWDO339.4316.5
MOPSO382.4336.5
Disclaimer/Publisher’s Note: The statements, opinions and data contained in all publications are solely those of the individual author(s) and contributor(s) and not of MDPI and/or the editor(s). MDPI and/or the editor(s) disclaim responsibility for any injury to people or property resulting from any ideas, methods, instructions or products referred to in the content.

