1. Introduction
European industry is firmly committed to integrating the concept of digitalization in order to be more competitive in the context of globalization. This process has been accelerated by the COVID-19 pandemic, which has affected businesses in all industries. Businesses were forced to implement new internal workflows and felt the pressure to offer their products through digital channels. They underwent significant changes and in a very short time introduced solutions based on digital technologies [
1]. The application of digital technologies makes it possible to implement new processes within the entire value chain, through production, sales, and services. According to [
2], the authors investigated the digitalization processes taking place in each industry and affecting the performance of small- and medium-sized enterprises (SMEs), where they found a relationship between the introduction of information technology (IT), digitalization, and financial performance. They found out that IT deployment, employee skill improvement, and digital strategy significantly drive digitalization. They identified IT as a key factor affecting financial performance through digitalization.
According to the European Commission, SMEs represent more than 99% of all businesses in the European Union (EU) and provide approximately two-thirds of total employment. They contribute significantly to the gross domestic product (GDP) of the EU, making up more than half of the added value of the non-financial corporate economy [
3]. Despite the fact that the COVID-19 pandemic has had a significant impact on SMEs across the EU, businesses have proven their resilience and adaptability to these challenges [
4]. A number of measures have been put in place to support them, including regulatory relief, financial assistance, and targeted programs to support digitization and innovation. Digitalization of SMEs can have a positive impact on the value added and performance. It can help SMEs to streamline processes and production, increase service quality and productivity, improve collaboration and communication within the enterprise, and improve the customer experience. These improvements can help SMEs increase their value added and improve performance, which is directly related to business growth and development. SMEs are better able to compete in the market, which is crucial for success and maintaining a competitive advantage [
5].
While there is a growing body of research exploring the broad topic of digitalization and its implications for businesses, including SMEs, the specific impact on performance measures is not yet well established. This gap indicates a need for more rigorous scientific studies that systematically investigate the effects of digitalization on various aspects of SME performance, such as productivity, profitability, innovation, market competitiveness, and customer satisfaction. Scientific support in this context refers to empirical evidence obtained through rigorous research methodologies such as quantitative analysis, case studies, surveys, or experiments. These studies should collect data on digitization initiatives implemented by SMEs and objectively measure their performance results. Addressing this gap requires conducting well-designed research studies that control for confounding factors, use appropriate statistical analyses, and consider contextual factors that may influence the relationship between digitization and performance. Similar to the already conducted studies that try to fill a gap in the given scientific field [
6,
7,
8], by scientifically investigating the impact of digitalization on SME performance, researchers can provide valuable insights, guidelines, and evidence-based recommendations for SMEs, policymakers, and other stakeholders to optimize the benefits of digital transformation and improve the overall business performance. The aim of this study is to highlight the relationship between digitalization and business performance, trying to understand whether companies that digitize are among those that are more prosperous and have higher performance. To test this relationship, we considered a sample of 27 member countries of the European Union (EU27), simulating a regression model for panel data considering a 5-year time horizon (2017–2021). Using a sample of the EU27 in the research provides a focused and comprehensive examination of the EU context, allows for comparative analysis, enhances statistical power, and takes advantage of the availability of relevant data. This research contributes to the existing literature by improving the understanding of the variables that influence the digitalization of businesses and providing empirical evidence on how the integration of digital technologies affects the performance of SMEs in the EU.
The article is structured into sections as follows: the first section includes the indicators used for this study;
Section 2 consists of a review of the literature among the investigated elements;
Section 3 presents the research methodology;
Section 4 presents the results;
Section 5 discusses the results and limitations of the conducted study; and finally,
Section 6 presents conclusions and future research directions.
Research Indicators
In this section, we will summarize the indicators (variables) that were authoritative for our research, which fall under the umbrella of quantitative research approaches. Such methods prioritize the identification of causal laws rather than individuals’ experiences or beliefs, making them more objective. As the study employs public data, it is repeatable. To evaluate the study’s overall quality, reliability and validity serve as essential criteria. Therefore, our goal is to ensure consistent, non-fluctuating results when applying the same data to future studies. That is why we have used reliable sources such as:
Eurostat—the statistical office of the European Union.
European Commission—the executive branch of the EU, which provides information on the policies, programs, and activities of the EU.
European Investment Bank.
The following indicator expresses the share of total added value that SMEs of the EU27 create. It evaluates the economic contribution of SMEs, which is considered to be the key and driving force of innovation, job creation, economic growth, and the very performance of the company. The source for these data is Eurostat and the annual reports of the European Commission. Enterprises that create a higher share of added value in the economy tend to be more innovative, competitive, profitable, and efficient [
3]. It is one of the important indicators of business success and efficiency, because it expresses the value that SMEs will create in the market. In
Figure 1, we can see the representation of SMEs in the EU27 individually, where Cyprus, Estonia, and Malta are among the most prosperous in this indicator.
Given that employment in SMEs represents approximately 98% of all businesses in the EU27, employs more than 93 million people, and accounts for 67.4% of total employment in the non-financial business economy, overall employment in SMEs in the EU27 is highly significant [
9]. These businesses are a key source of employment and contribute to the overall development of SMEs in the EU27. Employment of SMEs in the EU27 has a significant impact on their performance and success. Companies that manage their workforce effectively can achieve benefits (innovation, increased productivity, competitiveness), while those that do not may face limitations and challenges.
Figure 2 shows the percentage of SME employment in the EU27 by country.
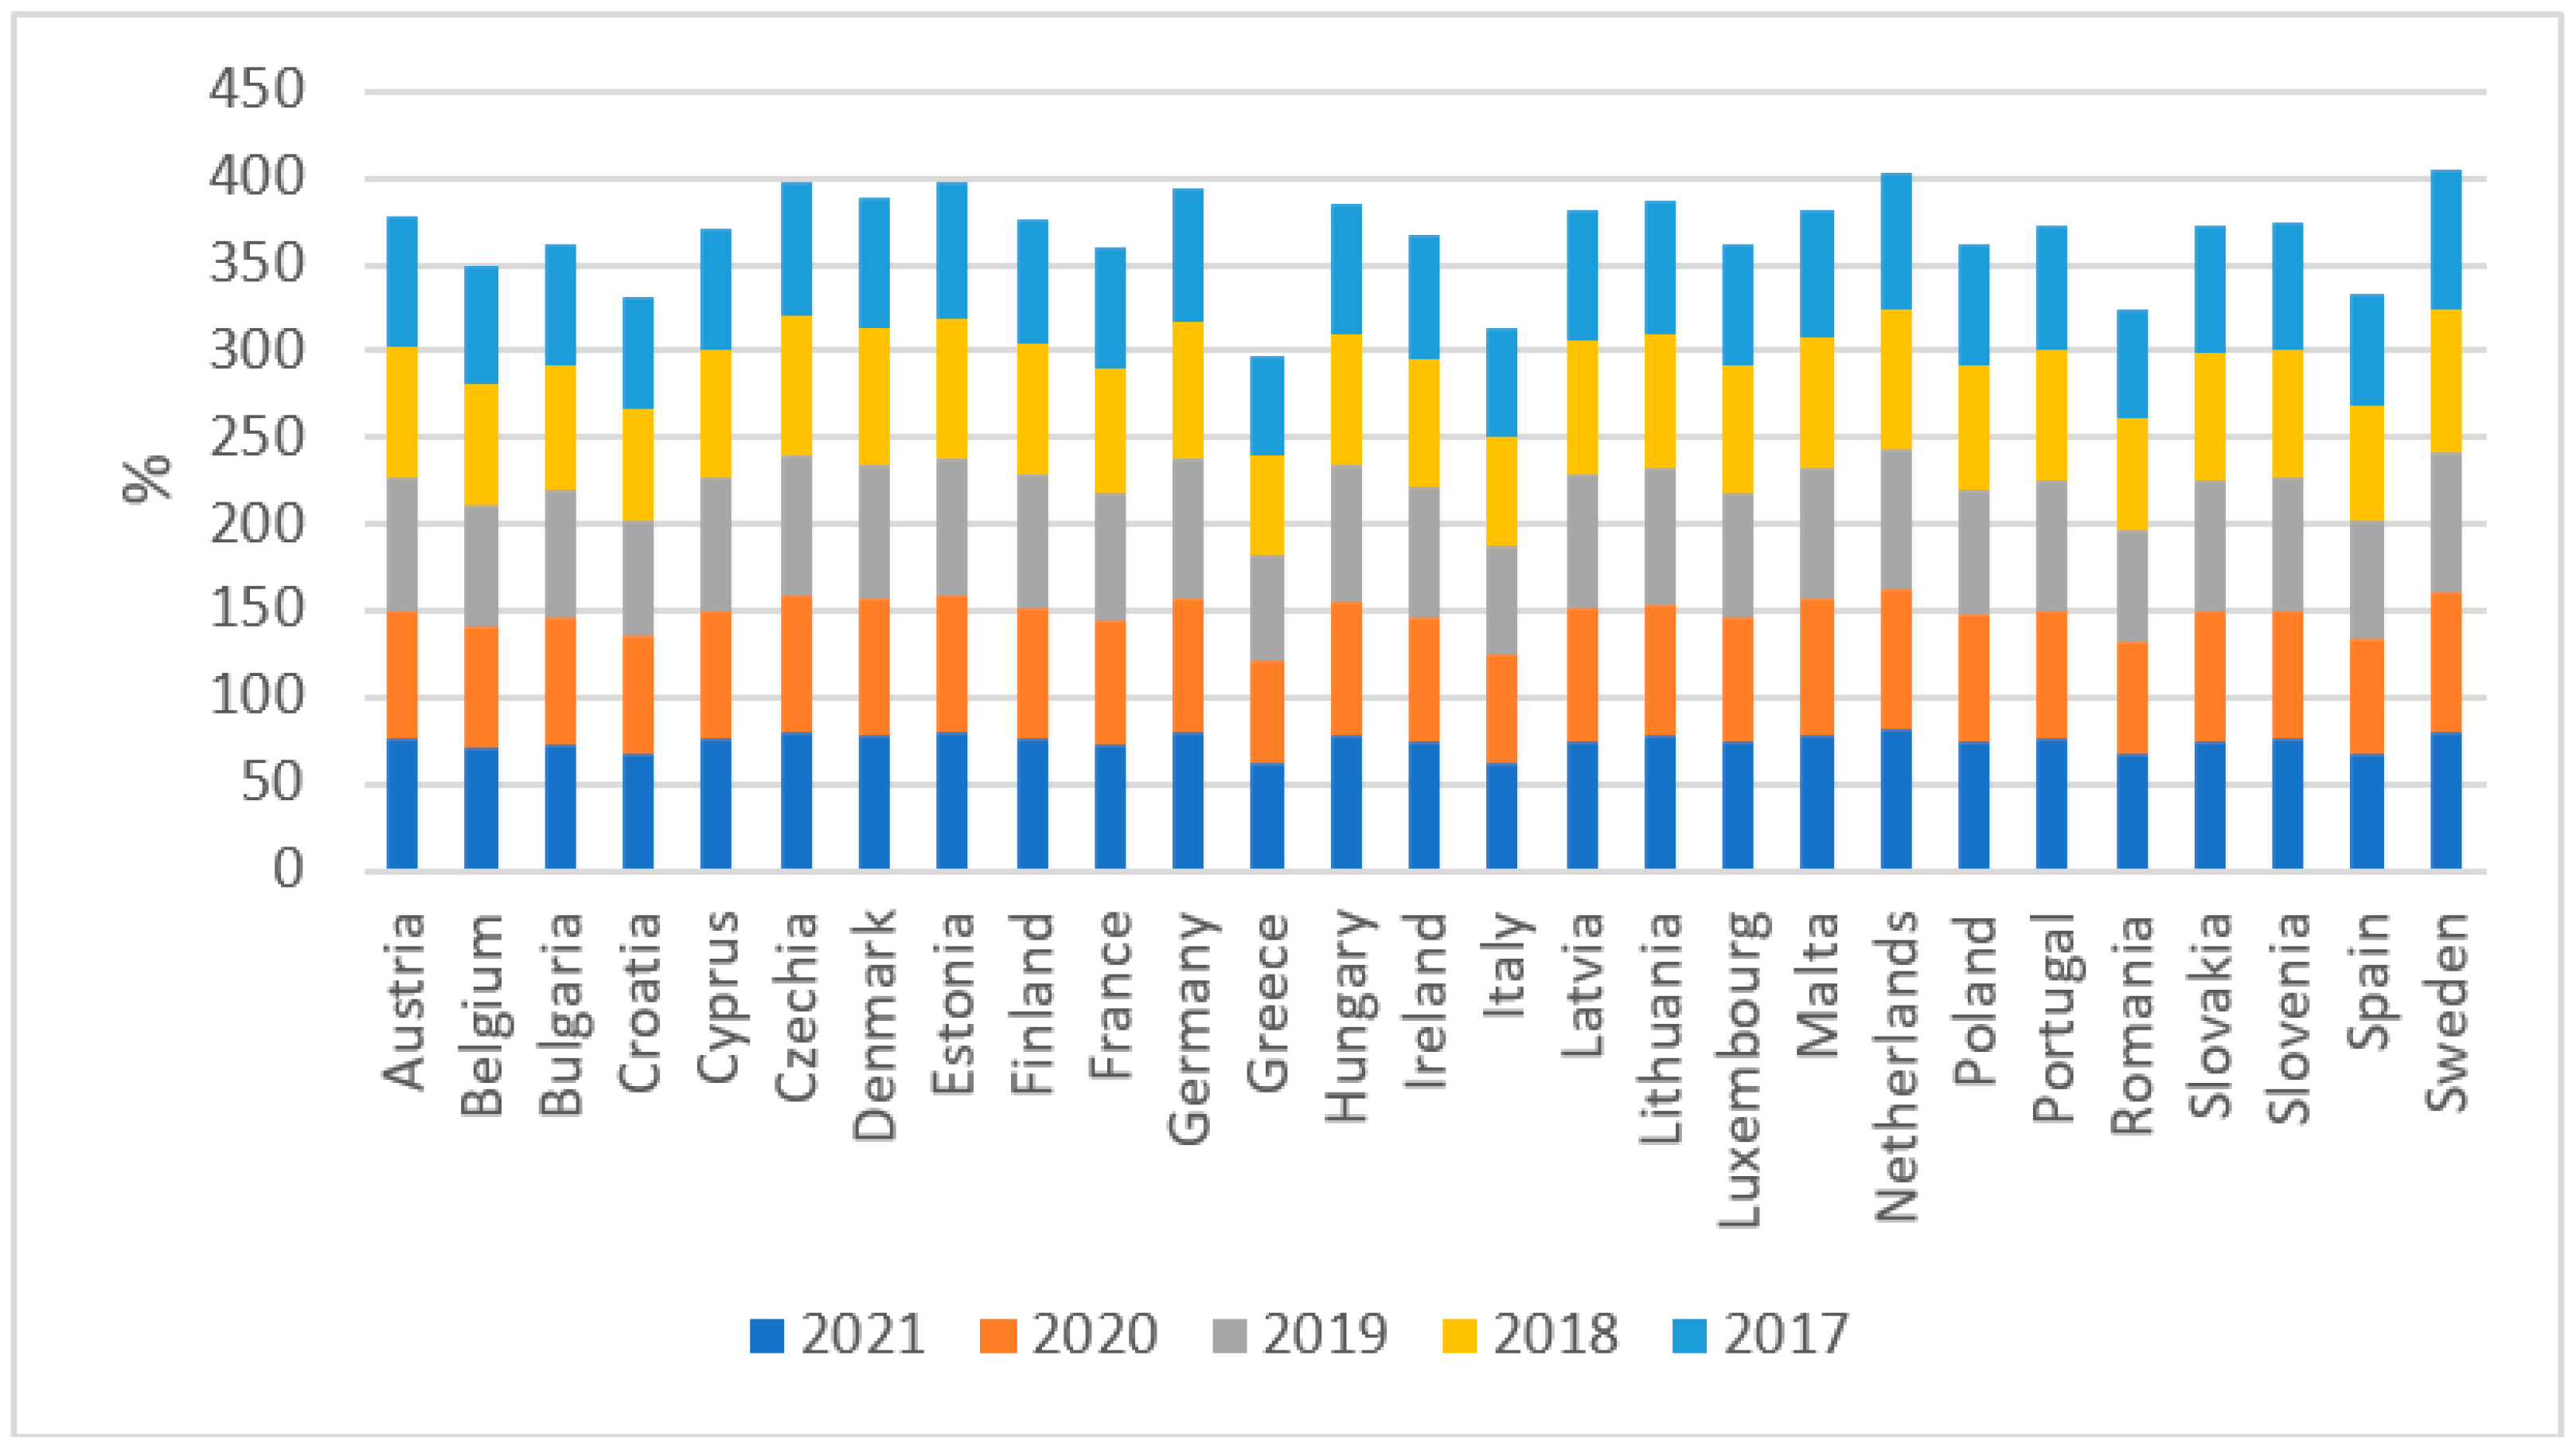
The digital intensity index (DII) serves as a tool for evaluating the digital maturity and competitiveness of businesses in the digital world. It enables them to streamline and improve their processes, enhance their outcomes, and increase the efficiency of resource utilization. This index is also used to compare the level of digital maturity and the degree of implementation of digital technologies or to identify opportunities for improvement and growth of businesses. The DII is calculated by taking the ratio of a company’s digital revenue to its total revenue, multiplied by 100. A higher DII indicates that a company is more digitally intensive and therefore more reliant on digital technologies. The source for our data is DESI, and its indicator DII in SMEs in each EU country from 2017 to 2021 is displayed in
Figure 3.
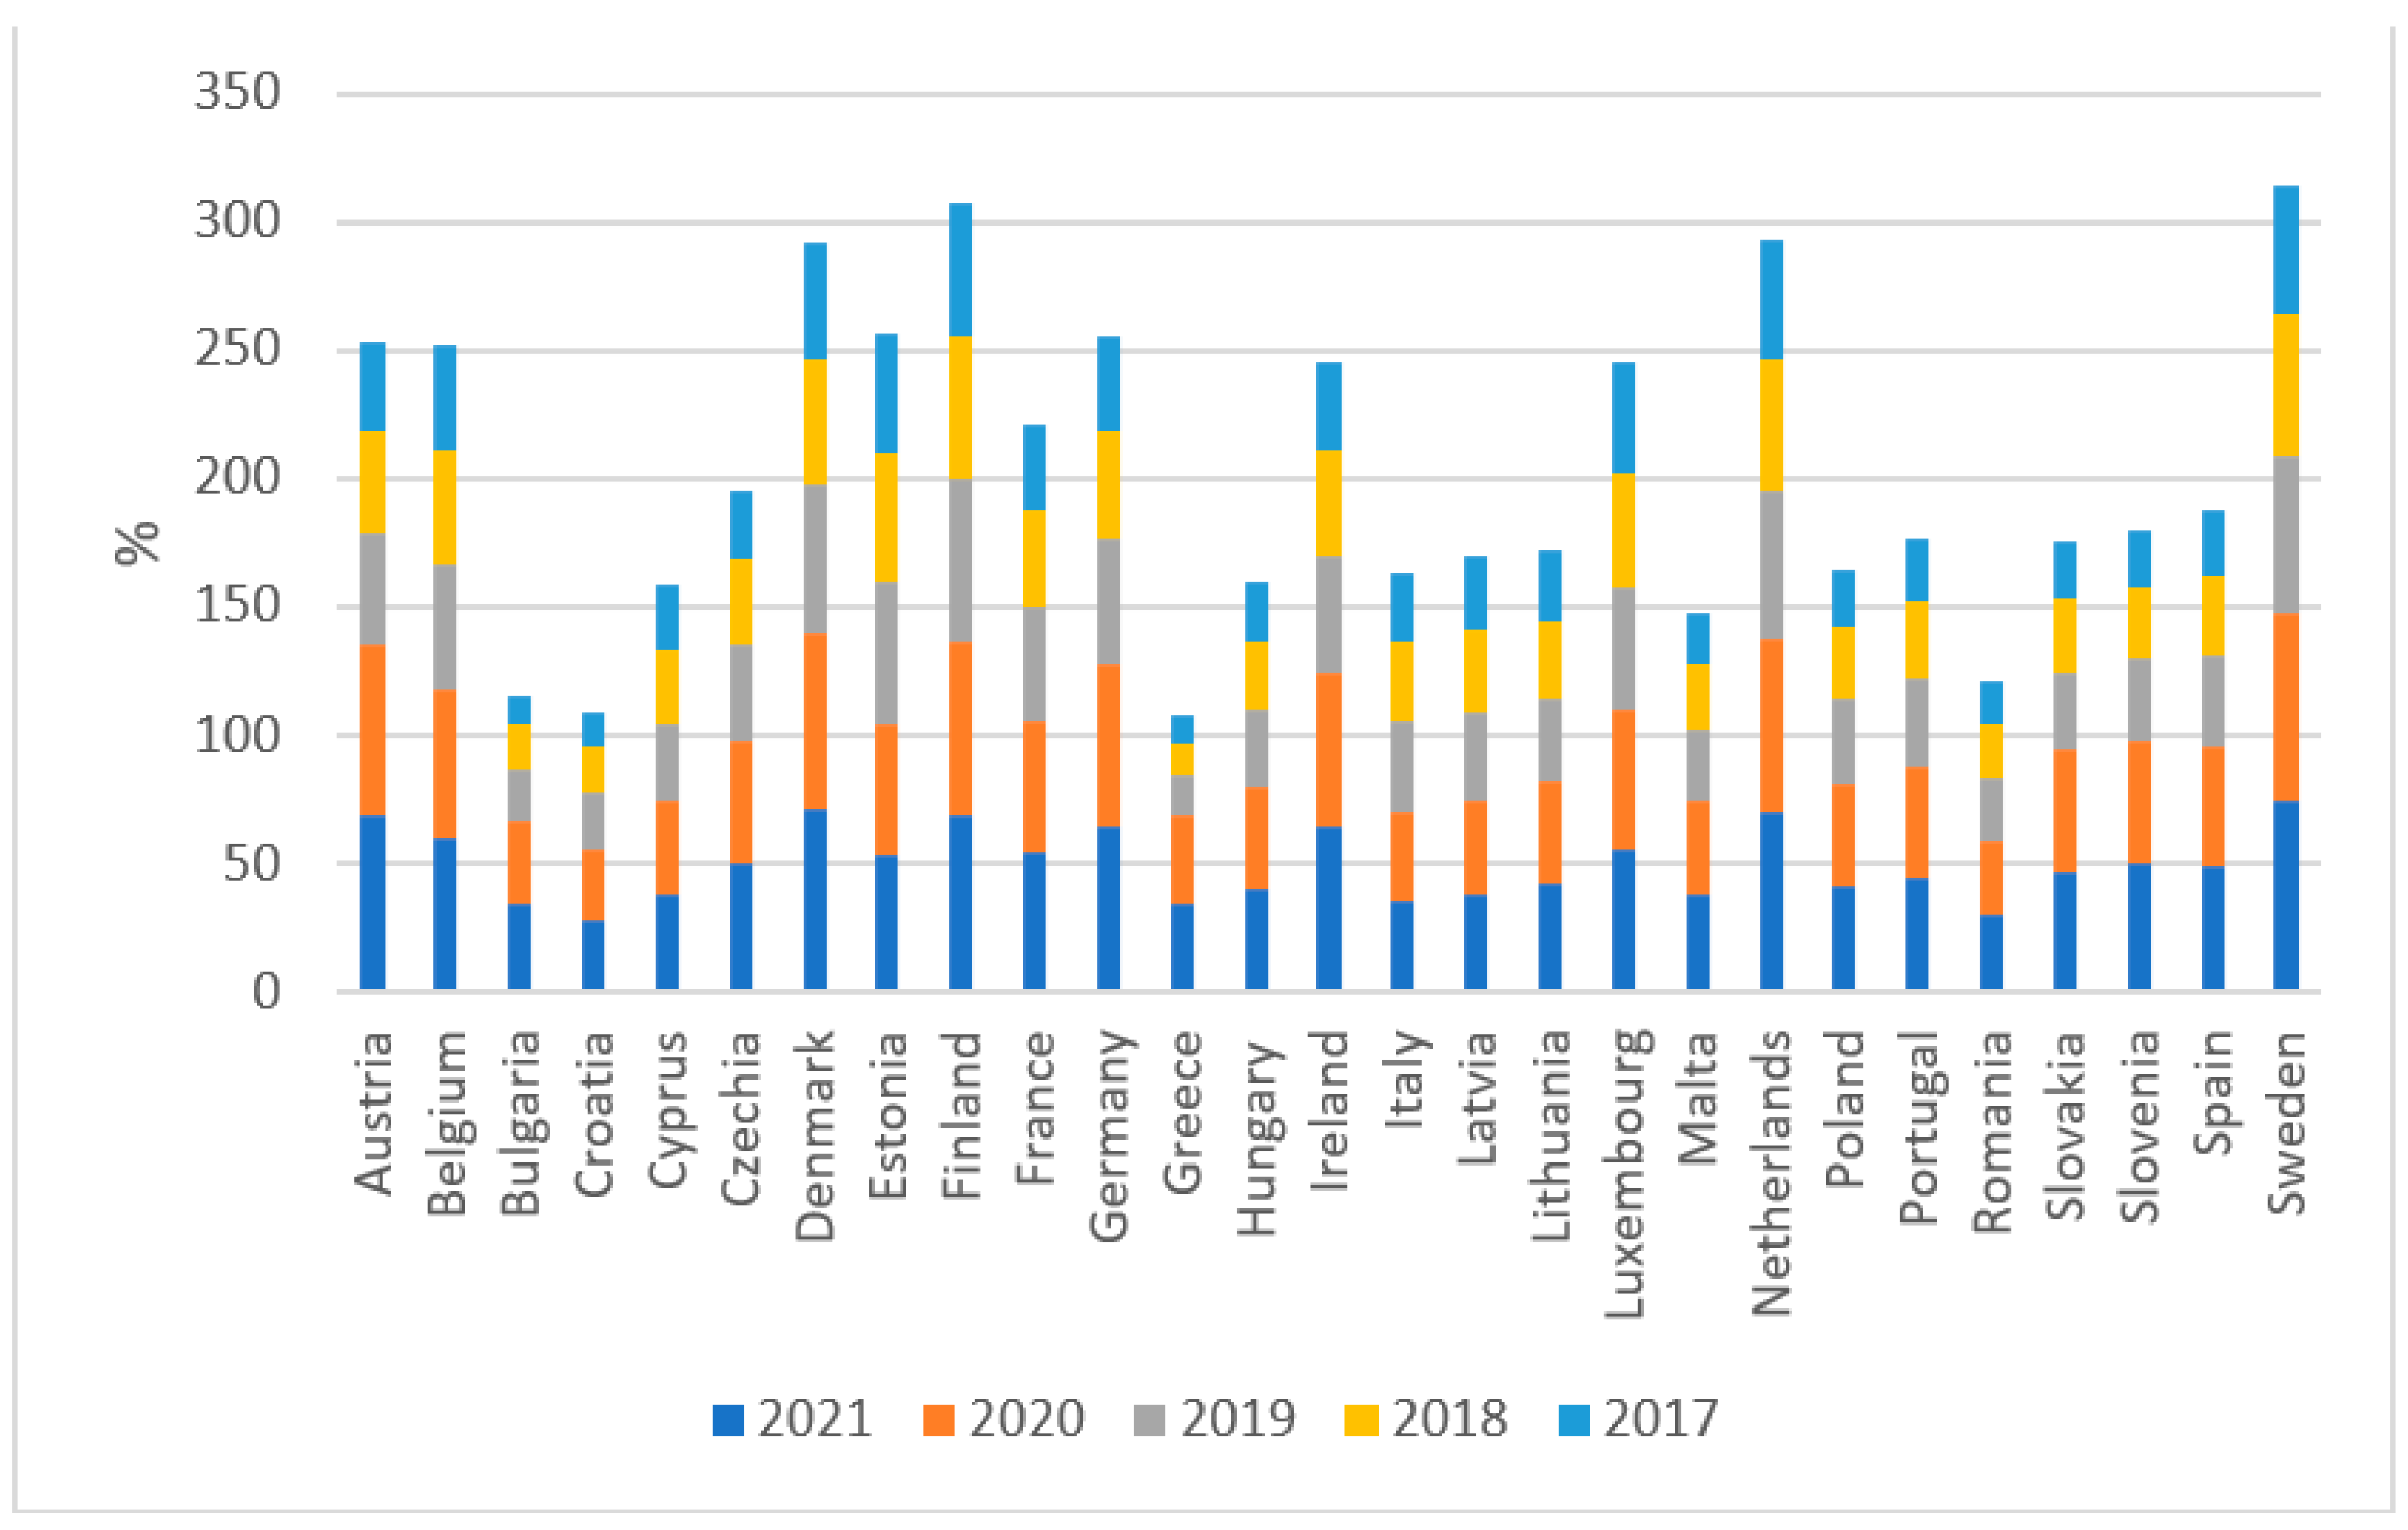
The indicator of integration of digital technologies measures the extent to which SMEs in the EU27 adopt and use digital technologies in their business activities. Measuring the integration of digital technologies in SMEs is of utmost importance for understanding the digital competitiveness and readiness of SMEs in the EU. The index takes into account factors such as the level of automation, the degree of data integration, and the use of advanced analytics. Integration of digital technologies is calculated by assessing the degree of adoption of digital technologies across these different areas of a company’s operations. While the DII focuses on the share of digital revenue in total revenue, the digital technology integration index evaluates the extent to which a company has integrated digital technologies across various areas of its operations. Both indexes are useful in assessing the level of digitalization of a company, but they provide different perspectives on the use and integration of digital technologies [
16]. The countries with the best results according to
Figure 4 are Denmark, the Netherlands, Finland, and Sweden. On the other hand, the countries with the lowest performance in implementing DT are Bulgaria, Croatia, Greece, and Romania. The data are presented as the percentage representation of DT integration in SMEs in the EU27 from the DESI index in the years 2017–2021.
A positive GDP growth rate indicates that businesses are producing more goods and services, thereby contributing to overall economic expansion. However, factors such as technological advancements, economic conditions, and government policies can also influence GDP growth in businesses [
17]. A negative GDP growth rate, as seen during the COVID-19 pandemic (see
Figure 5, year 2020), can contribute to a decline in economic activity, which can in turn affect overall investment and development in the country.
Total investments (
Figure 6) measured as a percentage of GDP in the EU27 represent the share of total investment in the region as a percentage of GDP. This indicator expresses how much of the economic activity in the region was spent on investments in a given period. They are regularly monitored and published by various organizations, including Eurostat, the European Central Bank, and the European Investment Bank.
One of the main priorities of EU development is, among other things, digitalization. The concept of sustainability and digitalization in all areas of life of EU member countries is becoming increasingly important and represents a driving force for economic development [
20]. As a result, the implementation of digital tools and models is important and necessary to ensure the sustainable development and growth of EU businesses. The use of digital models and tools, or the overall digitalization of businesses, became the number one topic during the recent COVID-19 pandemic, not only in Slovakia but also in other EU countries, especially due to the threat of bankruptcy [
21].
2. Literature Review: Digitalization of SMEs and Business Performance
The concept of Industry 4.0, also known as the phenomenon of the Fourth Industrial Revolution, is based on a business strategy that involves the application of digital technologies at the enterprise level [
22,
23]. This event has significantly influenced every aspect of corporate life, making the adoption of new technologies necessary to remain competitive among businesses and in a constantly evolving market [
24,
25]. By developing a solid competitive advantage, technology allows companies to differentiate themselves from their competition [
26]. The current course of digital transformation requires the digitalization of the production system, greater automation of processes, and the interconnection of production sites that facilitate the automatic exchange of information and data [
27]. Within supply chains, new technologies also affect business models with regard to communication [
28].
Digital transformation offers growth and competitiveness opportunities for companies of all sizes [
29]. In Turkey’s manufacturing sector, digital transformation has been shown to improve business processes and increase capabilities [
30]. However, SMEs face challenges in implementing digital technologies and require external support to integrate them into their overall business strategy [
31]. Adopting digital technologies strategically and appropriately can stimulate the productivity, competitiveness, and performance of SMEs [
32,
33]. Utilizing the latest digital technologies and digital marketing can help businesses reach customers more effectively from a distance, thus affecting their performance [
34]. Effective adoption and use of digital technologies significantly impact SMEs’ performance [
35,
36]. Investing in innovation allows companies to achieve improvements in business processes by using advanced digital devices that control production phases in real time [
37]. In this way, the profitability of the company can increase with the implemented technology [
38]. Streamlining asset, economic, and financial performance is one of the main priorities of all companies, and new digital technologies play a key role in achieving this goal [
39]. There is a positive relationship between economic performance and digital technologies [
40]. According to [
41], the most innovative companies are also those that have the highest profitability.
Depending on the industry, digital transformation varies for companies. Digital transformation of companies depends on several factors, including the level of application of cutting-edge technologies, changing customer needs, and market size, in addition to the business sector [
42]. Boundary companies in digitalization show higher productivity and revenue in the long run compared to less digitally oriented companies [
43]. SMEs can also use digital technologies to maintain marketing by supporting their business functions, such as using social media applications, open-source software, mobile security, or e-commerce platforms to maintain marketing or using video conferencing, instant messaging, and shared calendars. These digital technologies may require payment for use or may be completely free [
44,
45]. Other tools aimed at improving SMEs’ performance, whether at an economic, social, or environmental level, include big data, Blockchain, artificial intelligence, and the Internet of Things [
46].
Companies’ level of digital transformation varies depending on contextual factors and can be grouped into three categories. The first group includes SMEs that have a high level of digital maturity and rapidly transition to digitalized businesses when faced with challenges. The second group consists of SMEs that have liquidity problems but low levels of digital sophistication and digitize only their sales function. The third group comprises SMEs with limited digital literacy but are supported by a high level of social capital and seek potential partners with excellent digital skills to address problems [
47]. Successful digital transformation requires investment in various dimensions, including infrastructure, IT technologies, intellectual, strategic, formal and informal, structural, cultural, and social dimensions [
48,
49]. For ideal optimal performance results, significant operational changes must occur in the external environment in correlation with compatible internal organizational changes [
50]. However, these internal changes often face obstacles and challenges, which can be overcome by adapting business models, knowledge, and technologies. To increase the benefits of adopting digital technologies, SMEs must spend more time and effort innovating their business models [
51].
Digital technologies can facilitate financial inclusion for SMEs, allowing them to obtain financial resources more quickly [
52,
53]. Studies have shown that digital financial services significantly help SME owners and managers to manage their finances and transactions efficiently. However, there is a need to increase the portfolio of financial products on digital platforms and reduce the cost of using digital financial services to maximize their potential [
52,
53,
54]. Additionally, increasing access to sources of financing other than traditional ones, such as bank loans, can stimulate SME performance [
54,
55,
56].
While digitization has numerous positive effects on SME performance, conflicting results exist. For instance, one study from 2021 demonstrated that digital technologies have a low impact on businesses’ innovative performance and that R&D expenditures are the most reliable predictor of innovation [
57]. This study challenges the belief that digital technologies can enhance innovative performance.
Based on all the findings and in accordance with the previous literature review, a research question was formulated to analyze the impact of digitalization on firm performance: “Does digitalization have an impact on SMEs performance?” Furthermore, we formulated research hypotheses listed in
Table 1, which will help us answer the research question.
3. Research Methodology
Our research consists of an econometric analysis of panel data to verify and test the impact of digitalization on the performance of SMEs, respectively, to confirm/reject our hypotheses. The dataset of 135 observations represents data collected from the 27 EU countries over a span of five years. To answer the research question and confirm/reject the established hypotheses, we created a five-year panel dataset, where the time frame is from 2017 to 2021.
Figure 7, which shows the research flowchart, will serve as a better overview of the process of conducting this study.
The longitudinal data or panel data method was chosen for its ability to track the same individuals over time, making it easier to analyze dynamic reactions and control unobserved heterogeneity in data that contain both cross-sectional elements and time series [
58]. Using panel data has several advantages, as stated by [
59], including greater variability, less collinearity between variables, more degrees of freedom, higher efficiency, and control of individual heterogeneity, providing more informative data. The statistical program used for the analysis was EViews 12 [
60]. The following
Table 2 specifies six variables that are based on the dataset and will be observed.
The independent variables listed above will serve to answer the research question and confirm/reject our hypotheses, which are one of the main factors describing the level of digitalization of SMEs in the EU. At the same time, we have identified the share of value added and employment as the dependent variables, which are considered key performance factors in businesses.
When we talk about interactions between dependent and independent variables, according to [
61,
62], higher value added can support employment growth, and conversely, increased employment can increase productive performance, which can support the growth of value added. Additionally, the integration of digital technologies can increase the digital intensity index and indicate a stronger integration of digital technologies into multiple business areas, which can lead to more efficient and faster operations. GDP growth can support greater overall investment, and increased investment can lead to faster GDP growth, as it can support the creation of new jobs, the development of new products and services, and promote economic growth.
Theoretical Background of Analysis
We utilized the least squares dummy variables (LSDV) method, which is a technique specifically designed for panel data analysis. The LSDV method allows for individual-specific effects to be captured, providing a more effective and consistent estimate [
63].
To test our hypotheses, we employed a linear regression model using regression Equation (1), which considered both our dependent and independent variables. This model illustrates the relationship between the independent variable and the dependent variable, indicating how a change in the independent variable can impact the dependent variable:
where:
is the dependent variable for observation (country) i in time (year) t.
is the independent (explanatory) variable for observation i in time t.
is the country-specific intercept.
β is the coefficient on the independent variable .
is the time-fixed effect (time dummy variables) for time period t.
is the error term for observation i in time period t.
Based on Equation (1) and the number of dependent and independent variables, the final analysis is divided into two separate models (equations). The resulting equations for our study thus take the form:
where:
are dependent variables.
are independent variables.
are control variables.
Regression analysis is commonly used to examine the relationship between independent and control variables with a dependent variable. To determine the model specification for Equations (2) and (3), we conducted various tests, including considering whether to use pooled data or account for heterogeneity using fixed or random effects.
Fixed effects models assume that each entity has a unique intercept, which remains constant over time. In contrast, random effects models allow the intercept to vary randomly beyond the specific values of the independent variable, without making precise assumptions about the variables. However, both fixed and random effects assume that the effects are constant in time. Therefore, the main difference between fixed and random effects is that fixed effects assume that the effects are specific to each entity, while random effects allow for more flexibility in the intercept. It is important to carefully consider the appropriate model specification based on the research question, data characteristics, and assumptions of the different models [
64].
Our proposed model aims to understand the relationship between the DESI index and the value added of SMEs, and the effects of the model can be confirmed through tests on data. We performed a Hausman test to determine whether to use fixed or random effects in our model.
4. Results
To understand the variability of values in our analysis, we will provide descriptive statistics of the variables used. We present the mean, median, and standard deviation, which represent indicators of how close the data points are to a normal distribution. In the case that the data have a standard distribution, or express characteristics of a Gaussian distribution, the mean and median are close to each other. From
Table 3, it is evident that all variables in the model have means and medians with similar values, indicating that the distribution of the variables is likely to be symmetric. Looking at the table, we can identify potential major deviations in the following variables:
The DII variable has a range of 65.8 (88.4–22.6), indicating significant variability across the observations. Additionally, the standard deviation of 14.402 suggests a relatively high dispersion of values around the mean. This suggests that there are substantial differences in the digital intensity levels among the countries included in the sample.
Similar to the DII variable, the integration of digital technologies variable also exhibits a wide range of 64 units (75–11). The standard deviation of 14.809 further confirms the presence of significant deviations among the observations. This indicates varying levels of integration of digital technologies across the countries in the sample.
The GDP growth variable shows a range of 20.3 (9.5–(−10.8)), indicating substantial variations in economic growth rates. The standard deviation of 4.095 suggests a moderate level of dispersion around the mean. This implies that different countries in the sample experienced diverse rates of economic growth over the specified time period.
These deviations highlight the heterogeneity and diversity among the countries included in the sample.
To justify the findings presented in
Table 3, we can consider the following points:
Sample Size: The table indicates that there are 135 observations for each variable, which is a reasonably large sample size. A larger sample size increases the reliability and precision of the statistical measures reported, providing more confidence in the findings. The consistent number of observations for each variable implies that the analysis covers the same set of countries or entities consistently across all variables. This ensures comparability and allows for meaningful analysis and interpretation of the relationships among the variables.
Mean and Median: The mean and median values provide measures of central tendency for each variable. The closeness of the mean and median suggests that the data distribution is standard. This indicates a symmetric distribution of values for the variables under consideration.
Range: The range between the maximum and minimum values indicates the extent of variability within each variable. For example, the maximum value of value added is 78.700, and the minimum value is 42.300, indicating a range of 36.400. Similarly, the ranges for other variables are also provided. The wide ranges observed suggest significant variations across the observations, reflecting the diversity within the dataset.
Standard Deviation: The standard deviation measures the dispersion or variability of values around the mean. A higher standard deviation indicates greater variability within the variable. In
Table 3, the standard deviations for most variables are moderate to high, suggesting substantial variation within the dataset.
Considering these points,
Table 3 presents descriptive statistics that summarize the characteristics and variability of the variables in the dataset. These statistics highlight the importance of the dataset’s characteristics and variations within the research context.
To ensure the reliability of the model and the results, several tests were performed. One such test was conducted to identify a direct relationship between the independent variables of the model, known as multicollinearity [
65]. If the model represents multicollinearity, the regression coefficient would not represent the true ceteris paribus, indicating that the variables are interrelated. In such a case, the model cannot accurately capture the true impact on the dependent variable. The correlation matrix for Equation (2) is shown in
Table 4, which indicates that no correlation greater than 0.7 or less than −0.7 was found between the variables [
65].
Similarly, in
Table 5, which represents the correlation matrix for Equation (3), the coefficients being less than 0.7 suggests that the variables do not exhibit a strong linear association with each other. The correlation coefficients are relatively small, indicating that there is no linear relationship between the variables. Therefore, we can conclude that there are no problems with multicollinearity between the selected variables in both cases (Equations (2) and (3)).
Next, we ran the Breusch–Pagan heteroscedasticity test with the following hypothesis:
The results presented in
Table 6 reveal that the
p-values associated with Equations (2) and (3) are greater than the significance level of 0.05. This indicates that there is no strong evidence to support the presence of heteroscedasticity in the model. As a result, we accept the null hypothesis, suggesting that the assumption of homoscedasticity is met.
In the next step, we will perform a Hausman test for Equations (2) and (3) to determine which method we will use to perform regression analysis of the data. The Hausman test establishes the following hypotheses:
According to
Table 7, the probability value (
p-value) in both equations is less than 0.05, or less than 5%. In this case, we reject H0 and accept H1, which means that the fixed effects model is more appropriate for our study.
Table 8 shows the final results of the panel data regression analysis for Equation (2) using the LSDV method with the fixed effects model. The coefficient estimate for the digital intensity index is 0.139 (standard error 0.049), and it has a
p-value of 0.006. This suggests that a one-unit increase in the digital intensity index is associated with an estimated increase of 0.139 units in the value added, holding other variables constant. The relationship is statistically significant at the 1% level. The regression model has a high level of explanatory power, as indicated by the R-squared value of 0.843. This means that approximately 84.3% of the variation in the value added can be explained by the included independent variable. The adjusted R-squared value of 0.799 takes into account the complexity of the model and suggests that approximately 79.9% of the variation in value added is explained, considering the number of variables and degrees of freedom. Thus, the R-squared and adjusted R-squared values suggest that the model explains a large portion of the variation in the dependent variable (value added).
As in the previous step,
Table 9 shows the final results of the panel data regression analysis for Equation (3) using the LSDV method with the fixed effects model. Similar to the regression analysis of Equation (2), the coefficient estimate for the integration of digital technologies is 0.056 (standard error 0.011), and it has a highly significant
p-value of 0.000. This suggests that a one-unit increase in the integration of digital technologies is associated with an estimated increase of 0.056 units in employment, holding other variables constant. The relationship is statistically significant at the 1% level. The regression model demonstrates a high level of explanatory power, as indicated by the R-squared value of 0.974. This means that approximately 97.4% of the variation in employment can be explained by the included independent variable. The adjusted R-squared value of 0.967 takes into account the model’s complexity and suggests that approximately 96.7% of the variation in employment is explained, considering the number of variables and degrees of freedom. Thus, the R-squared and adjusted R-squared values suggest that the model explains a large portion of the variation in the dependent variable (employment).
As previously stated in the methodology section of our study, our panel regression analysis aims to establish causality between the independent and dependent variables. In the following section, we will discuss the R-squared and adjusted R-squared coefficients and use them to answer our research question and validate our hypotheses.
5. Discussion
The main objective of this article is to discuss the causality between our dependent and independent variables. In the results of
Table 8 and
Table 9, we can see the statistical relevance of the independent variables with R-squared and adjusted R-squared. The statistical term “R-squared” indicates the proportion of variation in the dependent variable that is accounted for by the independent variable. The value of this coefficient falls within the range of zero to one, with zero signifying that the independent variable has no effect on the dependent variable and one indicating that the independent variable (DII) perfectly accounts for the dependent variable (value added). In our case for both equations (models), this is a quite high value, from which we can conclude that the regression model confirms the positive causality between the variables and is statistically relevant. Furthermore, the results reveal that the control variable total investment has a statistically significant negative impact on value added. The total investment variable is considered as a control variable and is not the central topic of discussion in this research.
These conclusions (Equations (2) and (3)) are based on an analysis of 135 observations in the context of a 5-year time span. It is important to note that the significance levels of the coefficients are denoted by asterisks: * indicates p < 0.1, ** indicates p < 0.05, and *** indicates p < 0.01. These levels help assess the statistical significance of the coefficients and provide insights into the reliability and robustness of the relationships between variables. For this study, measurement validity (construct validity) was a key criterion because we were looking for measurements that would reflect the concept. One of the most common problems in conducting a quantitative study is the problem of incorrect measurement of variables, and to overcome this, we used control variables that are highly related to the topic and theory. Regarding the control variables used, there are several notes to be made. Firstly, for our model and evaluated datasets, GDP growth and total investment are not statistically relevant as control variables.
Given the performed panel regression of data in both models, we can now move on to confirming or refuting our hypotheses.
Table 10 presents the results of the hypotheses.
According to the validity of our hypotheses, we can confirm that independent variables (DII and integration of digital technologies), representing the digitalization of SMEs in the EU27, have a significant impact on our dependent variables (value added and employment), representing the performance of SMEs in the EU27, and there is a mutual causality between them.
The adoption of digital technologies by SMEs can improve their efficiency and productivity, creating a competitive advantage against their rivals [
66]. This can also lead to the acquisition of new competencies, skills, and knowledge, inspiring businesses to introduce new processes and products. While there are multiple innovation advantages to digitalization, SMEs are limited by their financial and human resources, making it challenging to adopt these technologies [
67,
68]. According to these financial limitations, we are not concerned that control variables, mainly related to finances, could influence the overall outcome, as these variables are not the central topic of this study. There are many indicators from which our dependent variables are derived. In this study, we carefully selected those control variables that we know have some impact on the dependent variables, but this impact is shared among many other indicators, and given the limited financial resources of SMEs, they become sufficiently relevant to our study.
Upon analyzing the results of both regression models, it can be concluded that the model was appropriately specified. Additionally, both selected independent variables (digital intensity index and integration of digital technologies) were significant and had a positive impact, establishing a causal relationship between digitization and business performance. Our results could be linked to other studies, where one of them focuses on various aspects of digitization in German firms, where authors examine the impact of big data analytics on product innovation in German manufacturing and service companies [
69,
70]. The other study examines the impact of Industry 4.0 on product innovation in German manufacturing and service companies. Both studies found a positive impact of big data and Industry 4.0 on product innovation. Research and development are a key driving force of innovations in SMEs of different sizes. This finding is consistent with the authors of the study, who examine how digital technologies such as 3D printing and big data affect the innovation performance of European companies [
55]. Empirical findings suggest that digital technologies do not support innovations and that investments in research and development are the most reliable predictors of innovations.
In contrast to the mentioned German studies [
68,
69], our research focuses on the digitalization of SMEs in general. First, it focuses on SMEs that are characterized by limited financial and human resources that may hinder the speed of digital technology adoption, as well as business performance. These numerous inhibitory factors may have suboptimal effects on the innovation performance of SMEs. Second, SMEs are considered a heterogeneous group of enterprises in this study, with micro-enterprises facing greater negative effects of limited resources than small- and especially medium-sized enterprises. Therefore, a more detailed panel data analysis of SMEs depending on their size could be the subject of future research. The results of such a study could reveal more detailed results and impacts of digitalization on business performance.
Limitations of the Research
The topic of the impact of digitalization on the performance of SMEs in European countries is an important area of research, but like any study, it also has its limitations. In the following points, we will present several broader perspectives on the limitations of this study:
Data quality and availability: One of the biggest limitations of the conducted panel data analysis is the quality and availability of data. In the case of the conducted study, we had to ensure that the selected indicators had a certain relevance and availability. To solve the problem of accessing data for all countries based on their national economies, which are necessary for the analysis, we decided to use indicators that are publicly available through the official statistical offices of the EU, the World Bank, and the European Commission.
Correlation vs. causality: Another limitation of panel data analysis is the difficulty in establishing causality. Although we found a correlation between digitization and SME performance, it is challenging to determine whether digitization caused an improvement in performance or whether the improvement was caused by other factors.
Generalizability: The study’s findings may not be applicable to all SMEs in European countries, as the sample size and composition may not be representative of the entire population. Additionally, the study may not be generalizable to SMEs in other regions or countries, as digitalization and business practices may differ.
Panel data analysis: While panel data analysis is a powerful tool for studying change over time, it is not without its limitations. For example, it assumes that the effects of the independent variables are constant over time, which may not be the case. Additionally, the study may have omitted important variables that could affect SMEs’ performance, leading to potential confounding variables.
6. Conclusions
The aim of our study was to investigate the impact of digitalization on the performance of SMEs. We focused on a group of SMEs in the EU27 from 2017 to 2021 and analyzed datasets of dependent variables representing business performance and independent variables representing SMEs’ digitalization. Panel data analysis was conducted using the statistical software EViews 12, providing valuable insights into the relationship between digitalization and SME performance.
The results of the panel data analysis indicate that the integration of digital technologies and the intensity of digitalization significantly enhance business performance in terms of value-added growth and employment within the EU27. Notably, our study period encompassed the effects of the COVID-19 pandemic, which accelerated digitalization efforts and presented challenges to traditional business development.
Our findings contribute to the existing knowledge on the role of digitization in improving SME performance. They can serve as inspiration for future studies and have implications for researchers and policymakers, highlighting the importance of digitalization in driving SME success.
Moving forward, there are several research challenges that need to be addressed in this field. One challenge involves identifying and categorizing specific risks associated with digitalization, such as cyber threats and data breaches. Additionally, further research is needed to quantify the extent of the impact of digitalization on SME performance and assess the negative effects of digitalization-related risks. It is also important to understand how the impact of digitalization varies across different industries and conduct industry-specific studies.
Addressing these challenges through future research can help deepen our understanding of the impact of digitization on SME performance in the European context, especially in the face of crises and risks. It is crucial to identify measures and strategies that can help SMEs cope with these challenges and leverage digital technologies effectively. Factors such as education and training, access to technology and information, and the utilization of digital tools to improve customer experience should also be investigated.
In conclusion, further exploration is needed to better comprehend the impact of digitization on SME performance in the face of crises and risks. These research challenges represent crucial areas for future investigation, offering valuable insights for SMEs aiming to enhance their competitiveness and navigate the dynamic business environment. Expanding the sample size globally and including more variables measuring digitalization and business performance could be a potential direction for future research, enabling a more comprehensive panel data analysis based on SME size.


