Article

Strategies of Participants in the Carbon Trading Market—An Analysis Based on the Evolutionary Game

School of Economics Management and Law, University of South China, Hengyang 421001, China
*
Author to whom correspondence should be addressed.
Sustainability 2023, 15(14), 10807; https://doi.org/10.3390/su151410807
Submission received: 13 May 2023 / Revised: 5 July 2023 / Accepted: 6 July 2023 / Published: 10 July 2023

Abstract

:
To effectively understand the collaborative and evolutionary mechanisms of three stakeholders in carbon trading namely, government, emission reduction enterprises, and emission control enterprises, it is important to identify the factors that affect decision-making behaviors amongst game players, ultimately contributing to the goal of “double carbon”. In this study, we constructed a tripartite game model, analyzing the selection mechanism for game strategies related to carbon trading participants through replicated dynamic equations. We also discussed the main factors that influence the evolutionary and stable outcomes of carbon trading through scenario simulations. Additionally, we introduced prospect theory to examine the impact of risk sensitivity and loss avoidance levels amongst decision-makers on the optimal outcome of the system. Our findings reveal that in the initial game model, the three decision-makers show a cyclical behavior pattern, but the system stabilizes in the optimal equilibrium state (1,1,1) when certain conditions are satisfied. Furthermore, the initial willingness of decision-makers impacts the ability of the game system to reach a stable point. Moreover, larger values for the risk sensitivity coefficient and loss avoidance coefficient can promote the evolution of the game system toward an optimal, stable point. Based on these results, targeted countermeasures are proposed to promote activity within the carbon trading market, such as giving more institutional guarantees to carbon trading and stabilizing the carbon price.

1. Introduction

Climate change, caused by the emissions of carbon dioxide, presents a major challenge to humanity [1]. Nations around the world were compelled to collaborate and formulate novel strategies to mitigate the adverse effects of CO2 emissions. From the 1992 United Nations Framework Convention on Climate Change to the signing of the Kyoto Protocol in 1997, culminating in the Paris Climate Change Conference in 2015, the participation of numerous countries was apparent in the pursuit of climate governance as well as efforts to combat and mitigate climate change [2]. In recent years, China’s CO2 emissions continued to increase, especially since 2000, carbon emissions continued to increase rapidly, and China became the world’s largest country in terms of carbon emissions, and the issue of carbon emission reduction in China became the focus of the international community. In the face of increasingly serious environmental problems, China put forward the goal of “peaking carbon emissions by 2030 and achieving carbon neutrality by 2060” [3], and brought this goal into the overall layout of ecological civilization construction to achieve the goal of low-carbon transformation and contribute to global climate governance.
The carbon trading mechanism is an essential tool that can facilitate the promotion of carbon emission reduction and support sustainable development [4]. With the establishment of the national carbon market in 2017, followed by the creation and continual upgrade of an online trading system in 2021, China developed a well-functioning carbon market model. Results from the Blue Book on Low Carbon Development indicate that as of 2022, approximately 230 million tons of carbon emission allowances were traded within the national carbon market at a total value of 8.602 billion yuan [5], making it the largest carbon spot market in the world. As the main participants in the carbon trading market, the participation behavior of enterprises determines the implementation effect and emission reduction effect of carbon trading policy. Therefore, it is important to study how enterprises make behavioral decisions under the carbon trading mechanism, but their carbon trading behavior is influenced by multiple factors, such as participating parties and the external environment. This study would further our understanding of the key factors and external dynamics that shape the behavior of participating parties in the carbon trading market.
Based on the above analysis, by constructing a tripartite game model, this paper analyzes the sensitivity of key factors affecting the behavior decision of carbon trading participants and reveals the key factors influencing the carbon trading behavior of participating subjects by analyzing the behavioral strategies and behavioral logic of carbon trading participants, and puts forward policy recommendations for the establishment of a well-functioning carbon trading mechanism, a fair market environment, and an effective regulatory framework, which will not only help optimize emission reduction policies, clarify carbon trading paths, and promote the activity of the carbon trading market, but also provide a scientific basis for enterprises to realize low-carbon transformation and upgrading, thereby facilitating green and efficient development.
The remainder of this paper is organized as follows: Section 2 summarizes the related literature. Section 3 describes the relationship of models as well as model solution procedures. Section 4 conducts a simulation analysis to examine the impact of crucial factors on carbon trading behavior. Section 5 presents the optimization model incorporating prospect theory. The last section concludes this study with some policy recommendations.

2. Literature Review

2.1. Literature on the Carbon Trading Mechanism

The carbon trading mechanism originated from the SO2 emission control program in the United States in 1968. Later, Europe and the United States utilized this program to regulate greenhouse gas emissions, which was since implemented in numerous countries. Presently, with the implementation of the national carbon market and its promotion of achieving “double carbon” targets, carbon trading emerged as one of the primary measures for the Chinese government. This trend not only directly impacts the efficiency of emission reduction and regulation in China, but also indirectly impacts enterprises’ business risks and strategic decisions, making it a subject of interest among policymakers operating within the sphere of carbon trading.
Academic research on carbon trading mechanisms primarily focuses on two facets: the design of carbon trading mechanisms and the emission reduction effect of the carbon market. Concerning the former, for example, Qi and Han assessed non-price factors by taking environmental externalities as an entry point to clarify the driving factors and mechanism of the proportion of intertemporal transactions [6]. Zhang et al. explored the optimal product pricing and carbon emission reduction benefit distribution of covered enterprises in cooperative supply chains based on carbon allowance allocation rules in carbon trading pilot regions [7]. Xu et al. examined robust emission reduction operation strategies for enterprises under historical and baseline carbon allowance allocation methods [8]. Chen et al. investigated the impact of different rent-seeking environments on the operational efficiency of carbon markets and demonstrated that price-based sale or auction methods of allocating carbon allowances clarify price signals [9]. The second facet focuses on investigating the formation mechanism of carbon trading prices and related factors. For instance, Lin et al. employed a regression model to study the possible nonlinear relationship between the carbon price and its influencing factors [10]. Xie and Dou simulated the process of carbon quota trading in China’s immature carbon market [11]. Lv et al. conducted a sensitivity analysis of relevant parameters affecting the transaction price of carbon emission rights, using data collected from pilot areas to demonstrate that the carbon price was significantly influenced by economic development level and energy prices [12].
Carbon trading is a governing environmental policy tool that directly influences emission reduction effectiveness and indirectly affects enterprise operational decisions and costs [13]. On one hand, scholars hold positive attitudes towards carbon trading policies, believing that firms with lower abatement costs will take the lead in reducing emissions and sell excess carbon emission rights to those with higher abatement costs [13]. Shi et al. verified the significant long-term effect of implementing carbon trading market policies on reducing carbon emissions through a difference-in-difference model [14]. Cao et al. demonstrated the effectiveness of carbon trading in reducing carbon emissions in the power sector by significantly reducing the coal consumption of regulated coal-fired power plants in pilot areas [15]. Pan and Wang confirmed carbon trading’s significant CO2 reduction capabilities by employing the double difference method [16]. Hu et al. found that carbon dioxide emissions in pilot areas were reduced by 15.5% compared to non-pilot areas [17]. Their finding indicated that carbon trading achieved substantial energy savings and emission reductions. On the other hand, the current performance of the Chinese carbon market revealed low carbon prices, limited activity, and low liquidity, which raises concerns regarding the practical effectiveness of carbon trading. For instance, Wen et al. concluded that the impact of carbon trading on industrial carbon emissions remained negligible due to ineffective environmental regulations by local governments and inadequate allocation of carbon quotas [18]. Lyu et al. argued that China’s carbon market lacked activity and exhibited insufficient stability with frequent fluctuations [19]. Zhang et al. developed an evaluation index system to assess the maturity of carbon markets, which demonstrated that China’s carbon market was still far from maturity and feasibility [20]. Lin and Huang also contended that non-market mechanisms were more effective in achieving carbon emission reductions [21]. Furthermore, if the market remains immature and a suitable pricing mechanism is yet to be established, then participants lack the motivation to implement carbon emission reductions. Lower carbon prices would minimize their costs, and they might not benefit significantly from reducing emissions. Therefore, carbon trading cannot sufficiently alter their emission behavior [22].

2.2. Literature on Carbon Trading Behavior

Recently, many scholars conducted a series of studies on the carbon trading behavioral game. For example, Perera applied the Stackelberg game theory to investigate how the government could determine continuous incentives for power plants in a competitive electricity market [23]. Feichtinger et al. analyzed the dynamic game between the government and enterprises in the case of environmental taxes [24]. Lu and Fang compared carbon trading with two different carbon allocation methods [25]. Zhu et al. proposed a decision-driven model to analyze construction market interest players [26]. Huang and Ling constructed a game model between the government and enterprises under the carbon trading scenario [27]. Additionally, Jiao et al. considered the evolutionary game of localized governments and enterprise group behavior with carbon constraints under carbon emission reduction reward and penalty mechanisms [28].
Enterprises play a crucial role in the carbon trading market and are significant drivers of energy conservation and emission reduction. Scholars worldwide increasingly focused on the innovative implications of firms’ participation in carbon trading. For instance, Calel and Dechezlepretre revealed that regulated enterprises could witness a 10% increase in low-carbon innovation due to carbon trading [29]. Zhu believed that the government can promote carbon emission reduction by increasing the activity of enterprises participating in the carbon trading market [30]. In contrast, China’s carbon trading market emerged comparatively late as compared to its foreign counterparts, and current research on corporate conduct in the carbon trading domain remains at an incipient stage. Liu and Zhang provided empirical evidence that company participation in carbon trading could stimulate R&D innovation alongside inducing higher levels of green R&D investments [31]. Yu and Liu also corroborated these outcomes through their empirical analysis [32].
The carbon trading behavior of enterprises is a significant indicator for assessing the effectiveness of the carbon trading market, primarily concerning the supply and demand dynamics within this market. Reviewing the historical progression of leading carbon trading markets worldwide, it is observed that during the early stages of carbon trading, a limited number of industries were covered, with only a few emission-controlled enterprises participating. This resulted in a low level of enterprise participation, which worsened year by year as carbon quotas were reduced. Consequently, enterprises held on to their quotas rather than trading them, perpetuating a shortage of carbon quotas in the market. This imbalance between supply and demand caused the carbon trading market to become sluggish. Many businesses held sufficient quotas while there were few potential buyers on the market, leaving little incentive for enterprises to reduce their carbon emissions. However, a healthy and regulated carbon trading market can improve the economic performance of enterprises, encourage low-carbon investment behavior, and motivate energy-saving and emission reduction practices.

2.3. Literature on Evolutionary Game Theory and Its Applications

Evolutionary game theory was first introduced by Maynard Smith, which since became a well-established mathematical tool for resolving multi-agent decision problems where there is incomplete information and limited rationality [33]. The evolutionary game theory extends traditional game theory and offers compelling advantages. In the realm of real economic activities, due to internal and external environmental factors, it is challenging for both governments and enterprises to act rationally with full confidence. Thus, a process of observation, imitation, and mutual learning often takes place in decision-making processes [34]. An evolutionary game enables participating agents’ strategies to eventually converge to an evolutionarily stable strategy through a dynamic process of behavioral adjustment toward equilibrium [35].
Evolutionary game theory is increasingly applied to resolve economic management problems related to corporate behavior decisions and regulation. This area of research attracted significant attention from scholars, especially regarding the applications of corporate and government regulations [36]. Liu et al. constructed an evolutionary game model and found that manufacturers tend to adopt low-carbon technologies, and synergistic effects resulting from a combination of subsidies and taxes were better than the impact of implementing a single policy [37]. Zhao and Zhang developed an evolutionary game model between the government and power producers based on carbon trading, which indicated that both lowering unit subsidies and raising unit fines promote power producers’ participation in carbon trading [38]. Chen and Wang employed the evolutionary game theory to analyze the strategic choices made by enterprises and households concerning photovoltaic subsidy withdrawal and found that photovoltaic projects were unlikely to succeed without subsidies [39]. Similarly, Zhang et al. used evolutionary game theory to provide evidence that the carbon tax and carbon subsidy were complementary based on the government–firm–consumer synergy perspective [40]. Fan et al. considered environmental taxes and local government preferences and confirmed that penalties function effectively in enhancing corporate pollution control and emission reductions by establishing a tripartite evolutionary game [41].
In fact, carbon trading participants are confronted with numerous uncertainties, such as uncertainty in the external environment and subjective limited rationality. Though evolutionary games based on this assumption possess theoretical advantages over traditional games, they lack a construct for cognitive levels of subjectivity amongst players [42]. However, a combination of prospect theory and evolutionary game theory can compensate for this limitation. Shen et al. studied local government and polluters within a watershed area while integrating prospect theory into their evolutionary game analysis [43]. Sun et al. combined prospect theory with evolutionary game studies to investigate the innovative strategies of governments and businesses under different quality deterioration level risks [44]. Uchida et al. incorporated prospect theory into evolutionary game analysis and proposed peer punishment as a mechanism to resolve social dilemmas [45]. Yang and Chen also combined prospect theory and evolutionary game studies, delineating underlying mechanisms and behavioral patterns of firms regarding breakthrough technological innovation [46]. Liu et al. adopted prospect theory in an evolutionary game approach to explore low-carbon production behavior among companies [47]. In sum, research combining prospect theory with evolutionary game theory offers insight through the examination of uncertain situations where objective and subjective factors play sizeable roles in shaping actors’ behavior.
The previously mentioned studies were refined, but still exhibit some limitations. Firstly, the emphasis of most scholars is on the macro-level aspects, such as the construction of carbon trading markets and their efficacy, but they seldom consider the micro-level factors that influence enterprise carbon trading strategies. Secondly, domestic and international researchers chiefly combined prospect theory and evolutionary games in their investigations into collaborative behavior, regulatory behavior, and social governance, yet few studies integrated the pair specifically for carbon trading behavior. Thirdly, the current literature centers on analyzing the extent of effectiveness of China’s carbon trading policy pilots in reducing carbon emissions; however, there is a dearth of comprehensive examinations into the inner workings of the Chinese carbon trading market’s operational mechanisms, and sparse research focuses on carbon trading market supply and demand. This situation left room for debate on how to construct an efficient carbon trading market encompassing the entire sector’s supply perspective.
The interdependent relationship between the regulatory side (government), the supply side (emission reduction enterprises), and the demand side (emission control enterprises) forms a carbon trading symbiosis system. Thus, this research aims to analyze the strategic choices made by these three parties by constructing a tripartite game model, integrating prospect theory, exploring key factors’ influence on each participant’s behavior, and revealing the mechanics underlying enterprises’ carbon trading activities. We present optimization strategies for carbon trading path development after conducting a simulation analysis using MATLAB 2016b software (MathWorks Company of the United States.). Notably, we attempt to address the following: given that carbon trading is a complex dynamic process, and its participants involve regulators, suppliers, and demanders, how do their behavior strategies evolve when they encounter risks and losses? What is the relationship between the cost–benefit conditions of the three participants when a stable equilibrium is reached? How does the change in the main parameters affect the behavior of the three participants? How do we make the strategies of all parties stable and optimal to promote the activity of carbon trading?

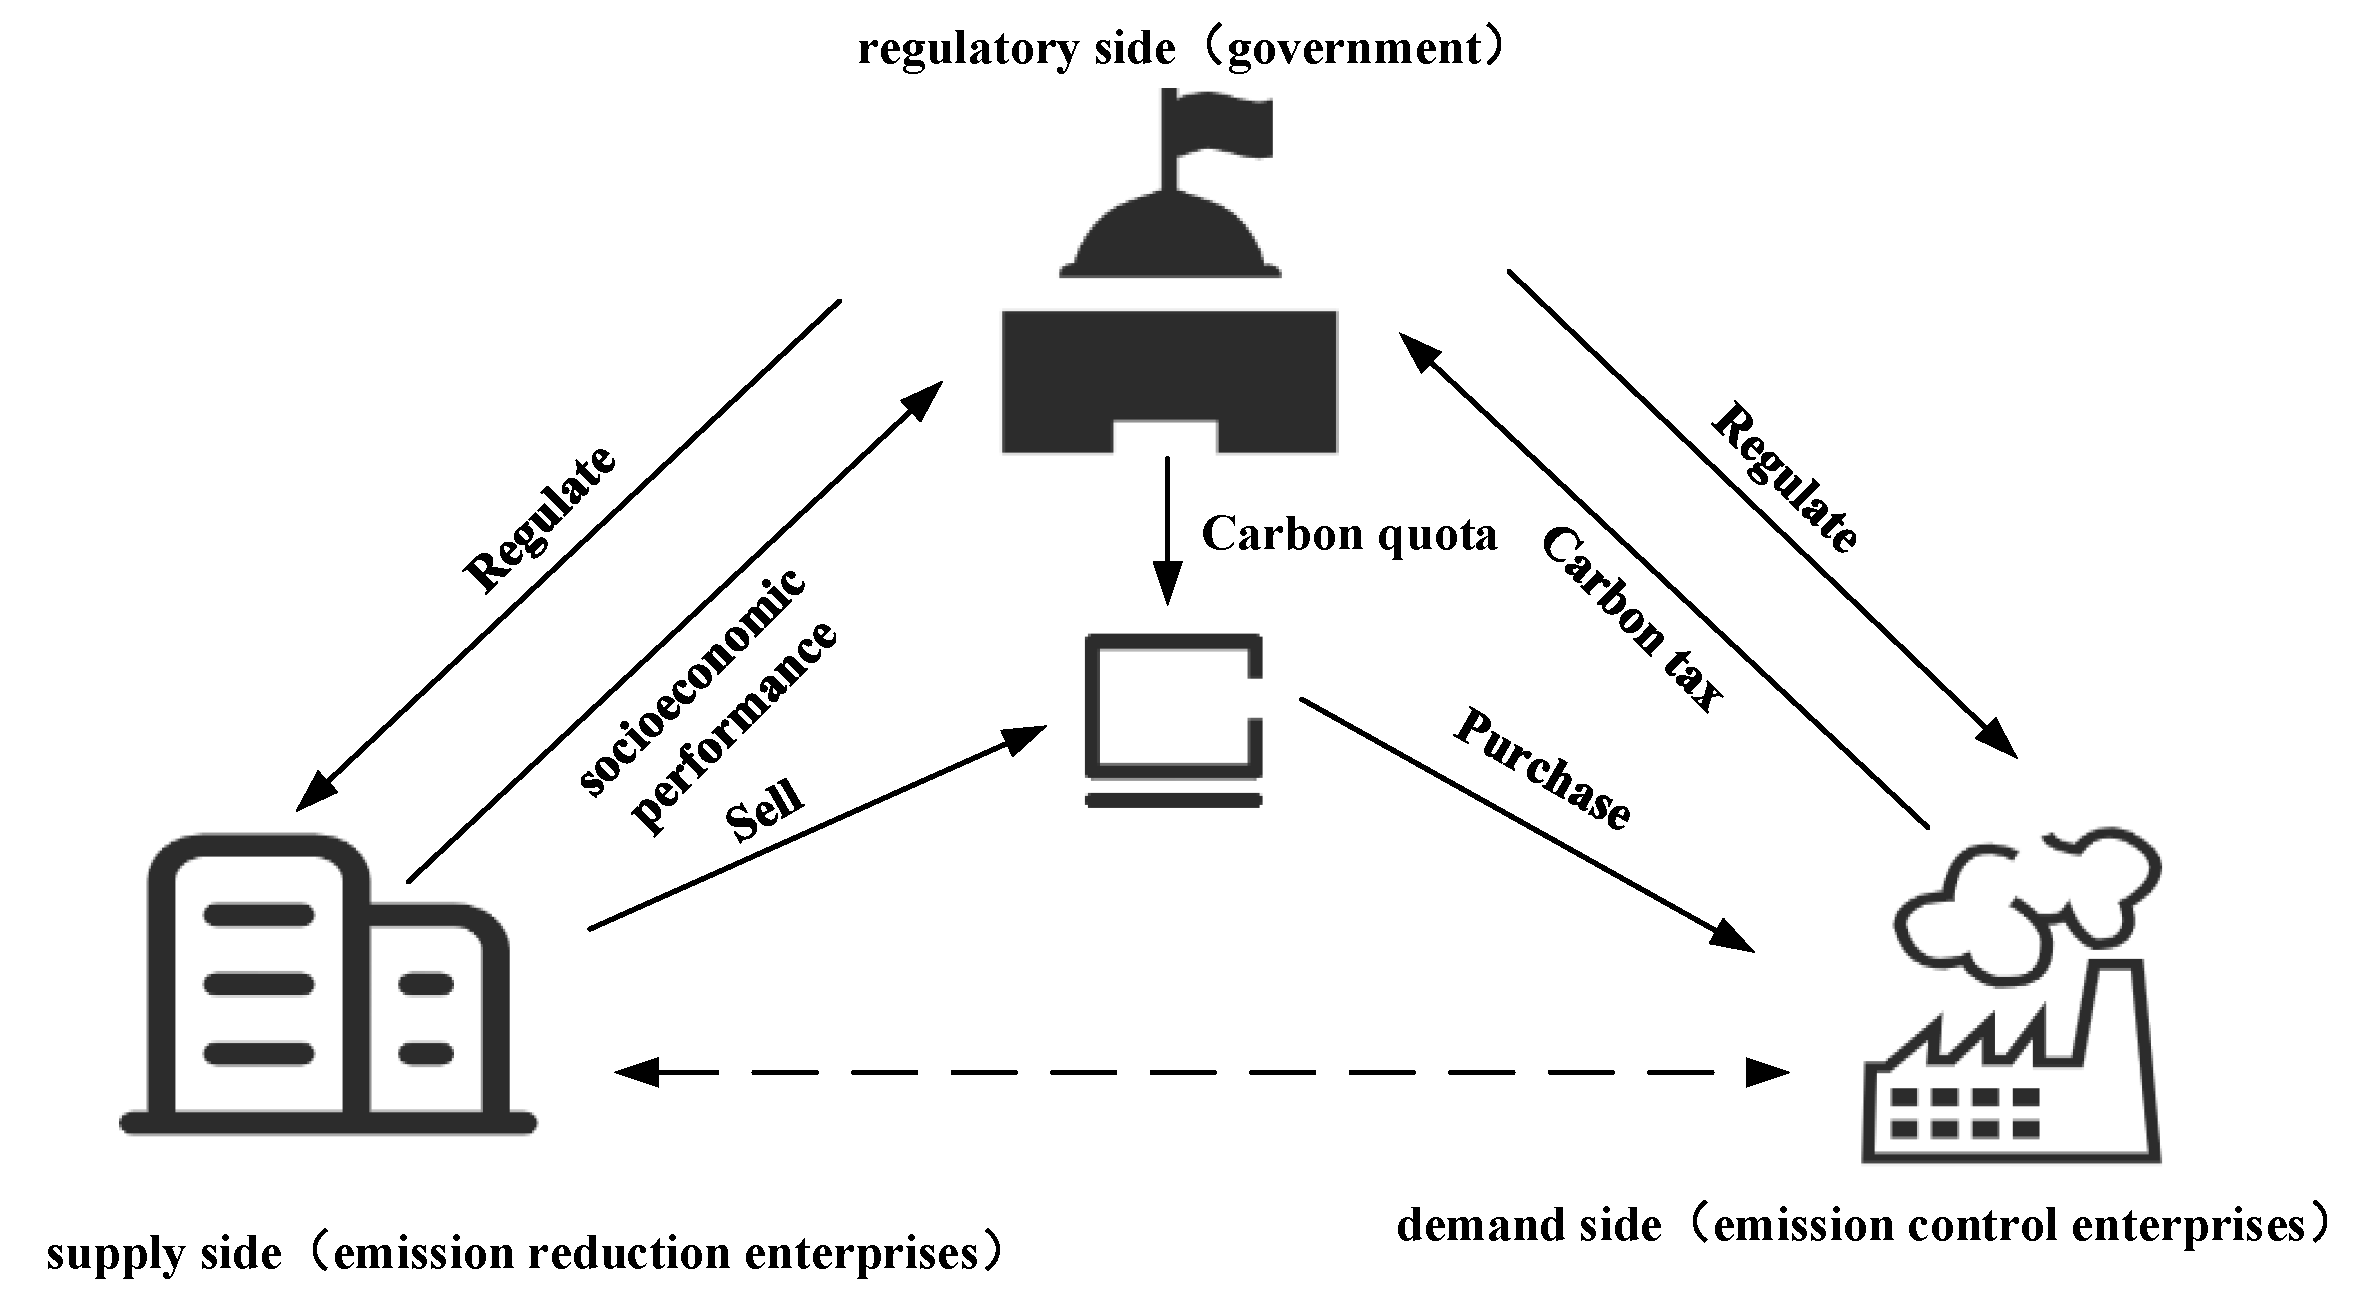
3. Establishment of the Evolutionary Game Process and Related Assumptions

3.1. Behavioral Preferences of Game Subjects

Before constructing the model, it is essential to clearly define the stakeholders involved in the carbon trading market. In a low-carbon economy, the government plays a central role in preserving resources and protecting the environment by providing guidance and adjusting policies for corporations implementing an environmental protection strategy. Corporations are tasked with implementing environmental protection plans, shouldering the weighty responsibility of safeguarding the environment, and enhancing product competitiveness, while also ensuring their sustainable development. However, risk-averse corporations seek to maximize their benefits, thus requiring active government guidance in environmental protection efforts. Therefore, the government’s regulatory role is vital in building a robust carbon trading market. Through subsidies or tax incentives, the government can encourage corporations to engage in carbon trading and mitigate carbon emissions. High polluters or corporations with significant carbon emission levels have a high demand for carbon offsetting, achieved through the carbon trading market by purchasing carbon emission rights to neutralize excess carbon emissions exceeding the regulated quota. Failure to carry out carbon trading may attract penalties enforced by the government. Conversely, environmentally friendly and low-emission corporations can sell excess carbon emission rights via the carbon trading market, increasing revenue and attracting certain government awards.
The carbon market comprises two sides, namely the supply side and the demand side. The supply side of carbon consists of emission reduction establishments that sell excess allowances, financial institutions, and third-party certification agencies. The demand side consists of emission control establishments that purchase the required allowances, non-governmental organizations, and individuals, among others. As the regulator, the government formulates policies and systems while also determining the allocation of quotas. Therefore, it should act as a bridge between the two sides to ensure fairness and efficiency. Presently, the primary participants in the national carbon trading market are the government, emission reduction enterprises, and emission control establishments. Hence, this study aims to consider the government (primarily as the regulator), emission reduction establishments (mainly as the supplier), and emission control establishments (mainly as the demander) as the game subjects. The strategy space of the government is defined as {regulate, non-regulate}. The probability of the government selecting the “regulate” strategy is denoted by x , while the probability of the government choosing the “non-regulate” strategy is 1 x . The strategy space of the emission reduction establishments is {sell, non-sell}. The probability of choosing the “sell” strategy is represented by y , while the likelihood of choosing the “non-sell” strategy is 1 y . The strategy space of the emission control establishments is {purchase, non-purchase}. The likelihood of choosing the “purchase” strategy is indicated by z , while the probability of selecting the “non-purchase” strategy is 1 z and x , y , z , belonging to the interval (0,1), as shown in Figure 1:

3.2. Basic Assumptions of the Model

Based on the analysis of the relationship between the game subjects above, the following hypothesis is formulated:
Hypothesis 1.
The government, emission reduction enterprises, and emission control enterprises are all characterized by limited rationality, and their decisions will be influenced by their preferences and their ability to obtain and analyze information, etc.
Hypothesis 2.
The two firms are homogeneous in the evolutionary game model and have the same trading position and trading authority.
Hypothesis 3.
Government-related benefits and costs. As the regulatory side, when the government chooses the “regulate” strategy, the basic benefit is R 1 , and the cost of supervision and human resources is C 1 . The local government can obtain social and economic benefits such as creating jobs and restoring the ecological environment through the development of the carbon trading market, and it can also obtain profits through carbon trading (such as membership fees and transaction fees) [48]. Let the profit distribution factor be θ . In addition, there are administrative incentives R 2 from the central government to promote the development of carbon trading markets. When an emission reduction enterprise chooses the “sell” strategy and an emission control enterprise chooses the “purchase” strategy, it means that both choose to cooperate. When one party chooses to cooperate and the other refuses to cooperate, only the party that chooses to cooperate will receive the incentive subsidy from the government, but when both choose not to cooperate, resulting in a failed deal, the government can impose certain penalties, T s for the emission control companies and T d for the emission reduction companies ( T s > T d ). When the government chooses the “non-regulate” strategy, the basic benefit is R 3 , that there is no monitoring cost, incentives, or penalties, but often the enterprises will create over-emissions, leading to ecological degradation, so the government needs to pay ecological compensation costs C 2 .
Hypothesis 4.
Emission reduction enterprise-related benefits and costs. As the supply side, it needs to bear the investment cost, transaction cost, sunk cost, etc. [49]. If emission reduction enterprises choose the “sell” strategy, the basic benefit is E s 1 , the investment cost is C s 1 , the transaction cost is C s 2 , and the government provides an incentive subsidy β for each unit of carbon credits sold by emission reduction enterprise, let P denote the price of a unit of carbon credits, and the sale revenue P Q can be obtained from selling the total amount of carbon allowances Q . If the emission reduction enterprise chooses the “non-sell” strategy, the basic benefit is E s 2 and the opportunity cost C s 3 is borne.
Hypothesis 5.
Emission control enterprise-related benefits and costs. As the demand side, it will bear the upfront cost, transaction cost, purchase cost, etc. [49]. Based on the current policy, government subsidies for enterprises are proportional to their traded carbon credits. Specifically, if emission control enterprises have actual carbon emissions and government-allocated carbon quotas of Q 1 and Q 0 , respectively, and the government’s subsidies intensity coefficient for emission control enterprises is represented by ε , then the enterprise’s subsidies can be calculated as ε ( Q 1 Q 0 ) . In cases where emission control enterprises choose the “purchase” strategy in excess, the basic revenue is E d 1 , the upfront cost is C d 1 , the purchase cost is P ( Q 1 Q 0 ) , and the transaction cost is C d 2 . Purchasing carbon credits allows enterprises not only to offset carbon emissions but also promote a positive environmental image and increase business goodwill [50], as well as generate additional revenue represented by R d . If such enterprises exceed their quota limit yet decide to choose the “non-purchase” strategy, their basic revenue becomes E d 2 , and they will face penalties from the government, which are computed as a factor η . Emission control companies are also subject to η ( Q 1 Q 0 ) taxes.

3.3. Construction of Payoff Matrix

Based on the above assumptions, the payoff matrix of the tripartite game among regulators, suppliers, and demanders can be obtained, as shown in Table 1:

4. Model Solving and Stability Strategy Analysis

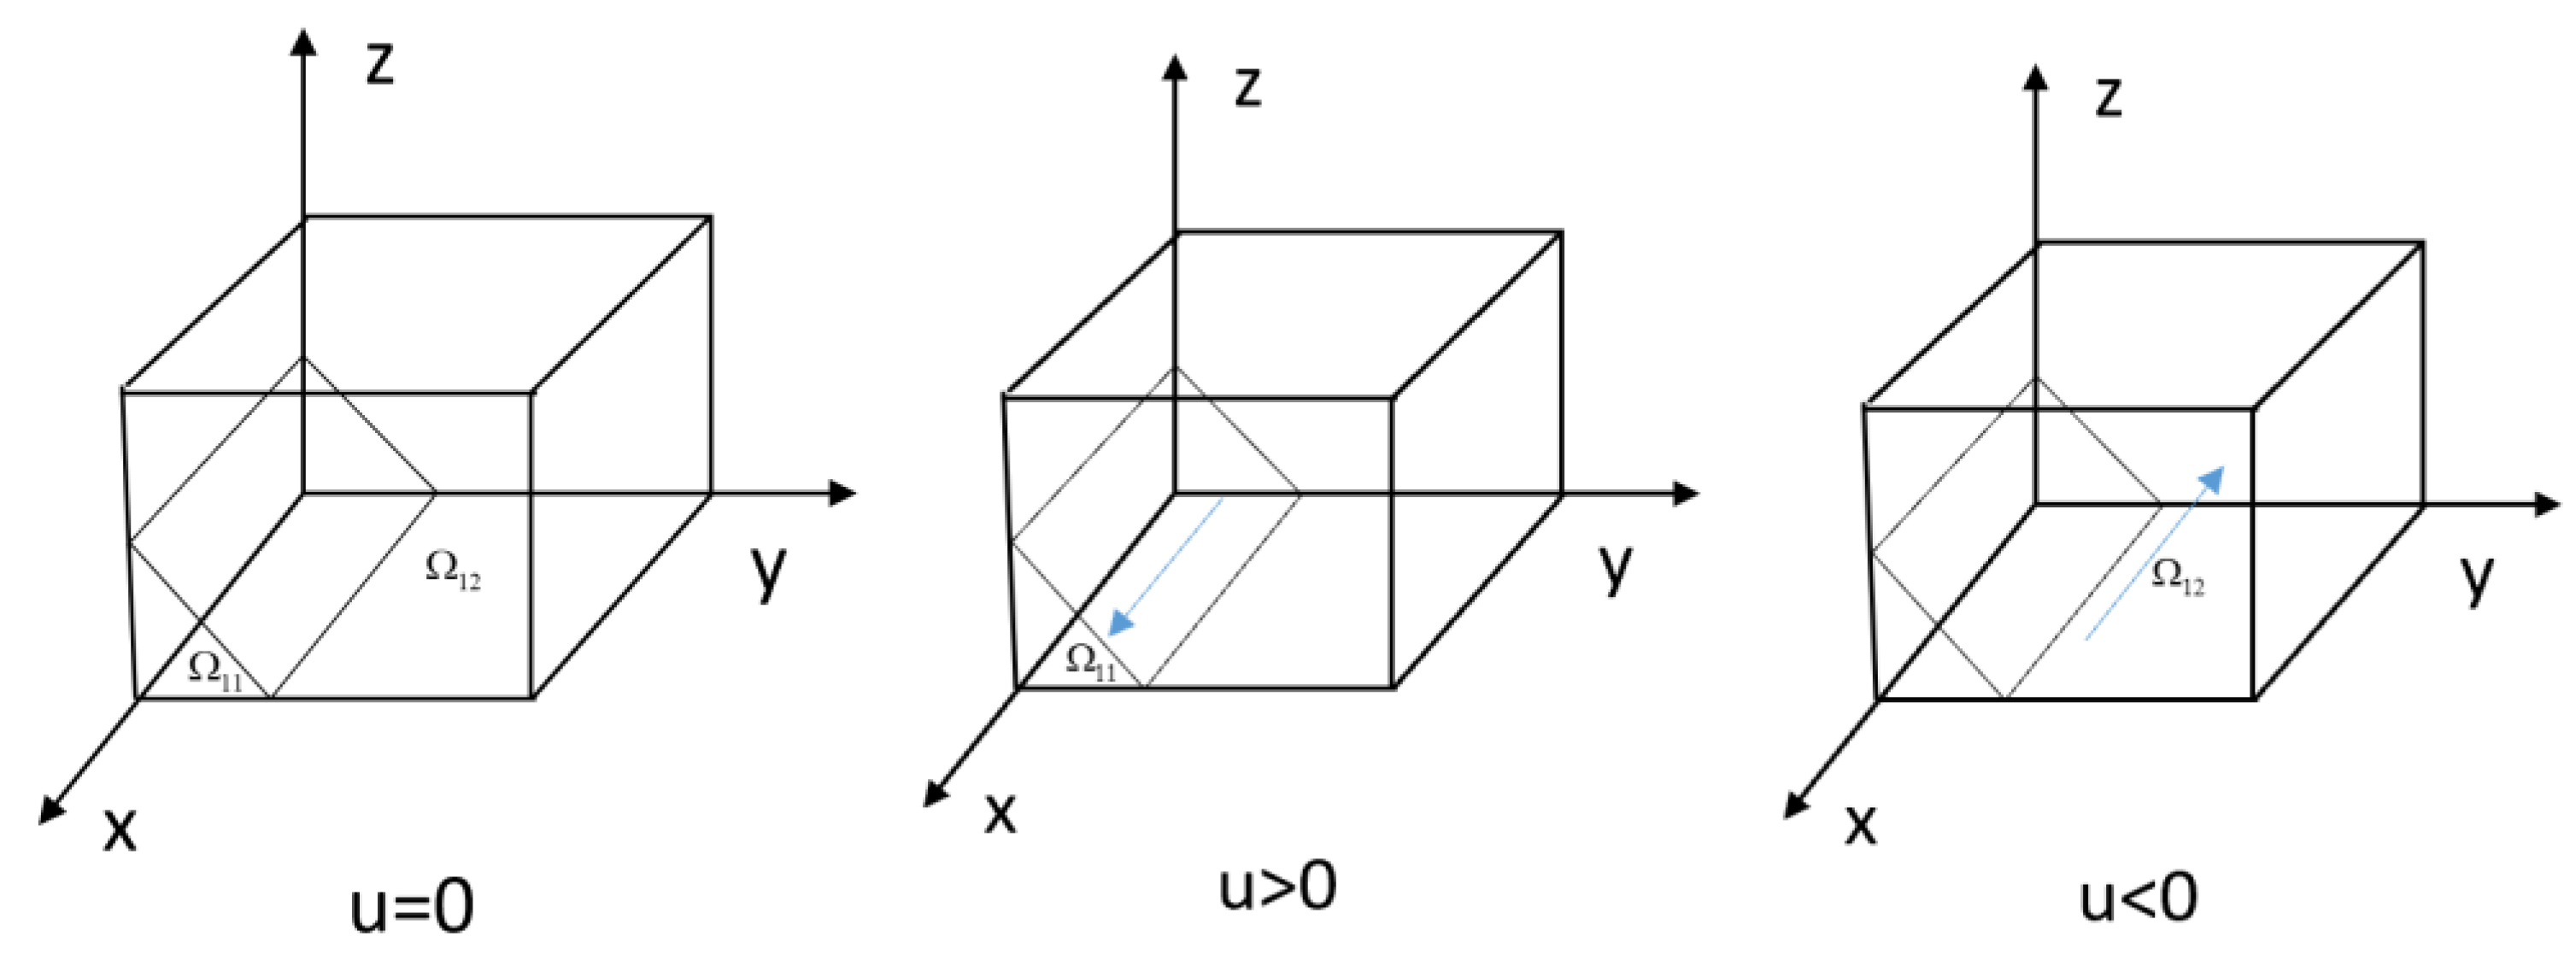
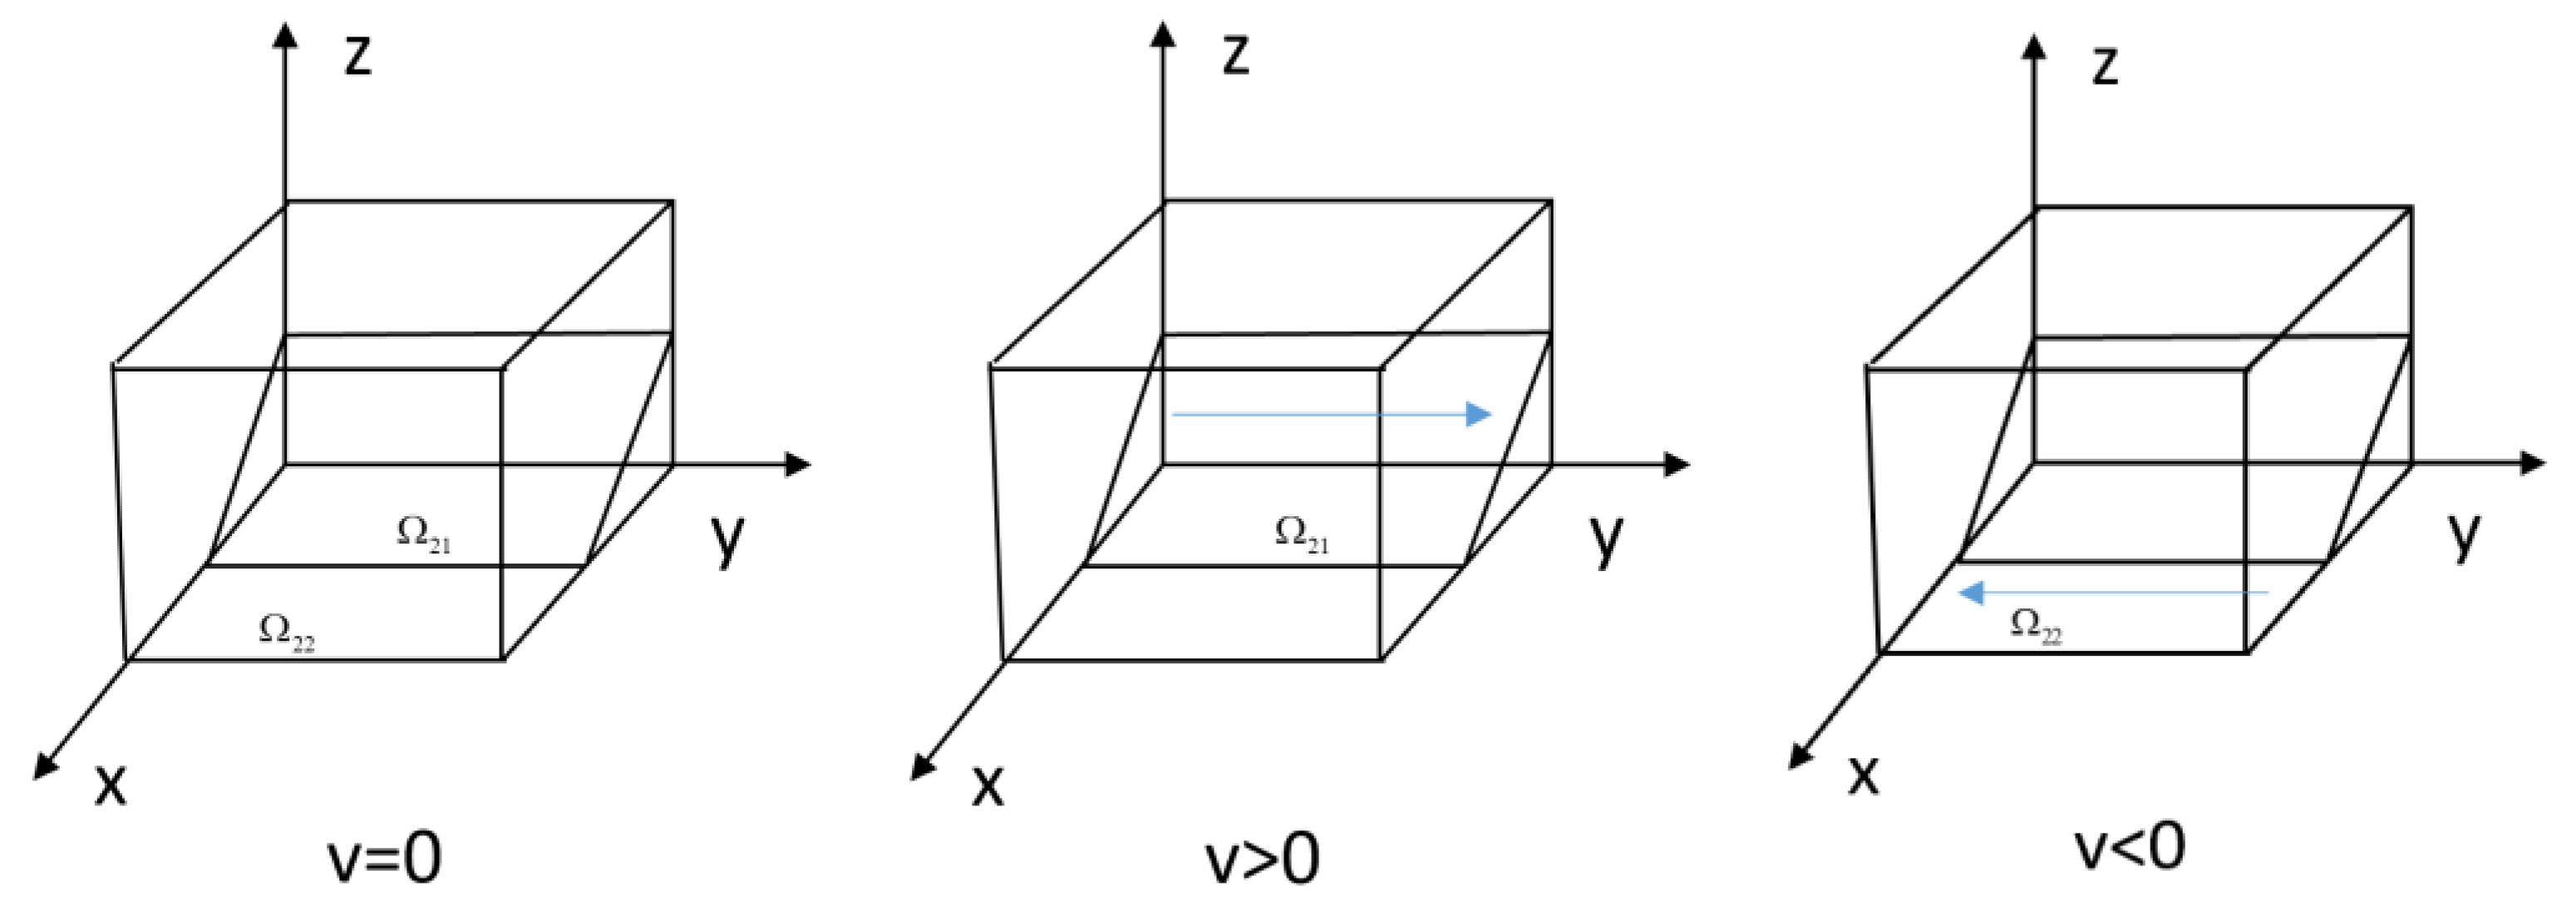
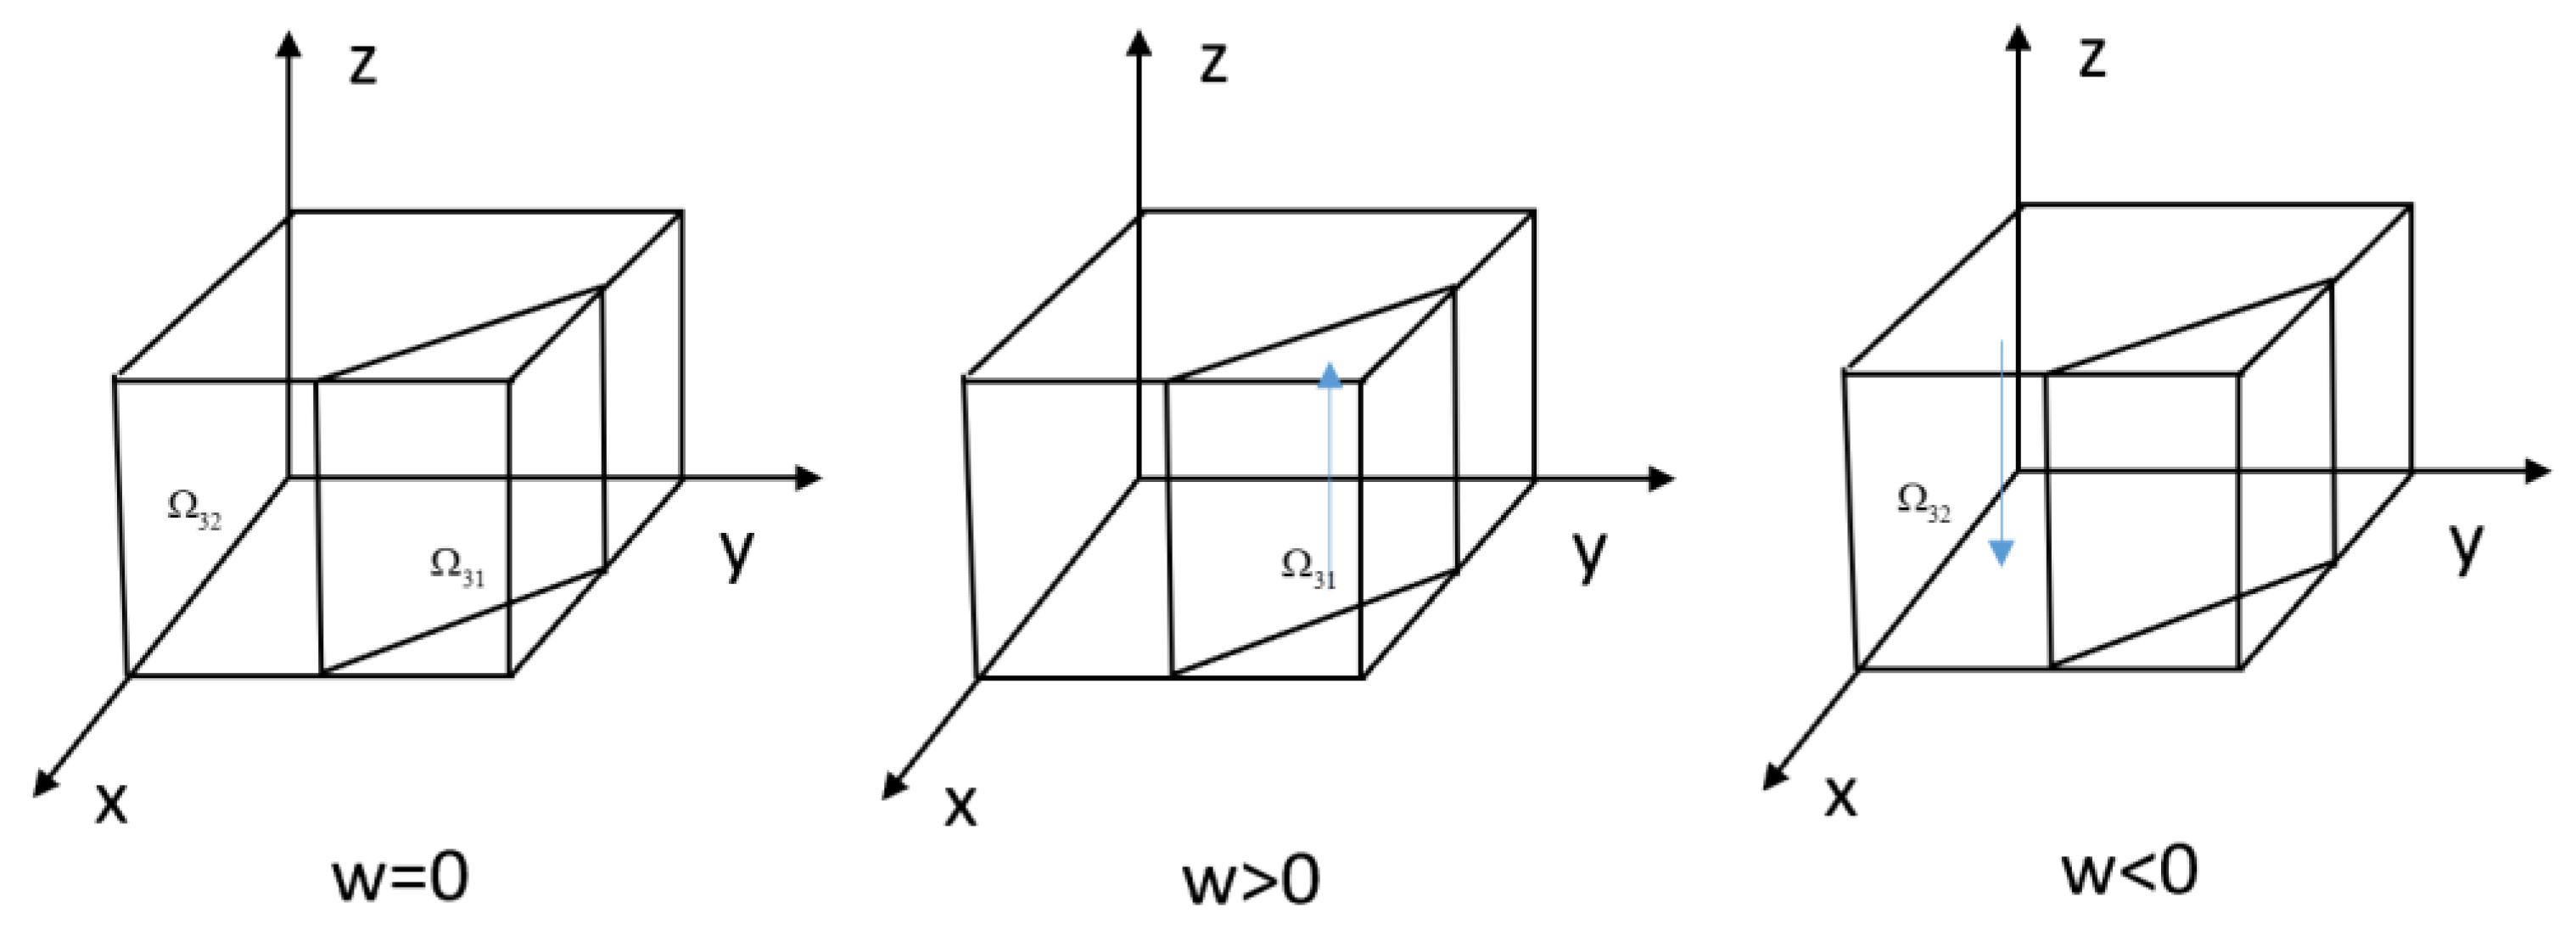
4.1. Replication Dynamic Equation Analysis

According to the payoff matrix, the expected benefits of the government’s “regulate” strategy and the expected benefits of the “non-regulate” strategy are U x ; U 1 x , respectively, and the average expected benefits are U ¯ x :
U x = y z [ R 1 + R 2 + θ P ( Q + Q 1 Q 0 ) C 1 β Q ε ( Q 1 Q 0 ) ] + y ( 1 z ) [ R 1 + R 2 + θ P Q                         + η ( Q 1 Q 0 ) C 1 ε ( Q 1 Q 0 ) ] + ( 1 y ) z [ R 1 + R 2 + θ P ( Q 1 Q 0 ) C 1 ε ( Q 1 Q 0 ) ]                         + ( 1 y ) ( 1 z ) [ R 1 + η ( Q 1 Q 0 ) + T s + T d C 1 ε ( Q 1 Q 0 ) ]
U 1 x = y z ( R 3 C 2 ) + y ( 1 z ) ( R 3 C 2 ) + ( 1 y ) z ( R 3 C 2 ) + ( 1 y ) ( 1 z ) ( R 3 C 2 )
Thus, the replication dynamic equation of government regulation is:
U ¯ x = F ( x ) = x U x + ( 1 x ) U 1 x = x ( 1 x ) ( U x U 1 x ) = x ( 1 x ) [ y z ( T s + T d β Q R 2 )               + y ( R 2 + θ P Q T s T d ) + z ( R 2 + θ P Q 1 θ P Q 0 η Q 1 η Q 0 T s T d ) + R 1 +                   η ( Q 1 Q 0 ) + T s + T d C 1 ε ( Q 1 Q 0 ) R 3 + C 2 ]
Let a = R 2 + θ P Q 1 θ P Q 0 η Q 1 η Q 0 T s T d , b = T s + T d β Q R 2 , when y = z a + R 1 + η ( Q 1 Q 0 ) + T s + T d C 1 ε ( Q 1 Q 0 ) R 3 + C 2 z ( T s + T d β Q R 2 ) + ( R 2 + θ P Q T s T d ) and F ( x ) = 0 . The system converges to a steady state for any value of x ; when y z a + R 1 + η ( Q 1 Q 0 ) + T s + T d C 1 ε ( Q 1 Q 0 ) R 3 + C 2 z ( T s + T d β Q R 2 ) + ( R 2 + θ P Q T s T d ) , if F ( x ) = 0 , then x = 0 or x = 1 , and because F ( x ) the inverse at the stable is negative for the stable strategy, it can be found: d F ( x ) d x = ( 1 2 x ) [ y z b + y ( R 2 + θ P Q T s T d ) + z a + R 1 + η ( Q 1 Q 0 ) + T s + T d C 1 ε ( Q 1 Q 0 ) R 3 + C 2 ] , let u = y z b + y ( R 2 + θ P Q T s T d ) + z a + R 1 + η ( Q 1 Q 0 ) + T s + T d C 1 ε ( Q 1 Q 0 ) R 3 + C 2 .
(1)
When u > 0 , F x ( 1 ) < 0 , F x ( 0 ) > 0 , then x = 1 is the stability point;
(2)
When u < 0 , F x ( 1 ) > 0 , F x ( 0 ) < 0 , then x = 0 is the stability point.
Let the three-dimensional space Ω = M ( x , y , z ) | 0 x 1 , 0 y 1 , 0 z 1 , and the plane Q 1 : y = z a + R 1 + η ( Q 1 Q 0 ) + T s + T d C 1 ε ( Q 1 Q 0 ) R 3 + C 2 z ( T s + T d β Q R 2 ) + ( R 2 + θ P Q T s T d ) .
The dynamic trend and evolution strategy of government regulation behavior in the above situations is shown in Figure 2. Plane Q 1 divides space Ω into spaces Ω 11 and Ω 12 , when the initial state of the players in the game is within Ω 11 , x = 1 is an equilibrium solution, which indicates that the punishment suffered by the government for not regulating and the economic losses it needs to bear afterward are greater than the gains gained by adopting this strategy. In the face of certain losses, the government will take regulation measures, whereas the final strategy of the government is “non-regulate”.
According to the payoff matrix, the expected benefits of the emission reduction enterprises’ “sell” strategy and the expected benefits of the “non-sell” strategy are U y ; U 1 y , respectively, and the average expected benefits are U ¯ y :
U y = x z [ E s 1 + β Q + P Q C s 1 C s 2 ] + ( 1 x ) z [ E s 1 + P Q C s 1 C s 2 ] + x ( 1 z ) [ E s 1 + β Q + P Q C s 1 C s 2 ] + ( 1 x ) ( 1 z ) [ E s 1 + P Q C s 1 C s 2 ]
U 1 y = x z [ E s 2 C s 3 ] + ( 1 x ) z [ E s 2 C s 3 ] + x ( 1 z ) [ E s 2 C s 3 T s ] + ( 1 x ) ( 1 z ) [ E s 2 C s 3 ]
Thus, the replication dynamic equation of the sales quota of emission reduction enterprises is:
U ¯ y = F ( y ) = y U y + ( 1 y ) U 1 y = y ( 1 y ) ( U y U 1 y ) = y ( 1 y ) [ x β Q + x ( 1 z ) T s E s 2               + C s 3 + E s 1 + P Q C s 1 C s 2 ]
When z = x β Q + x T s E s 2 + C s 3 + E s 1 + P Q C s 1 C s 2 x T s and F ( y ) = 0 , the system converges to a steady state for any value of y ; when z x β Q + x T s E s 2 + C s 3 + E s 1 + P Q C s 1 C s 2 x T s , if F ( y ) = 0 , then y = 0 or y = 1 . Because F ( y ) the inverse at the stable is negative for the stable strategy, it can be found: d F ( y ) d x = ( 1 2 y ) [ x β Q + x ( 1 z ) T s E s 2 + C s 3 + E s 1 + P Q C s 1 C s 2 ] , let v = x β Q + x ( 1 z ) T s E s 2 + C s 3 + E s 1 + P Q C s 1 C s 2 .
(1)
When v > 0 , F y ( 1 ) < 0 , F y ( 0 ) > 0 , then y = 1 is the stability point;
(2)
When v < 0 , F y ( 1 ) > 0 , F y ( 0 ) < 0 , then y = 0 is the stability point.
Let the plane Q 2 : z = x β Q + x T s E s 2 + C s 3 + E s 1 + P Q C s 1 C s 2 x T s .
The dynamic trend and evolution strategy of emission reduction enterprises’ selling behavior in the above situations is shown in Figure 3. Plane Q 2 divides space Ω into spaces Ω 21 and Ω 22 , when the initial state of the players in the game is within Ω 21 , y = 1 is an equilibrium solution, which shows that the income of emission reduction enterprises from not selling carbon emission trading rights is less than that from choosing the “sell” strategy, and emission reduction enterprises tend to actively participate in carbon trading, whereas the ultimate strategy of emission reduction enterprises will be “non-sell”.
According to the payoff matrix, the expected benefits of the emission control enterprises’ “purchase” strategy and the expected benefits of the “non-purchase” strategy are U z ; U 1 z , respectively, and the average expected benefits are U ¯ z :
U z = xy [ E d 1 + R d + ε ( Q 1 Q 0 ) P ( Q 1 Q 0 ) C d 1 C d 2 ] + ( 1 x ) y [ E d 1 + R d P ( Q 1 Q 0 )     C d 1 C d 2 ] + x ( 1 y ) [ E d 1 + R d + ε ( Q 1 Q 0 ) P ( Q 1 Q 0 ) C d 1 C d 2 ] + ( 1 x ) ( 1 y )     [ E d 1 + R d P ( Q 1 Q 0 ) C d 1 C d 2 ]
U 1 z = xy [ E d 2 η ( Q 1 Q 0 ) ] + ( 1 x ) y E d 2 + x ( 1 y ) [ E d 2 η ( Q 1 Q 0 ) T d ] + ( 1 x ) ( 1 y ) E d 2
Thus, the replication dynamic equation of the purchased quota of emission control enterprises is:
U ¯ z = F ( x ) = z U z + ( 1 z ) U 1 z = z ( 1 z ) ( U z U 1 z ) = z ( 1 z ) [ x ε ( Q 1 Q 0 ) x η ( Q 1 Q 0 )             + x ( 1 y ) T d E d 2 + E d 1 + R d P ( Q 1 Q 0 ) C d 1 C d 2 ]
When x = E d 1 E d 2 P ( Q 1 Q 0 ) C d 1 C d 2 + R d η ( Q 1 Q 0 ) ( 1 y ) T d ε ( Q 1 Q 0 ) and F ( z ) = 0 , the system converges to a steady state for any value of z ; when x E d 1 E d 2 P ( Q 1 Q 0 ) C d 1 C d 2 + R d η ( Q 1 Q 0 ) ( 1 y ) T d ε ( Q 1 Q 0 ) , if F ( z ) = 0 , then z = 0 or z = 1 . Because F ( z ) the inverse at the stable is negative for the stable strategy, it can be found: d F ( z ) d x = ( 1 2 z ) [ x ε ( Q 1 Q 0 ) x η ( Q 1 Q 0 ) + x ( 1 y ) T d E d 2 + E d 1 + R d P ( Q 1 Q 0 ) C d 1 C d 2 ] , let w = [ x ε ( Q 1 Q 0 ) x η ( Q 1 Q 0 ) + x ( 1 y ) T d + E d 2 + E d 1 + R d P ( Q 1 Q 0 ) C d 1 C d 2 + R d ] .
(1)
When w > 0 , F z ( 1 ) < 0 , F z ( 0 ) > 0 , then z = 1 is the stability point;
(2)
When w < 0 , F z ( 1 ) > 0 , F z ( 0 ) < 0 , then z = 0 is the stability point.
Let the plane Q 3 : x = E d 1 E d 2 P ( Q 1 Q 0 ) C d 1 C d 2 + R d η ( Q 1 Q 0 ) ( 1 y ) T d ε ( Q 1 Q 0 ) .
The dynamic trend and evolution strategy of the purchasing behavior of emission control enterprises in the above situations are shown in Figure 4. Plane Q 3 divides the space Ω into space Ω 31 and Ω 32 , when the initial state of the players in the game is within Ω 31 , z = 1 is an equilibrium solution, indicating that the gains of emission control enterprises from not purchasing carbon trading rights are less than those from choosing the “purchase” strategy, and the emission control enterprises tend to actively participate in carbon trading, whereas the final strategy of emission control enterprises will be “non- purchase”.

4.2. Stability Strategy Analysis

To solve the equilibrium point of the evolutionary game, let F ( x ) = F ( y ) = F ( z ) = 0 ; it can be obtained that the system of equations has eight equilibrium points and one mixed strategy equilibrium point in the definition domain D = { 0 x 1 , 0 y 1 , 0 z 1 } . According to Ritzberger et al. [51], only eight asymptotic stabilization points need to be discussed for the tripartite evolutionary game system of the government, emission reduction enterprises, and emission control enterprises, namely (1,1,1), (1,1,0), (1,0,1), (1,0,0), (0,1,1), (0,1,0), (0,0,1), and (0,0,0). According to the Lyapunov indirect method, if all eigenvalues of the Jacobin matrix are negative real numbers, the equilibrium point is called the asymptotic stability point. The corresponding Jacobian matrix is:
J = F ( x ) x F ( x ) y     F ( x ) z F ( y ) x F ( y ) y F ( y ) z F ( z ) x   F ( z ) y F ( z ) z = J 11 J 12 J 13 J 21 J 22 J 23 J 31 J 32 J 33
Details of the Jacobi matrix can be found in Appendix A. The eight equilibrium points are brought into the Jacobin matrix to obtain eight Jacobi matrices, all the eigenvalues of the matrix at the eight equilibrium points are calculated, and the eigenvalues of the individual equilibrium points are solved by the Jacobin matrices as shown in Table 2 and discussed in different sub-cases according to the parameters.
By bringing eight equilibrium points into the Jacobin matrix, eight Jacobian matrices can be obtained, and all eigenvalues of the matrix at the eight equilibrium points are calculated. The eigenvalues of the eight equilibrium points are solved by the Jacobian matrix as shown in Table 2 and discussed in different sub-cases according to the parameters.

5. Simulation and Sensitivity Analysis

To visually analyze and judge the relationship and evolution process of the three-game subjects and observe the impact of various key factor changes on the evolution equilibrium results, a simulation is carried out with the help of Matlab 2016b. To make the system evolve to (1,1,1), the parameter assignment needs to satisfy the following conditions: C 1 C 2 R 1 + ε ( Q 1 Q 0 ) R 2 + R 3 + β Q + θ P ( Q 0 Q 1 Q ) < 0 , C s 1 + C s 2 C s 3 E s 1 + E s 2 P Q β Q < 0 , C d 1 + C d 2 E d 1 + E d 2 R d + P ( Q 1 Q 0 ) + η ( Q 0 Q 1 ) + ε ( Q 0 Q 1 ) < 0 . Considering the myriad factors, it is advisable to vary a key factor from a small to a large value in simulation mode, provided that the parameter values remain within acceptable limits. Such variation permits a more convenient observation of the impact that the factor’s alteration has on the strategic equilibrium of the subject. Adhering to the conditions specified in the model, this paper adopts the following principles for variable assignment:
To begin with, based on the trading data obtained from the national carbon market and carbon emission trading network, the initial values of the carbon price and carbon allowance are established considering the current situation. During 2021–2022, the national carbon market price fluctuated, but basically remained around 50 yuan per ton, so the initial value of P is set to 50 yuan per ton in this paper (hereinafter referred to as yuan/ton for simplicity). According to the annual report of the national carbon market, the total amount of carbon quotas for enterprises in the national carbon market is maintained at about 230 million tons, so the initial value of Q 0 is set to 23 ( × 10 7 tons). The annual turnover of the national carbon market is about 50 million tons, so the initial values of Q and Q 1 Q 0 are assumed to be 5 ( × 10 7 tons). Enterprises need to pay a certain amount of fees to participate in carbon trading, and the fees for pricing transfer and negotiated bargaining transactions alone can reach 5% of the transaction amount [48], so the transaction cost is assumed to be about 20 ( × 10 7 yuan). In addition, the government can also obtain implicit income from promoting capital financing and activating the carbon financial market, for which the profit distribution coefficient θ is set to 0.2.
According to the Feasibility Study Report of the Carbon Emission Trading Center Project, under the current scenario of the carbon emission trading mechanism, the previous enterprise emission reduction cost (investment cost C s 1 ) was about 250 yuan/ton of CO2. According to the existing related research, the low-carbon subsidy is about 50% of the low-carbon investment [52], so the initial value of β is set at 125 yuan/ton. The government’s regulatory investment is often lower than the enterprise’s behavioral investment [53], so set C 1 = 200 yuan/ton. By consulting the pilot policy documents, it is found that the pilot provinces and cities generally adopt a penalty mechanism with unavoidable fines and responsibilities for excessive emissions. The estimation of the penalty coefficient in this study comes from the fact that Hubei Province imposed a fine of more than one time but less than three times the average market price of carbon emission quotas for enterprises in that year, so this study assumes that the initial value of η is 100 yuan/ton.
Secondly, according to the principle of equation balance, referring to the existing literature and related carbon trading database, based on the above, all the parameters except P ,   θ ,   β ,   Q ,   Q 0 , Q 1 ,   ε ,   η are divided by 1   ×   10 7 (ton), so the dimensions of the parameters are unified as 1   ×   10 7 (yuan). To simplify the analysis, the following related parameters are omitted in units, and the initial reference values are set as shown in Table 3.
Figure 5 depicts the dynamic evolution path of the game subject; in this case, the system evolution only exists at a central point (0.2,1,0.6), and there is no evolutionary stability result. As shown in Figure 5, the final result of the system evolution is a closed loop around the central point movement, the government, emission reduction enterprises, and the emission control enterprises’ three-group game process shows a cyclical behavior pattern.
The vertical axis of the chart indicates the probability of behavior strategy selection by the game subjects, while the horizontal axis shows the speed of convergence of behavior probability, where the time has no specific unit. Initially, the values for the government’s choice of regulation, emission reduction enterprises’ decision to sell carbon emission rights, and emission control enterprises’ choice to purchase carbon emission rights are set at [ x , y , z ] = [0.5, 0.5, 0.5]. As illustrated in Figure 6, x fluctuates around 0.2, indicating a low willingness by the government to regulate enterprises’ participation in carbon trading. Similarly, z fluctuates around 0.6, representing the weak willingness of emission control enterprises to engage in carbon trading. Overall, the carbon trading market exhibits irregular activity, failing to maintain stable development. Due to unknown risks, emission control enterprises tend to be hesitant about the carbon trading market, allowing significant space for future growth. However, y rapidly converges toward 1; given that emission reduction enterprises can sell excess carbon quotas and the government encourages their participation in trading, they tend to engage in trading. The paper subsequently analyzesthe evolution path of behavior strategies of the government and the emission control enterprises, to enable joint participation among all three parties.

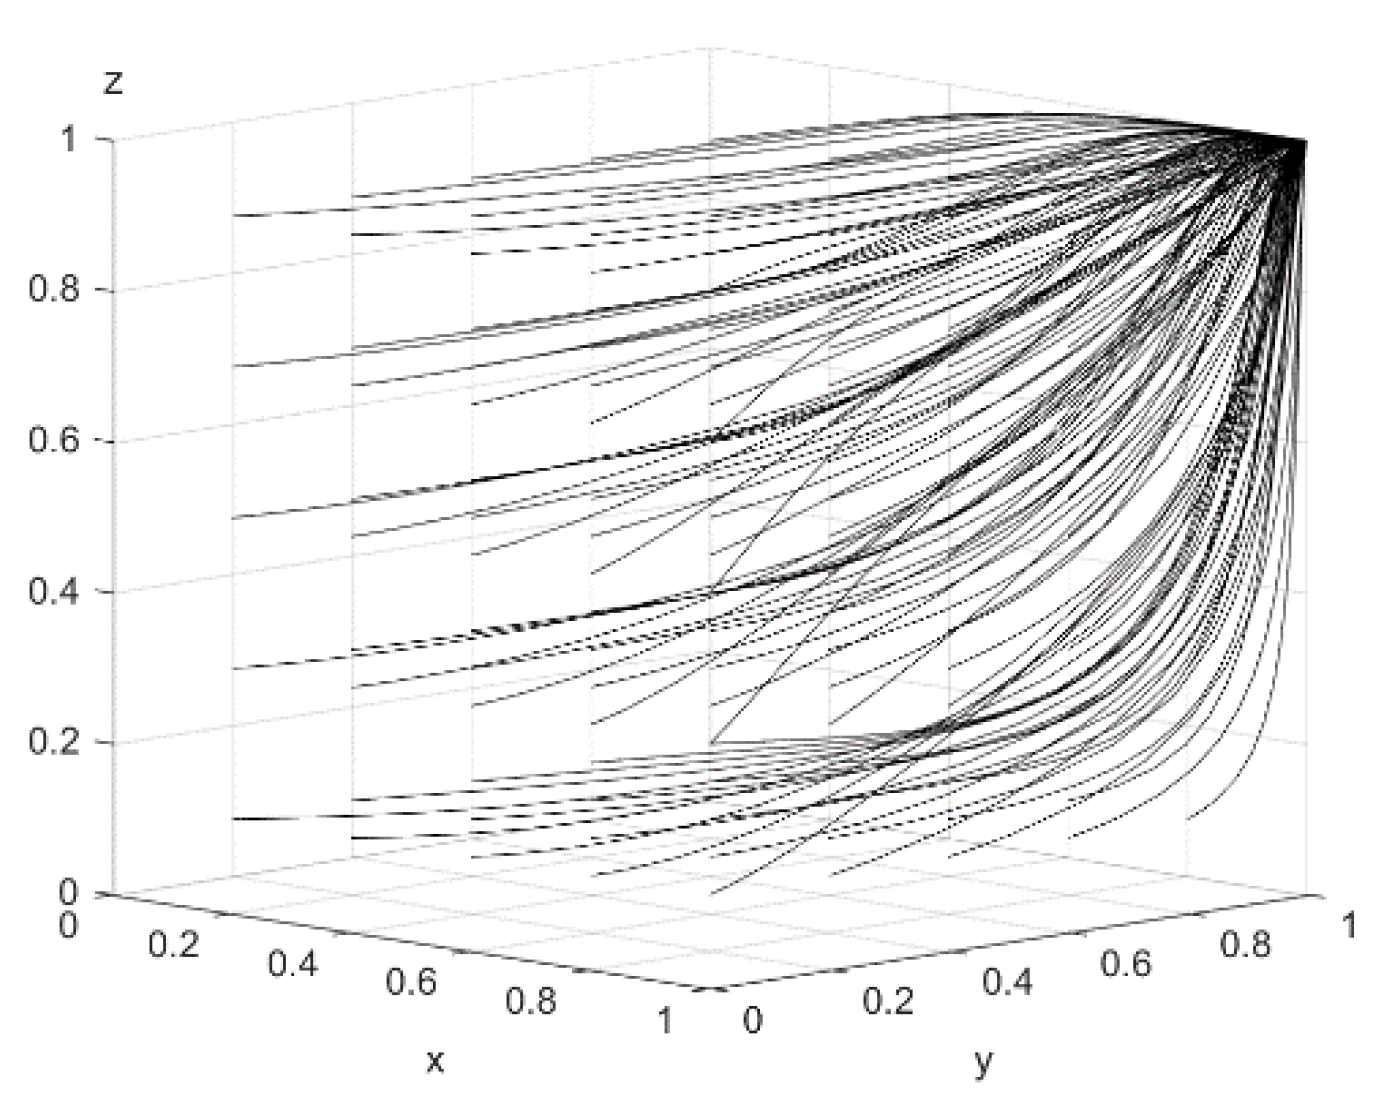
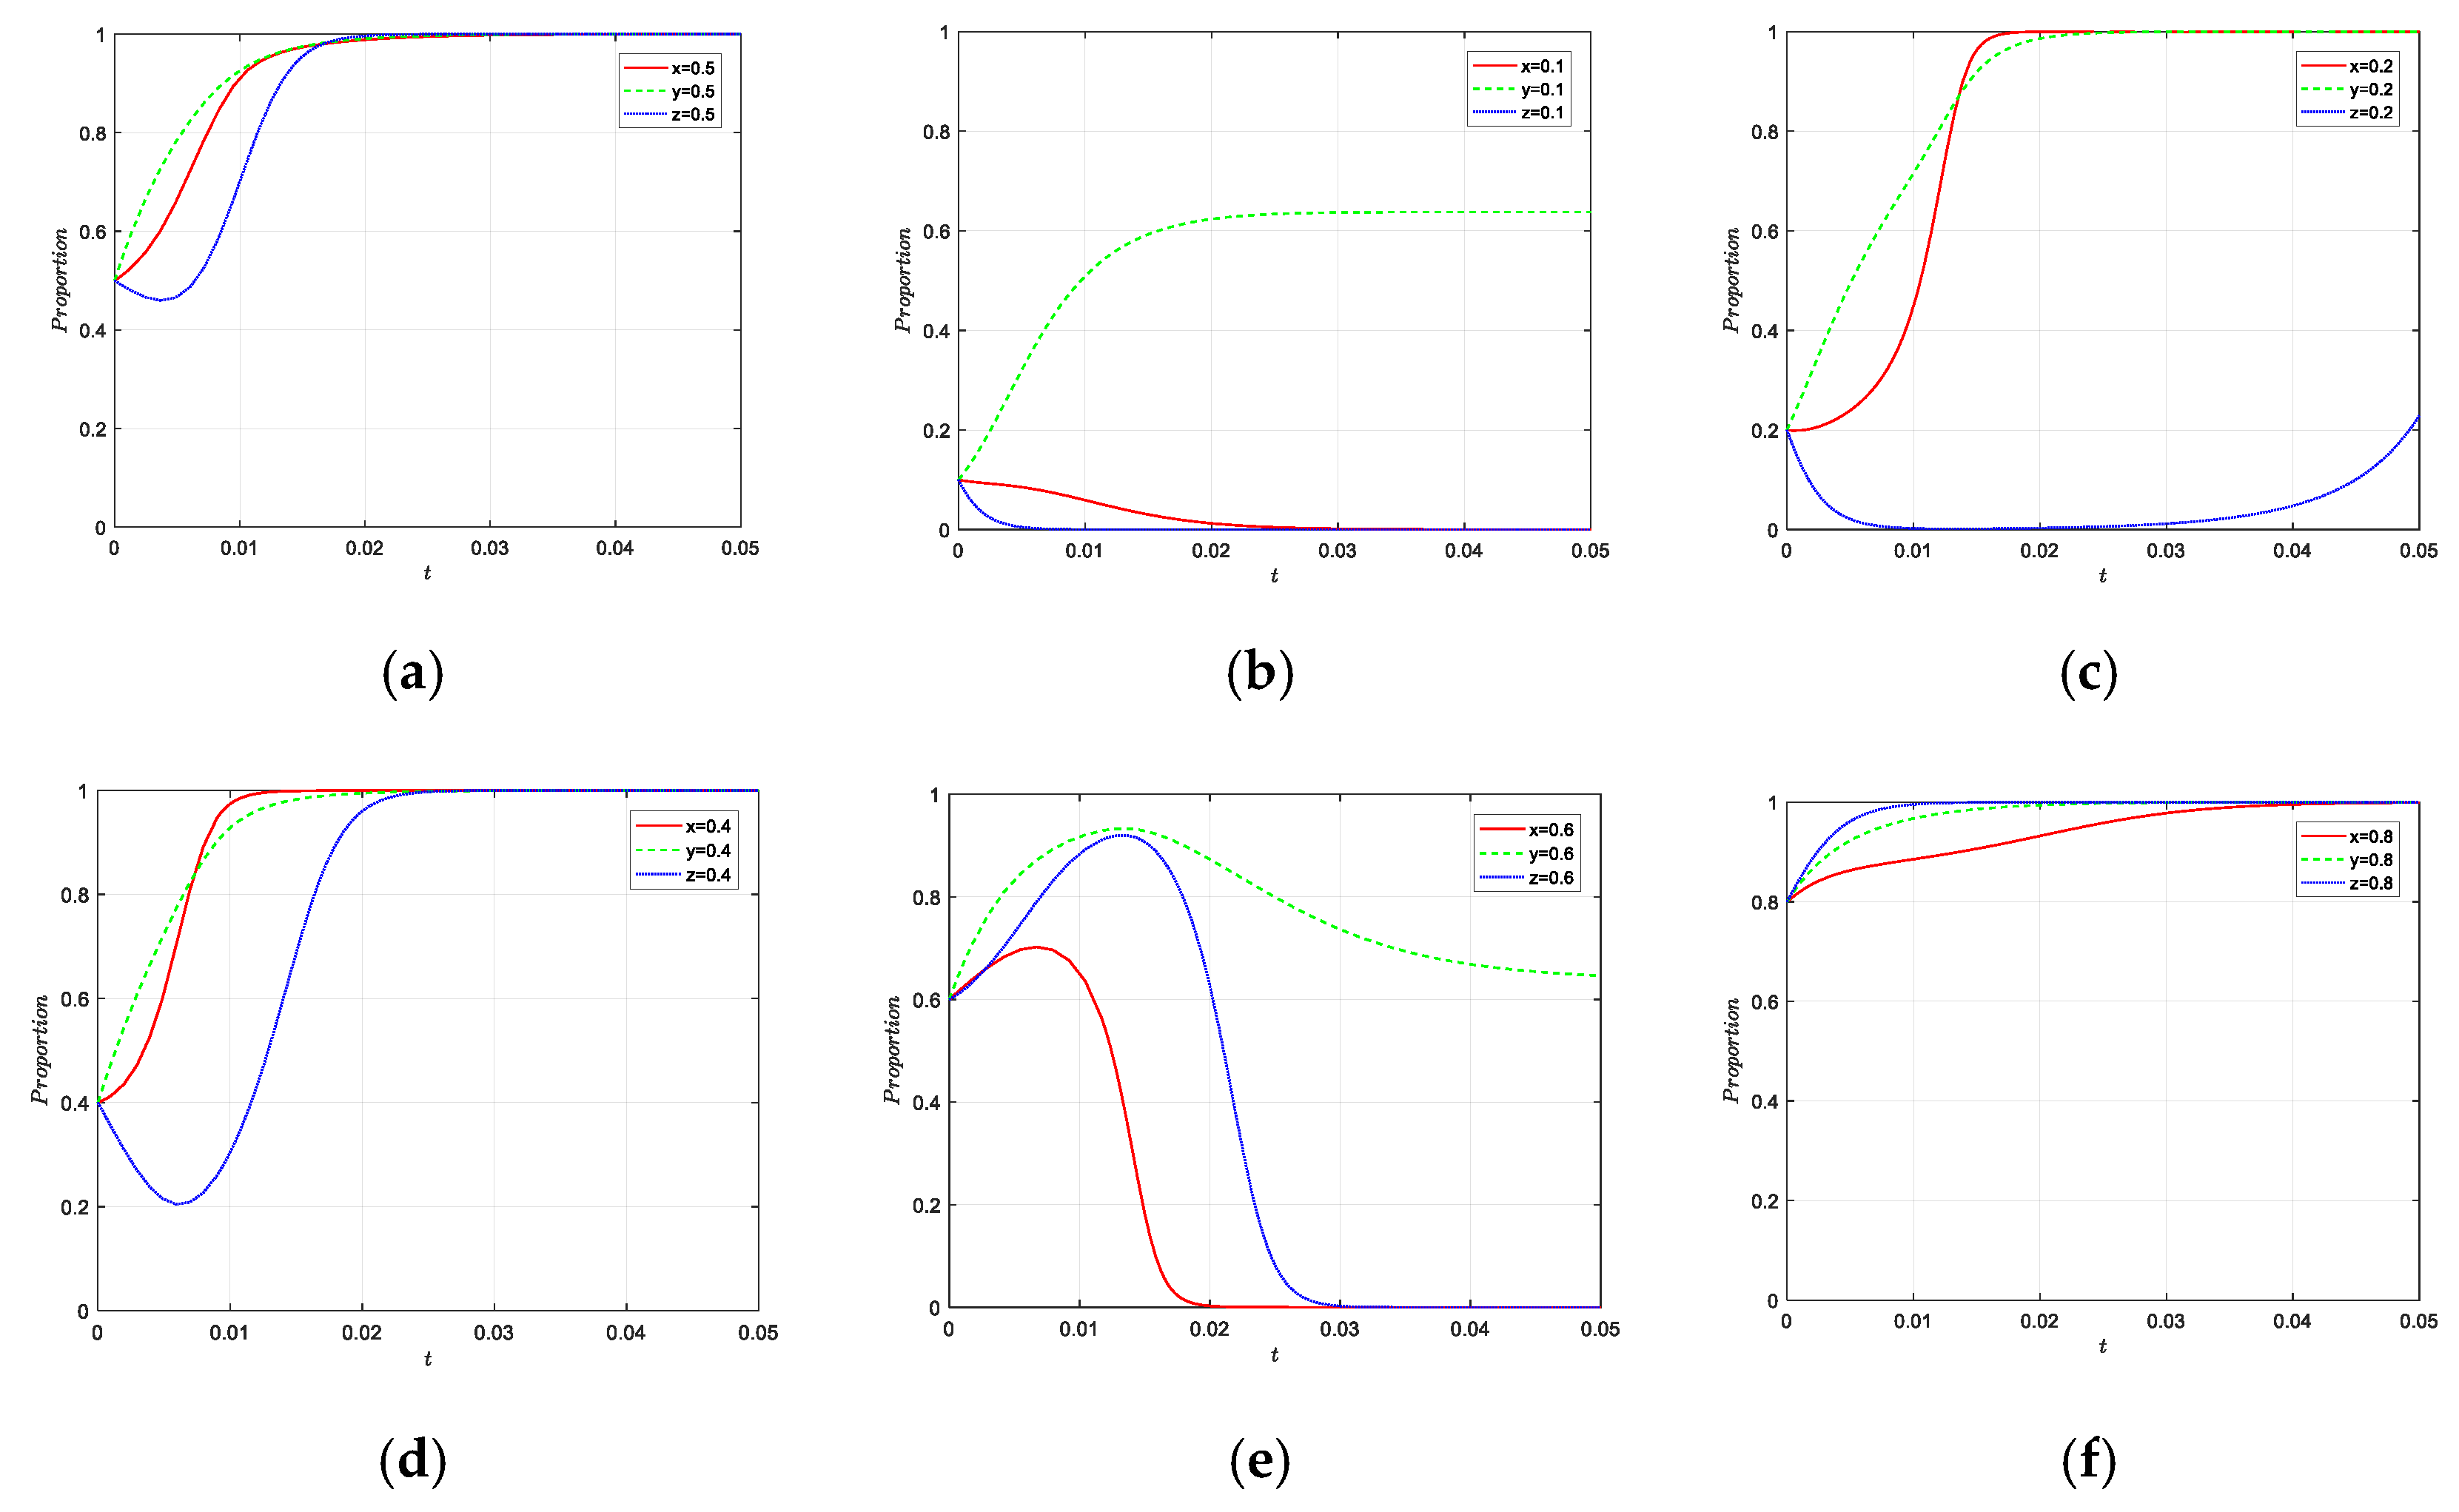
5.1. Effect of Different Initial Situations of the Principal Strategy on the Evolutionary Path

5.1.1. Effect of Input Cost on the Evolutionary Outcome of the Game

The investment cost C s 1 of carbon trading in emission reduction enterprises is objective data, so the research on the input cost will start from the perspective of the upfront cost of emission control enterprises and the government’s regulation cost, and take the parameter value in the benchmark state as the reference point, taking 50%, 60%, 100%, 140%, and 170% of the C 1 parameter point, respectively, and taking 80%, 100%, 130%, 160%, and 180% of the C d 1 parameter point, respectively.
The influence of changes in input costs by the government and emission control enterprises on system evolution results is depicted in Figure 7a,b. As illustrated in Figure 7a, it can be observed that the willingness of the government to regulate the carbon trading market reaches 100%. However, when C 1 1700 , the y -axis intercept in the image shifts from 1 to 0, implying a fall from 100% to 0% in the government’s inclination to opt for regulation strategies. It can be inferred that the government’s willingness to implement regulations reduces with an upsurge in input costs such as manpower and materials. Furthermore, the graph in Figure 7b reveals that as time progresses, emission control enterprises are more inclined towards selecting carbon trading if C d 1 800 . However, when C d 1 1800 , emission control enterprises are less prone to participate in carbon trading. Consequently, as input costs rise, make E d 1 C d 1 < E d 2 η ( Q 1 Q 0 ) , signifying that under equivalent circumstances, the income of participating emission control businesses in carbon trading is less compared to non-participants, and their strategy inclines towards ono-participation in carbon trading. Therefore, it is appropriate for the government to reduce the cost of regulation, which is conducive to promoting the government’s active regulation of carbon trading by enterprises, improving the level of supervision and promoting the activity of the carbon market. For enterprises, heavy polluters with high abatement costs are more suitable to purchase carbon emission rights to offset their carbon emissions.

5.1.2. Effect of Reward and Punishment Mechanism on Game Evolution Results

The government’s evolution track under different incentive subsidies β is shown in Figure 8a. When β 35, the government has a high willingness to regulate, but when the proportion of subsidies exceeds a certain threshold, the government’s strategy will change due to the high cost brought by subsidies; so local governments should implement phased subsidies according to the actual situation of the carbon trading market to increase trading volume.
The evolutionary game results concerning the varied values of ε and η are illustrated in Figure 8b,c. In the absence of carbon subsidies and taxes, the government’s proactive regulation rate gradually approaches 1, while the willingness of emission control enterprises to participate actively in carbon trading declines to 0. This phenomenon shows that the application of carbon subsidies and tax interventions effectively boosts the active participation of emission control enterprises in carbon trading. As the ratio of ε and η increases, the inclination of the government to regulate the carbon market steadily dwindles. However, the eagerness of emission reduction enterprises to take part in carbon trading is ascending. Consequently, if carbon subsidies and taxes are meticulously planned, the government will maintain the impetus to act while forming a positive incentive for enterprises simultaneously. Such incentives improve enterprise participation in carbon trading and aid in reducing carbon emissions.

5.1.3. Effect of the Carbon Price and Initial Carbon Quota on the Evolutionary Outcome of the Game

To explore the impact of fluctuations in the unit carbon transaction price and initial carbon quota on system evolution, diverse carbon prices and quotas were established. The carbon price P was sequentially fixed at 10, 50, 100, 150, and 200, as presented in Figure 9a,c. An increase P signified greater government revenue via the carbon trading market, thereby boosting the probability of the “regulate” strategy adoption by the government. In contrast, emission control enterprises encounter amplified expenses attributed to procuring carbon emission rights, consequently prompting them to adopt the “non-purchase” strategy.
Based on the initial carbon quota, Q 0 = 23 , which flutters between 2 and 3 units, and was consecutively fixed at 21, 23, 25, 28, and 30, as displayed in Figure 9b,d. When the initial carbon quota remains below an enterprise’s actual carbon emissions, an increase in carbon quota curtails the likelihood of the government selecting the “regulate” strategy while escalating the probability of emission control enterprises adopting the “purchase” strategy. Correspondingly, when the initial carbon quota surpasses an enterprise’s actual carbon emissions, the corporation evolves from being a demand-side participant to a supply-side equivalent, thus altering the strategic course of the lead players in the tripartite game.

5.1.4. Parameter Optimization

The above scenario simulation reveals the effect of the main parameters on the evolution of the game subject’s behavior strategy. Below, the parameters will be optimized according to the simulation results, and the initial parameters will be changed as followsas shown in Table 4.
In Figure 10, the final stable state of the system is (1,1,1). The simulation results of the optimized system evolution are shown in Figure 11, that is when the government regulates, emission reduction enterprises choose to sell, and emission control enterprises choose to purchase, the system will reach an optimal stable state.

6. Model Optimization under Prospect Theory

6.1. The Evolutionary Game Model under Prospect Theory

The carbon trading game involves three main players: the supervisor, the supplier, and the demander. None of these players are entirely rational, as each one makes decisions based on their own perceived gains and losses. In 1979, Tversky and Kahneman [54] developed the prospect theory to account for behavioral factors such as reference dependence, risk preference, loss aversion, and subjective expectation in enterprise decision-making processes. The evolutionary game based on the prospect theory differs from traditional evolutionary games in that it judges gains and losses based on a reference point to guide behavioral decision-making. This approach provides a more accurate reflection of the psychological processes underlying enterprise decision-making and their impact on decision-making behavior [55]. According to the prospect theory, the prospect value V of a strategy can be assessed using the value function u x i and the subjective expected weight function π ( P i ) and can be expressed as follows:
V = u ( x i ) π ( P i ) u x i = x i α λ x i α     x i 0     x i < 0
where π ( P i ) represents the objective probability of the decision event i , x i represents the difference between the actual profit and the reference point. When x i > 0, players perceive it as “profit”, and x i < 0 creates a sense of “loss”, leading to loss aversion; α ( 0 , 1 ) indicates the value function’s marginal diminishing degree concerning gain and loss perception in the game entity. Smaller values denote heightened risk sensitivity. λ ( λ ≥ 1) represents the loss avoidance coefficient. Larger values indicate increased loss sensitivity.
For the determined gains and losses, the relevant parameters are kept constant. The uncertain benefits and costs involved in this paper include: R 1 , R 2 , R 3 , C 1 , C 2 of the government, E s 1 , E s 2 , C s 1 , C s 2 , C s 3 of emission reduction enterprises, and E d 1 , E d 2 , R d , C d 1 , C d 2 of emission control enterprises. For simplicity’s sake, we set the reference value at 0.
V ( R 1 ) = x u ( R 1 ) + ( 1 x ) u ( 0 ) = x u ( R 1 ) = x R 1 α , V ( R 2 ) = x R 2 α , V ( R 3 ) = ( 1 x ) R 3 α V ( C 1 ) = x u ( 0 ) + ( 1 x ) u ( C 1 ) = ( 1 x ) u ( C 1 ) = ( 1 x ) λ C 1 α , V ( C 2 ) = ( 1 x ) λ C 2 α V ( E s 1 ) = y E s 1 α , V ( E s 2 ) = ( 1 y ) E s 2 α , V ( C s 1 ) = y λ C s 1 α , V ( C s 2 ) = y λ C s 2 α , V ( C s 3 ) = ( 1 y ) λ C s 3 α V ( E d 1 ) = z E d 1 α , V ( E d 2 ) = ( 1 z ) E d 2 α , V ( R d ) = z R d α , V ( C d 1 ) = z λ C d 1 α , V ( C d 2 ) = z λ C d 2 α
The replication dynamic equation after introducing the prospect theory is shown in Formula (13).
U ¯ x = x ( 1 x ) [ y z ( T s + T d β Q x R 2 α ) + y ( x R 2 α + θ P Q T s T d ) + z ( x R 2 α + θ P Q 1 θ P Q 0 η Q 1 η Q 0 T s T d )             + x R 1 α + η ( Q 1 Q 0 ) + T s + T d ( 1 x ) λ C 1 α ε ( Q 1 Q 0 ) ( 1 x ) R 3 α + ( 1 x ) λ C 2 α ] U ¯ y = y ( 1 y ) [ x β Q + x ( 1 z ) T s ( 1 y ) E s 2 α + ( 1 y ) λ C s 3 α + y E s 1 α + P Q y λ C s 1 α y λ C s 2 α ] U ¯ z = z ( 1 z ) [ x ε ( Q 1 Q 0 ) x η ( Q 1 Q 0 ) + x ( 1 y ) T d ( 1 z ) E d 2 α + z E d 1 α + z R d α P ( Q 1 Q 0 ) z λ C d 1 α z λ C d 2 α ]

6.2. Simulation Analysis after Optimization

6.2.1. Effect of Initial Willingness on the Evolutionary Outcome of Optimal ESS

Risk sensitivity coefficients and loss avoidance coefficients are introduced under the condition of maintaining the optimal stabilization strategy of the system (1,1,1). According to experts’ calculations [54], the behavioral preferences of decision-makers can be roughly expressed when α = 0.88 and λ = 2.25, as shown in Figure 12. Figure 12a illustrates that with the introduction of the coefficients while retaining the initial willingness at 0.5, the equilibrium point remains unchanged and stable in the optimal strategy (1,1,1).
This study explores the influence of the decision-maker’s initial will on the evolution of a system given the constraints of α = 0.88 and λ = 2.25. The simulation results are displayed in Figure 12b–f. Considering the decision-maker’s sensitivity to risks and losses, significant changes in the final equilibrium of the system arise from variations in their initial willingness. Specifically, when x = y = z = 0.1 or x = y = z = 0.6 , decision-makers did not reach their optimal strategy, leading to low activity in the carbon trading market that undermines its steady development. When x = y = z = 0.2 , the evolution rate of government and emission reduction enterprises’ strategies to the optimal evolution is accelerated. At x = y = z = 0.4 , all decision-makers reach the optimal strategy, but their evolution rate varies. When x = y = z = 0.6 , the decision-maker’s strategy begins to change again. When the initial willingness reaches a high level, as shown in Figure 12f, it can be found that the evolution rate of emission control enterprises is the fastest, and the government’s strategic choice lags behind that of emission reduction enterprises. In general, the system either experiences instability or stability under other strategies as the initial willingness varies.

6.2.2. Effect of Risk Sensitivity Coefficients on the Evolutionary Results of Optimal ESS

To explore the influence of risk sensitivity coefficients on the optimal results of the system, α assigned values of 0.4, 0.8, 0.88, and 0.95, respectively, for government, emission reduction enterprises, and emission control enterprises. As shown in Figure 13, at α = 0.4, the behavior probability of emission reduction enterprises finally converges to 1. When α is small, emission reduction enterprises perceive higher incentives from the government and are willing to participate in carbon trading; however, both the government and the emission control enterprises show fluctuating behavior probabilities, leading to suboptimal strategies. At α = 0.8, the behavior probability of government and emission control enterprises converges to 0, while the probability of emission reduction enterprises participating in carbon trading approaches 1. As α increases to 0.95, the tripartite game system evolves to (1,1,1). When α increases, the participation of emission control enterprises and reduction enterprises in carbon trading leads to perceived increased benefits for the government, inducing it to adopt a “regulate” strategy, and government penalties make the emission control enterprises perceive the loss of not participating in carbon trading, causing them to adopt a “purchase” strategy. Hence, an increase in the risk sensitivity coefficient of decision-makers could accelerate the evolution of the system to the optimal ESS strategy.

6.2.3. Effect of Loss Avoidance Coefficients on the Evolutionary Results of Optimal ESS

To explore the impact of loss avoidance coefficients on the optimal results of the system, λ was assigned a value of 0.25, 1.25, 2.25, and 2.5 for the government, emission reduction enterprises, and emission control enterprises. Based on the simulation results shown in Figure 14, when λ = 0.25, the government finally stabilized at 0, while the emission reduction enterprises and emission control enterprises finally evolved to 1, i.e., the evolutionary stability point of the system was (0,1,1). For λ = 1.25, the emission control enterprise’s evolutionary results changed from convergence to 1 to convergence to 0. While between the values of 2.25 and 2.5, there existed a critical value that z converges to 1, the higher the value, the slower the evolution rate. At λ = 2.25 or 2.5, the system achieved optimal stability at (1,1,1). Thus it can be seen that emission reduction enterprises display insensitivity to λ , their strategy selection not being influenced by it. The reason is that as the value λ increases, the convergence rate of emission reduction enterprises slows down. Conversely, the government and emission control enterprises exhibited greater sensitivity to λ ; the reason is that when λ was larger (≥2.25), both parties were more likely to avoid punishment and minimize losses, which strengthened their willingness to participate in carbon trading. Thus, increasing the loss avoidance coefficient is advantageous for accelerating the optimal evolution of the game system.

7. Conclusions and Recommendations

7.1. Conclusions

Based on an evolutionary game model, this study examines the patterns of strategy evolution among three decision-making entities: the government, emission reduction enterprises, and emission control enterprises. Additionally, the study seeks to identify the optimal stable state of the overall system. To address the shortcomings of the tripartite game model, a prospect theory optimization model is introduced, which explores how decision-makers perceive risks and losses. Through simulation analysis using MATLAB 2016b, the study arrives at the following conclusions:
(1)
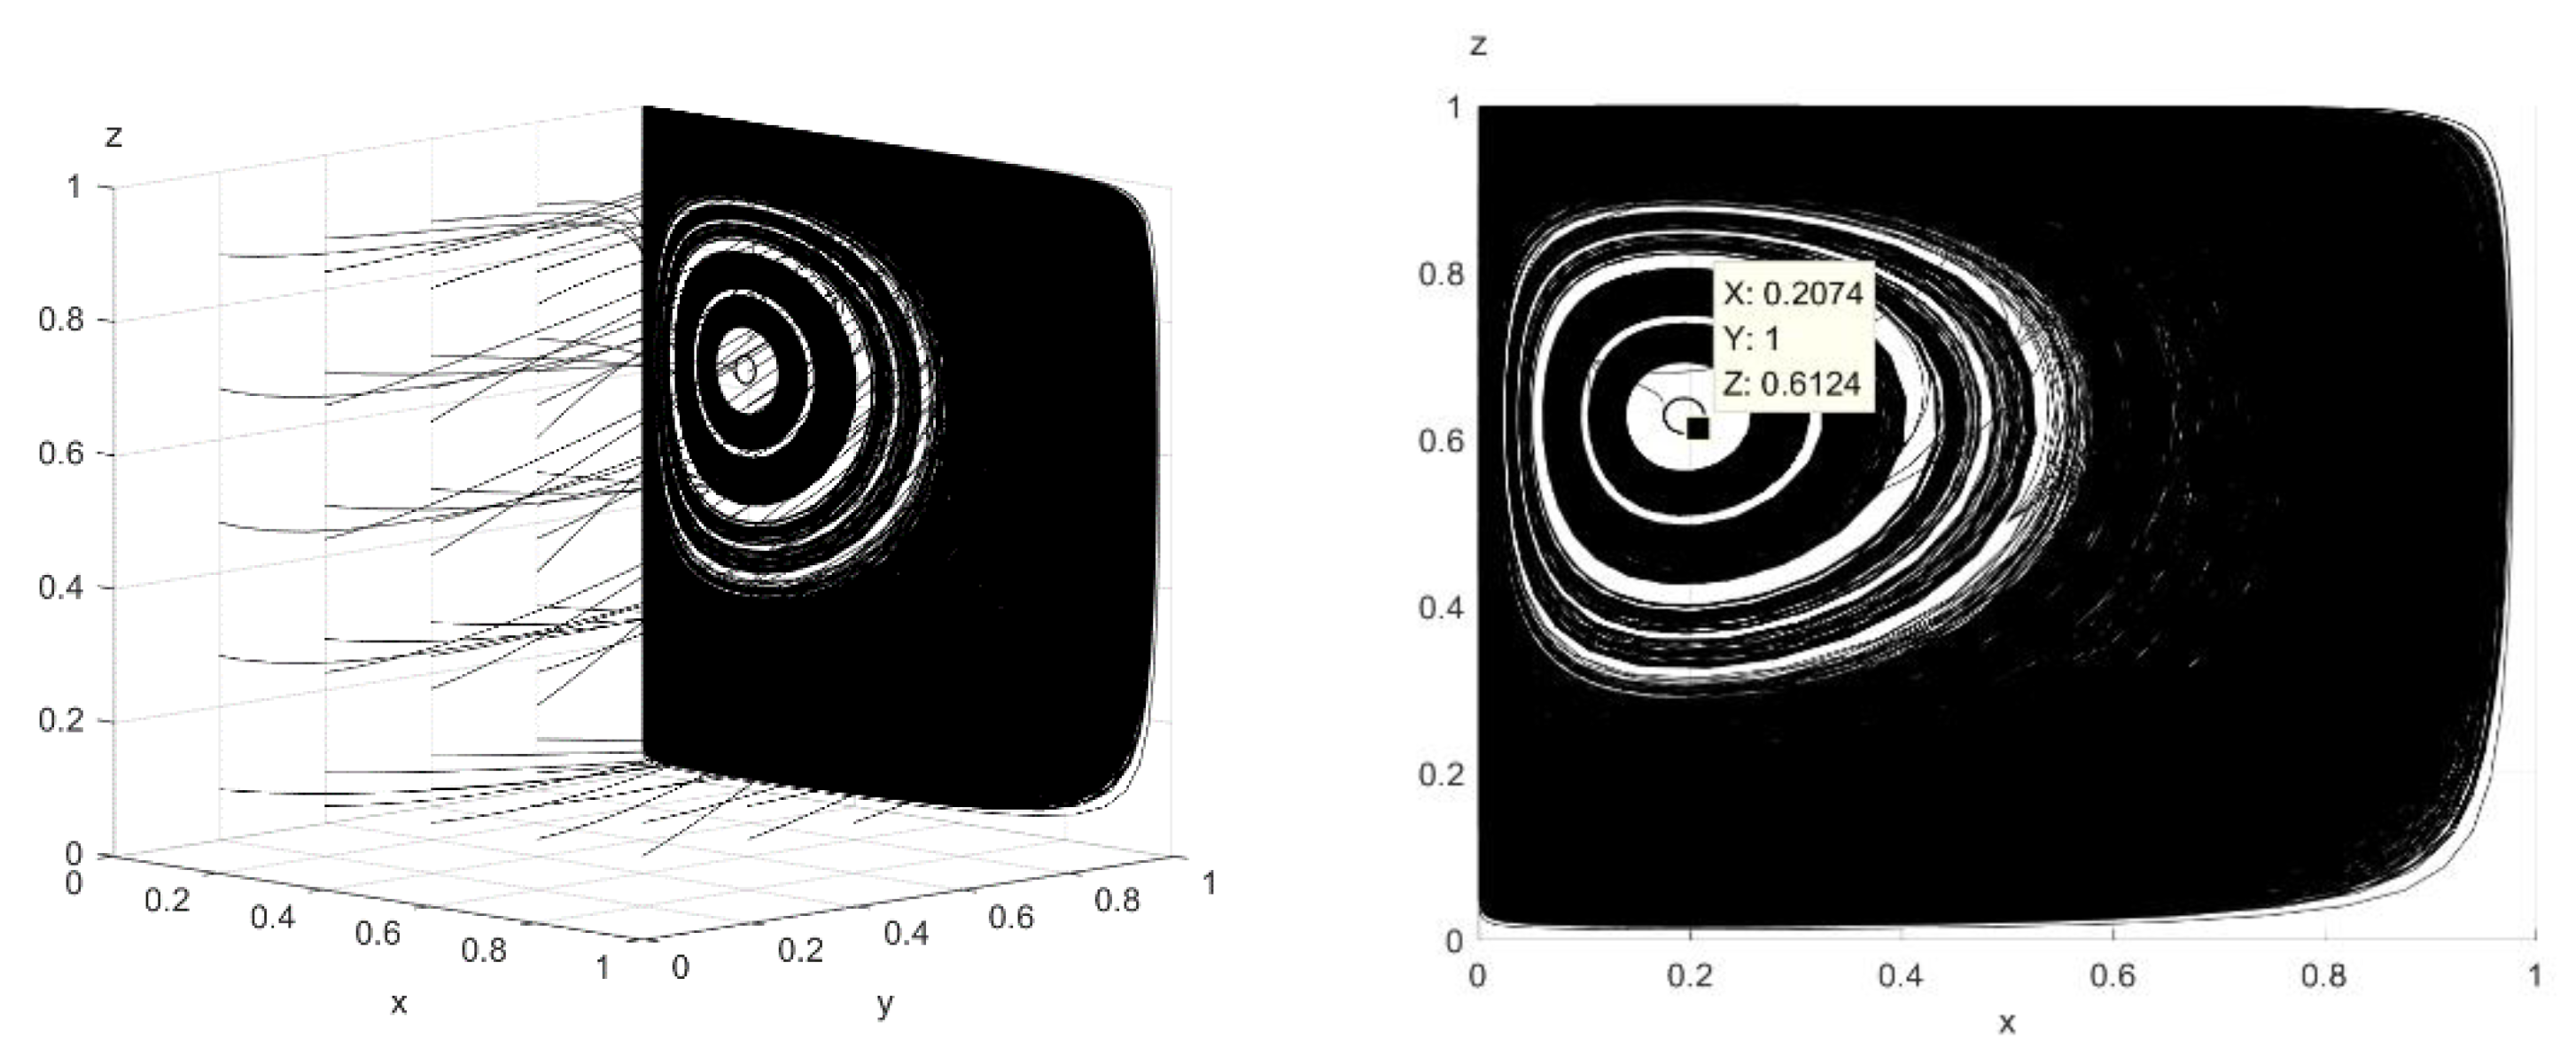
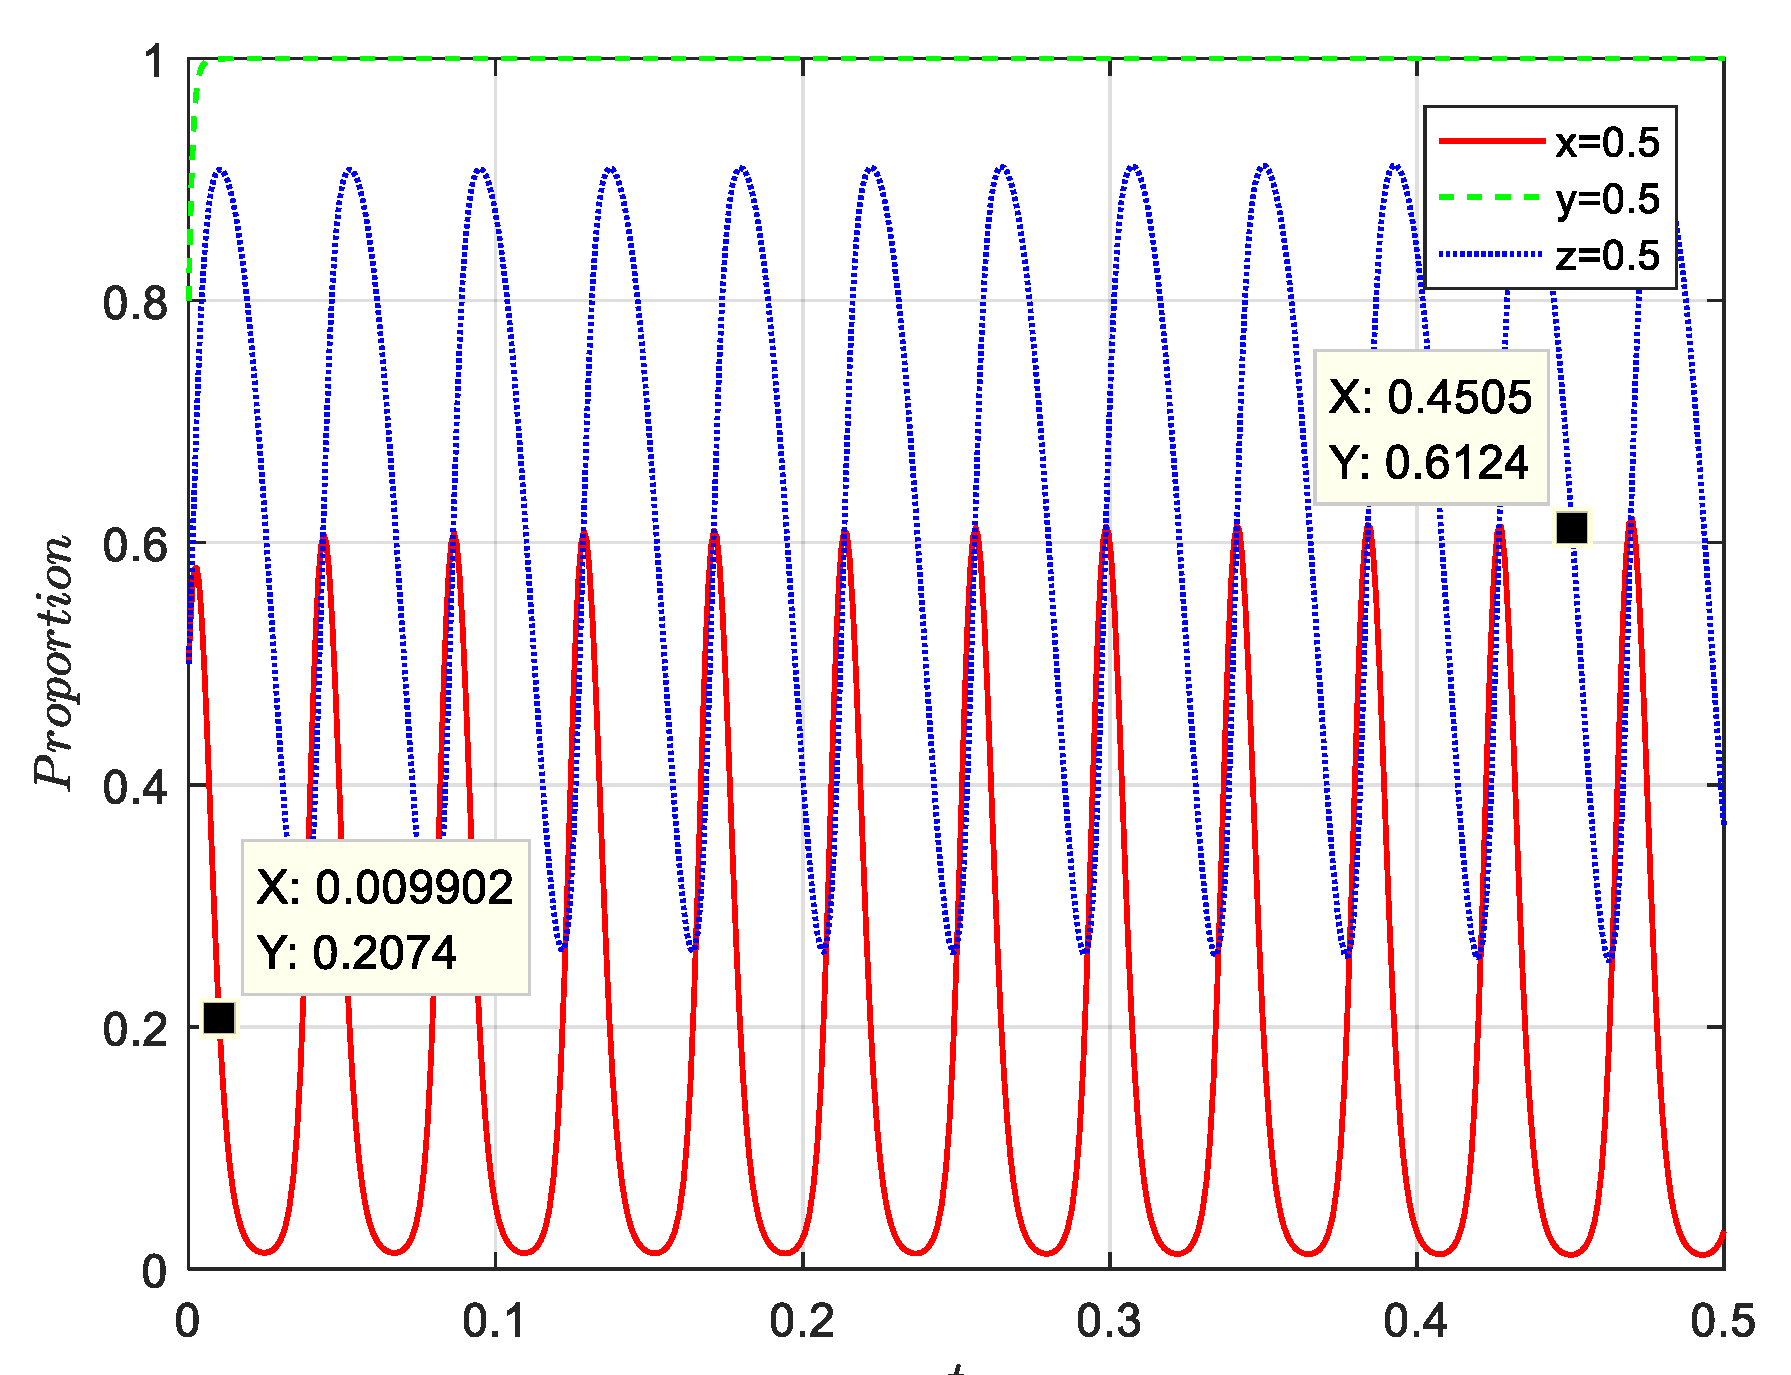
Under the basic parameters, the game process of the three decision-makers shows a periodic behavior pattern and does not reach the optimal equilibrium. However, when the basic conditions are met, the three parties in the game can reach the optimal stable state (1,1,1); that is, {regulate, sell, purchase}, which is conducive to the steady development of the carbon trading market.
(2)
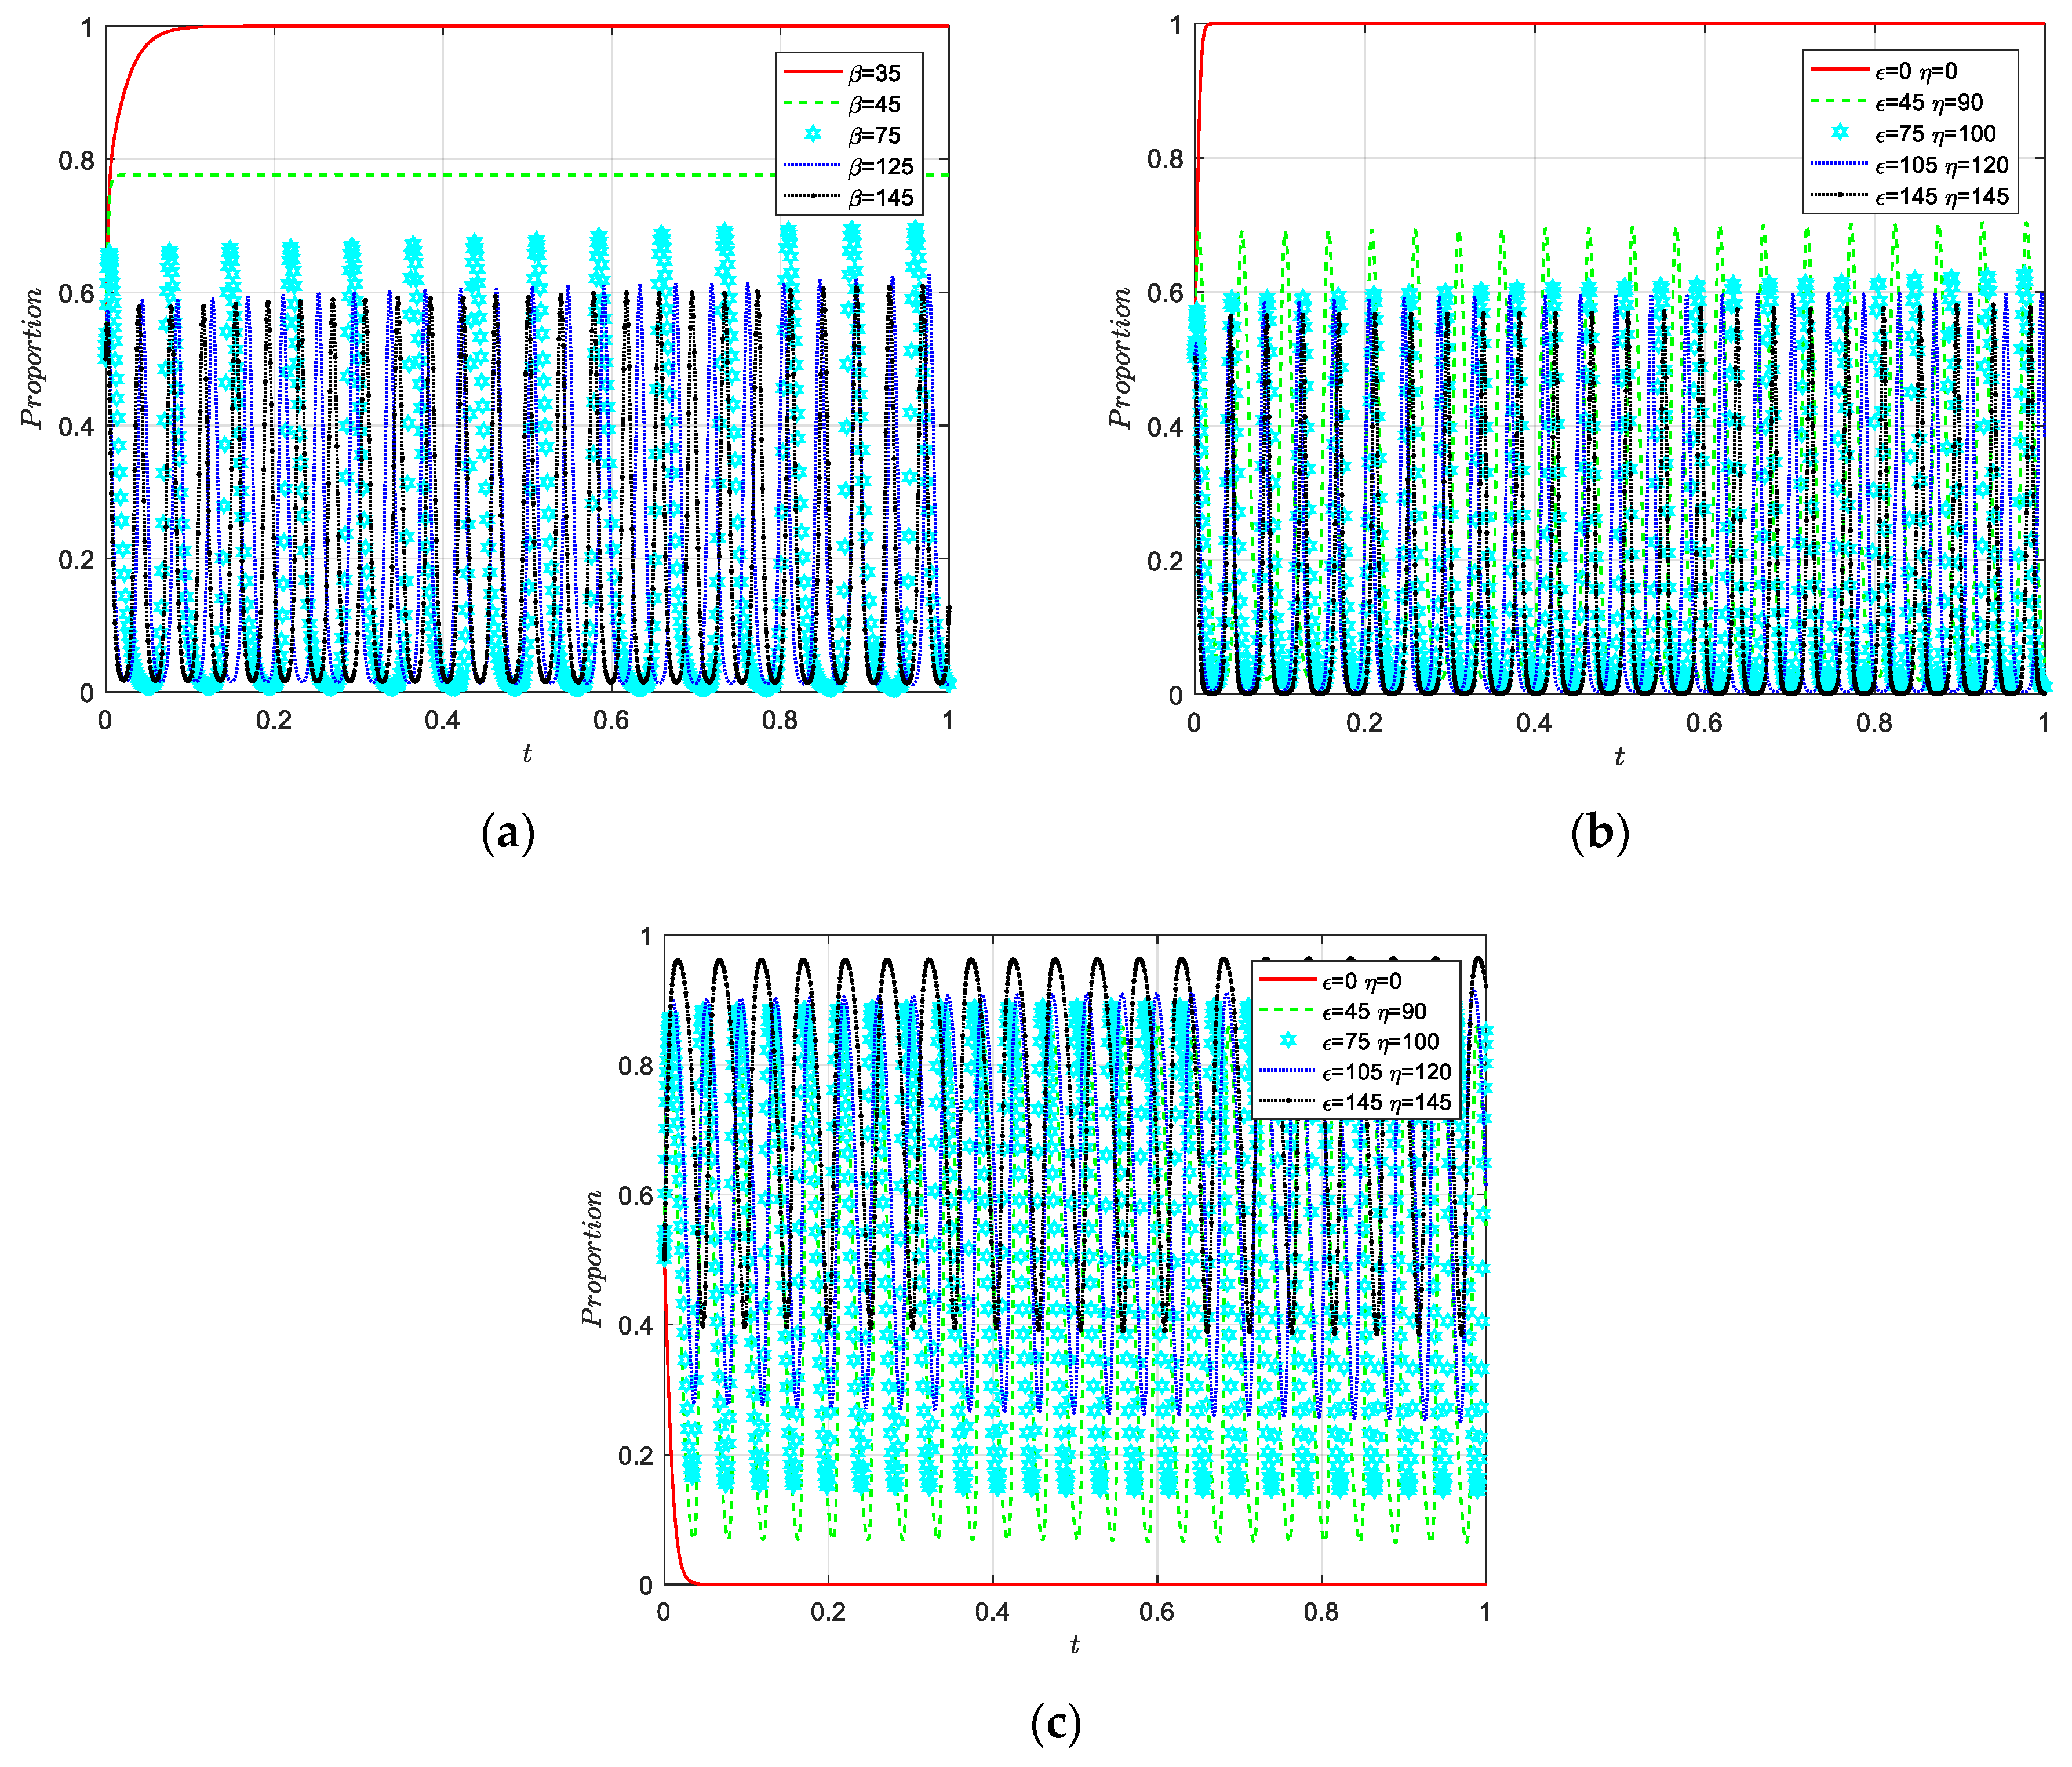
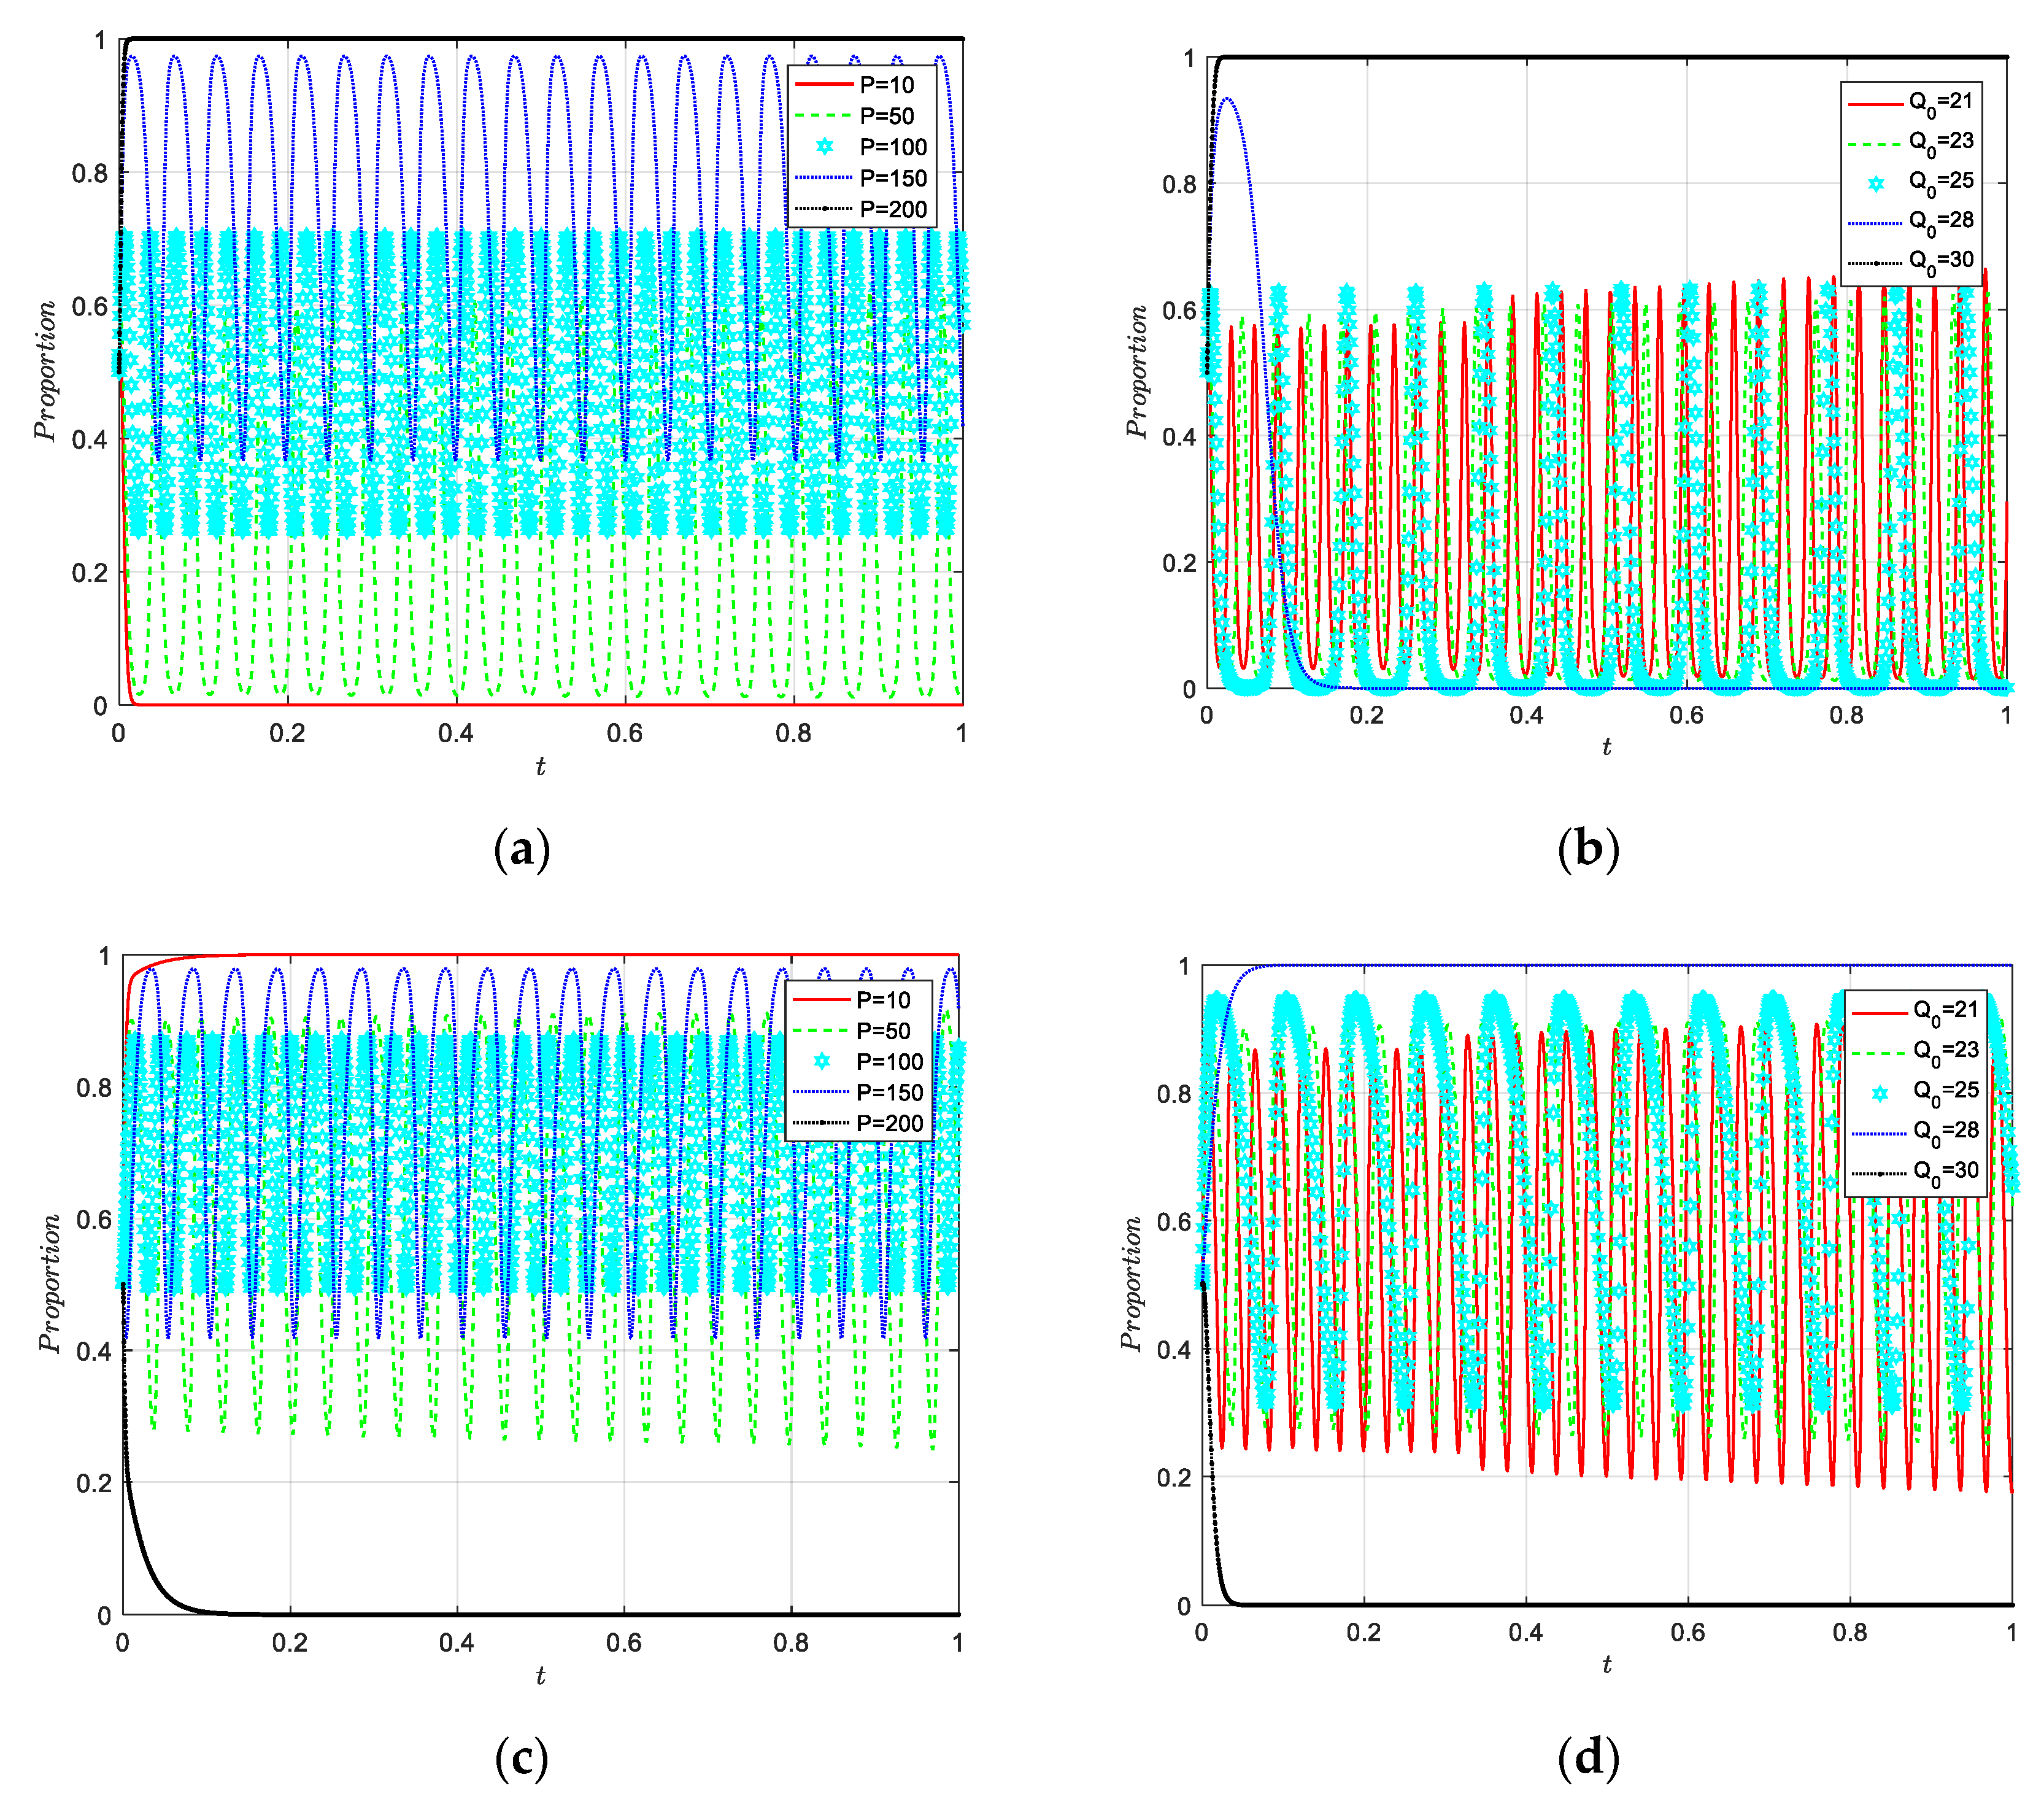
Input costs, rewards, and punishment mechanisms, carbon prices, and carbon quotas all have a significant impact on the evolutionary outcomes of the tripartite game model, and there is a threshold effect of the corresponding parameters. The higher the input cost, the lower the participation of government and enterprises in carbon trading; the higher the subsidy, the lower the penalty and the lower the participation of government in carbon trading, but the participation of emission control enterprises increases; the higher the carbon price, the government will tend to choose the “regulate” strategy, while emission control enterprises will tend to choose the “non-purchase” strategy; and the higher the initial carbon quota, the government will tend to choose the “non-regulate” strategy, and the role of emission control enterprises will change accordingly.
(3)
Following the introduction of prospect theory to optimize the tripartite game model, previous research on prospect theory indicates that incorporating risk sensitivity and loss avoidance coefficients at the outset does not alter the optimal and stable outcomes of the tripartite game system. However, as the initial willingness size changes, the results of carbon trading within the tripartite game change and emerge unstable strategies. During the carbon trading process, higher risk sensitivity coefficients among decision-makers facing gains can lead to more rational behavior towards gaining, ultimately promoting carbon trading behavior. Additionally, higher loss-sensitive coefficients among decision-makers, reflecting the effects of losses, facilitate the overall evolution of the tripartite game system toward an optimal state.

7.2. Recommendations

In summary, the goal of environmental policy is to achieve a harmonious balance between economic, societal, and environmental objectives. However, current carbon trading policies are yet to fully realize this objective, leaving room for improvement. Given the high levels of uncertainty regarding the future development of carbon trading markets, achieving such improvements will require significant time and effort, necessitating ongoing exploration by researchers. Drawing on the study’s findings, practical recommendations for the development and implementation of carbon trading policies are proposed for both government and enterprise stakeholders, and the precise recommendations are as follows:
(1)
Give more institutional protection to carbon trading. Simplify the carbon trading process and reduce transaction fees to reduce the transaction costs of enterprises and increase their enthusiasm to participate in carbon trading. Establish a reward and punishment mechanism to stimulate the vitality of the carbon market, such as giving a set of tax incentives to enterprises that actively implement carbon emission reduction, to reduce the pressure of decreasing productivity caused by the environmental cost of carbon emissions in the short term; on the contrary, enterprises that do not meet the requirements of environmental protection and energy consumption standards should be included in the list of strict control, and carbon tax should be increased to regulate the emission behavior of heavy polluters to avoid the phenomenon of “bad money expelling good money”. The carbon trading market should be regulated from a macroscopic point of view by implementing phased subsidies according to the actual situation of the carbon trading market, and the operation of the trading platform should be checked regularly.
(2)
Stabilize the price of carbon emission rights trading in the carbon market and rational optimization of carbon quotas. Set the upper limit of the carbon price to control the cost of emission reduction of enterprises, and set the lower limit of the carbon price to promote the technical emission reduction of enterprises. To cope with the impact of different tax standards and carbon prices on enterprises’ strategic choices, adjust the gap between carbon subsidies and carbon taxes and carbon prices to promote the construction of carbon markets in each stage. Optimize the initial carbon quota allocation method. Allow some flexibility in the design of the quota allocation method for the national carbon trading market. A special working group can be set up to scientifically account for carbon emission quotas according to the characteristics of industries, regions, and even enterprises. By enriching the trading subjects of the carbon trading market, more enterprises in carbon emission-intensive industries can be included in the construction of the carbon market to stimulate the vitality of the carbon market, expand the supply and demand of carbon quotas, and achieve a larger scale of carbon emission reduction to achieve the “double carbon” goal.
(3)
Enterprises should proactively participate in carbon trading market activities. For emission reduction enterprises, active participation in carbon trading can not only reduce the cost pressure brought by low-carbon production, but also improve their visibility and lead the corresponding low-carbon industries toward stable and sustainable development. For emission control enterprises, in the short term, active participation in carbon trading can alleviate the pressure of excess emissions brought about by production targets. In the long run, active participation in carbon trading can maintain a good corporate environmental image and increase goodwill. Moreover, to respond to the national call for emission reduction, they need to actively adopt low-carbon production technologies, reduce carbon emissions, rationally analyze the evolution trend of carbon prices in the carbon trading market, enhance risk sensitivity and loss avoidance awareness, timely adjust low-carbon investments, seize the opportunity of green transformation, and meet the challenges of carbon trading policy.

7.3. Outlook

This study explores the strategic evolutionary paths of governments, emission reduction enterprises, and emission control enterprises in the carbon trading market using an evolutionary game model and prospect theory. It proposes targeted countermeasures for market optimization; however, there are certain limitations:
(1)
The carbon trading market involves multiple participating parties, including third-party monitoring organizations, carbon trading platforms, the public, and so on; future research could take more subjects into account.
(2)
The carbon market consists of various supply and demand sides, but this paper only focuses on emission reduction enterprises and emission control enterprises as representatives. Future research may consider incorporating additional types of carbon trading participants into the model to explore more influential factors, combined with actual case studies to improve the practical application of the model.

Author Contributions

All the authors have contributed to the idea of this paper. T.W. supervised the overall work and provided constructive advice to improve the manuscript as well as later revision. J.H. developed the mathematical model and wrote the whole manuscript. All authors have read and agreed to the published version of the manuscript.

Funding

This work was supported by the National Social Science Fund of China (21BJY190) and Postgraduate Scientific Research Innovation Project of Hunan Province (CX20221038).

Institutional Review Board Statement

Not applicable.

Informed Consent Statement

Not applicable.

Data Availability Statement

Not applicable.

Conflicts of Interest

The authors declare no conflict of interest.

Nomenclature

Parameters
R 1 Government basic income when choosing “regulate” strategies;
C 1 Government costs to regulate, such as supervision costs;
θ The profit distribution coefficient of government participation in carbon trading;
R 2 Administrative incentives from the central government;
T s Penalties to emission control enterprises when both choose not to cooperate;
T d Penalties to emission reduction enterprises when both choose not to cooperate;
R 3 Government basic income when choosing “non-regulate” strategies;
C 2 Government costs to non-regulate, such as ecological compensation costs;
E s 1 Emission reduction enterprises’ basic income when choosing “sell” strategies;
C s 1 The cost to sell for emission reduction enterprises, such as investment cost;
C s 2 The cost to sell for emission reduction enterprises, such as transaction cost;
β Subsidies for each unit of carbon credits sold by emission reduction enterprises;
P Carbon price;
Q Selling the total amount of carbon allowances;
E s 2 Emission reduction enterprises’ basic income when choosing “non-sell” strategies;
C s 3 The cost to non-sell for emission reduction enterprises, such as opportunity cost;
Q 1 Actual carbon emissions of emission control enterprises;
Q 0 Government-allocated carbon quotas;
ε Subsidies for each unit of carbon credits purchased by emission control enterprises;
E d 1 Emission control enterprises’ basic income when choosing “purchase” strategies;
C d 1 The cost to purchase for emission reduction enterprises, such as upfront cost;
C d 2 The cost to purchase for emission reduction enterprises, such as transaction cost;
R d External benefits of emission control enterprise, such as benefits from a positive environmental image;
E d 2 Emission control enterprises’ basic income when choosing “non-purchase” strategies;
η The cost to non-purchase for emission reduction enterprises, such as penalties from the government.
Variables
x The probability that governments choose “ regulate” strategies;
y The probability that emission reduction enterprises choose “sell” strategies;
z The probability that emission control enterprises choose “purchase” strategies.
Acronyms
ESSEvolutionarily stable strategy;
J Jacobian matrix.

Appendix A

J 11 = x ( 1 2 x ) [ y z ( T s + T d β Q R 2 ) + y ( R 2 + θ P Q T s T d ) + z ( R 2 + θ P Q 1 θ P Q 0 η Q 1 η Q 0 T s T d )             + R 1 + η ( Q 1 Q 0 ) + T s + T d C 1 ε ( Q 1 Q 0 ) R 3 + C 2 ] J 12 = x ( 1 x ) [ z ( T s + T d β Q R 2 ) + R 2 + θ P Q T s T d ] J 13 = x ( 1 x ) [ z ( T s + T d β Q R 2 ) + R 2 + θ P Q 1 θ P Q 0 η Q 1 η Q 0 T s T d ] J 21 = y ( 1 y ) [ β Q + ( 1 z ) T s ] , J 22 = y ( 1 2 y ) [ x β Q + x ( 1 z ) T s E s 2 + C s 3 + E s 1 + P Q C s 1 C s 2 ] J 23 = y ( 1 y ) x T s , J 31 = z ( 1 z ) [ ε ( Q 1 Q 0 ) η ( Q 1 Q 0 ) + ( 1 y ) T d ] J 32 = z ( 1 z ) x T d , J 33 = z ( 1 2 z ) [ x ε ( Q 1 Q 0 ) x η ( Q 1 Q 0 ) + x ( 1 y ) T d E d 2 + E d 1 + R d P ( Q 1 Q 0 ) C d 1 C d 2 ]

References

  1. Hu, Z.-H.; Wang, S.-W. An Evolutionary Game Model between Governments and Manufacturers Considering Carbon Taxes, Subsidies, and Consumers’ Low-Carbon Preference. Dyn. Games Appl. 2022, 12, 513–551. [Google Scholar] [CrossRef]
  2. Tong, W.; Du, J.; Zhao, F.; Mu, D.; Sutherland, J.W. Optimal Joint Production and Emissions Reduction Strategies Considering Consumers’ Environmental Preferences: A Manufacturer’s Perspective. Sustainability 2019, 11, 474. [Google Scholar] [CrossRef] [Green Version]
  3. Wang, J.; Song, Y.; Li, M.; Yuan, C.; Guo, F. Study on Low-Carbon Technology Innovation Strategies through Government–University–Enterprise Cooperation under Carbon Trading Policy. Sustainability 2022, 14, 9381. [Google Scholar] [CrossRef]
  4. Zhu, B.; Zhang, M.; Huang, L.; Wang, P.; Su, B.; Wei, Y.-M. Exploring the Effect of Carbon Trading Mechanism on China’s Green Development Efficiency: A Novel Integrated Approach. Energy Econ. 2020, 85, 104601. [Google Scholar] [CrossRef]
  5. Yu, N.; Chen, J.; Cheng, L. Evolutionary Game Analysis of Carbon Emission Reduction between Government and Enterprises under Carbon Quota Trading Policy. Int. J. Environ. Res. Public Health 2022, 19, 8565. [Google Scholar] [CrossRef]
  6. Qi, X.; Han, Y. The Design of the Intertemporal Trading Ratio of Carbon Quotas. J. Clean. Prod. 2022, 370, 133481. [Google Scholar] [CrossRef]
  7. Zhang, Y.-J.; Sun, Y.-F.; Huo, B.-F. The Optimal Product Pricing and Carbon Emissions Reduction Profit Allocation of CET-Covered Enterprises in the Cooperative Supply Chain. Ann. Oper. Res. 2021, 1–29. [Google Scholar] [CrossRef]
  8. Xu, J.; Gao, Y.; Bai, Q.; Hu, T. Robust emission reduction strategy under different quota allocation methods of carbon trading policy. J. Ind. Eng. Eng. Manag. 2023, 37, 1–10. [Google Scholar] [CrossRef]
  9. Chen, X.; Wang, J.; Hu, D. Study on the effect of rent-seeking on carbon emission trading market performance under free carbon emission allowances. Syst. Eng.-Theory Pract. 2018, 38, 93–101. [Google Scholar]
  10. Lin, B.; Xu, B. A Non-Parametric Analysis of the Driving Factors of China’s Carbon Prices. Energy Econ. 2021, 104, 105684. [Google Scholar] [CrossRef]
  11. Xie, J.; Dou, X. Carbon Cap-and-trade Pricing Mechanism Based on Cooperative Game Theory. Manag. Rev. 2016, 28, 15–24. [Google Scholar] [CrossRef]
  12. Lv, J.; Fan, X.; Wu, H. Sensitivity Analysis of Factors Influencing Carbon Prices in China. Soft Sci. 2021, 35, 123–130. [Google Scholar] [CrossRef]
  13. Guo, J.; Gu, F.; Liu, Y.; Liang, X.; Mo, J.; Fan, Y. Assessing the Impact of ETS Trading Profit on Emission Abatements Based on Firm-Level Transactions. Nat. Commun. 2020, 11, 2078. [Google Scholar] [CrossRef]
  14. Shi, B.; Li, N.; Gao, Q.; Li, G. Market Incentives, Carbon Quota Allocation and Carbon Emission Reduction: Evidence from China’s Carbon Trading Pilot Policy. J. Environ. Manag. 2022, 319, 115650. [Google Scholar] [CrossRef]
  15. Cao, J.; Ho, M.S.; Ma, R.; Teng, F. When Carbon Emission Trading Meets a Regulated Industry: Evidence from the Electricity Sector of China. J. Public Econ. 2021, 200, 104470. [Google Scholar] [CrossRef]
  16. Pan, M.; Wang, C. Research on the Corporate Emission Reduction Effect of the Carbon Emission Trading Pilot. Econ. Rev. J. 2022, 10, 73–81. [Google Scholar] [CrossRef]
  17. Hu, Y.; Ren, S.; Wang, Y.; Chen, X. Can Carbon Emission Trading Scheme Achieve Energy Conservation and Emission Reduction? Evidence from the Industrial Sector in China. Energy Econ. 2020, 85, 104590. [Google Scholar] [CrossRef]
  18. Wen, Y.; Hu, P.; Li, J.; Liu, Q.; Shi, L.; Ewing, J.; Ma, Z. Does China’s Carbon Emissions Trading Scheme Really Work? A Case Study of the Hubei Pilot. J. Clean. Prod. 2020, 277, 124151. [Google Scholar] [CrossRef]
  19. Lyu, J.; Cao, M.; Wu, K.; Li, H.; Mohi-ud-din, G. Price Volatility in the Carbon Market in China. J. Clean. Prod. 2020, 255, 120171. [Google Scholar] [CrossRef]
  20. Zhang, Y.; Zhang, J. Estimating the Impacts of Emissions Trading Scheme on Low-Carbon Development. J. Clean. Prod. 2019, 238, 117913. [Google Scholar] [CrossRef]
  21. Lin, B.; Huang, C. Analysis of Emission Reduction Effects of Carbon Trading: Market Mechanism or Government Intervention? Sustain. Prod. Consum. 2022, 33, 28–37. [Google Scholar] [CrossRef]
  22. Lin, B.; Jia, Z. Does the Different Sectoral Coverage Matter? An Analysis of China’s Carbon Trading Market. Energy Policy 2020, 137, 111164. [Google Scholar] [CrossRef]
  23. Perera, R.S. An Evolutionary Game Theory Strategy for Carbon Emission Reduction in the Electricity Market. Int. Game Theory Rev. 2018, 20, 1850008. [Google Scholar] [CrossRef]
  24. Feichtinger, G.; Lambertini, L.; Leitmann, G.; Wrzaczek, S. R&D for Green Technologies in a Dynamic Oligopoly: Schumpeter, Arrow and Inverted-U’s. Eur. J. Oper. Res. 2016, 249, 1131–1138. [Google Scholar] [CrossRef] [Green Version]
  25. Lu, M.; Fang, X. Game Analysison Carbon Market form Allocation of Allowance. Chin. J. Manag. Sci. 2015, 23, 807–811. [Google Scholar]
  26. Zhu, Q.; Wang, Y.; Tian, Y. Analysis of an Evolutionary Game between Local Governments and Manufacturing Enterprises under Carbon Reduction Policies Based on System Dynamics. Oper. Res. Manag. Sci. 2014, 23, 71–82. [Google Scholar]
  27. Huang, X.; Ling, N. A Differential Game Model of Government and Enterprise Emission Reduction Based on Emission Permits Trading and Subsidy for Emission Abatement. J. Syst. Manag. 2020, 29, 1150–1160. [Google Scholar]
  28. Jiao, J.; Chen, J.; Li, L.; Li, F. A Study of Local Governments’ and Enterprises’ Actions in the Carbon Emission Mechanism of Subsidy or Punishment Based on the Evolutionary Game. Chin. J. Manag. Sci. 2017, 25, 140–150. [Google Scholar] [CrossRef]
  29. Calel, R.; Dechezleprêtre, A. Environmental Policy and Directed Technological Change: Evidence from the European Carbon Market. Rev. Econ. Stat. 2016, 98, 173–191. [Google Scholar] [CrossRef] [Green Version]
  30. Zhu, Q. A Perspective of Evolution for Carbon Emissions Trading Market: The Dilemma between Market Scale and Government Regulation. Discret. Dyn. Nat. Soc. 2017, 2017, e1432052. [Google Scholar] [CrossRef] [Green Version]
  31. Liu, Y.; Zhang, X. Carbon Emissions Trading System and Corporate R&D Innovation—An Empirical Study Based on Triple Difference Model. Econ. Sci. 2017, 3, 102–114. [Google Scholar] [CrossRef]
  32. Yu, P.; Liu, J. Researchon the Effects of Carbon Trading Market Size on Environment and Economic Growth. China Soft Sci. 2020, 4, 46–55. [Google Scholar]
  33. Maynard Smith, J. The Theory of Games and the Evolution of Animal Conflicts. J. Theor. Biol. 1974, 47, 209–221. [Google Scholar] [CrossRef] [Green Version]
  34. Cui, N.; Li, J.; Tu, J.; Zhou, M. Evolutionary Game Analysis of Non-Governmental Organizations Participating in Garbage Management under the Background of Internet of Things. Sustainability 2022, 14, 13008. [Google Scholar] [CrossRef]
  35. Gao, Y.; Jia, R.; Yao, Y.; Xu, J. Evolutionary Game Theory and the Simulation of Green Building Development Based on Dynamic Government Subsidies. Sustainability 2022, 14, 7294. [Google Scholar] [CrossRef]
  36. Zhao, D.; Hao, J.; Cao, C.; Han, H. Evolutionary Game Analysis of Three-Player for Low-Carbon Production Capacity Sharing. Sustainability 2019, 11, 2996. [Google Scholar] [CrossRef] [Green Version]
  37. Liu, L.; Wang, Z.; Li, X.; Liu, Y.; Zhang, Z. An Evolutionary Analysis of Low-Carbon Technology Investment Strategies Based on the Manufacturer-Supplier Matching Game under Government Regulations. Environ. Sci. Pollut. Res. 2022, 29, 44597–44617. [Google Scholar] [CrossRef]
  38. Zhao, X.; Zhang, Y. The System Dynamics (SD) Analysis of the Government and Power Producers’ Evolutionary Game Strategies Based on Carbon Trading (CT) Mechanism: A Case of China. Sustainability 2018, 10, 1150. [Google Scholar] [CrossRef] [Green Version]
  39. Chen, Z.; Wang, T. Photovoltaic Subsidy Withdrawal: An Evolutionary Game Analysis of the Impact on Chinese Stakeholders’ Strategic Choices. Sol. Energy 2022, 241, 302–314. [Google Scholar] [CrossRef]
  40. Zhang, J.; Wen, S.; Li, H.; Lü, X. Evolutionary Game Analysis of Supply Chain Operations Decision under the Background of Low-carbon Economy—Based on the Perspective of Government-Enterprise-Consumer Synergy. Oper. Res. Manag. Sci. 2022, 1–9. Available online: https://lib.swust.edu.cn/asset/detail/0/2031145452865 (accessed on 27 April 2023).
  41. Fan, R.; Wu, T.; Fan, W. Research on Tripartite Governance Evolutionary Game Model and Environmental Governance Strategy Under Environment Tax and Regulation Capture. Soft Sci. 2022, 36, 122–130. [Google Scholar] [CrossRef]
  42. Chen, L.; Wang, C.; Li, S.; Li, X.; Cao, D. Research on Multi-agent Evolution Game of Construction Safety Management Based on Prospect Theory. J. Saf. Environ. 2022, 1–11. [Google Scholar] [CrossRef]
  43. Shen, J.; Gao, X.; He, W.; Sun, F.; Zhang, Z.; Kong, Y.; Wan, Z.; Zhang, X.; Li, Z.; Wang, J.; et al. Prospect Theory in an Evolutionary Game: Construction of Watershed Ecological Compensation System in Taihu Lake Basin. J. Clean. Prod. 2021, 291, 125929. [Google Scholar] [CrossRef]
  44. Sun, H.; Gao, G.; Li, Z. Evolutionary Game Analysis of Enterprise Carbon Emission Regulation Based on Prospect Theory. Soft Comput. 2022, 26, 13357–13368. [Google Scholar] [CrossRef]
  45. Uchida, S.; Yamamoto, H.; Okada, I.; Sasaki, T. Evolution of Cooperation with Peer Punishment under Prospect Theory. Games 2019, 10, 11. [Google Scholar] [CrossRef] [Green Version]
  46. Yang, G.; Chen, J. Research on Enterprise Radical Technology Innovation Behavior—Evolutionary Game Analysis Based on Prospect Theory. J. Ind. Technol. Econ. 2020, 39, 57–64. [Google Scholar]
  47. Liu, M.; Li, Z.; Zhang, J. Evolutionary Game Analysis on Low-carbon Strategies of Government and Business Based on the View of Prospect Theory. Sci. Technol. Manag. Res. 2017, 37, 245–253. [Google Scholar]
  48. Fang, G.; He, Y.; Tian, L. Evolutionary game analysis of government and enterprises carbon-reduction under the driven of carbon trading. Chin. J. Manag. Sci. 2021, 1–12. [Google Scholar] [CrossRef]
  49. Cao, Y.; Kang, Z.; Bai, J.; Cui, Y.; Chang, I.-S.; Wu, J. How to Build an Efficient Blue Carbon Trading Market in China?—A Study Based on Evolutionary Game Theory. J. Clean. Prod. 2022, 367, 132867. [Google Scholar] [CrossRef]
  50. Wang, Y.; Guo, T.; Cheng, T.C.E.; Wang, N. Evolution of Blue Carbon Trading of China’s Marine Ranching under the Blue Carbon Special Subsidy Mechanism. Ocean Coast. Manag. 2022, 222, 106123. [Google Scholar] [CrossRef]
  51. Ritzberger, K.; Weibull, J. Evolutionary Selection in Normal-Form Games on JSTOR. Available online: https://www.jstor.org/stable/2171774 (accessed on 27 April 2023).
  52. Shen, M.; He, Z. The Experience of Foreign Fiscal Policy on Low-Carbon Economy. Ecol. Econ. 2011, 3, 83–89. [Google Scholar]
  53. Li, S.; Cai, J.; Feng, Z.; Xu, Y.; Cai, H. Government Contracting with Monopoly in Infrastructure Provision: Regulation or Deregulation? Transp. Res. Part E Logist. Transp. Rev. 2019, 122, 506–523. [Google Scholar] [CrossRef]
  54. Tversky, A.; Kahneman, D. Advances in Prospect Theory: Cumulative Representation of Uncertainty. J. Risk Uncertain. 1992, 5, 297–323. [Google Scholar] [CrossRef]
  55. Zhang, Y.; Fan, R.; Luo, M.; Sun, J. The Evolution of Short-sighted Behavior of Enterprise Technological Innovation: Analysis based on Prospect Theory. J. Tech. Econ. Manag. 2022, 6, 58–63. [Google Scholar]
Figure 1. The game relationship between the three parties involved.
Sustainability 15 10807 g001
Figure 2. Government replication of dynamic phase diagrams.
Sustainability 15 10807 g002
Figure 3. Emission reduction enterprise replication of dynamic phase diagrams.
Sustainability 15 10807 g003
Figure 4. Emission control enterprise replication of dynamic phase diagrams.
Sustainability 15 10807 g004
Figure 5. ESS dynamic evolutionary process.
Sustainability 15 10807 g005
Figure 6. The initial state between the tripartite in the game.
Sustainability 15 10807 g006
Figure 7. Effect of input cost on evolution results. (a) Change in government strategy choice, (b) change in strategy choice of emission control enterprises.
Sustainability 15 10807 g007
Figure 8. Effect of the reward and punishment mechanism on evolution results. (a) Change in government strategy choice, (b) change in government strategy choice, and (c) change in strategy choice of emission control enterprises.
Sustainability 15 10807 g008
Figure 9. Effect of the carbon price and initial carbon quota on evolution results. (a) Change in government strategy choice, (b) change in government strategy choice, (c) change in strategy choice of emission control enterprises, and (d) change in strategy choice of emission control enterprises.
Sustainability 15 10807 g009
Figure 10. The evolution process of ESS after parameter optimization.
Sustainability 15 10807 g010
Figure 11. Three-party strategy selection after parameter optimization.
Sustainability 15 10807 g011
Figure 12. Effect of initial willingness on the optimal ESS evolution. (a) α = 0.88, λ = 2.25, (b) x = y = z = 0.1 , (c) x = y = z = 0.2 , (d) x = y = z = 0.4 , (e) x = y = z = 0.6 , and (f) x = y = z = 0.8 .
Sustainability 15 10807 g012
Figure 13. Effect of risk sensitivity coefficients on evolution results. (a) α = 0.4, λ = 2.25, (b) α = 0.8, λ = 2.25, and (c) α = 0.95, λ = 2.25.
Sustainability 15 10807 g013
Figure 14. Effect of loss avoidance coefficients on evolution results. (a) α = 0.88, λ = 0.25, (b) α = 0.88, λ = 1.25, and (c) α = 0.88, λ = 2.5.
Sustainability 15 10807 g014
Table 1. Payoff matrix for tripartite players.
Strategy MatrixGovernment
Regulate Non-Regulate
emission reduction enterprisessell R 1 + R 2 + θ P ( Q + Q 1 Q 0 ) C 1 β Q ε ( Q 1 Q 0 ) E s 1 + β Q + P Q C s 1 C s 2 E d 1 + R d + ε ( Q 1 Q 0 ) P ( Q 1 Q 0 ) C d 1 C d 2 R 3 C 2 E s 1 + P Q C s 1 C s 2 E d 1 + R d P ( Q 1 Q 0 ) C d 1 C d 2 purchase emission control enterprises
R 1 + R 2 + θ P Q + η ( Q 1 Q 0 ) C 1 ε ( Q 1 Q 0 ) E s 1 + β Q + P Q C s 1 C s 2 E d 2 η ( Q 1 Q 0 ) R 3 C 2 E s 1 + P Q C s 1 C s 2 E d 2 Non-purchase
Non-sell R 1 + R 2 + θ P ( Q 1 Q 0 ) C 1 ε ( Q 1 Q 0 ) E s 2 C s 3 E d 1 + R d + ε ( Q 1 Q 0 ) P ( Q 1 Q 0 ) C d 1 C d 2 R 3 C 2 E s 2 C s 3 E d 1 + R d P ( Q 1 Q 0 ) C d 1 C d 2 purchase
R 1 + η ( Q 1 Q 0 ) + T s + T d C 1 ε ( Q 1 Q 0 ) E s 2 C s 3 T s E d 2 η ( Q 1 Q 0 ) T d R 3 C 2 E s 2 C s 3 E d 2 Non-purchase
Table 2. Eigenvalue matrix of the equilibrium points.
Equilibrium Point Eigenvalue   σ 1 Eigenvalue   σ 2 Eigenvalue   σ 3
( 1 , 1 , 1 ) C 1 C 2 R 1 R 2 + R 3 + β Q + ε ( Q 1 Q 0 ) + θ P ( Q 0 Q 1 Q ) C s 1 + C s 2 C s 3 E s 1 + E s 2 P Q β Q C d 1 + C d 2 E d 1 + E d 2 + P ( Q 1 Q 0 ) + η ( Q 0 Q 1 ) + ε ( Q 0 Q 1 ) R d
( 1 , 1 , 0 ) C 1 C 2 R 1 R 2 + R 3 θ P Q + η ( Q 0 Q 1 ) + ε ( Q 1 Q 0 ) C s 1 + C s 2 C s 3 E s 1 + E s 2 T s P Q β Q E d 1 C d 1 C d 2 E d 2 + P ( Q 0 Q 1 ) + η ( Q 1 Q 0 ) + ε ( Q 1 Q 0 ) + R d
( 1 , 0 , 1 ) C 1 C 2 R 1 R 2 + R 3 + ε ( Q 1 Q 0 ) + θ P ( Q 0 Q 1 ) C s 3 C s 1 C s 2 + E s 1 E s 2 + P Q + β Q C d 1 + C d 2 E d 1 + E d 2 + P ( Q 1 Q 0 ) + η ( Q 0 Q 1 ) + ε ( Q 0 Q 1 ) R d T d
( 1 , 0 , 0 ) C 1 C 2 R 1 + R 3 T s T d + ε ( Q 1 Q 0 ) + η ( Q 0 Q 1 ) C s 3 C s 1 C s 2 + E s 1 E s 2 + T s + P Q + β Q E d 1 C d 1 C d 2 E d 2 + P ( Q 0 Q 1 ) + η ( Q 1 Q 0 ) + ε ( Q 1 Q 0 ) + R d + T d
( 0 , 1 , 1 ) C 1 C 2 R 1 + R 3 T s T d β Q + ε ( Q 1 Q 0 ) + θ ( Q + Q 0 Q 1 ) C s 1 + C s 2 C s 3 E s 1 + E s 2 P Q C d 1 + C d 2 E d 1 + E d 2 + P ( Q 1 Q 0 ) R d
( 0 , 1 , 0 ) C 2 C 1 + R 1 + R 2 R 3 + θ P Q + ε ( Q 0 Q 1 ) + η ( Q 1 Q 0 ) C s 2 + C s 1 C s 3 E s 1 + E s 2 P Q E d 1 C d 1 C d 2 E d 2 + P ( Q 0 Q 1 ) + R d
( 0 , 0 , 1 ) C 2 C 1 + R 1 + R 2 R 3 + ε ( Q 0 Q 1 ) + θ P ( Q 1 Q 0 ) C s 3 C s 1 C s 2 + E s 1 E s 2 + P Q C d 1 + C d 2 E d 1 + E d 2 + P ( Q 1 Q 0 ) R d
( 0 , 0 , 0 ) C 2 C 1 + R 1 R 3 + T s + T d + η ( Q 1 Q 0 ) + ε ( Q 0 Q 1 ) C s 3 C s 1 C s 2 + E s 1 E s 2 + P Q E d 1 C d 1 C d 2 E d 2 + P ( Q 0 Q 1 ) + R d
Table 3. The specific assignment of parameters.
ParametersValuesParametersValuesParametersValues
R 1 1600 C s 1 1250 Q 0 23
C 1 1000 C s 2 20 ε 75
θ 0.2 β 125 E d 1 2000
R 2 200 P 50 C d 1 1000
T s 150 Q 5 C d 2 20
T d 100 E s 2 1000 η 100
R 3 800 C s 3 400 E d 2 1000
C 2 500 R d 100
E s 1 2000 Q 1 28
Table 4. Specific assignment after parameter optimization.
ParametersValuesParametersValuesParametersValues
R 1 1600 C s 1 1250 Q 0 23
C 1 800 C s 2 20 ε 70
θ 0.2 β 80 E d 1 2000
R 2 200 P 50 C d 1 900
T s 150 Q 5 C d 2 20
T d 100 E s 2 1000 η 100
R 3 800 C s 3 400 E d 2 1000
C 2 500 R d 100
E s 1 2000 Q 1 28
Disclaimer/Publisher’s Note: The statements, opinions and data contained in all publications are solely those of the individual author(s) and contributor(s) and not of MDPI and/or the editor(s). MDPI and/or the editor(s) disclaim responsibility for any injury to people or property resulting from any ideas, methods, instructions or products referred to in the content.

