Article

A Comparative Study of Optimal Individual Pitch Control Methods

1
School of Electronic and Electrical Engineering, Kyungpook National University, Daegu 41566, Republic of Korea
2
Electric Machine and Drives Research Center, Korea Electrotechnology Research Institute (KERI), Changwon 51543, Republic of Korea
*
Authors to whom correspondence should be addressed.
Sustainability 2023, 15(14), 10933; https://doi.org/10.3390/su151410933
Submission received: 26 May 2023 / Revised: 22 June 2023 / Accepted: 10 July 2023 / Published: 12 July 2023
(This article belongs to the Special Issue Renewable Energy Technologies and Energy Efficient Utilization)

Abstract

:
Wind turbines are subjected to asymmetric loads and fatigue with subsequent increases in their dimension and capacity, leading to a reduction in their lifetime. To address this problem, the individual pitch control (IPC) technique is quite familiar in the control of wind turbines. IPC is used to reduce the tilt and yaw moments, simultaneously alleviating the turbine blade-root bending moments (BRBMs). This study discusses the performance of model predictive control (MPC), H-infinity ( H ), and proportional and integral (PI)-based IPC strategies integrated with collective pitch control. The performance of the reported controllers has been validated using the National Renewable Energy Laboratory (NREL) 5 MW full nonlinear reference wind turbine. Simulation studies are conducted at varying wind speeds and turbulent intensities as per international electrotechnical commission (IEC) norms. Comparative results in the time and frequency domains indicate that the  H  based IPC achieves enhanced control performance in terms of reduction in BRBMs and damage equivalent load compared to MPC and PI-based control strategies.

1. Introduction

Wind energy-based power generation has been an emerging sustainable energy resource in recent decades due to the gradual depletion of fossil fuels. According to a 2021 statistical publication [1], installations producing wind energy >750 GW have been installed worldwide. To improve competitiveness, it is crucial to reduce operation and maintenance costs and minimize the levelized cost of energy. Nowadays, the size of wind turbines is significantly increasing to capture more power from wind [2]. However, large-size wind turbines are more susceptible to asymmetric loadings such as yaw misalignment, wind shear, and the turbulent nature of the atmosphere. These forces result in unstable mechanical loads on the blade roots, leading to unstable tilt and yaw loads [2,3]. Such loads can cause fatigue damage and reduce the turbine’s lifetime if not considered in designing a suitable wind turbine design control system [4,5].
Collective pitch control (CPC), although a widely accepted technique for regulating turbine speed [5,6], fails to attenuate unsteady and nonuniform loads. Hence, individual pitch control (IPC) is considered one of the popular control techniques for load alleviation of wind turbines. IPC allows for separate control of each blade, complementing the limitations of CPC by addressing load asymmetries. This approach reduces fatigue and structural loads, resulting in lower turbine costs, reduced maintenance, and increased lifespan [7,8]. This study investigates several IPC techniques and their applications in a 3-bladed horizontal axis wind turbine.
The popular existing IPC studies employ a coordinate transformation technique called the Coleman Transformation or multi-blade coordinate transformation (MBC) [8,9]. It is mainly based on projecting the rotating blade loads to non-rotating coordinates, which produce orthogonal tilt and yaw moments. An approach to transforming the blade root bending moment (BRBM) in rotating frames to tilt-yaw components in non-rotating structures using MBC is given in [10,11,12]. Then, the tilt-yaw components obtained through MBC can be minimized by using separate controllers. From the perspective of control design, MBC is attractive because it transforms a time-varying system into a time-invariant one. Single-input and single-output controllers (SISO) are used to realize the IPC in wind turbines [11].
Regarding the control structure, the MBC has the substantial advantage of allowing the IPC to be decoupled from the CPC loop [13,14]. This makes it possible to use simple linear SISO control approaches for IPC, such as PI controllers [15,16]. After applying MBC, it is generally assumed that the tilt and yaw dynamics are decoupled.; however, in [13] and [14], the dynamic tilt-yaw coupling is shown to exist, heavily influenced by the rotor speed. Subsequently, this inspires the study of multi-variable control methods.
The majority of multi-variable IPCs have been focused on the use of optimal control methods such as linear quadratic regulator (LQR) [17] and linear quadratic Gaussian (LQG) [13,18,19]. The requirements for designing IPCs are characteristically quantified in the frequency domain for load reductions at specific frequencies. Targeting such frequencies is difficult for LQR/LQG control, whose performances are classically specified in the time domain. Also, LQG controllers give no guarantee for stability margins [20], thus making it difficult to evaluate the robustness in control problem applications having inherent uncertainty. This motivates the necessity of robust control architecture.
Among the several multi-variable robust control design methods, H-infinity ( H )  loop-shaping appears well-suited for designing IPCs [21]. This approach operates in the frequency domain by directly adjusting the system’s frequency response. Thus, the need for a robust and multi-variable control method in which design norms can be specified in the frequency domain suggests using the    H  loop-shaping technique [22,23,24] to design IPCs. A single controller can be considered to reduce multiple loads for a range of frequencies concurrently. In the loop-shaping method, a standard uncertainty model is used that accounts for parametric and dynamic uncertainty, and the controllers are synthesized to maximize the degree of uncertainty that the closed-loop system can sustain, providing robustness [3,25]. However, in LQG, how the disturbances influence the system must be a priori provided. Also, robustness is defined by a stability margin, and it provides a reliable pointer for performance and stability in IPC [3]. These controllers have various applications in flight control [26], combustion oscillations [27], and drag reduction [28]. Furthermore, a robust stability margin concisely captures the degree of robustness, serving as a reliable indicator of IPC stability and performance.
Subsequently, other advanced optimal controllers, like model predictive controllers (MPCs), have also been employed for IPC design [29,30,31,32]. The pitch activity increases significantly as a side effect of IPC; hence MPC based IPC controller is employed to maintain smooth pitch activity due to its inherent ability to include prediction and constraint handling. Also, the MPC application in IPC shows the capacity to reduce rotating blade loads, fixed rotor loads, and drive train loads [29,31]. As modern wind-turbine-control systems impose high demands on turbine actuators, limitations on actuators and system constraints must be considered. This is particularly relevant for IPC—a promising method for reducing structural loads that may increase actuator activity [10,33]. Hence, IPC implementation using MPC with proper constraints handling can be considered for better load alleviation.
The main contribution of this study is not the introduction of a new control algorithm strategy but to apply of existing optimal control algorithms, specifically MPC and  H , for load reduction in a wind turbine and subsequently make a comparison of their performances in time and frequency domain in terms of BRBMs and damage equivalent load (DEL) analysis. To validate the performance of the controllers, a full nonlinear 5 MW wind turbine simulation model in the FAST (fatigue, aerodynamics, structures, and turbulence) simulation package developed by the National Renewable Energy Laboratory (NREL) is used [34,35]. FAST is widely recognized as a high-fidelity aeroelastic turbine simulation platform in the field of wind turbine control [35]. Results are captured at varying wind speeds with different turbulence intensities in time and frequency domains, demonstrating that  H -based IPC control strategy outperforms proportional and integral (PI) and MPC-based IPC in reducing the BRBMs and DEL. Furthermore, controllers are compared with industry-standard PI controllers to showcase their effectiveness. The improvement (reduction in BRBMs and DEL) is attained, keeping their power fluctuation within the acceptable range.
The organization of the paper is as follows: The full nonlinear model of the NREL 5 MW wind turbine is briefly described in Section 2. Section 3 discusses IPC, the design of  H , and MPC. Section 4 presents the comprehensive simulation results. Conclusions and outlines of the future work are discussed in Section 5.

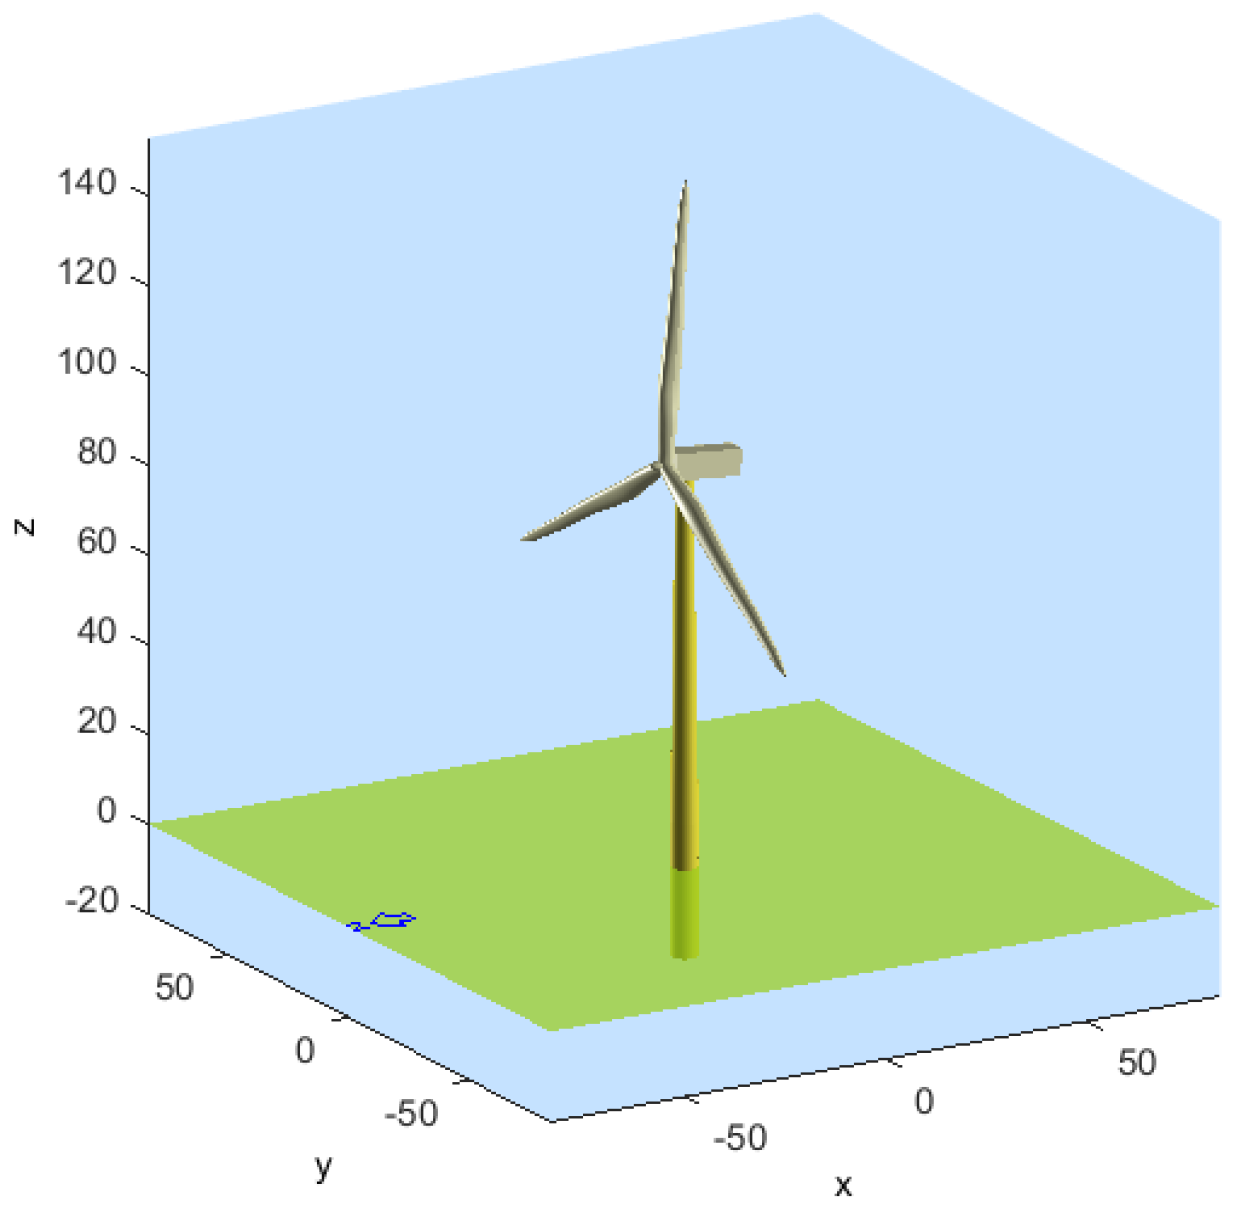
2. Full Nonlinear Wind Turbine Model

All simulations are carried out on an NREL 5 MW full nonlinear high-fidelity reference wind turbine with 24 degrees of freedom available for simulation and validation in FAST interfaced with Matlab/SIMULINK [35]. The specifications of the turbine are given in Table 1, and a generic representation of the turbine is shown in Figure 1.
The turbine controller can be operated by pitch and torque control strategies. In the above-rated wind condition, pitch control is mainly used with torque kept at the rated value. To keep the output power at rated values, the pitch angles of the three blades are controlled simultaneously in the case of CPC and distinctly for IPC. Figure 2 represents the overall IPC control scheme.

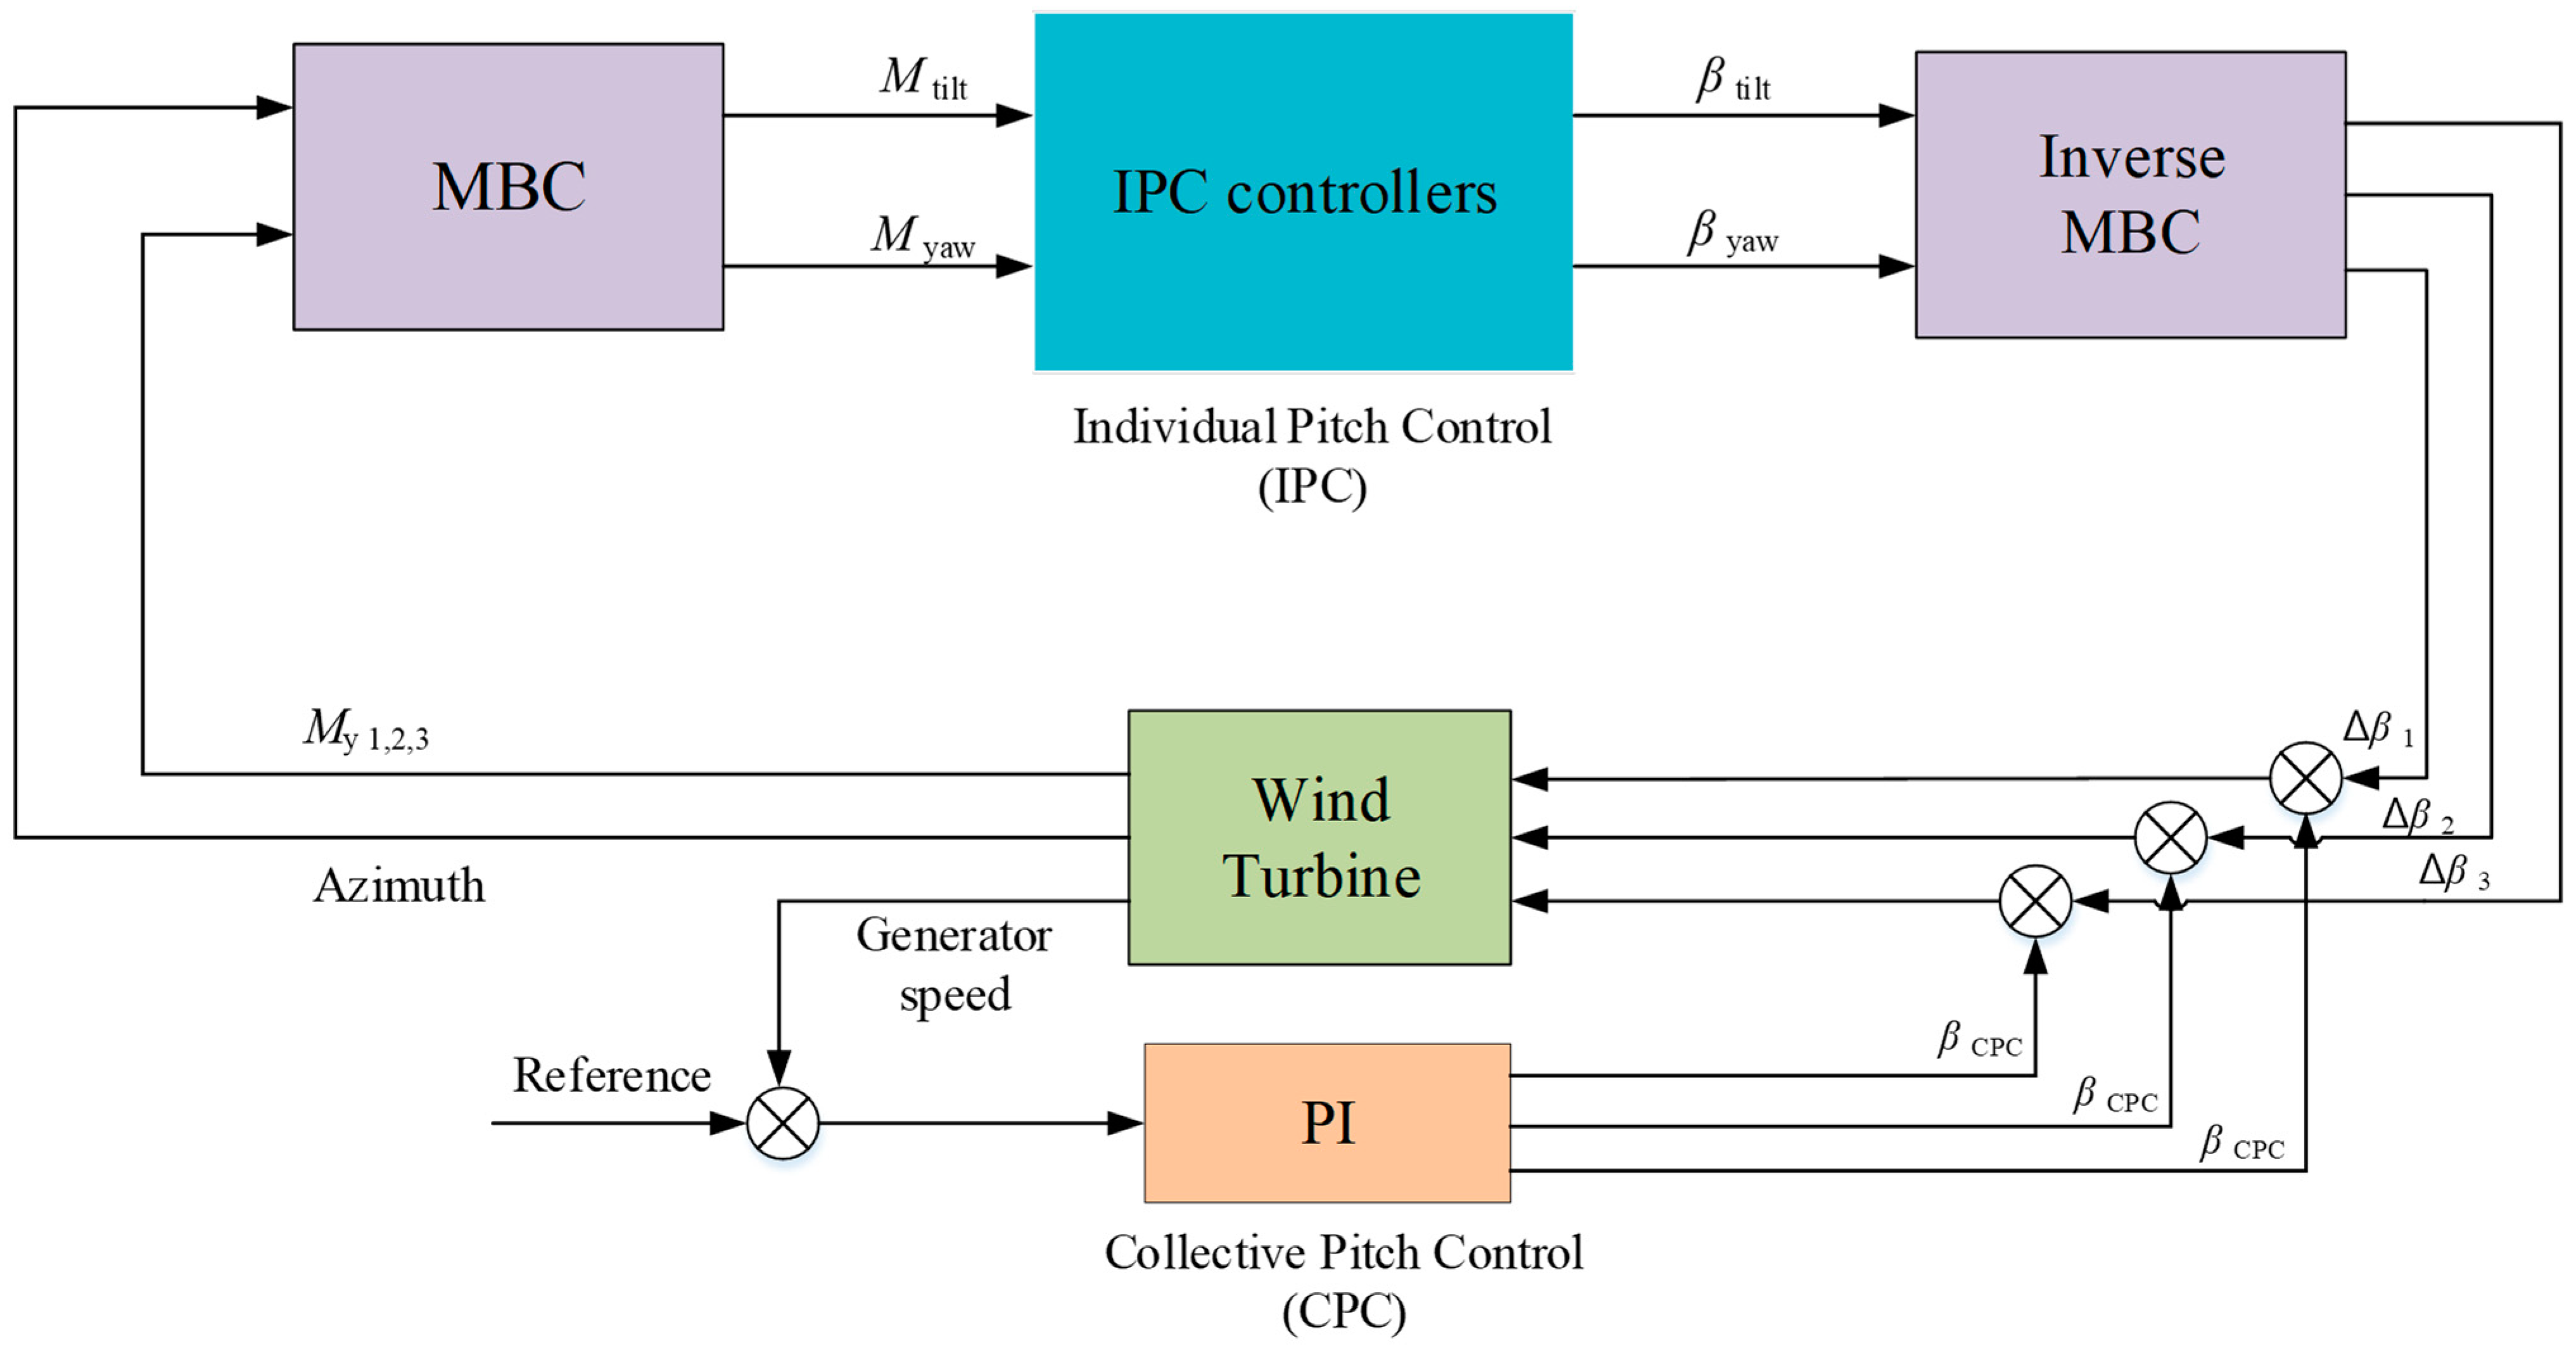
3. Individual Pitch Control

Active pitch control of blades is adopted for aerodynamic load reduction, apart from their primary purpose of rotor speed regulation. This method, addressed as IPC, mainly involves adjusting the blades at different pitch angles such that asymmetric loads on the turbine caused by several factors like wind shear, yaw misdirection, and turbulent wind conditions can be brought to a minimum. These asymmetric loads are directly related to the periodic revolution of blades and manifest as fluctuations in the BRBMs at  n P  frequencies (where n is the frequency of revolution of blades, carrying values 1, 2, 3…etc.). IPC in wind turbines is commonly implemented using the concept of transformation of reference frames, in which the blade loads considered in the rotational reference frame are converted to the stationary reference frame using a matrix operation requiring only the azimuth angle,  θ . This operation, described as the MBC or the Coleman transform, is represented by Equation (1).
M t i l t M y a w = 2 3 cos ( θ ) cos ( θ + 2 3 π ) cos ( θ + 4 3 π ) sin ( θ ) sin ( θ + 2 3 π ) sin ( θ + 4 3 π ) × M 1 M 2 M 3
where  M 1 ,     M 2 ,  and  M 3  are the BRBMs experienced by blades 1, 2, and 3, respectively, in the rotating reference frame, which are transformed to the turbine’s orthogonal tilt and yaw axes, represented as  M t i l t  and  M y a w , respectively.  M t i l t  and  M y a w  are then passed through the IPC controller to yield the referred pitch values  β tilt  and  β yaw , respectively.
These signals are then again transformed to the rotating reference frame using the inverse Coleman transform given in Equation (2).
Δ β 1 Δ β 2 Δ β 3 = 2 3 sin ( θ ) cos ( θ ) sin ( θ + 2 3 π ) cos ( θ + 2 3 π ) sin ( θ + 4 3 π ) cos ( θ + 4 3 π ) × β t i l t β y a w
where  Δ β 1 , Δ β 2 ,   and   Δ β 3  are perturbations in the pitch angles of blades  1 ,   2 ,  and  3 , respectively. The collective pitch controller, operating as a separate loop structure, calculates the average pitch angle required for rotor speed regulation. The perturbations determined by the IPC control loop are then added to the collective pitch value, resulting in the final pitch angles of the three blades. The IPC controllers used here are PI,  H -based loop shaping, and MPC. In the PI control scheme, PI values are applied to the  M t i l t  and  M y a w  variables to obtain the corresponding pitch values,  β t i l t  and  β y a w , respectively. The proportional gain ( K p ) and integral gain ( K i ) values are set at 1  ×   10 9  and 1  ×   10 8 , respectively, for both tilt and yaw paths to yield satisfactory gain and phase margins of the open-loop system using classical design techniques based on bode-plot analysis [3]. For the other controllers, i.e.,  H  loop-shaping, and MPC, linearized IPC control model is constructed, the details of which are given in the following subsections.

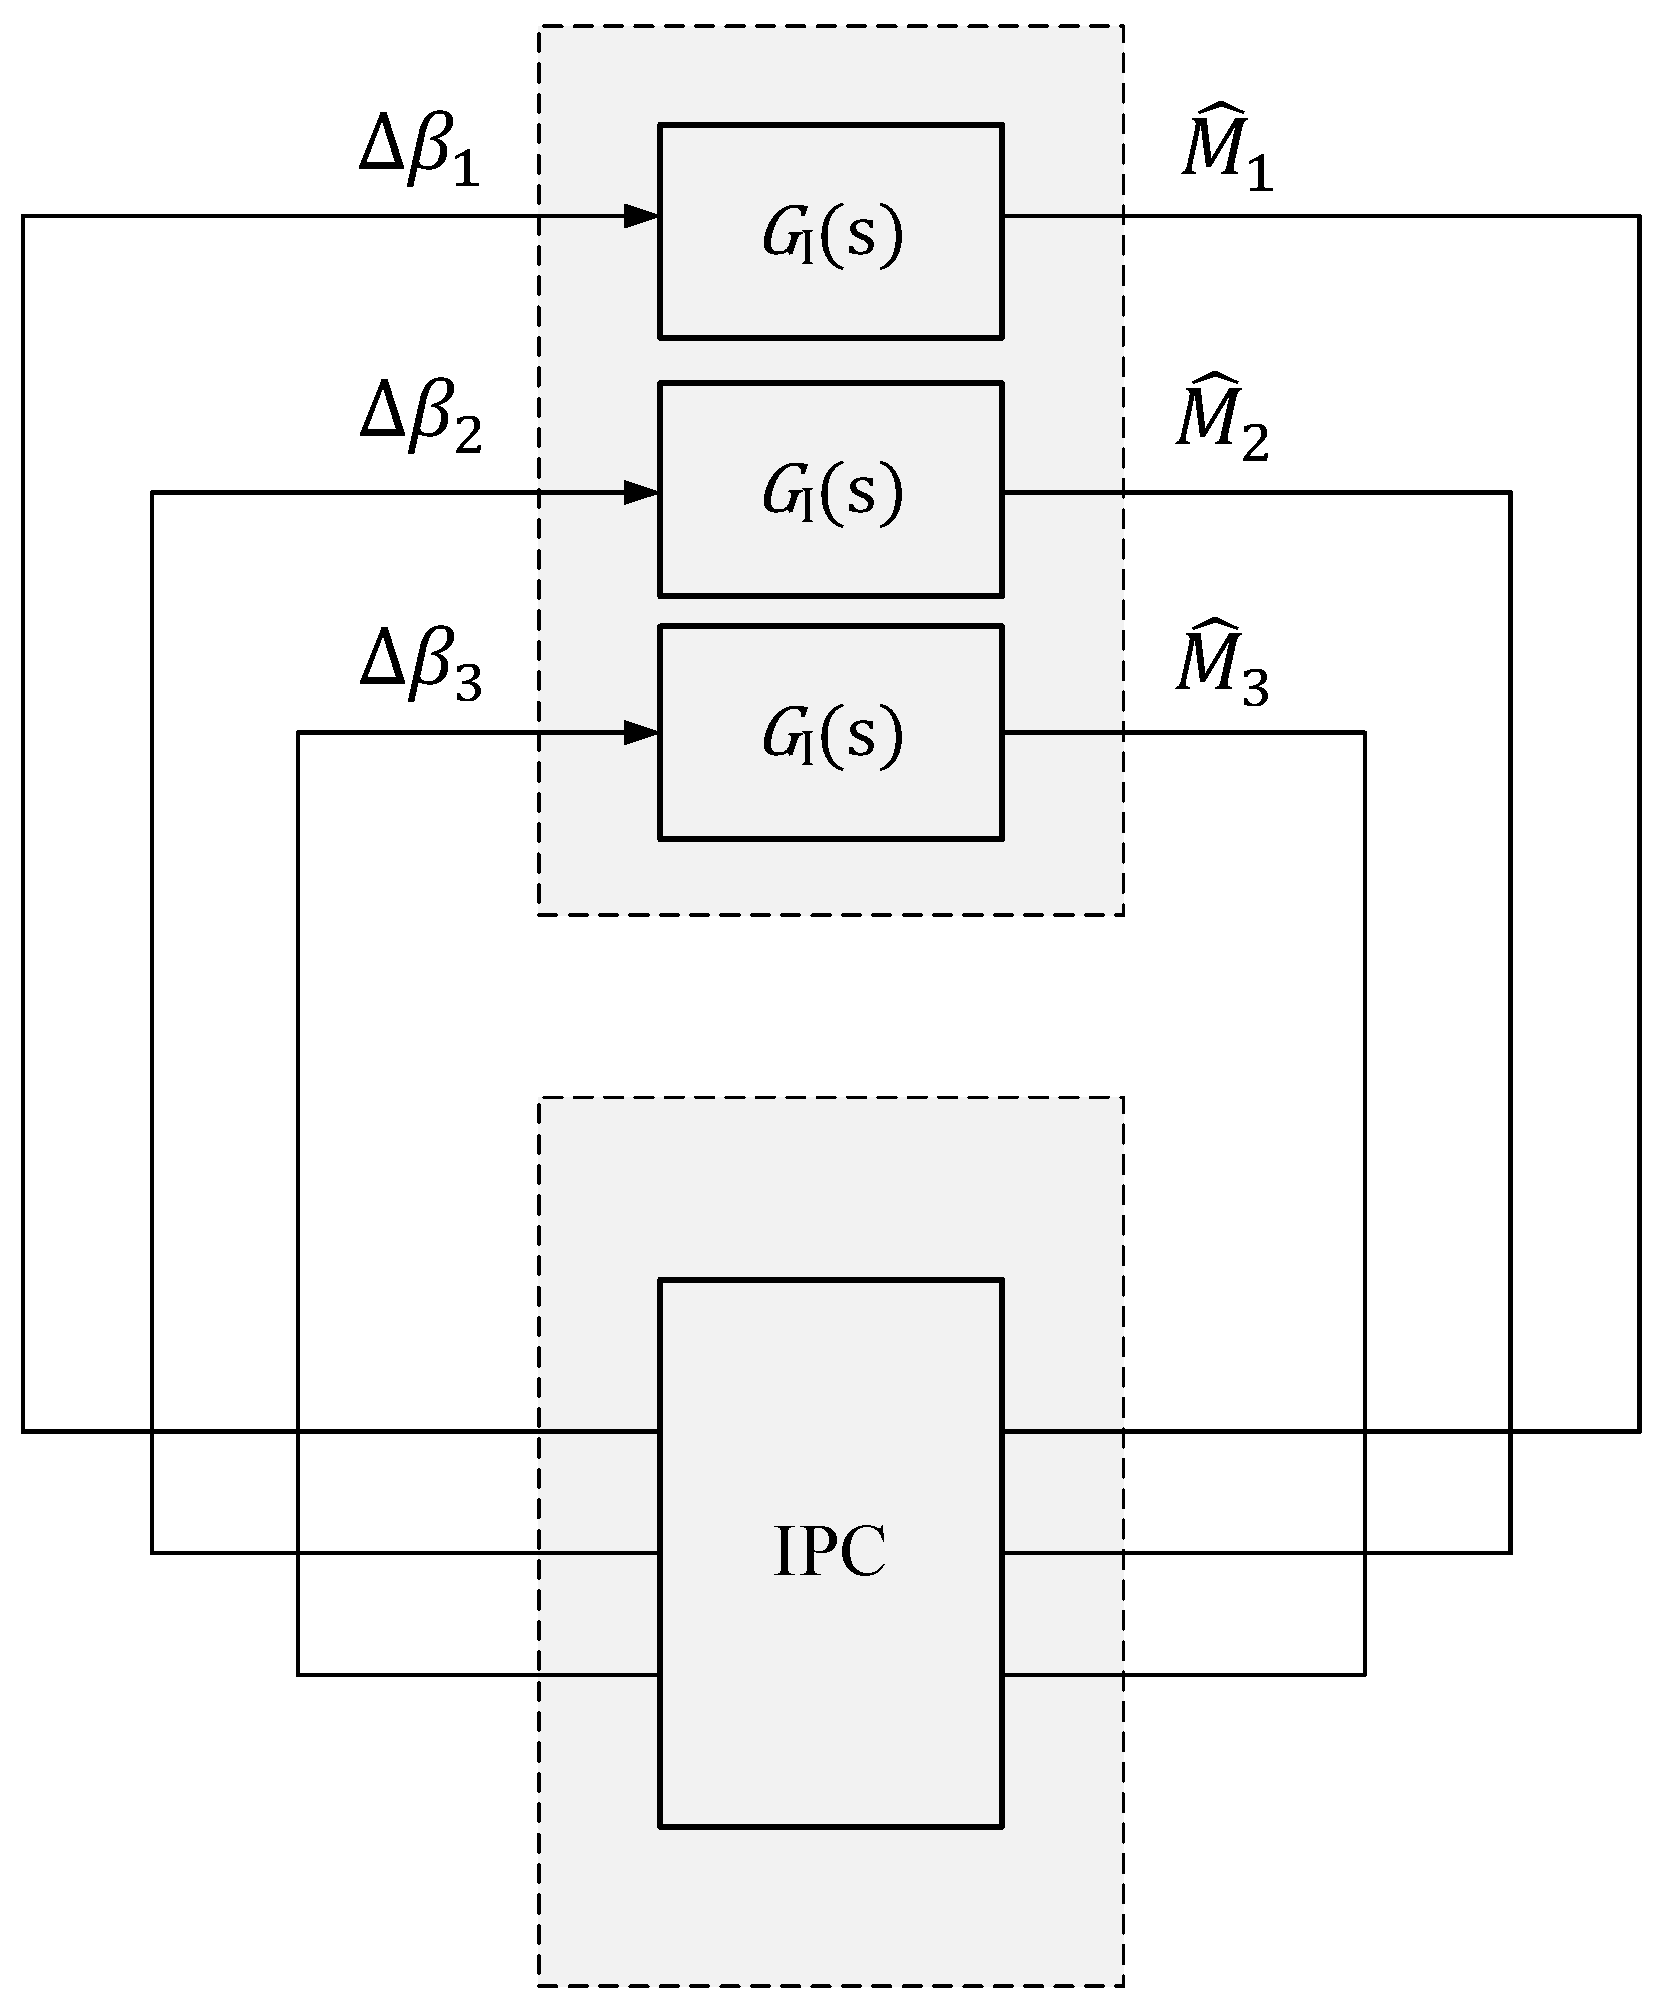
3.1. IPC Control Design Model
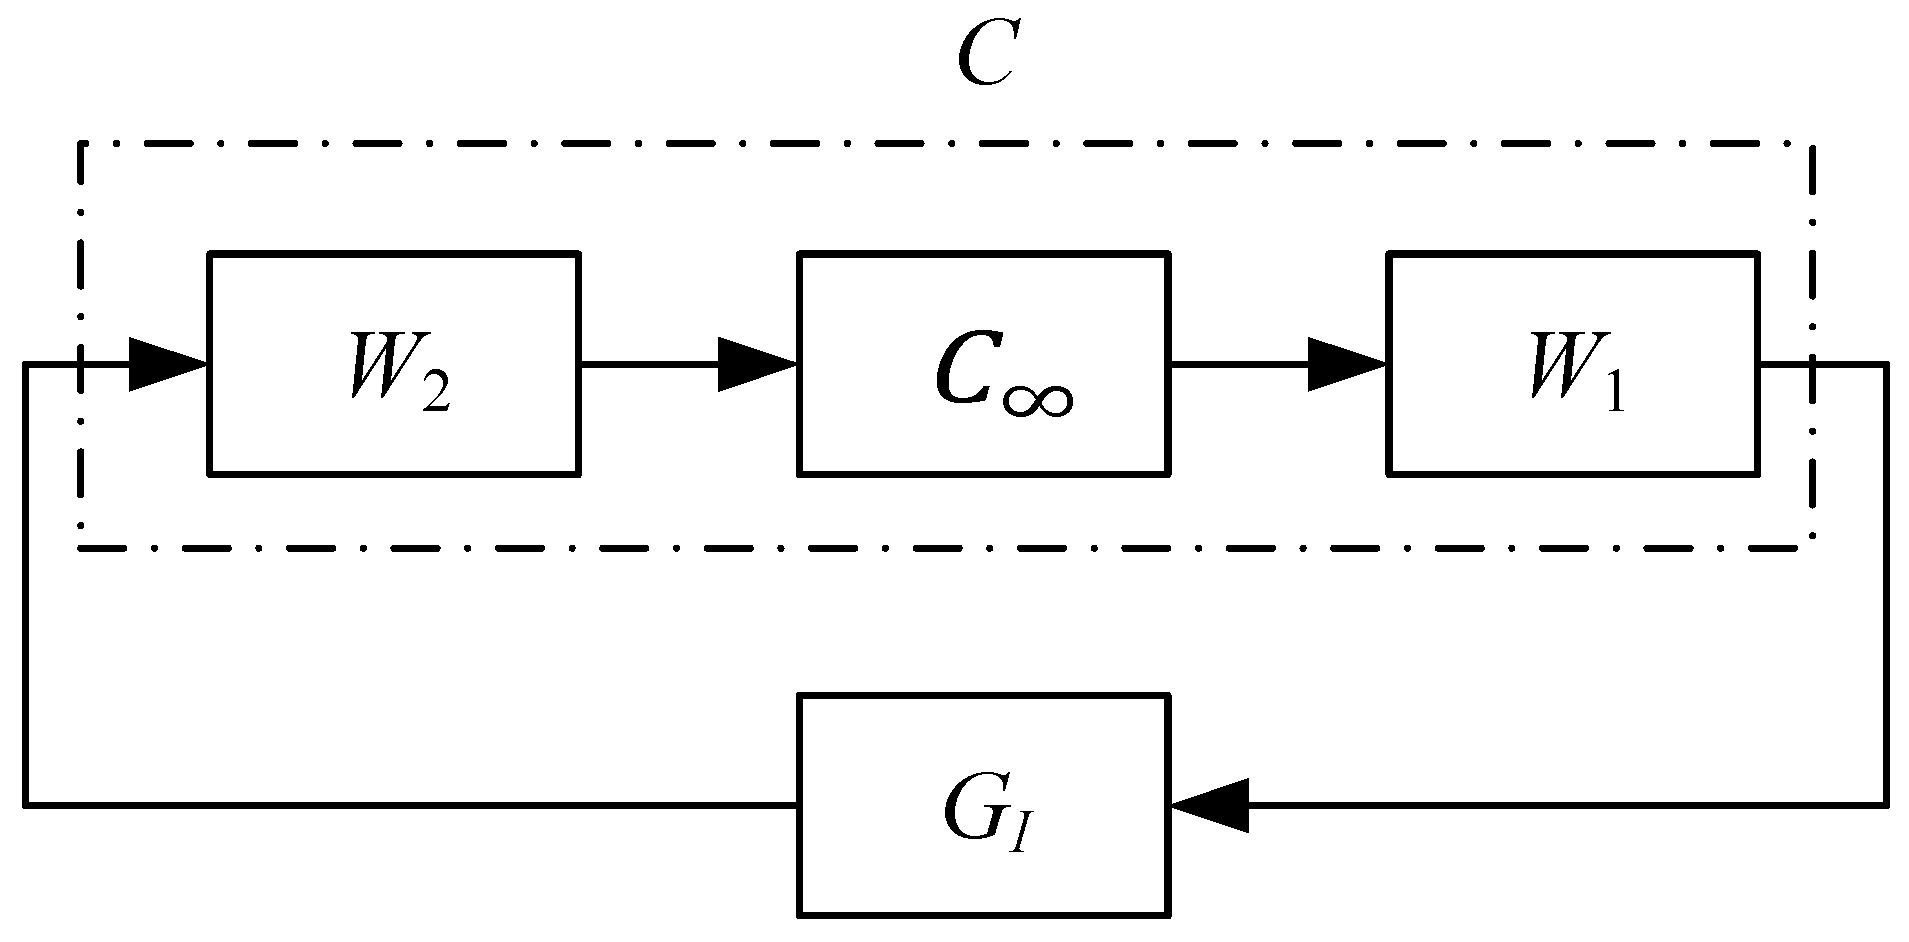
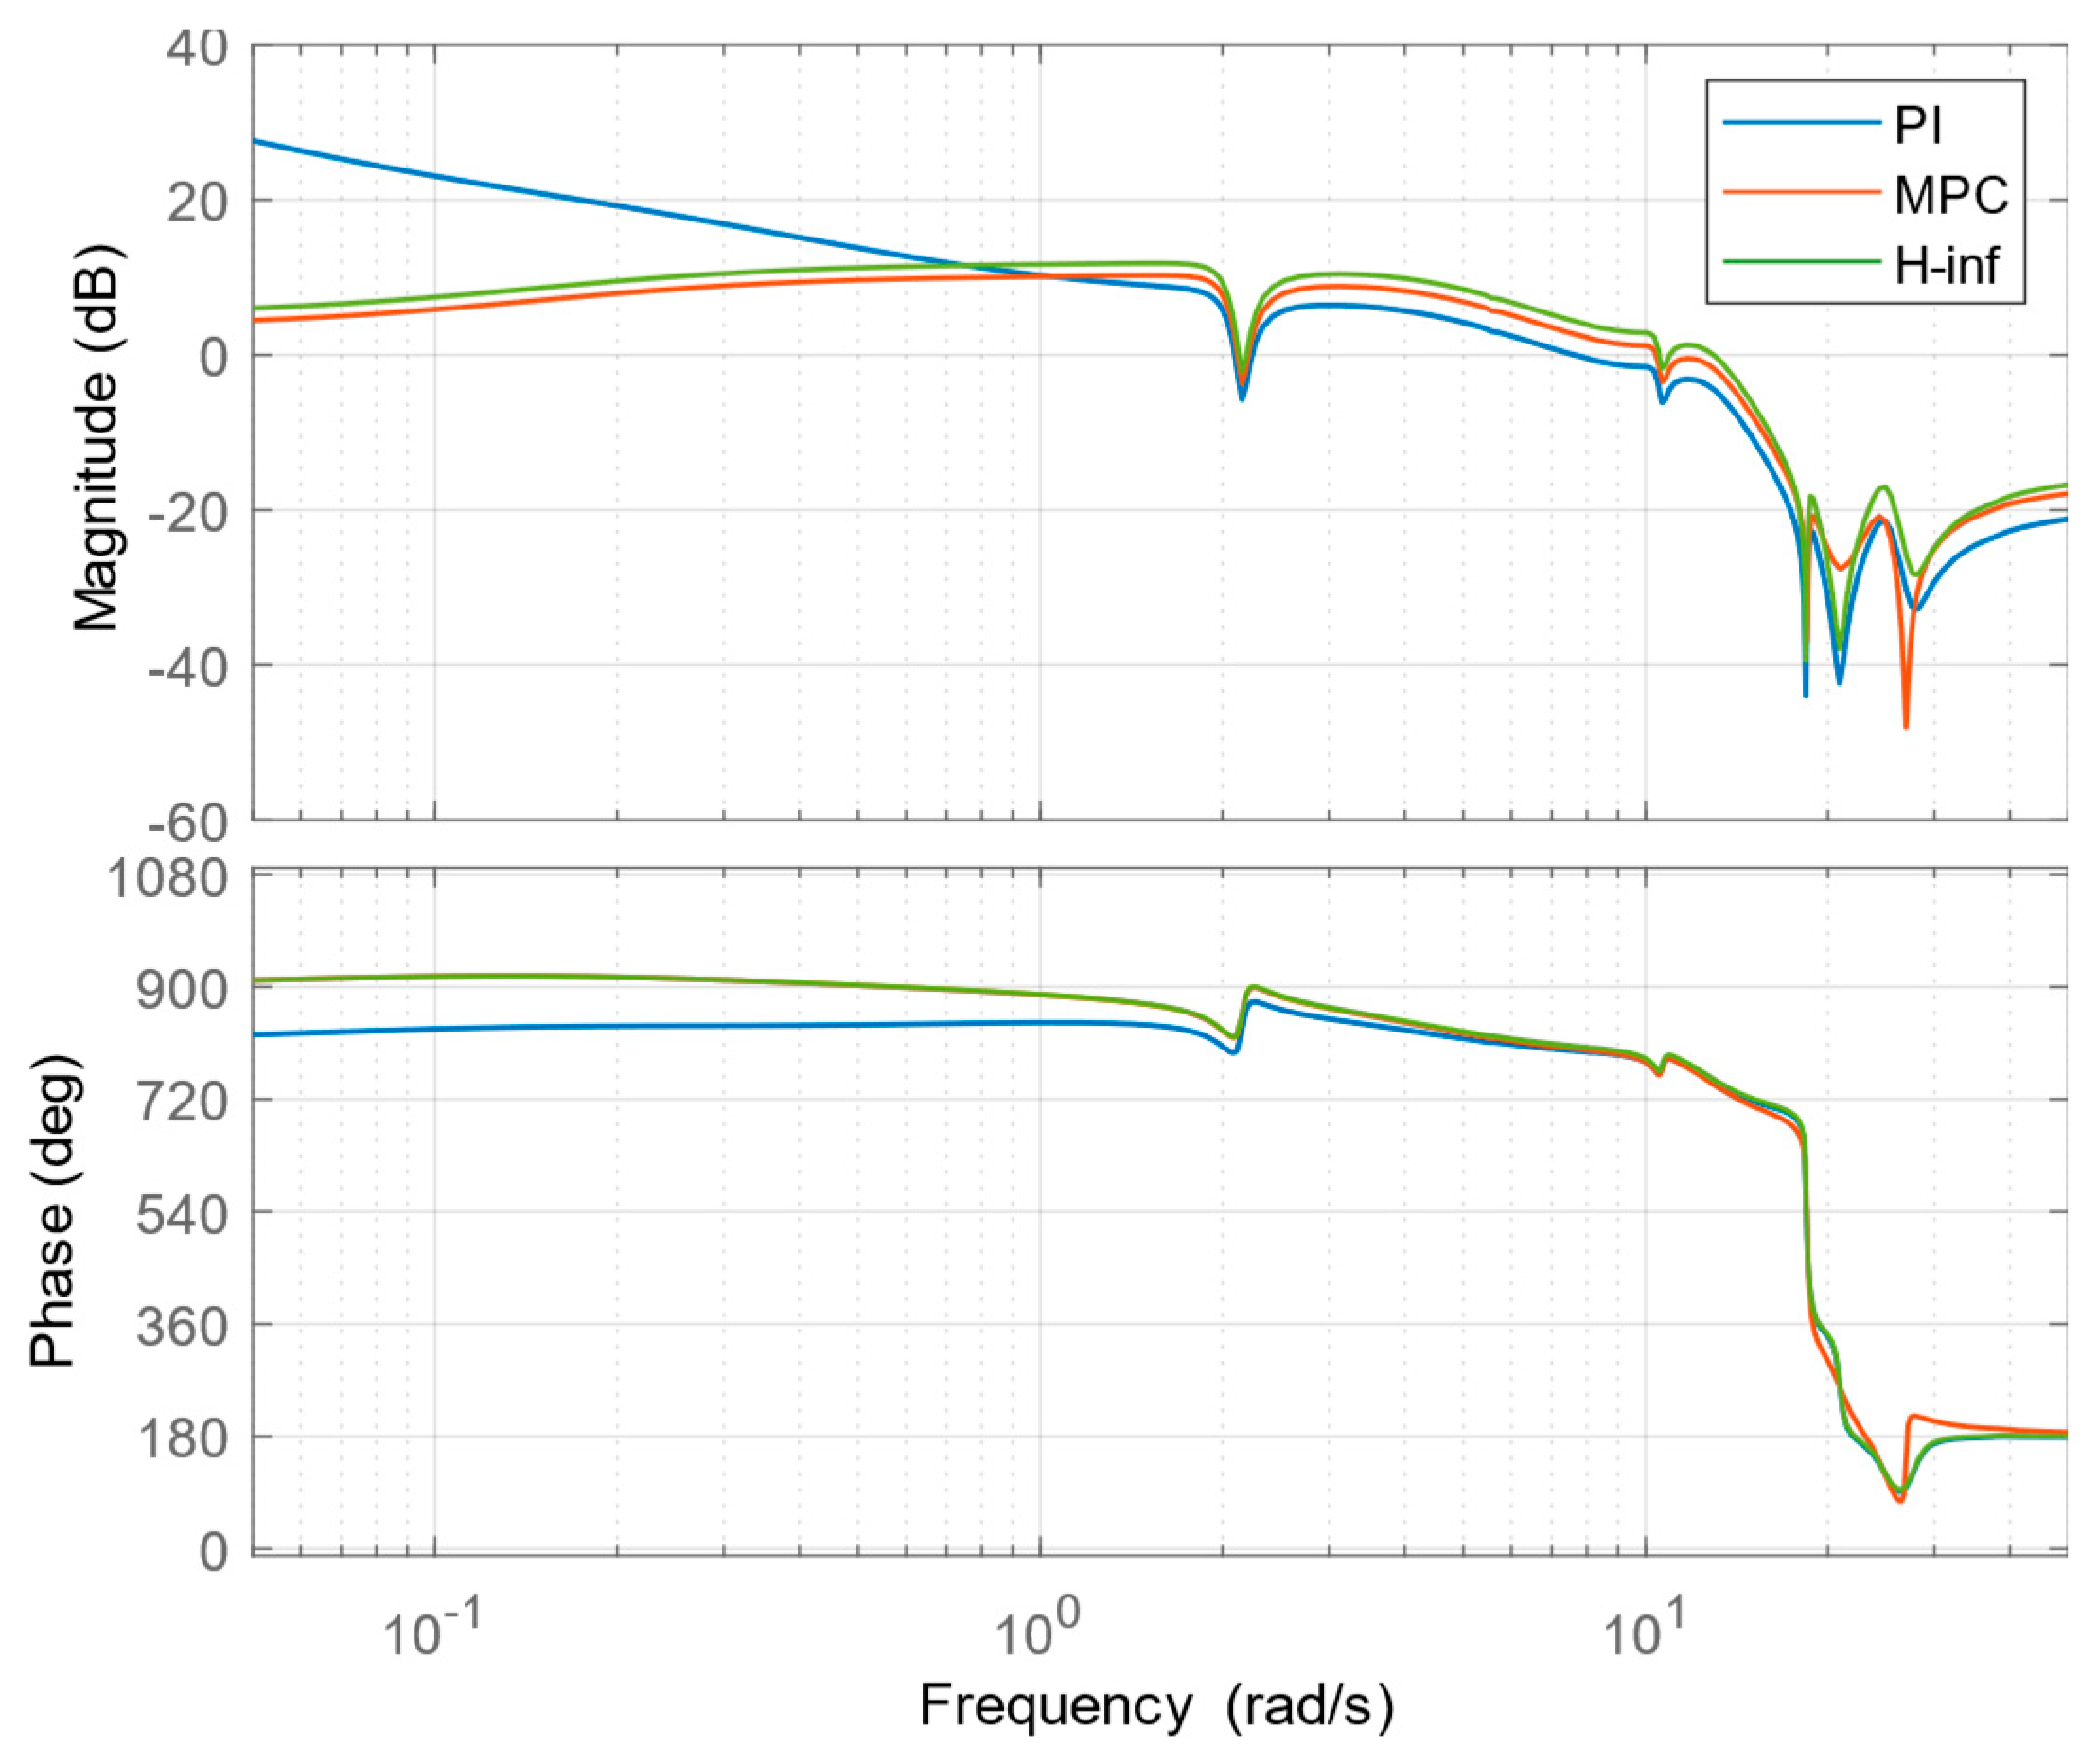
For each blade, the relationship between the perturbation of pitch angle demands,  Δ β i  and the perturbation of the BRBMs,  M ^ i   where   i = 1 ,   2 ,   3  can be modeled using a transfer function  G I s  in Equation (4), which is obtained by linearizing the turbine dynamics around the rated rotor speed. The perturbation in the BRBMs for each blade is obtained by filtering out the mean bending moment,  M 0  from the measured blade bending moments  M 1 , 2 , 3 , as given in Equation (3).
M 1 M 2 M 3 = M 0 + M ^ 1 M 0 + M ^ 2 M 0 + M ^ 3
The linearized transfer function  G I s  is detailed as
G I s = G p s G b s G b p f s ,  
where  G p s  is the transfer function of pitch actuator dynamics,  G b s  is the transfer function for the blade dynamics, and  G b p f s  is the transfer function of the bandpass filter used to simultaneously attenuate the low-frequency components of BRBMs and high-frequency noise from the measurement of sensors. These transfer functions are described in Equations (5)–(7).
  G p s = 1 1 + τ a c s   ,
G b s = d M b r m d β × ( 2 π f b r m 1 ) 2 s 2 + 2 π ε a f b r m 1 s + ( 2 π f b r m 1 ) 2 ,
G b p f s = 2 π f H s s 2 + 2 π f H + f L s + 4 π 2 f H f L  
where  τ a c  is the time constant of the pitch actuator,  d M b r m d β  is the pitch sensitivity of the BRBM,  f b r m 1  is the natural frequency of the first blade root bending mode,  ε a  is the aerodynamic damping ratio,  f L  and  f H  are the low and high cutoff frequencies of the bandpass filter.
Using the above approach, the net IPC model comprises three linear individual blade models that relate the blade pitch perturbations and BRBM perturbations, as shown in Figure 3. The combined linearized three-blade models can be given as
                          M ^ 1 M ^ 2 M ^ 3 = G I s 0 0 0 G I s 0 0 0 G I s P I s Δ β 1 Δ β 2 Δ β 3
The transfer function  G I s  is obtained by substituting the following parameters:    τ a c = 0.105 ,   ε a = 0.45 ,   f b r m 1 = 0.7 ,   d M b r m d β = 1.35 × 10 3  kNm deg−1   f L  and  f H  as 0.0143 Hz and 0.81 Hz, respectively, in Equations (5)–(7), as given in Equation (9).
G I s = 1.329 × 10 5 s 0.105 s 5 + 1.752 s 4 + 10.31 s 3 + 40.67 s 2 + 102 s + 8.846   .

3.2. H Control Design

The IPC control design model, as discussed in the previous section, is based on a linearized three-blade transfer function model. This model is primarily aimed at control design but does not account for the other coupled dynamics involved in the wind turbine. Hence, the control design method is supposed to possess sufficient robustness to overcome the effects of unmodelled dynamics. Moreover, it is appropriate in the case of IPC-based load mitigation techniques to have blade loads specified in the frequency domain. These features point toward  H  loop shaping as a desirable choice for control design.
While implementing  H  control for load reduction, we are first interested in designing compensating weighting function  W I s  to shape the singular values of the shaped plant  P I C s .
P I C s = G I s W I s
where    G I s  is the plant in consideration.
The weighting function  W I s  should have higher gains at low frequencies and lower gains at high frequencies for noise suppression. Further, a central loop-shaping controller  C s  is synthesized to achieve the maximum robust stability margin [21,22] of the shaped plant    P I C s  and finally, the actual loop shaping controller will be  C s = W I s C s .

Stability Analysis  H  Controller

In  H  loop-shaping method, the singular value of nominal plant,  G I  is shaped to produce a required open-loop shape using pre- and post-compensators  W 1  and  W 2  [21,36]. A loop-shaping design procedure is shown in Figure 4.
The controller,  C s = W 1 C W 2 , where  C  is an optimal  H  controller that minimizes the  H  cost as [21]:
γ C = I C ( I P I C C ) 1 I , P I C = I P I C ( I P I C C ) 1 I , C .        
where  P I C s  is the shaped plant and is defined as  P I C = W 2 G I W 1 .
The optimal performance is the minimum cost [21],
γ = m i n   C γ C .
Assume that    P I C = N M 1 , where  N j ω N j ω + M j ω M j ω = I , is a normalized coprime factorization of the shaped plant model    P I C  [36]. Then the control system will be robustly stable for any small change    P I C ˜  to    P I C  of the form
  P I C ˜ = N + Δ 1 ( M + Δ 2 ) 1
where Δ1 and Δ2 are a stable pair fulfilling [21,36]
Δ 1 Δ 2   γ 1
The controller,  C s , does not significantly disturb the loop shape in the range of frequencies where the gain  W 2 G I W 1  is either high or low and will guarantee satisfactory stability margins. The final controller to be applied is  C = W 1 C W 2 . Equation (14) should be satisfied for optimum control performance and satisfactory stability margins.
The pre- and post-compensating weighting functions can be given as
W I s = γ I W 1 s W 2 s ,
where  γ I  is the tuning gain,  W 1 s  is the transfer function of the high pass filter, and  W 2 s  is the transfer function (inverse notch filter) for attenuating the 1P load experienced by the turbine.
Since this study focuses the reduction of BRBM at the 1P frequency, a loop-shaping controller is designed to alleviate the blade load at 1P. The transfer functions used for constructing the overall compensating weighting function of Equation (15) are given as
W 1 s = 0.15 s 0.15 s + 1   ,
W 2 s = s 2 + 2 D 1 ω 1 p s + ω 1 p 2 s 2 + 2 D 2 ω 1 p s + ω 1 p 2   ,
By putting the values of  D 1 ,   D 2   ,  and  ω 1 p  as 1.48, 0.01, 1.27 rad/s [3], respectively in Equation (17),  W 2 s  is obtained as
W 2 s = s 2 + 3.759 s + 1.613 s 2 + 0.0254 s + 1.613   .
Subsequently, based upon the shaped plant  P I C s ,  the loop shaping controller  C s  is synthesized as
C s = 1.522 s 7 59.99 s 6 1087 s 5 10160 s 4 26860 s 3               10900 s 2 + 6.101 s 0.15 s 7 + 22.56 s 6 + 1685 s 5 + 79590 s 4 + 466300 s 3                                                   140000 s 2 + 744600 s + 4.007 .
where the robust stability margin is 0.37. The frequency response of the  H  loop-shaping controller design is shown in Figure 5.

3.3. MPC Controller Design

Linear models are required to design MPCs. The linearized three-bladed model transfer function obtained in Section 3.1 is converted to state space form in MATLAB, which can be represented as
  x ˙ t = A x t +   B u u t t                     y t = C x t
where  x t R a u t t R b , and  y t R c  represent states, input, and output, respectively; a, b, and c denote the number of states, input, and output, respectively.
The MPC prediction equations are given in Equation (21) at discrete time index k y k  is the perturbation of BRBMs and  u k  is the perturbation of pitch demands.
The prediction equations for the MPC are as follows:
      x k + 1 x k + 2 x k + n y =   A   A 2 A n y x k + B u 0 A B u B u       A n y 1 B u A n y 2 B u u k + 1 u k + 2 u k + n y y k + 1 y k + 2 y k + 3 y k + n y y k = C A C A 2 C A n y S x x k + C B u 0 C A B u C B u   C A n y 1 B u C A n y 2 B u Q u u k
u k  is given by
u k = u k + 1   u k + 2 u k + n h 1   u k + n h   u k + n h u k + n h T
where the prediction and control horizons are denoted as ny and nh, respectively.
Equation (21) can be written as
y k = S x x k + Q u u k
where  S x  and  Q u  are the state space predictive matrices defined in Equation (21).
The following cost function  J  is minimized to realize the controller design,
J = j = 1 n y e k + j T e k + j + j = 0 n h Δ u k + j T R Δ u k + j
where e is the tracking error, the control increment is represented as ∆u, and the weighting matrix is denoted as R.
Employing Equations (23) and (24),  J , can be expressed as
J = L r S x x k Q u u f u t L σ + W x   u f u t
where L signifies the vector of ones and its size is ny  ×   1 , and the weight matrix is denoted as  W x σ  is offset, the difference of the output of the process and the model.
Equation (25) can be expressed as a function control input,
J u , k =   u f u t T     Q u T       Q u + W x N × u f u t         + 2   u f u t T ×       ( Q u T     S x ) × x k   ( Q u T       L + W x   M ) × r σ P
where M = ( u s s / ( r σ )) is input gain at steady state.
Finally, the quadratic cost function is derived as:
min J u , k = u f u t ( k ) T N u f u t k + u f u t ( k ) T P
subject to the following constraints
u m i n u f u t u m a x Δ u m i n Δ u f u t Δ u m a x y k + 1 m i n y k + 1 y k + 1 m a x Δ u m i n Δ u f u t Δ u m a x y k + 1 m i n y k + 1 y k + 1 m a x
where umin and umax are the lower and upper limits of ufut, respectively. ∆umin and ∆umax are the lower and upper limits of ∆ufut, respectively.  y k + 1 m i n  and  y k + 1 m a x  are the lower and upper limits of  y k + 1 , respectively.

4. Simulation Studies

To evaluate the performance of the controllers reported in Section 3, simulations are carried out on a FAST full nonlinear 5 MW NREL wind turbine model [34,35]. For simulation studies, two turbulent winds (at 14 m/s and at 16 m/s a mean speed) are taken into account, with turbulence intensities of approx. 16% (as per normal turbulence model (NTM) class B) and 18% (as per NTM class A) [37,38].
The turbulent wind fields used in the simulations are generated from NREL’s TurbSim [38]. DEL analysis is also conducted for two different mean wind speeds at 14 m/s and 16 m/s for the two turbulent intensities [39]. Simulation results are presented in both frequency and time domains. Also, the reported controllers are compared with the conventional PI-based controller to verify their efficacy.

4.1. At 16 m/s with Turbulent Intensity B

In this section, the performance of MPC and  H  based IPC are investigated at 16 m/s mean wind speed with a turbulence intensity B. The ny and nh, for MPC are taken as 20 and 10, respectively, with a weight of 3  ×  10−10. Their values are chosen accordingly to get the proper variation among the three individual pitch angles (approx. 120 °  phase difference) to minimize the blade root bending moment [10]. Also, parameters are selected so that the gain cross-over frequency (bandwidth) of the controller is maintained between 0.6 to 2 rad/s for optimum control performance and stability of the wind turbine system [40]. The sampling time is set to 0.0125 s. The sampling time is taken in this study as 0.0125 s to avoid a mismatch between the simulation time of FAST and MPC s-functions [35,41]. Figure 6 shows the generated turbulent wind speeds at 16 m/s with two corresponding intensities.
Figure 7a shows a comparison of the blade root bending moments (BRBMs) produced by the CPC-PI, IPC-PI, IPC-MPC, and IPC- H  controllers. The corresponding power spectral densities (PSD) are shown in Figure 7b.
From Figure 7a, compared with CPC-PI, all individual pitch controllers can notably mitigate the BRBMs, and IPC- H  maintains a smaller fluctuation in BRBMs. A reduction of 88.76% in BBRM is noticed in the case of IPC- H  compared to CPC-PI. Furthermore, compared with IPC-PI and IPC-MPC, the IPC- H  has a lower magnitude of peaks at 1P frequency, as shown in Figure 7b. A reduction of 61.04% is observed in the peak at 1P compared with IPC-PI. Similarly, a 37.25% reduction is noticed when compared with IPC-MPC. Thus, it demonstrates the superior performance of IPC- H  in alleviating loads significantly at 1P frequency in both time and frequency domains. The individual pitches of IPC- H  and collective pitch demand are shown in Figure 8. It can be seen that the individual pitch angles maintain a proper phase shift of around 120 ° , as expected.

4.2. At 16 m/s with Turbulent Intensity A

In this section, the simulation is carried out at a mean wind speed of 16 m/s at turbulent intensity A (18%). The BRBM and its PSD are portrayed in Figure 9a,b, respectively. Figure 9b shows that the peak 1P in the case of IPC- H  is attenuated by 55.71% compared with IPC-PI, and compared with IPC-MPC, a reduction of 30.64% is observed. Thus, a noticeable improvement in the performance of IPC- H  is observed compared to the other reported controllers in alleviating loads at 1P frequency in both time and frequency domains.
The generator speed and power curves are plotted as shown in Figure 10a and Figure 10b, respectively. It can be noticed from Figure 10a that the rated speed (around 1173 rpm) is maintained for the 5 MW NREL wind turbine. It can also be observed that the  H  controller performs better in terms of reduction of generator speed and power fluctuation compared to the other reported controllers. The open-loop response (pitch to BRBMs) of the reported controllers, when applied to the linearized model of the 5 MW NREL wind turbine model, is shown in Figure 11 as follows:

4.3. At 14 m/s with Turbulent Intensity B

In this section, IPC-based controllers are verified in time and frequency domains at 14 m/s mean wind speed with turbulence intensity B. ny and nh are set to 20 and 10, respectively, and weight is taken as 2 × 10⁻¹⁰. The sampling time is considered as 0.0125 s. The turbulent wind speed field at two intensities (NTM B and A) at 14 m/s is shown in Figure 12.
The comparative plots of BRBMs generated by CPC-PI, IPC-PI, IPC-MPC, and IPC- H  are shown in Figure 13a, and their corresponding PSDs are illustrated in Figure 13b. From Figure 13a, it can be noticed that the lower magnitude of BRBMs is observed in the case of IPC- H .
Also, compared with IPC-PI and IPC-MPC, the IPC- H  gives a lower magnitude of peak in their PSDs, particularly at 1P frequency. In Figure 13b, the peak 1P of IPC- H  is reduced by 60.16% compared with IPC-PI. Similarly, a reduction of 32.98% is noticed compared with IPC-MPC. Thus, the superior performance of IPC- H  is observed in minimizing blade load significantly at 1P frequency. The pitch angles for IPC- H  is shown in Figure 14.

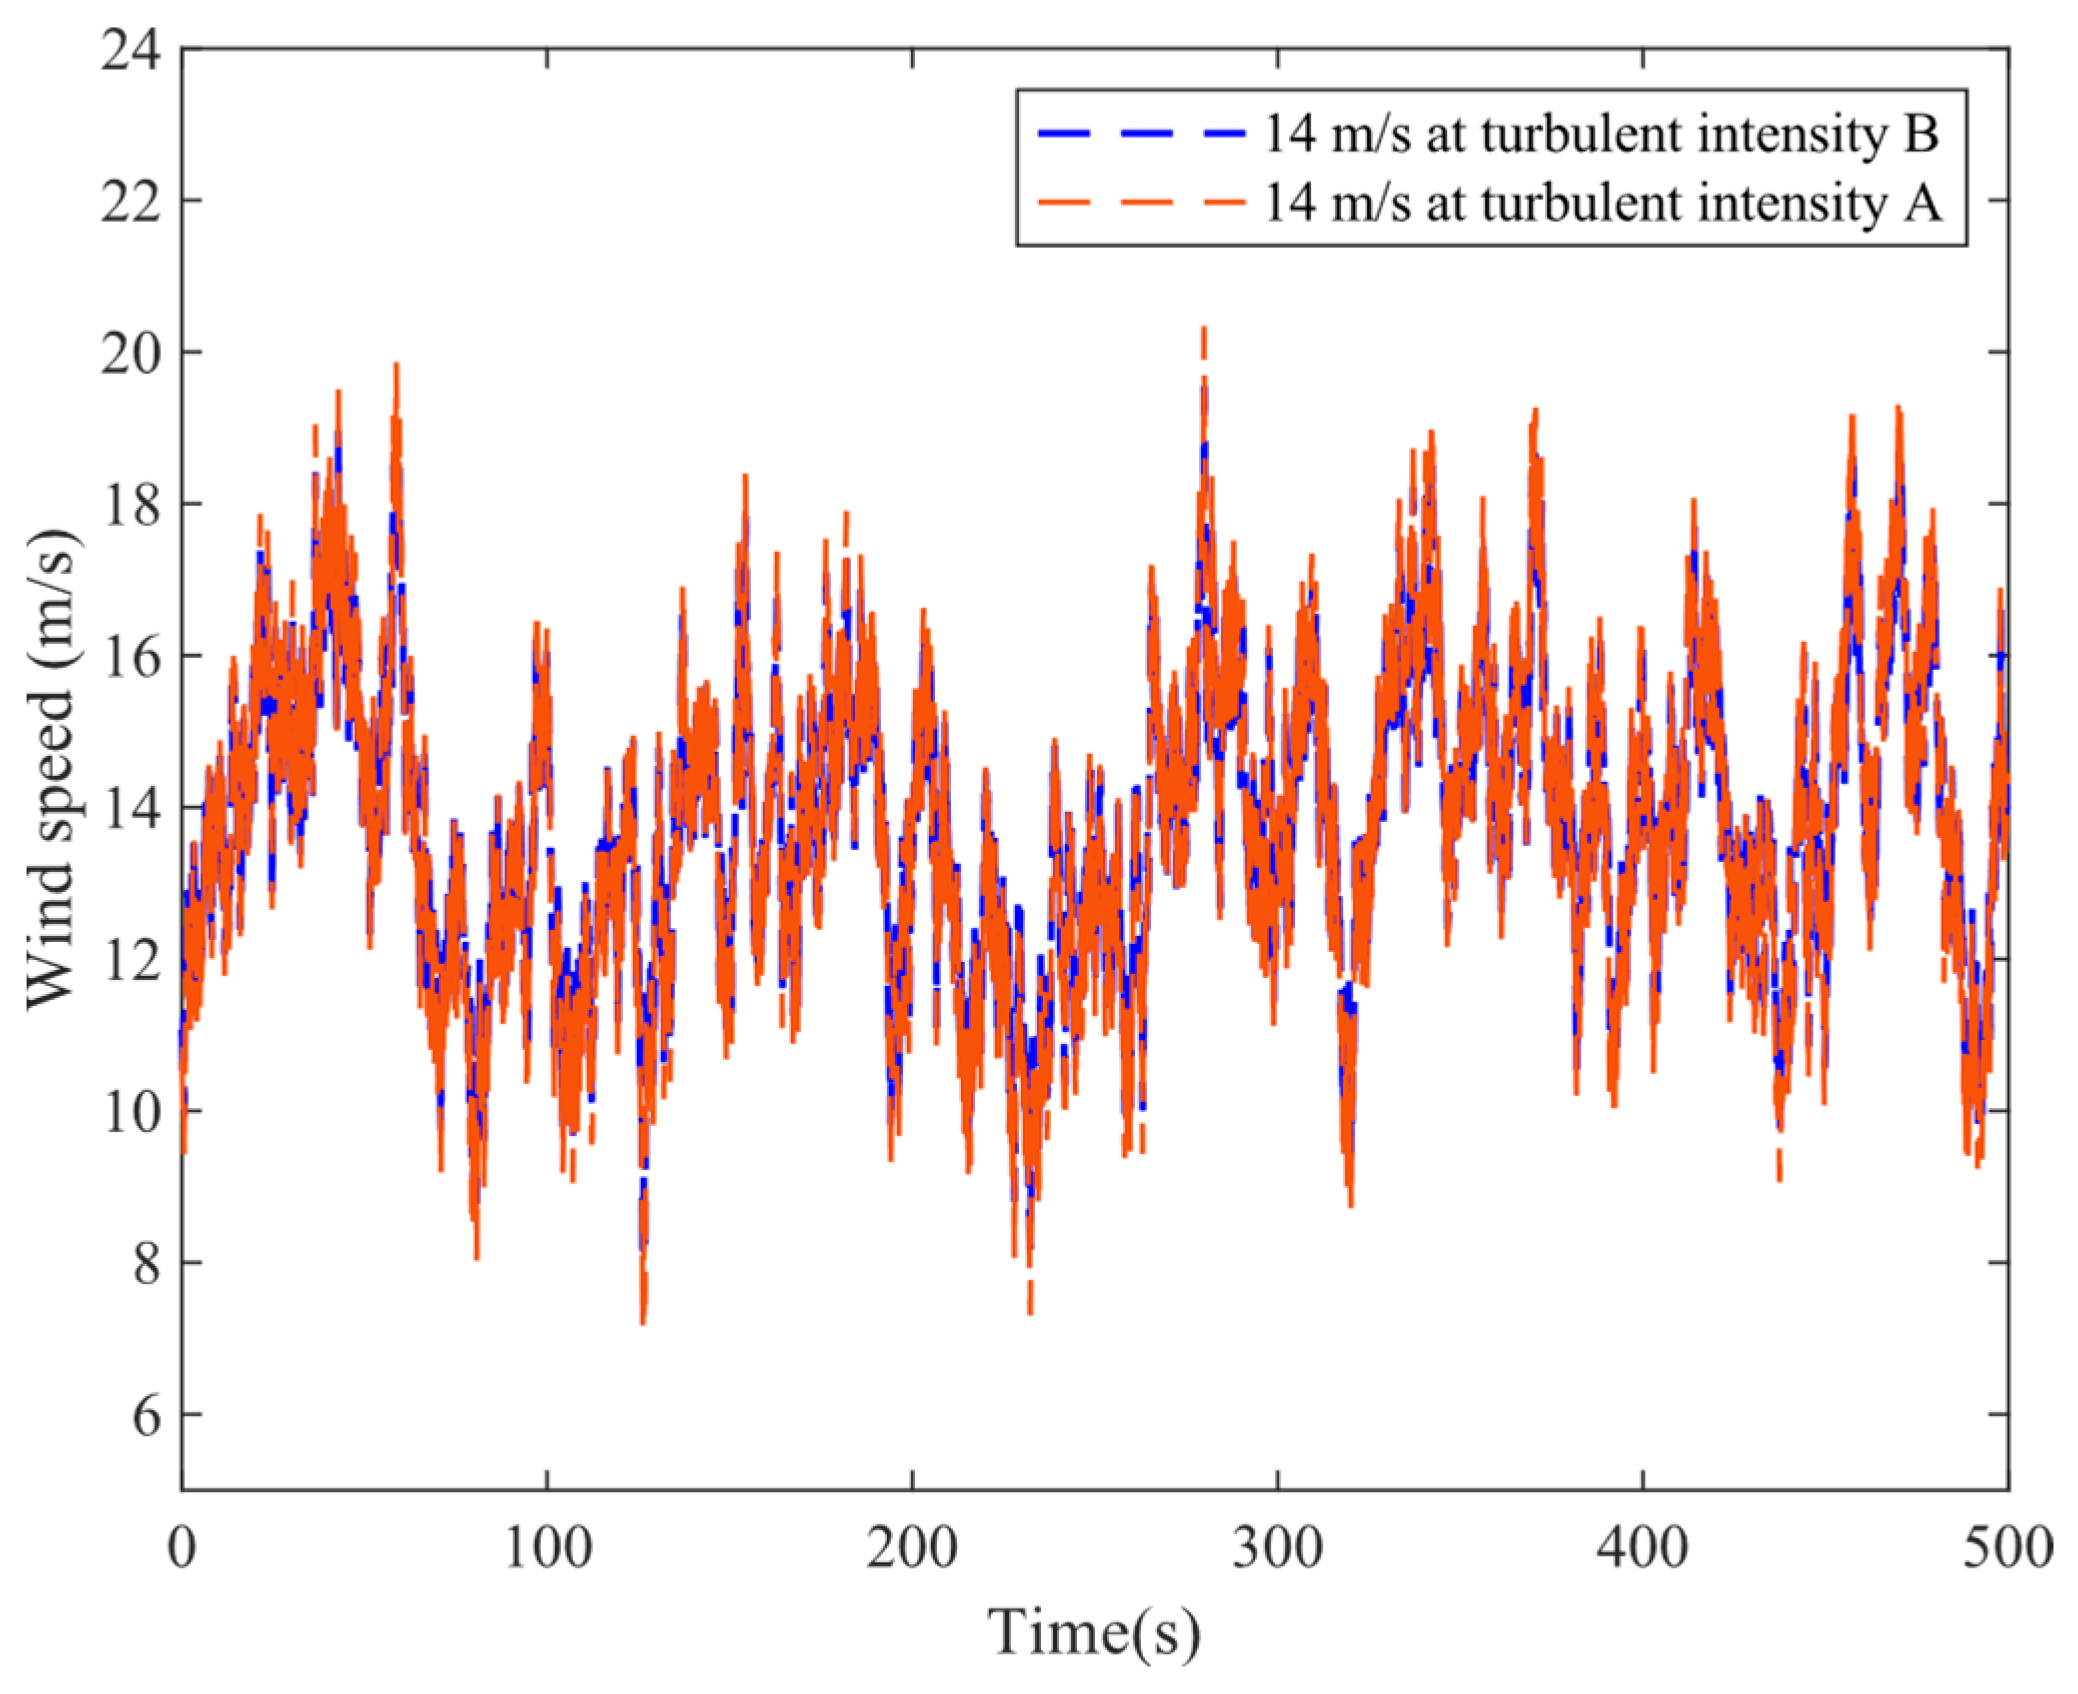
4.4. At 14 m/s with Turbulent Intensity A

This section discusses simulations for a mean wind speed of 14 m/s with turbulent intensity A (18%). Figure 15a,b shows the BRBM plots of the above-discussed controllers and their PSDs, respectively. From Figure 15b, the percentage reduction of the peak at 1P frequency for IPC- H  is calculated as 51.39% compared with IPC-PI, and a reduction of 29.02% is noticed compared with IPC-MPC. Hence, IPC- H  exhibits an enhanced performance as compared to other reported controllers in alleviating the 1P load.

4.5. Analysis of Controller Performances

To investigate the controller’s performance at extreme wind operating points, the extreme operating gust (EOG) conditions in IEC 61400-1 3rd Ed. for turbulence, category A [37] is used. Figure 16a illustrates the time series of the wind speed at 16 m/s with EOG conditions (between 40–50 s).
The simulations of CPC, IPC-PI, IPC-MPC, and IPC- H  controllers for EOG conditions are performed for a simulation time of 100 s. Figure 16b illustrates the simulation results of BRBMs with the EOG condition (40–50 s).
It can be observed that the magnitude of BRBMs in terms of the peak-to-peak spike at extreme gust region is found to be reduced when the IPC- H  controller is used compared to other reported controllers.
An EOG simulation is also conducted at 14 m/s with a turbulent intensity A to further investigate the controller’s performance. The obtained results are shown in Figure 17a,b, respectively. Similar results are obtained regarding the reduction of BRBM to those obtained at 16 m/s above, signifying superior performance of the    H  controller compared to the other reported controllers.
To further validate the effectiveness of controllers, simulations are performed at two different wind speeds in the EOG conditions. Figure 18a,b portray the generator speed and power plots obtained from the wind turbine at 14 m/s wind speed in the EOG. Similarly, Figure 19a,b show generator speed and power plots at 16 m/s wind speed in the EOG. The simulation results show that the  H  controller performed better in terms of recovery time and reduced power fluctuation compared to the other reported controllers in the EOG region (40–50 s).
Table 2 shows a quantitative comparison of standard deviations of the generator speed for the reported controllers at two wind speeds (14 m/s and 16 m/s) with a turbulent intensity A in the EOG condition. The results in the table demonstrate that the standard deviation of generator speed for IPC- H  is reduced by approx. 56.46% and 88.48% compared to CPC-PI and IPC-MPC at 14 m/s wind speed. A reduction of 54.59% and 88.37% is observed at wind speed of 16 m/s, respectively, signifying the better performance of the  H  controller in terms of the reduced standard deviation of generator speed compared to the PI and MPC controllers in the EOG conditions.

4.6. Analysis of Performances Metrices

The quantitative comparisons of the performances of the reported controllers are evaluated. Table 3 shows a quantitative comparison of the performance analysis of CPC, IPC-PI, IPC-MPC, and IPC- H  controllers in terms of BRBM at two mean wind speeds (14 m/s and 16 m/s) with a turbulent intensity A [37,38]. The results in the table demonstrate that the standard deviation of the BRBM for IPC- H  is reduced by approximately 25.46%, 29.37%, and 30.08%, respectively, compared to CPC, IPC-PI, and IPC-MPC for a mean wind speed of 14 m/s. A reduction of 27.19%, 31.05%, and 32.9%, respectively, is observed for 16 m/s wind speed.
Table 4 and Table 5 show a quantitative comparison of the tilt (Mtilt) and yaw (Myaw) moments of the reported controller at 14 m/s and 16 m/s wind speeds with turbulent intensity A, respectively. From the results given in Table 4 and Table 5, it can also be observed that the  H  controller outperforms in terms of reduction of Mtilt and Myaw moments compared to CPC, IPC-PI, and IPC-MPC controllers under turbulent wind conditions.

DEL Analysis

The blade loads in wind turbines can be quantified using the fatigue DEL. DEL estimates are typically generated using the rain flow counting algorithm [39]. To highlight the effectiveness of the IPC algorithms, DEL analysis is carried out at 14 m/s and 16 m/s mean wind speeds, respectively, at two turbulent intensities as per class NTM A and B [37,38]. The obtained results are shown in Figure 20 and Figure 21, respectively.
As detailed in Figure 20 and Figure 21, the IPC controllers produce lower DEL values at varying turbulent wind speeds. At turbulent intensity B, the average reduction in DEL under IPC schemes is calculated as 23.41% compared to CPC for 14 m/s wind speed, whereas the value produced for 16 m/s mean wind speed is 26.16%. At turbulent intensity A, the average percentage reduction in DEL for 14 m/s is calculated as 24.47%; similarly, the value for 16 m/s is 30.51%. This indicates the improved performance of IPCs over CPC. Moreover, IPC- H  achieves improved DEL reduction compared to the other controllers reported in this study.

4.7. Discussions

In this study, the performance of CPC-PI, IPC-PI, IPC-MPC, and IPC- H  control algorithms are investigated using a full nonlinear 5 MW NREL reference wind turbine. An NTM model-based turbulent wind file (.bts) is generated using TurbSim at different turbulent intensities and used in simulation studies to verify the effectiveness of the control schemes [38]. First, the conventional PI-based CPC is designed and implemented on a FAST 5 MW NREL wind turbine, and subsequently, other reported controllers are tested against it. Compared to the traditional CPC-PI controller, the BRBMs are reduced by 88.76% with the IPC- H  controller. To further estimate the effect of controllers, a short-term DEL based on the rain flow algorithm is performed. A performance improvement in terms of reduction of BRBM and DEL is found for the IPC- H  among the other reported controllers without affecting the power generation of the wind turbine.
PI-based IPC strategy is the most conventional IPC strategy considered the reference controller in the research community, which projects rotating blade loads onto fixed orthogonal tilt and yaw axis loads and uses the conventional PI controller to compensate for the loads. It is used in the study as a referendum of load reduction due to IPC [10,11,12,13]. The pitch activity increases significantly as a side effect of IPC; hence MPC based IPC controller is employed to maintain smooth pitch activity due to its inherent ability to include prediction and constraint handling. Also, the MPC application in IPC shows the capacity to reduce rotating blade loads, fixed rotor loads, and drive train loads [29,30,31,32,33]. The  H -based robust control strategy is used as the controllers developed using this method have the ability to treat the unmodelled dynamics and uncertainties in the plant model [25]. Also, it offers the flexibility to specify the load reduction performance in the frequency domain, which is particularly useful in the case of IPC, where the harmonics frequencies corresponding to the blade load frequencies of the turbine are to be dealt with [3,22,23,24]. In the loop-shaping method, a standard uncertainty model is used that accounts for parametric and dynamic uncertainty, and the controllers are synthesized to maximize the degree of uncertainty that the closed-loop system can sustain, providing robustness [3,25]. Furthermore, a robust stability margin concisely captures the degree of robustness, serving as a reliable indicator of IPC stability and performance.
Although PI controllers are primarily used in the industry due to their simplicity and ease of implementation, optimal controllers are found to perform better in reducing rotor speed fluctuations and power variations and simultaneously in load reduction of wind turbines [10,11,12,13]. The  H -based control could suffer from being mathematically complex, being generally of a high order which makes its usage difficult in practical applications [42]. Since a linearised model is taken for the controller design, it can exhibit model-plant mismatch when applied to a real-life turbine [24,30]. MPC-based control has the disadvantage of requiring an accurate mathematical model of the system dynamics. Unmodelled dynamics and model uncertainties can adversely affect the performance of MPC. Another main drawback of MPC is that it could be computationally intensive, involving the solution of the optimization problem for each control action, making its application limited in practical applications [29,30,31]. Moreover, it could be sensitive to modeling errors and requires an initialization and warm-up time period to converge to optimal control actions [31]. IPC—a promising method for reducing structural loads which may increase actuator activity [33]. Hence, IPC applications using MPC with proper constraints handling can be considered for better load reduction.
The sensitivity of the loads toward the pitch system increases with growing wind speed. Even though the turbulence changes faster, the pitch actuators must act more quickly to reduce the loads. IPC reduces blade loads more efficiently, specifically for higher wind speeds. However, this will lead to increased pitch activity and fatigue, so the benefits of reduced loads must be weighed against the disadvantages of the increased fatigue of pitch actuator systems. It also depends on the wind turbine, material costs, and other factors; hence a generalized statement cannot be drawn here. In the current study, the errors and uncertainties in the measurements of the upcoming wind are not considered. However, the recent development of wind evolution [43,44] will allow fast and accurate wind fields and can be used as a feedforward control in the future of this study.

5. Conclusions and Future Work

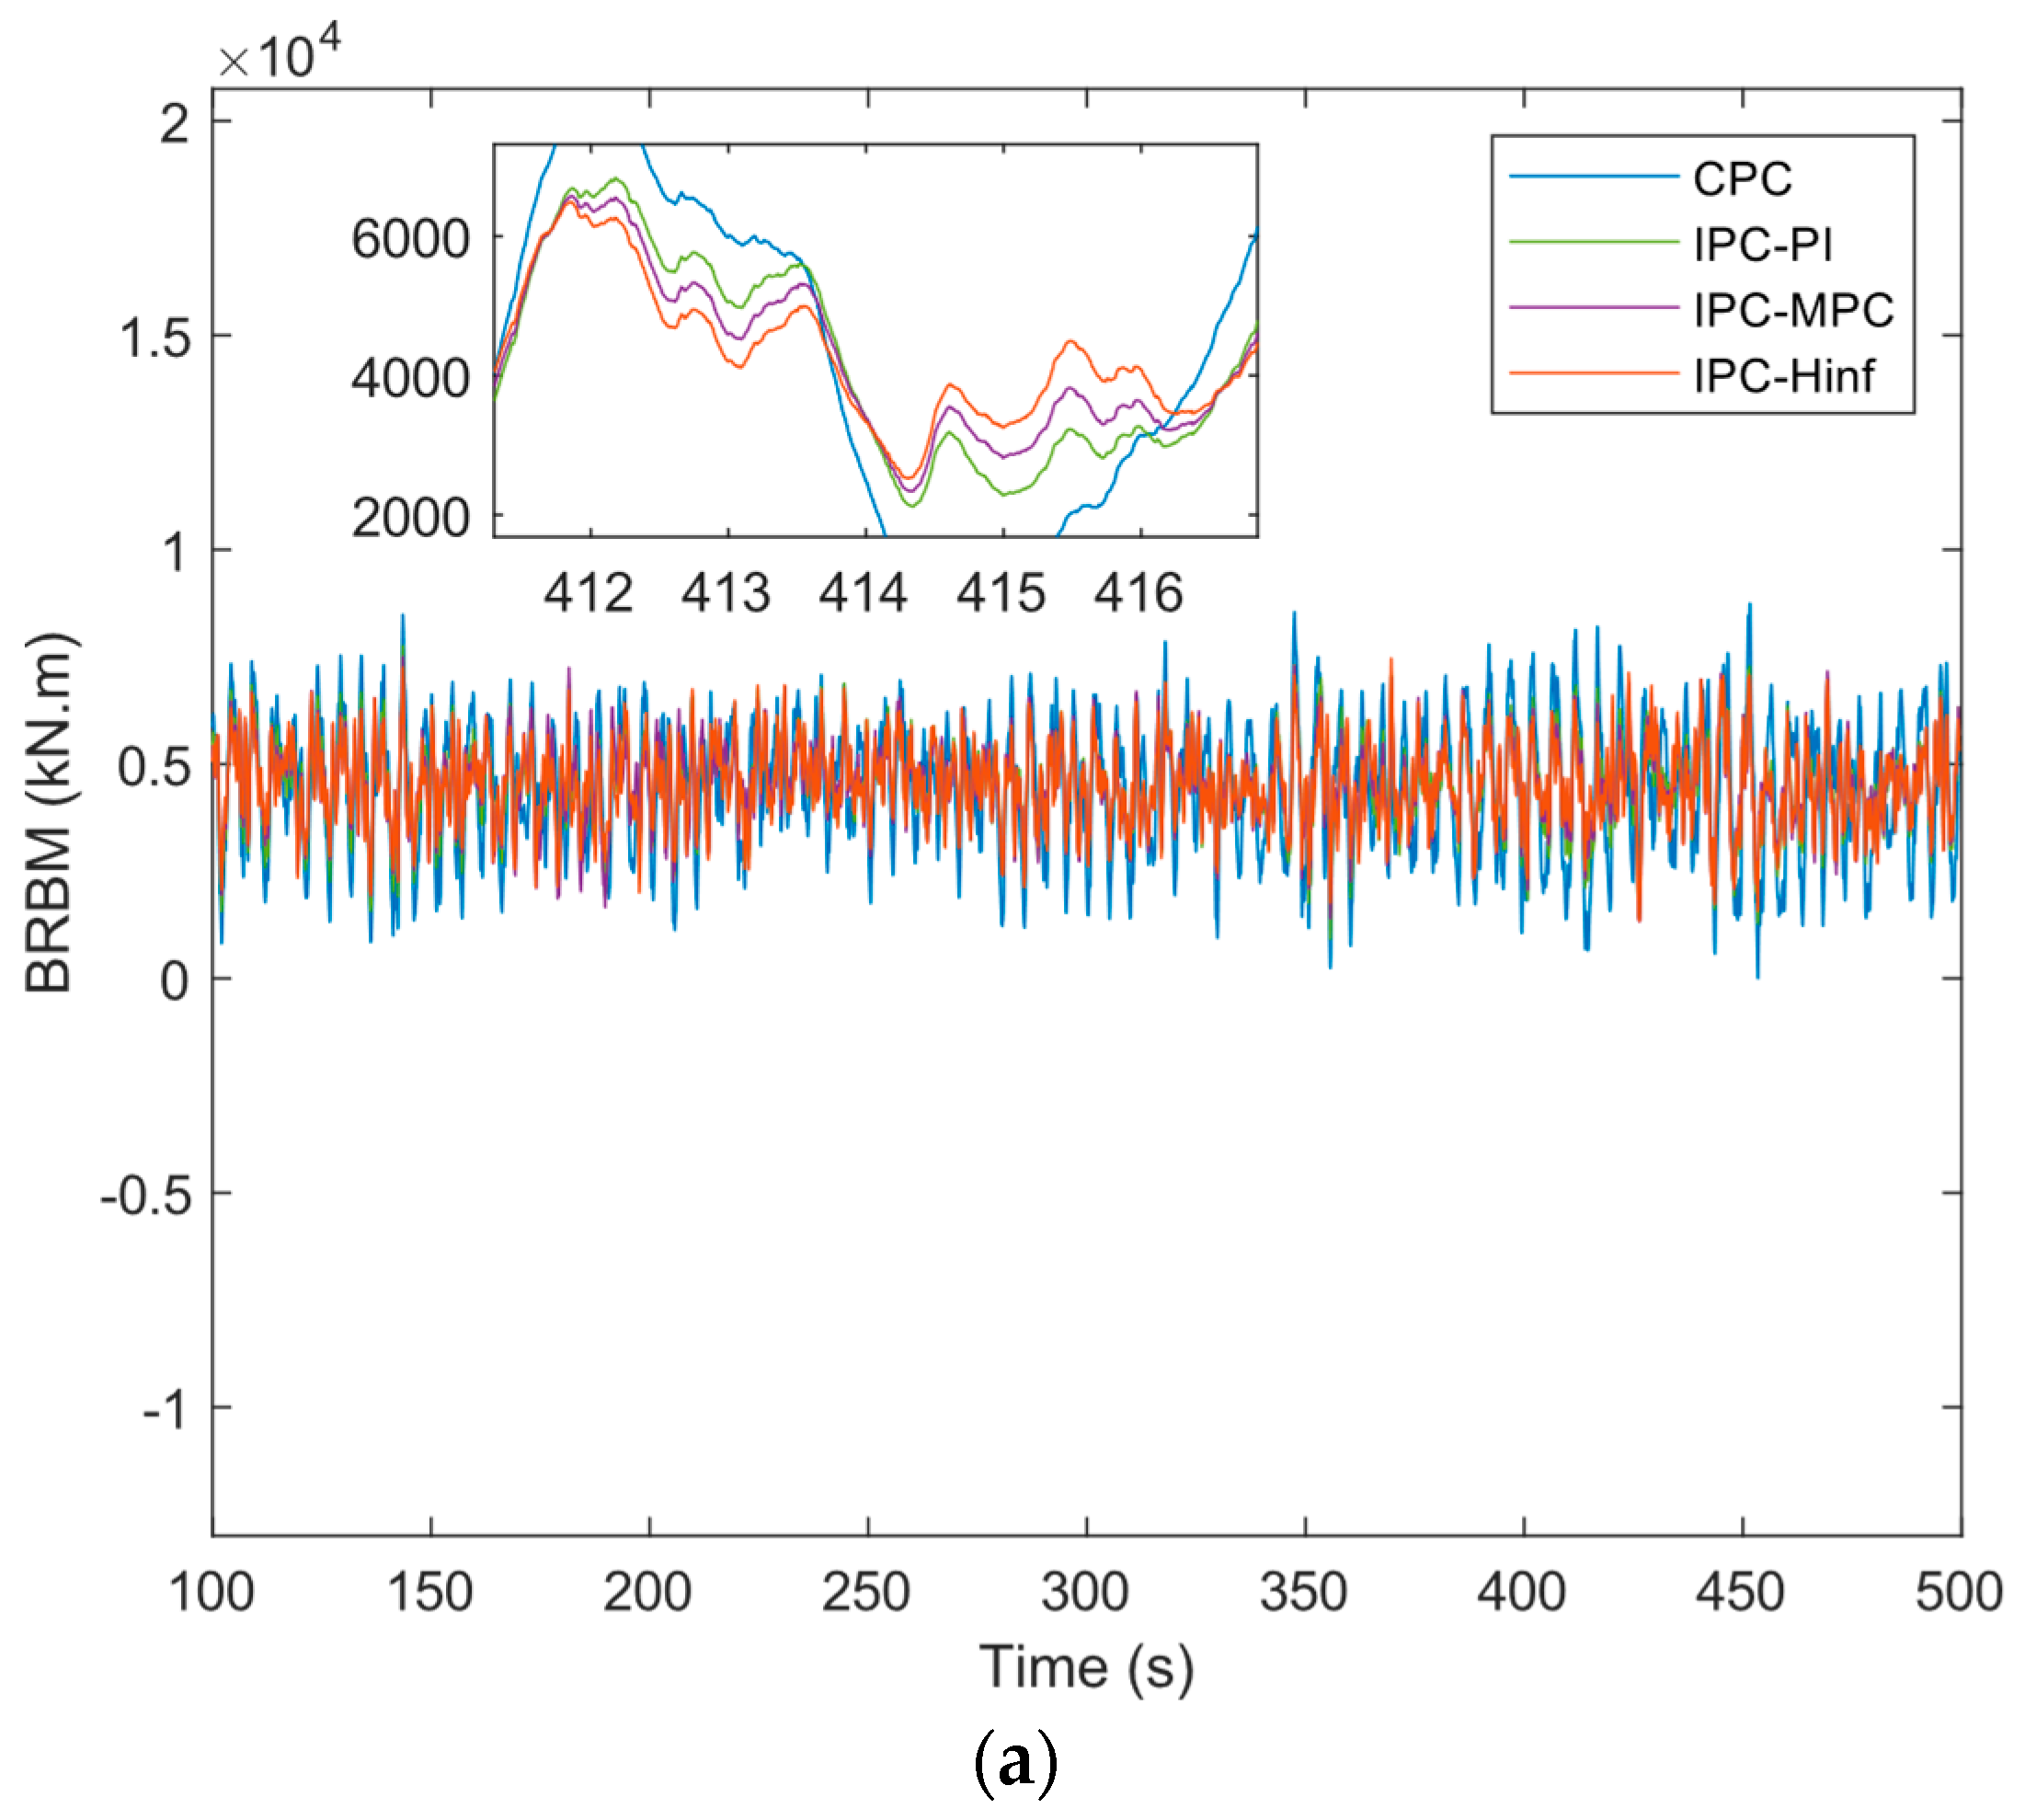
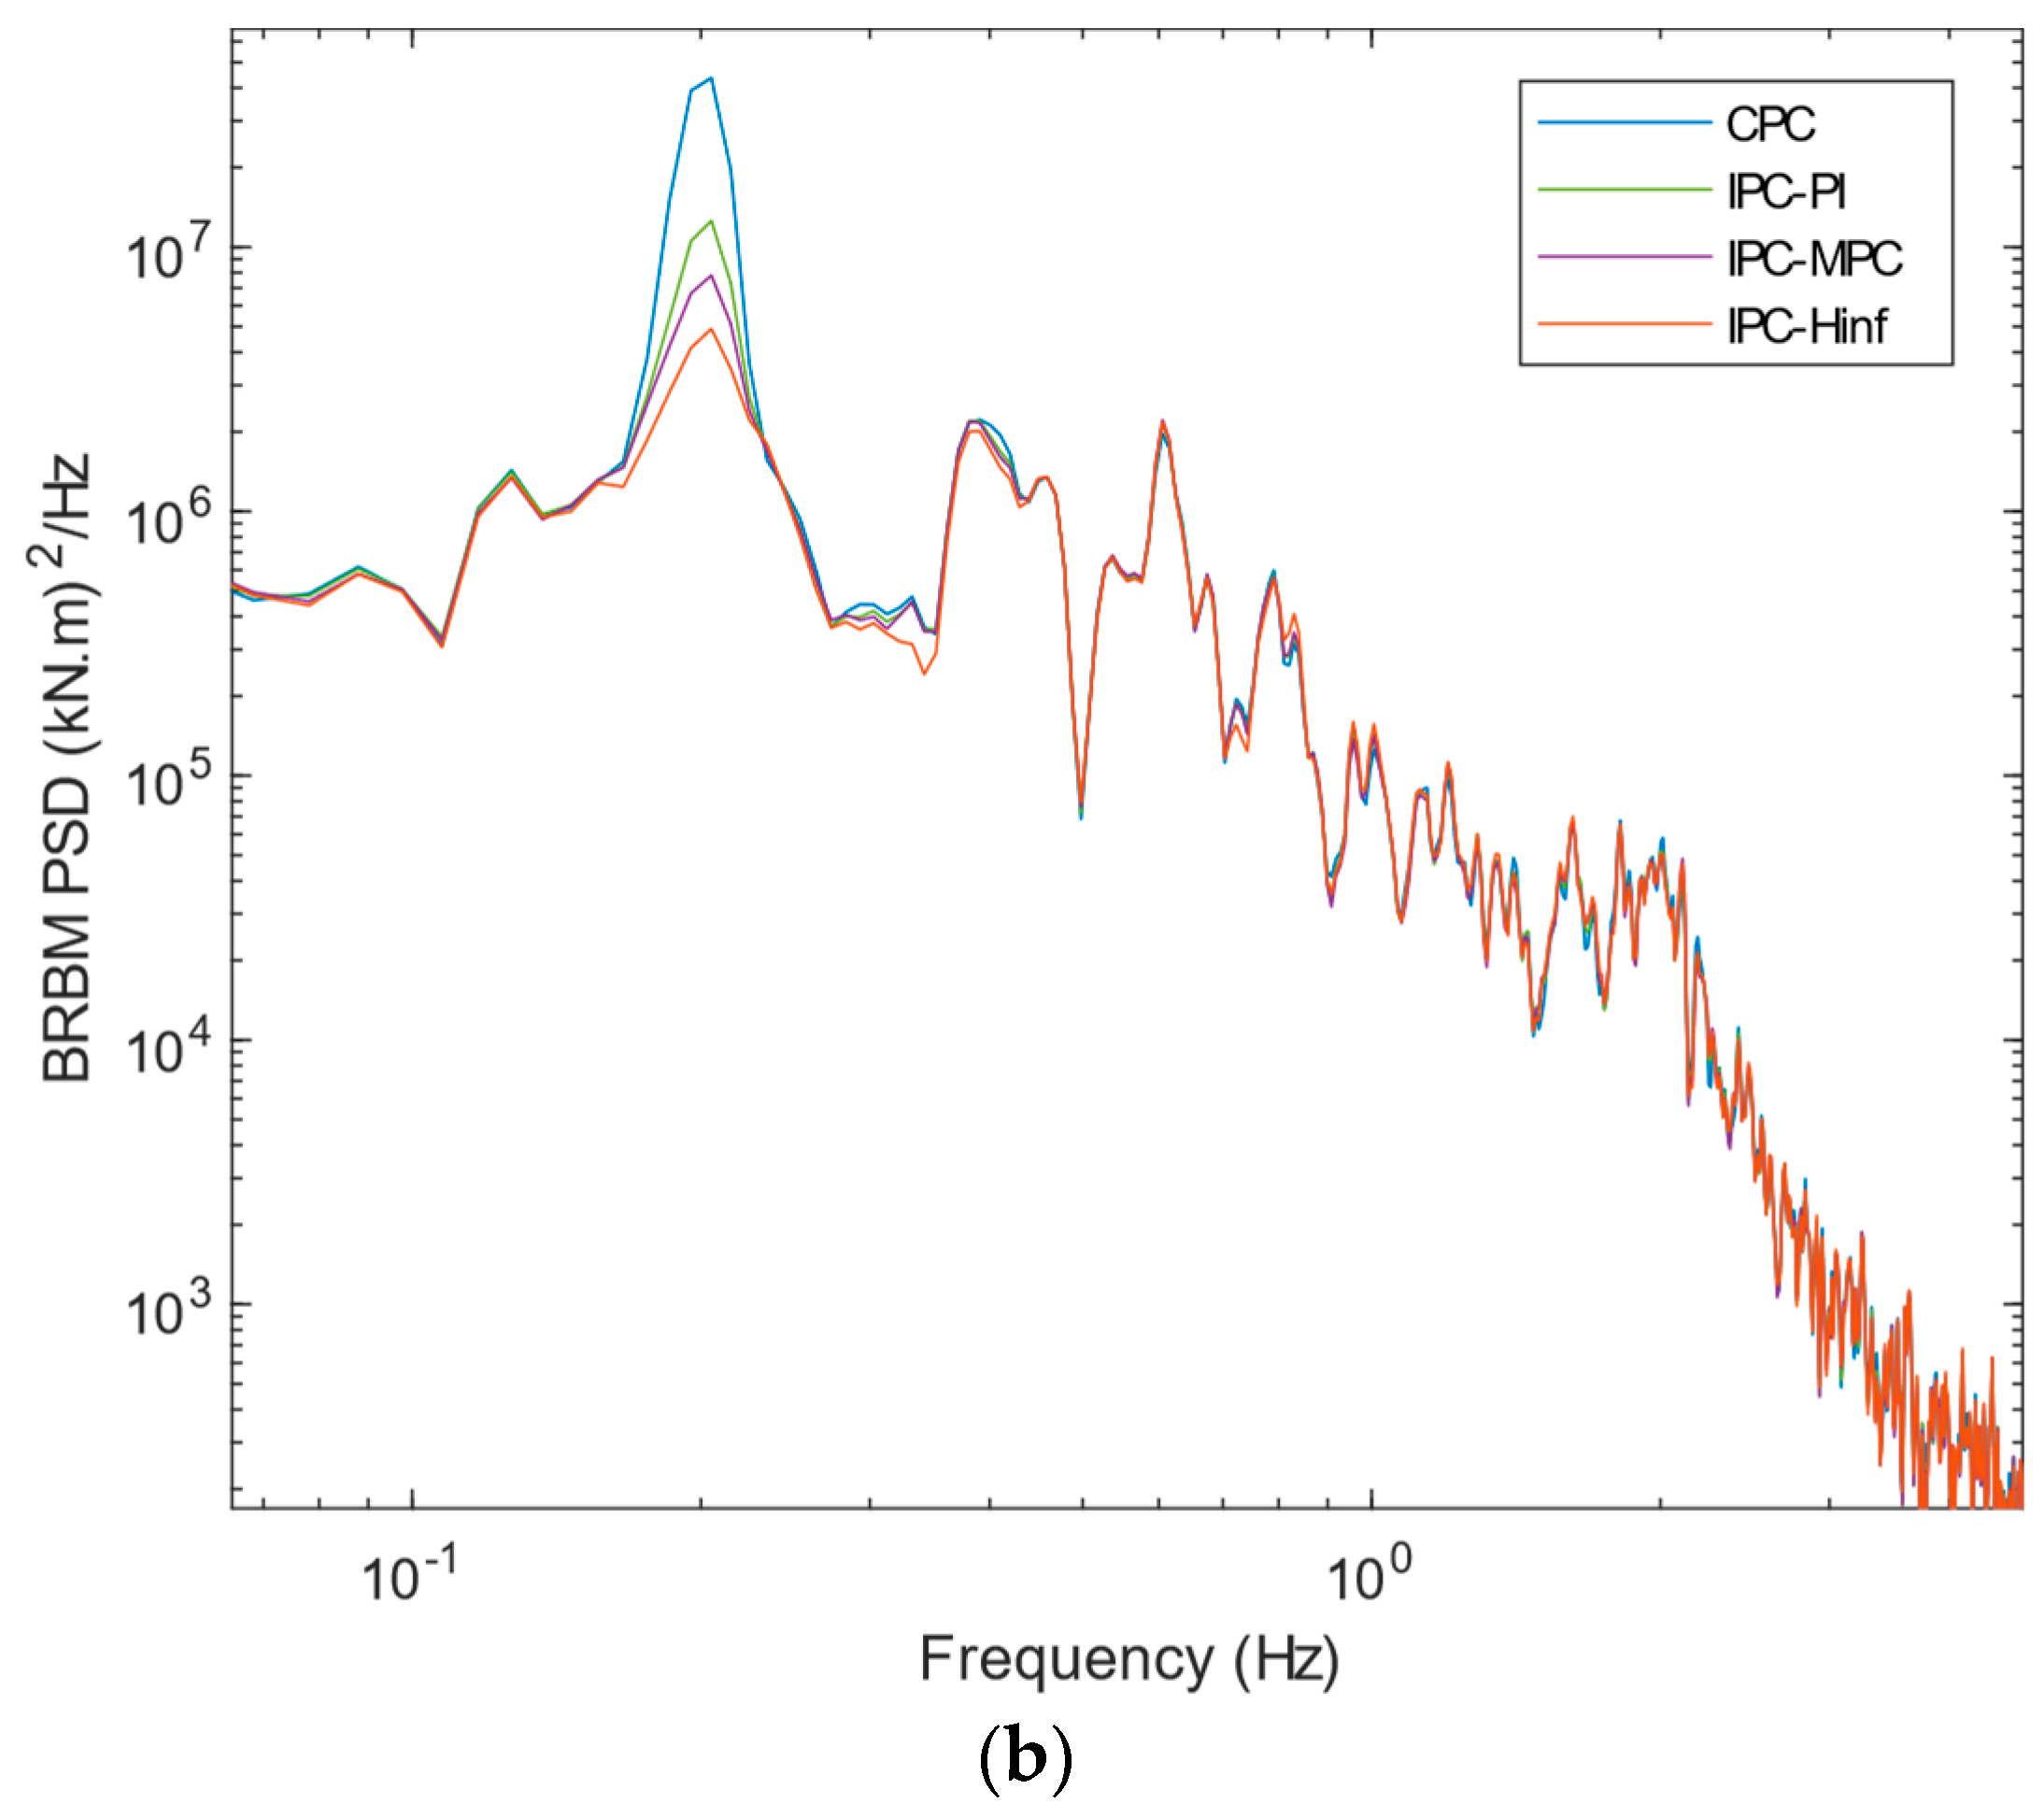
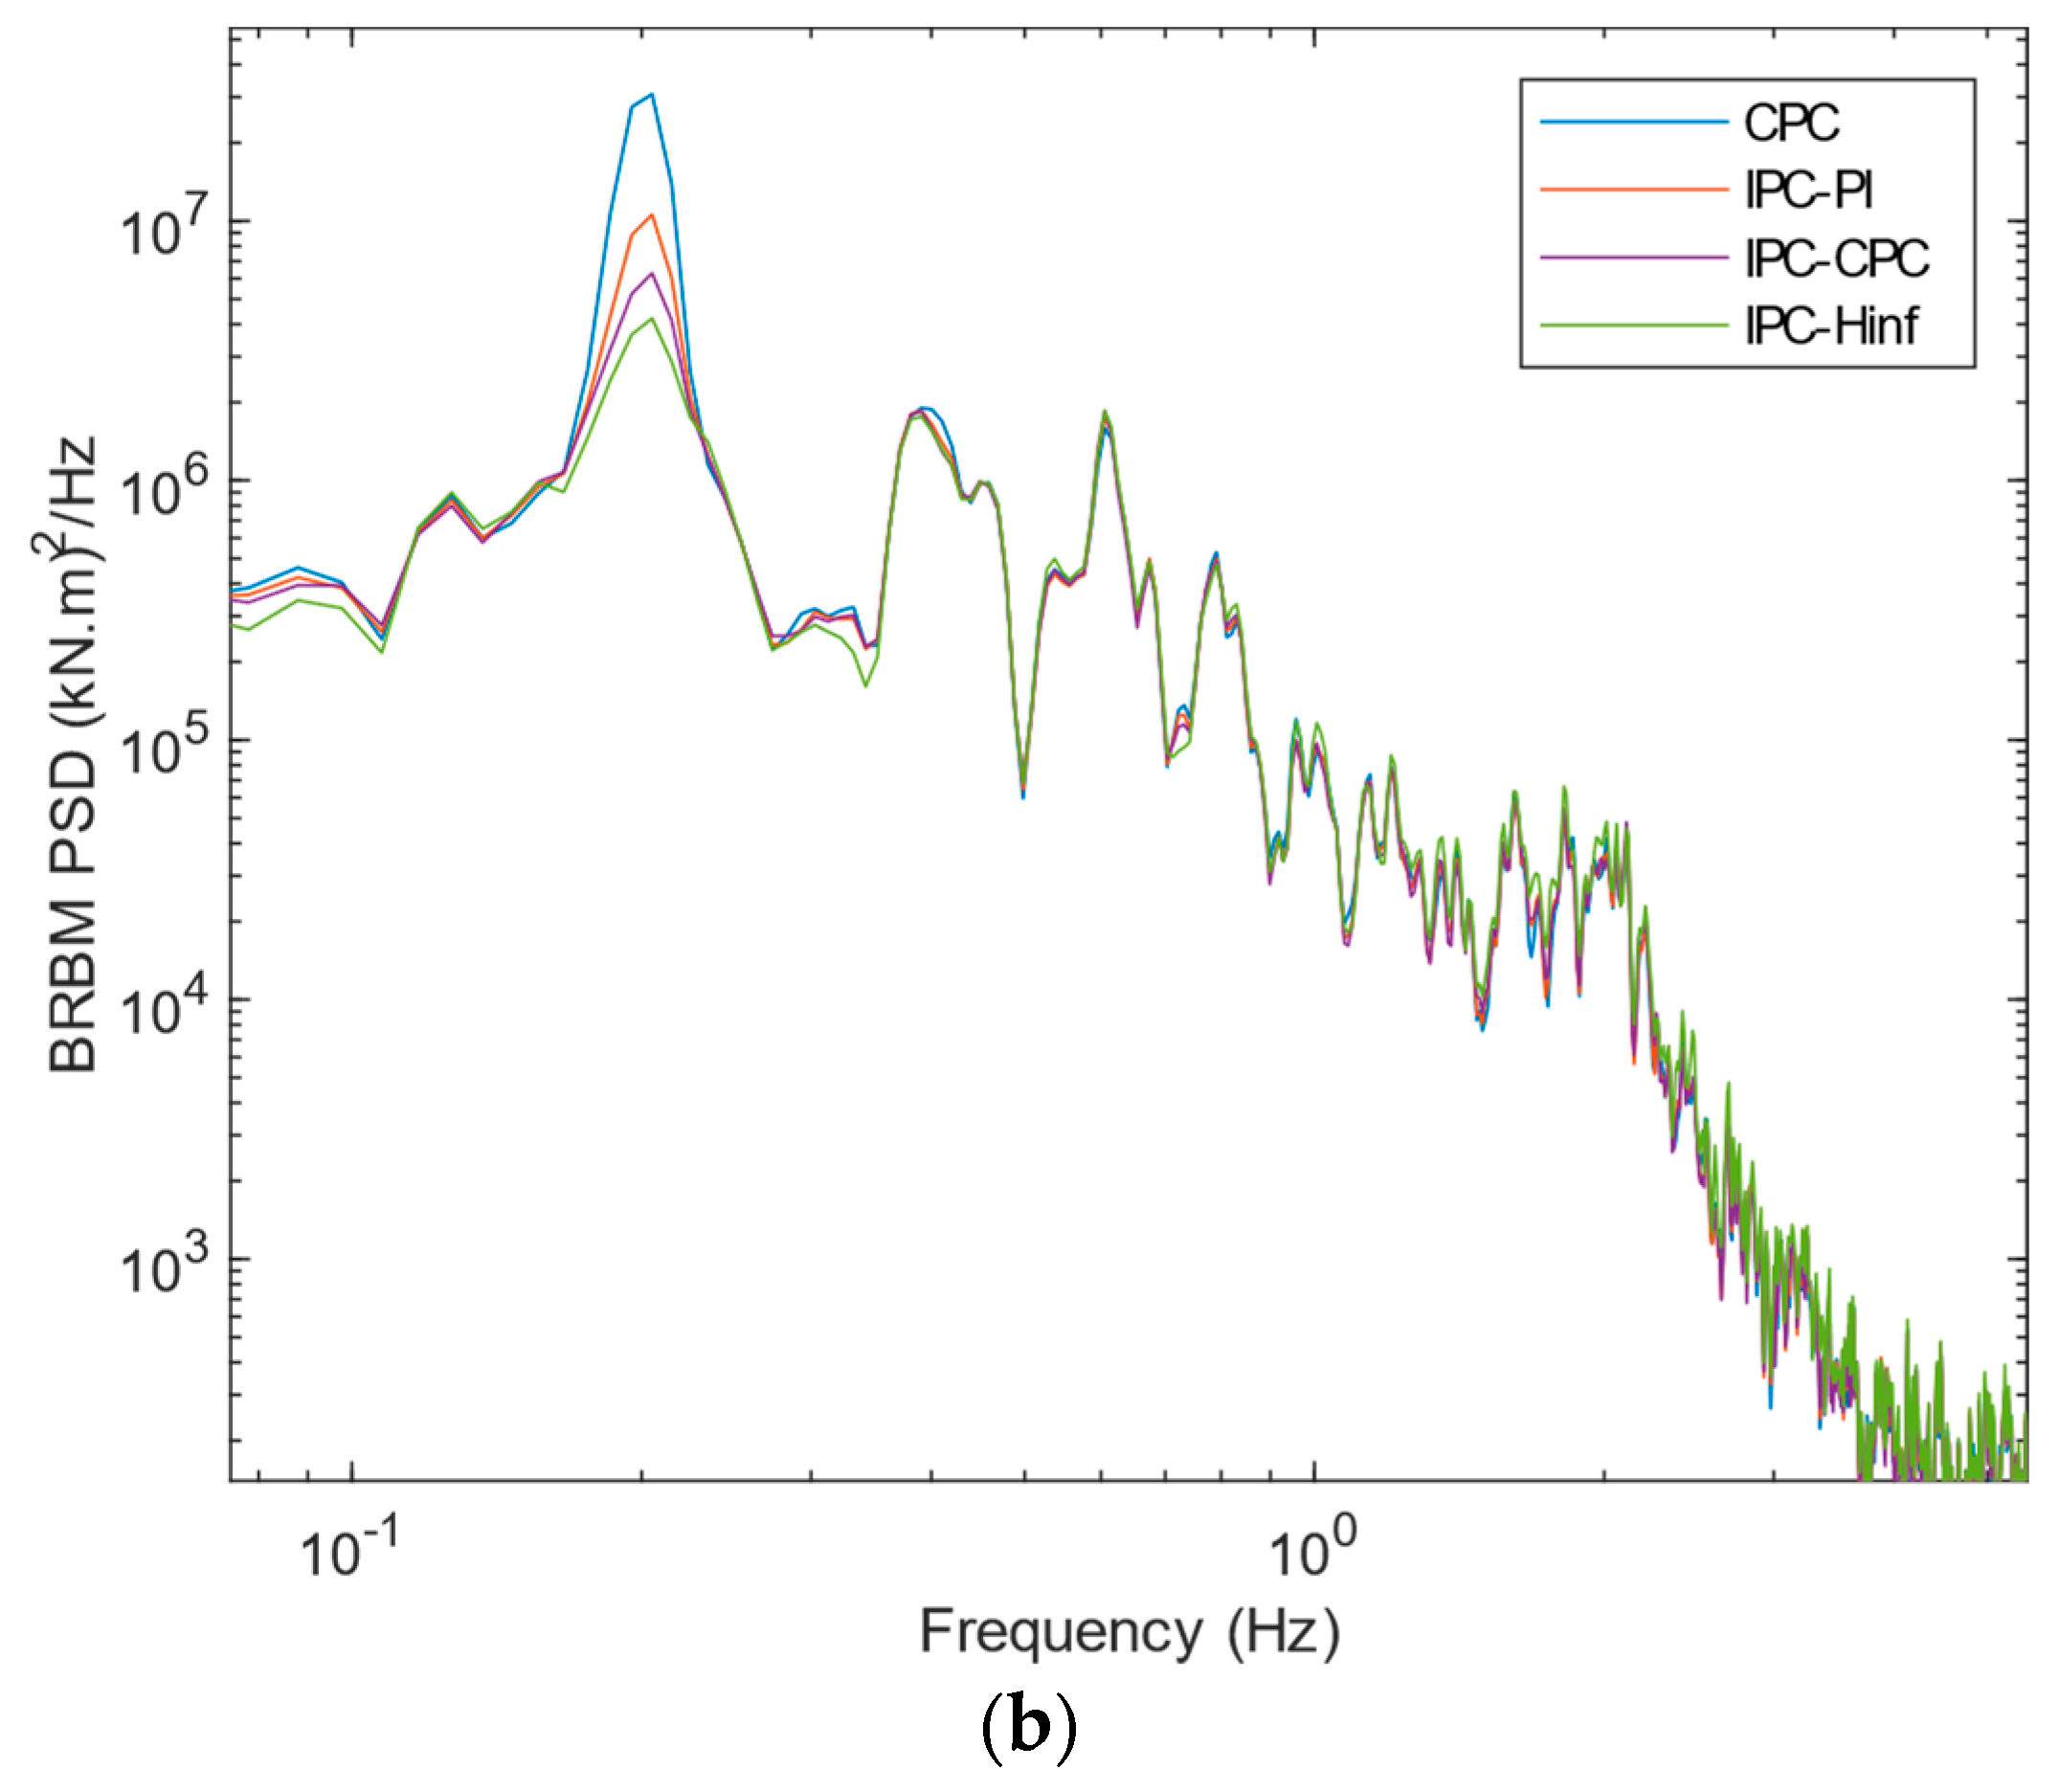
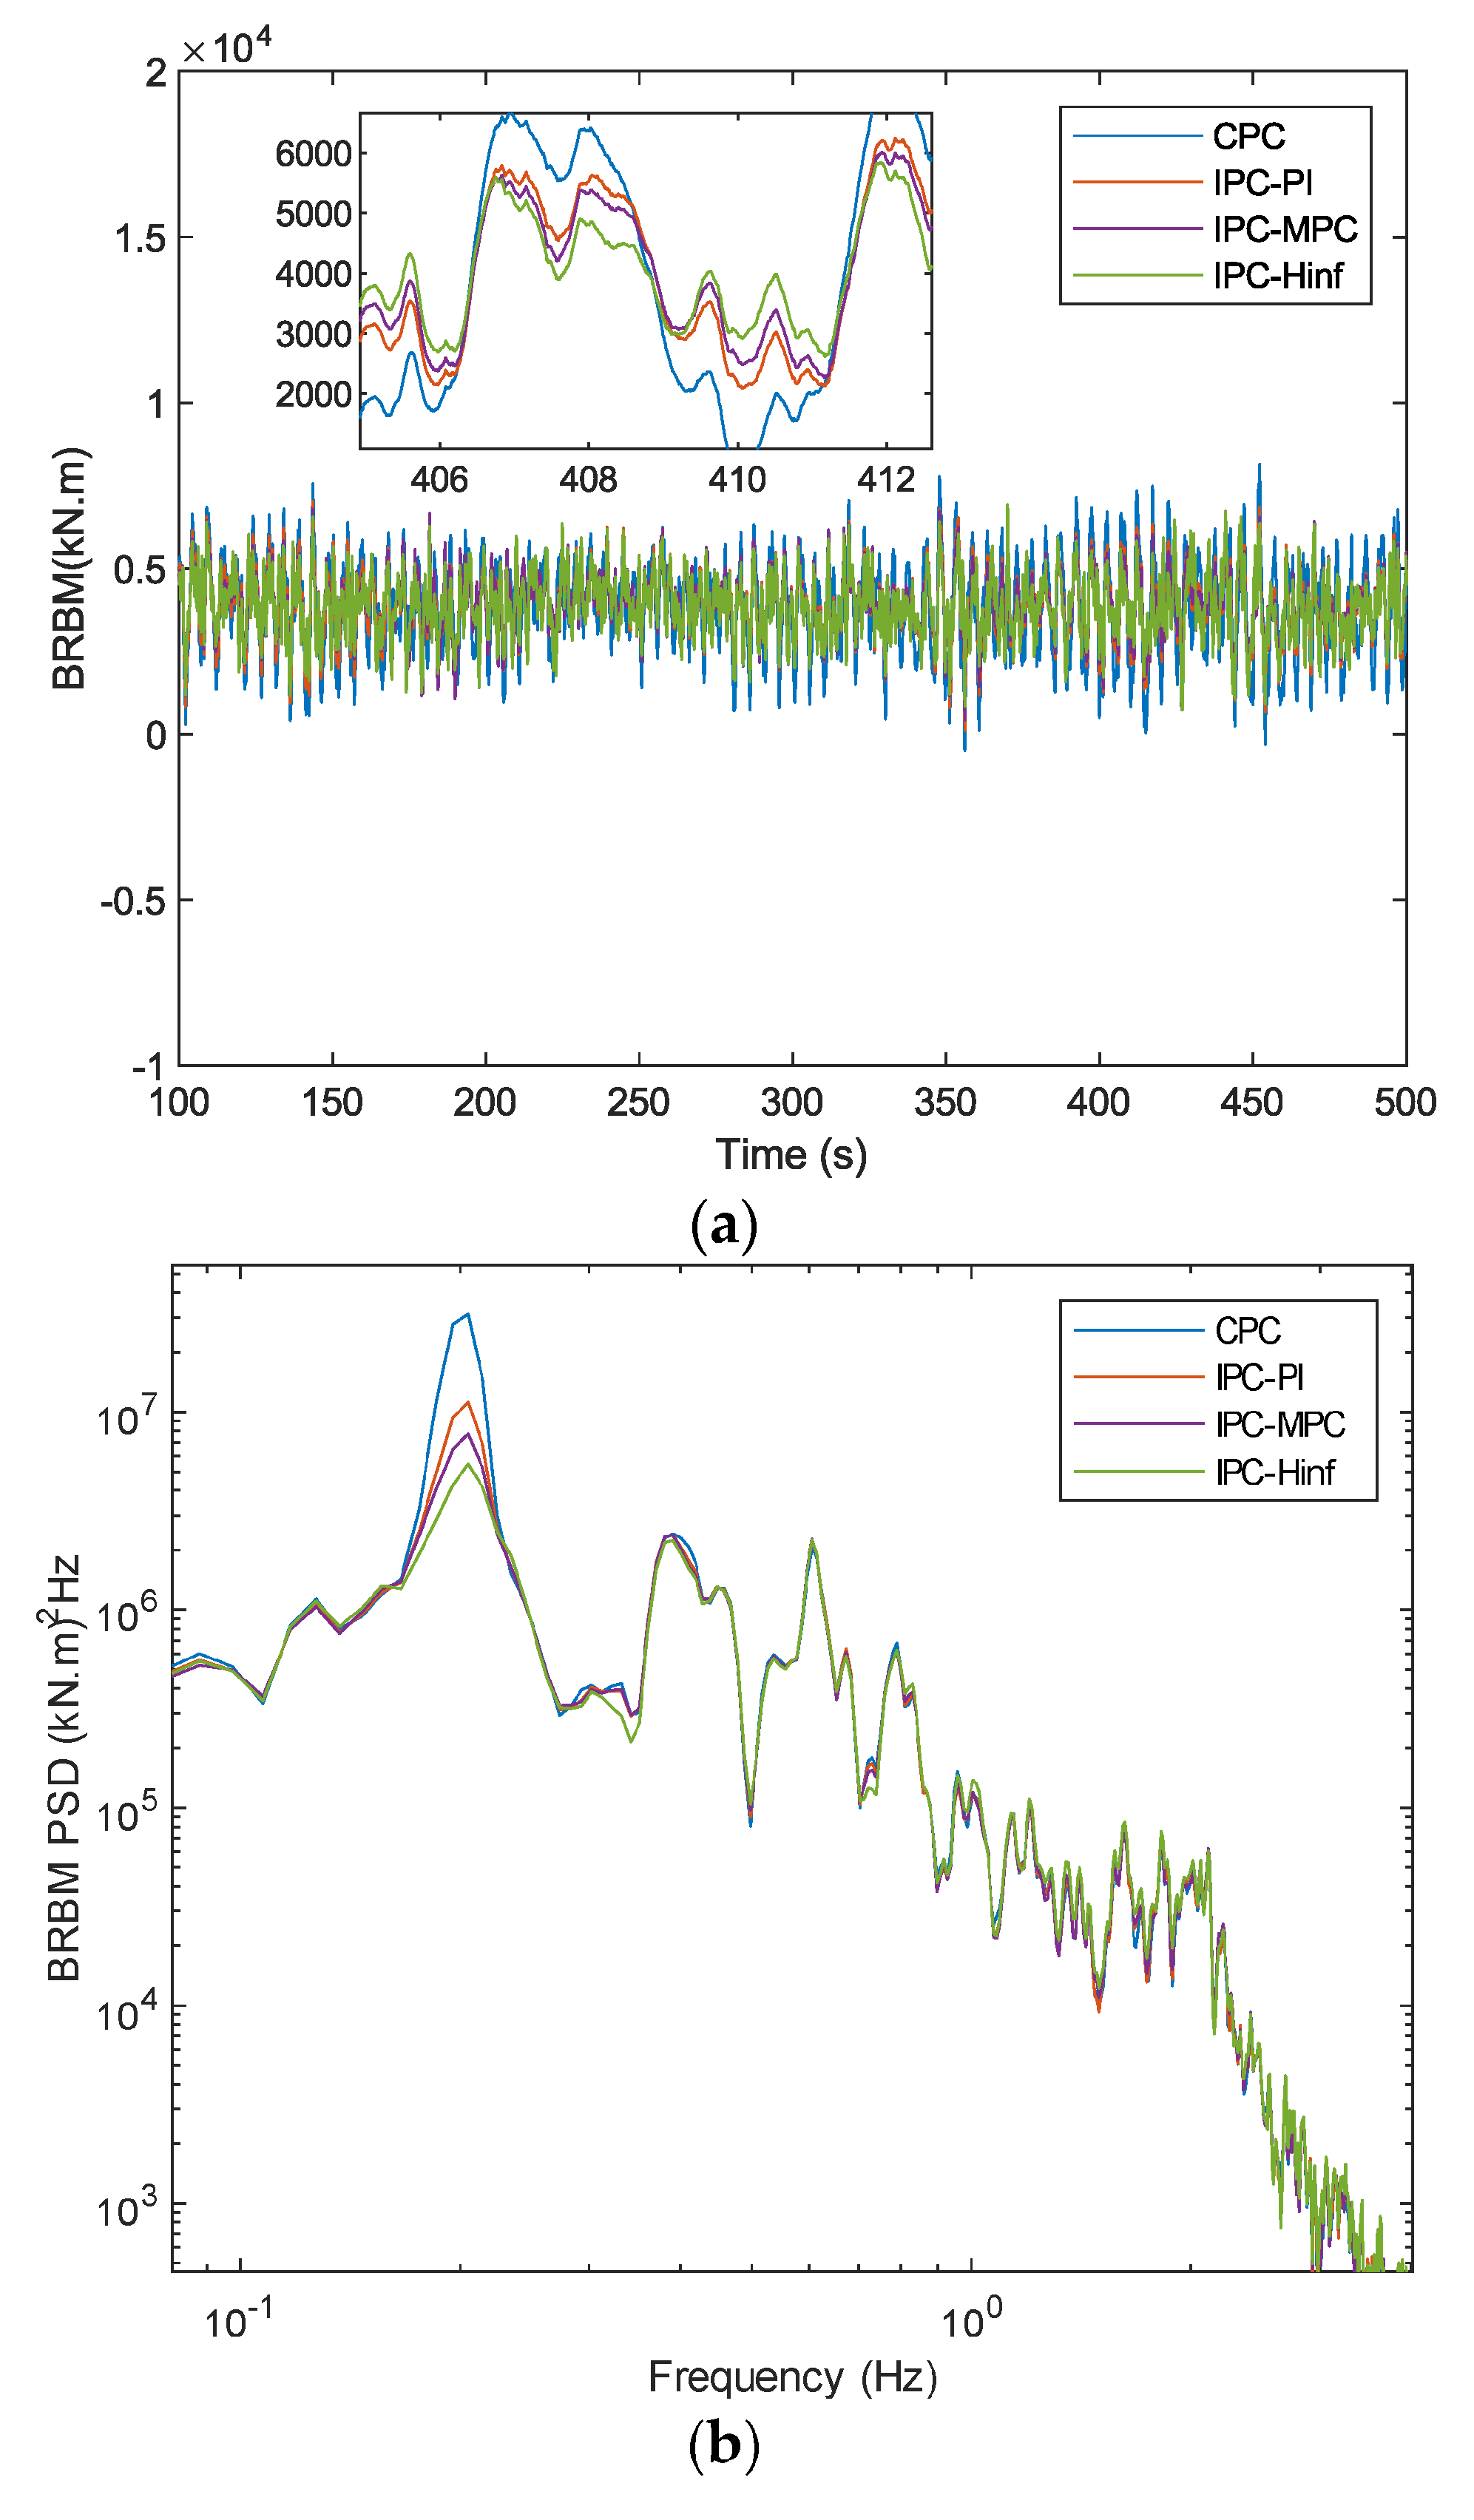
  • In this study, first, a CPC is designed and tested against a full nonlinear FAST 5 MW NREL wind turbine in Matlab/ SIMULINK. Subsequently, IPCs have been applied to alleviate the periodic loads at different turbulent wind speeds. This work demonstrates a comparative performance analysis of existing IPC controllers rather than the introduction of new algorithms through comprehensive simulation studies. The aim of this study is to project the load alleviation (BRBMs) performance and DEL studies (lifetime analysis) by using time and frequency domain methods at varying wind speeds with different turbulence intensities and also with EOG conditions. From PSD plots, it can also be noticed that the peak at 1P frequency is reduced significantly without compromising the power generation of the wind turbine. Moreover, IPC- H  outperforms the other reported controllers in this study.
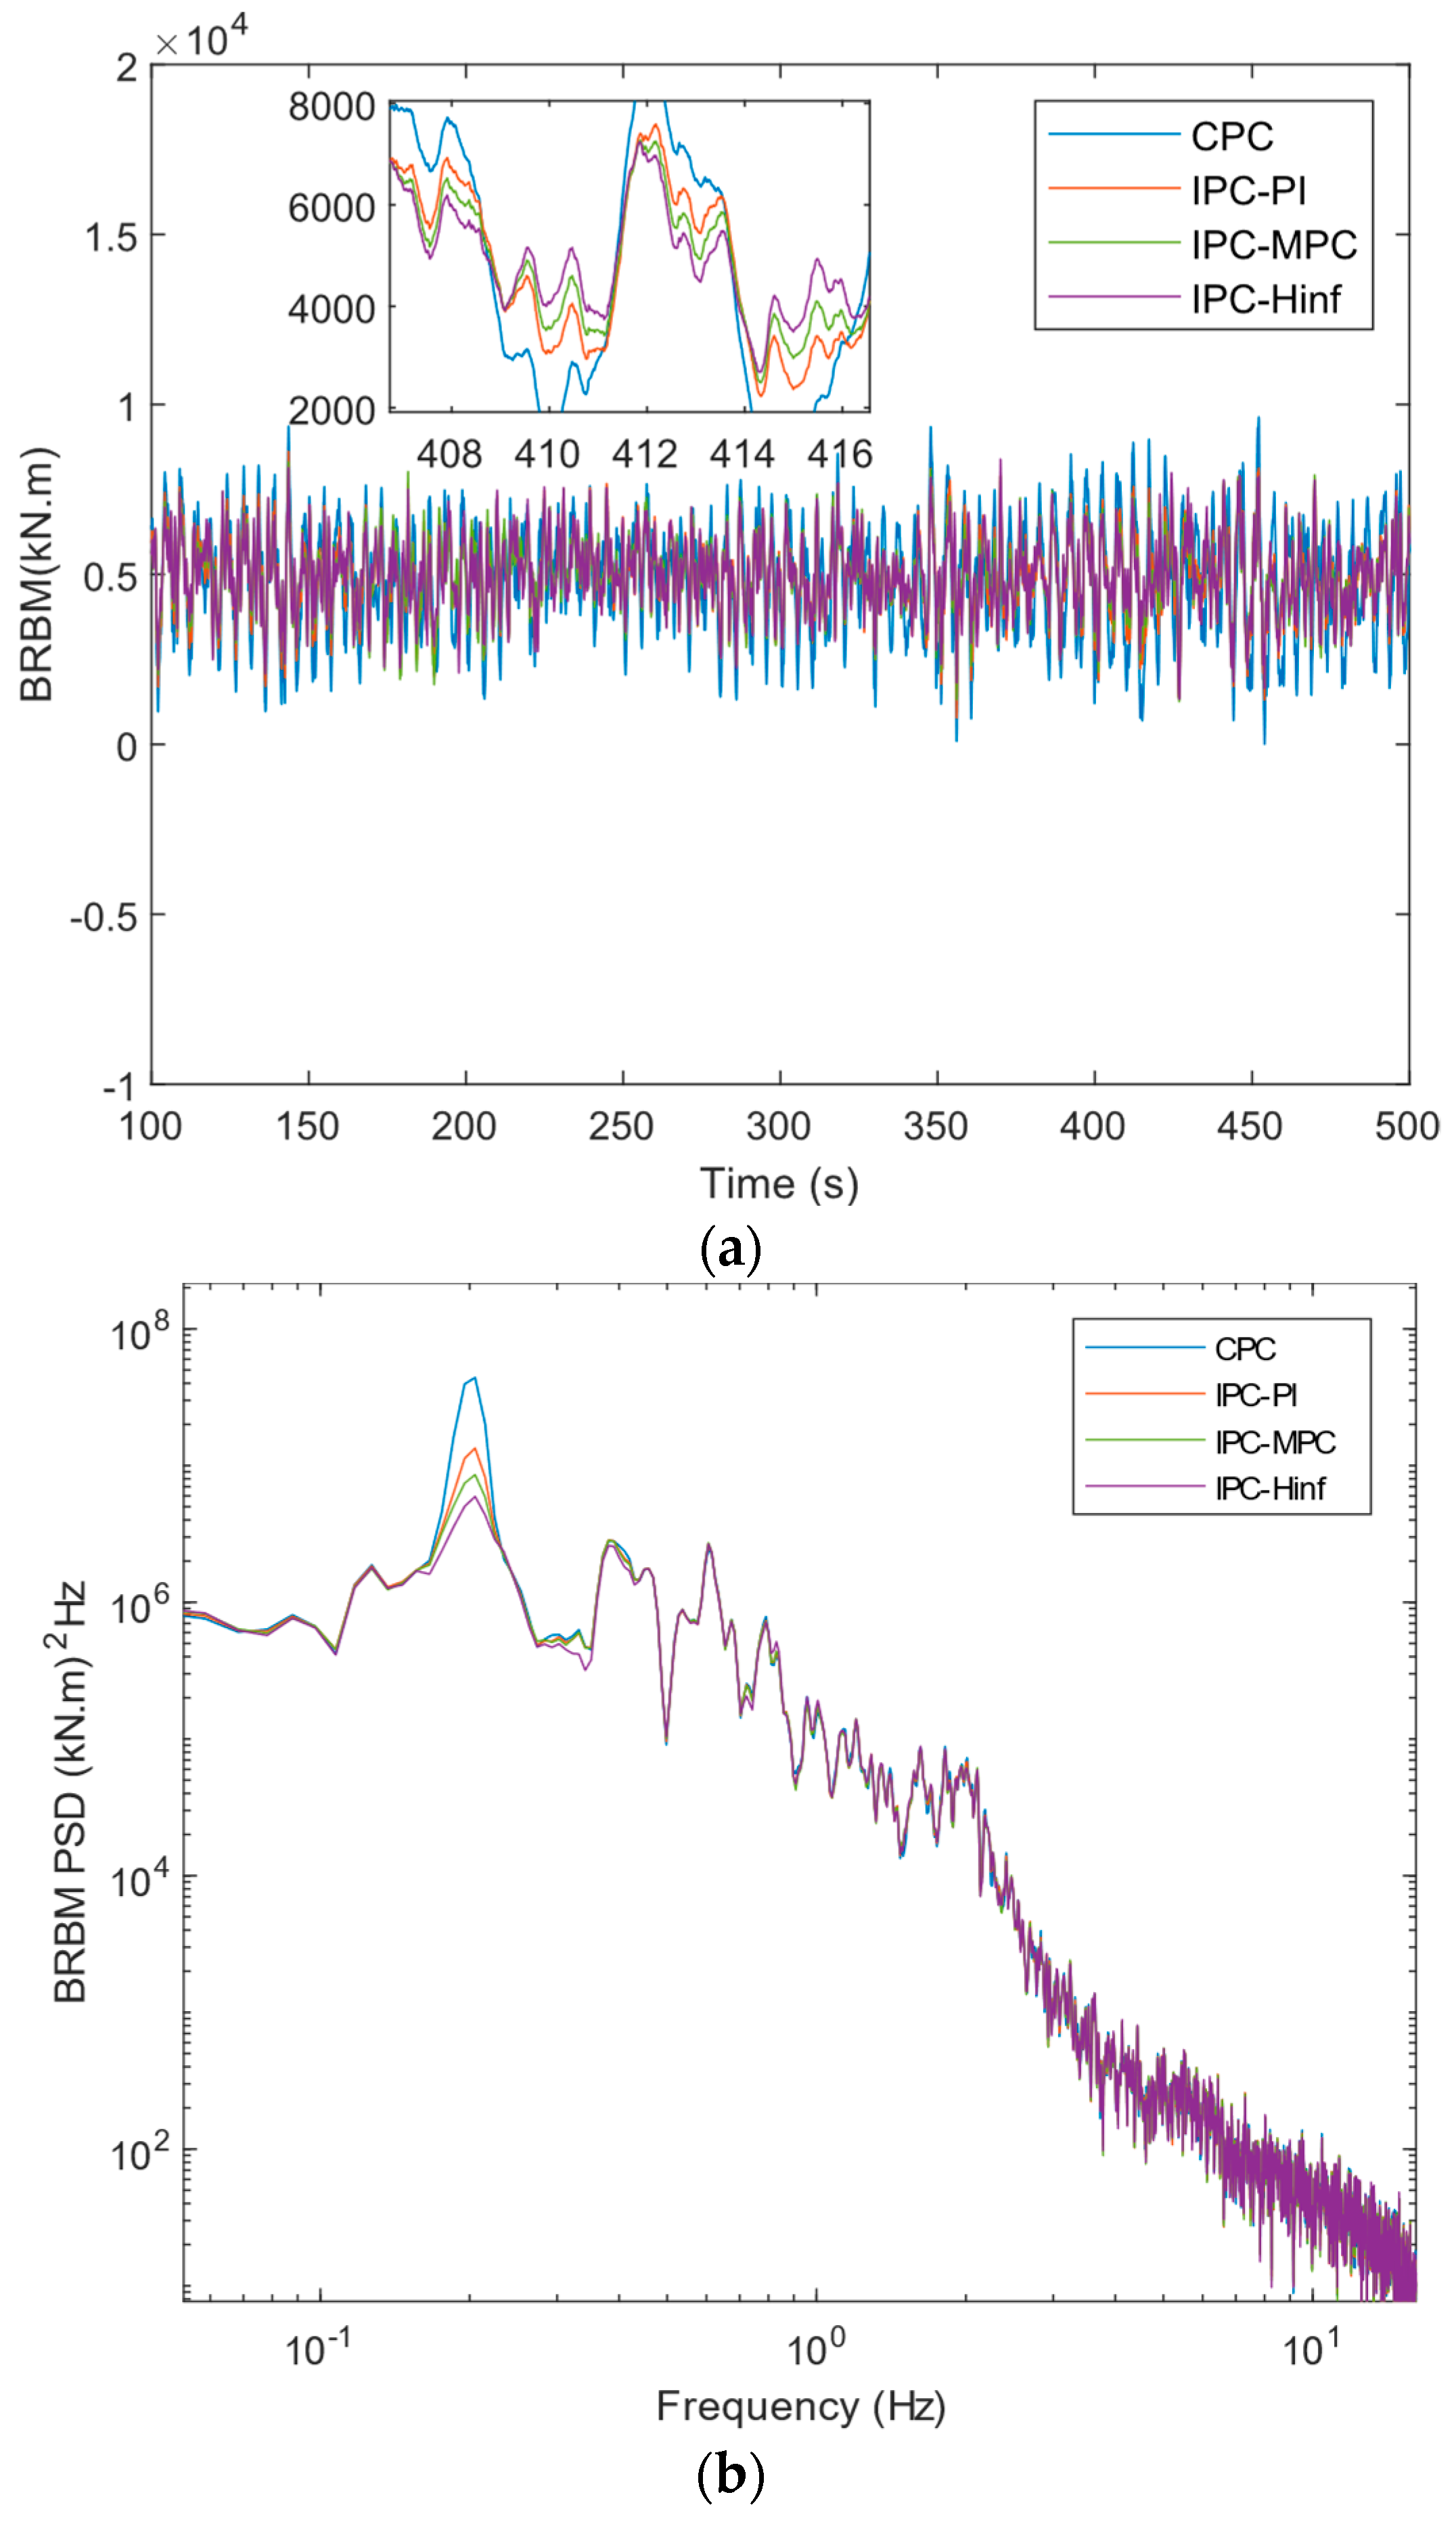
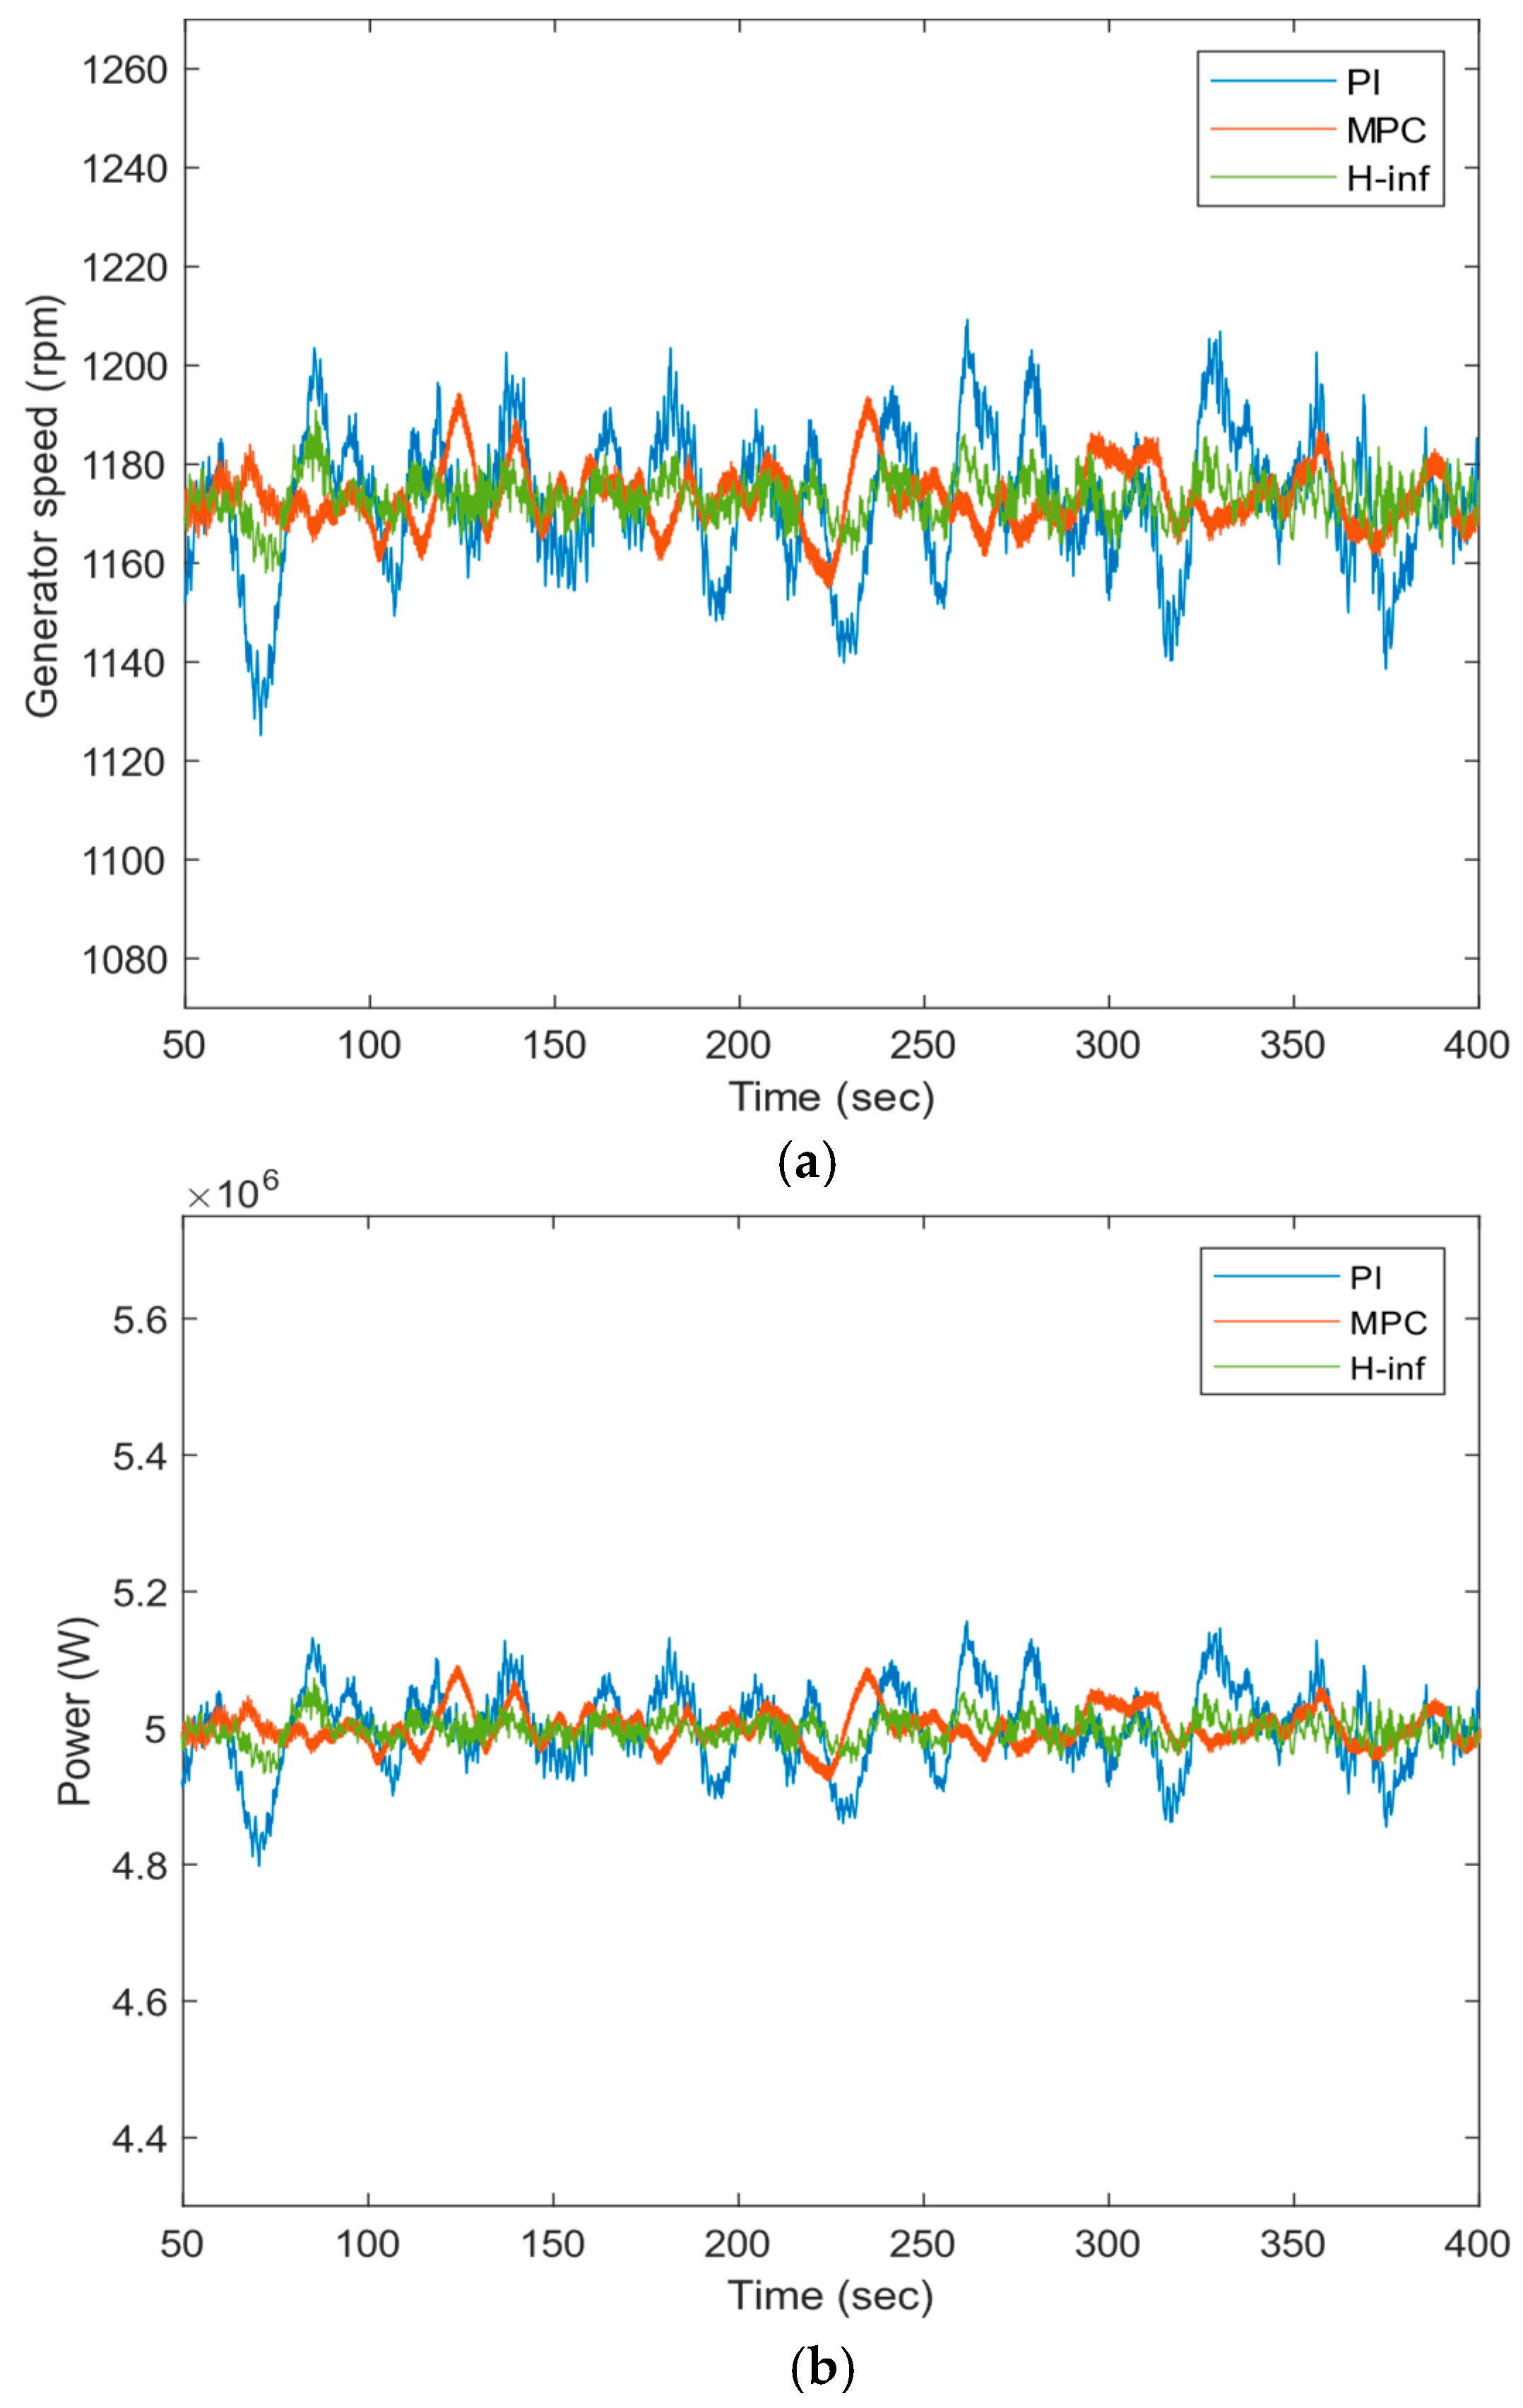
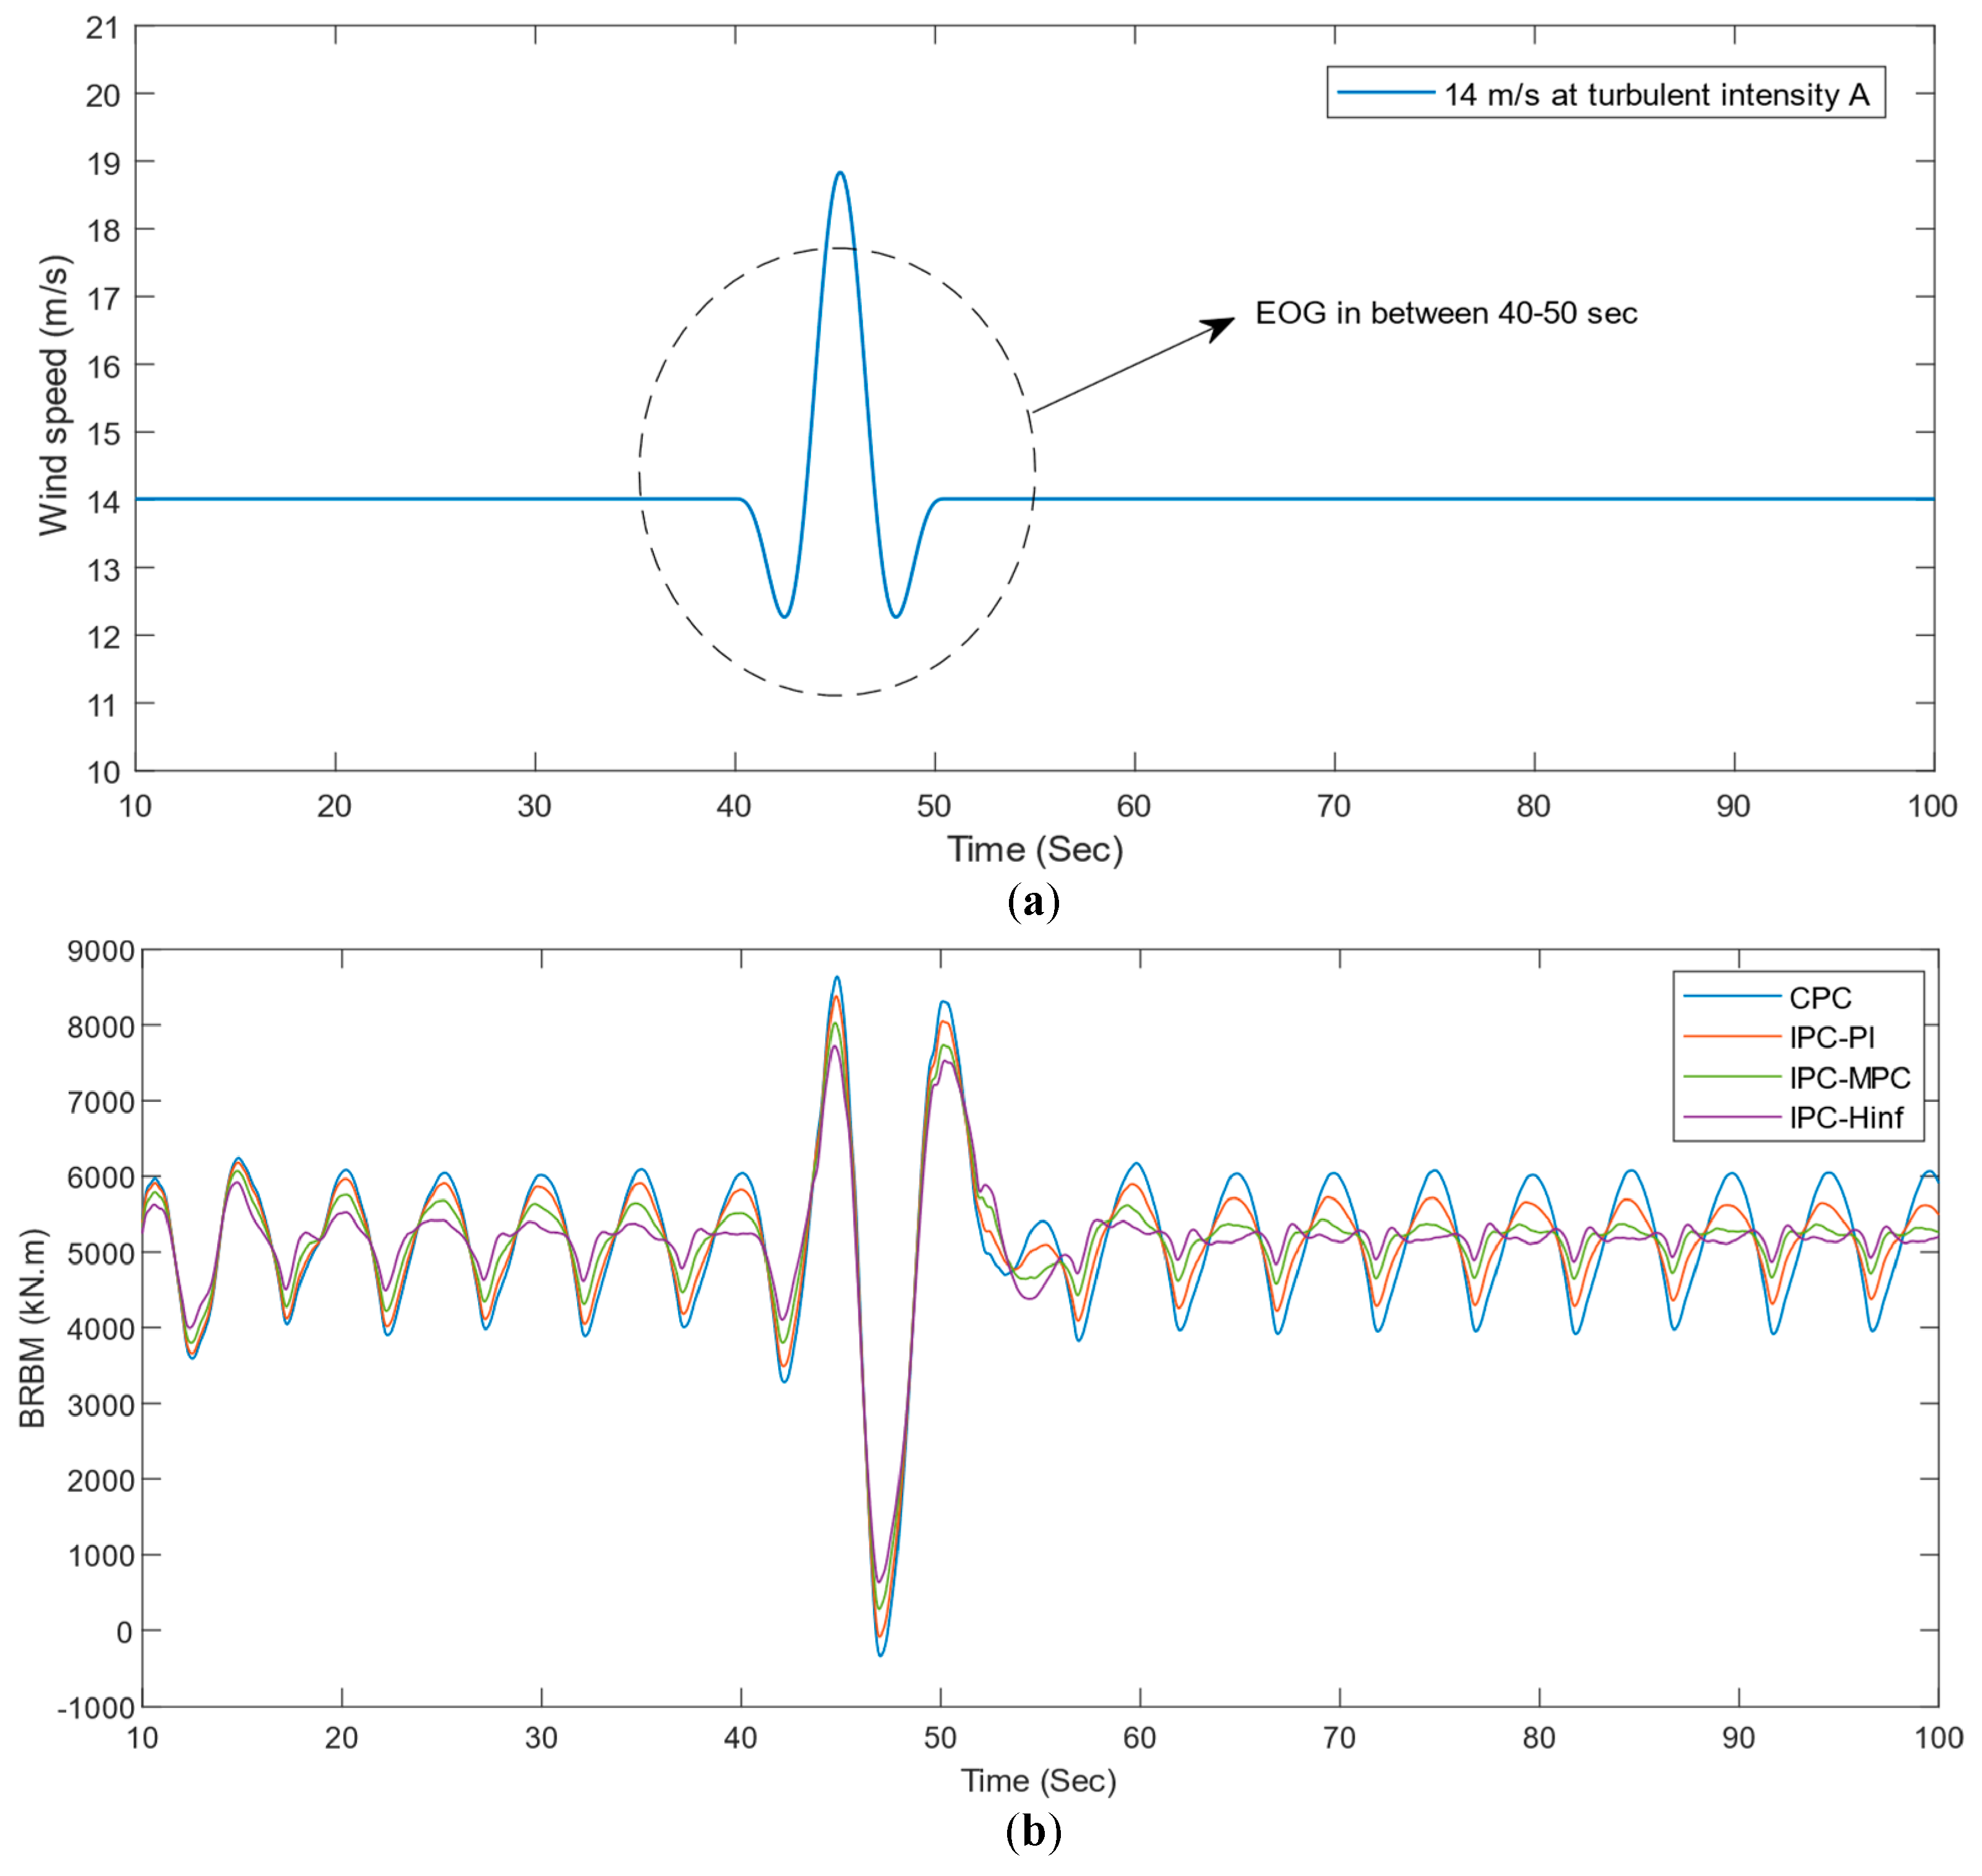
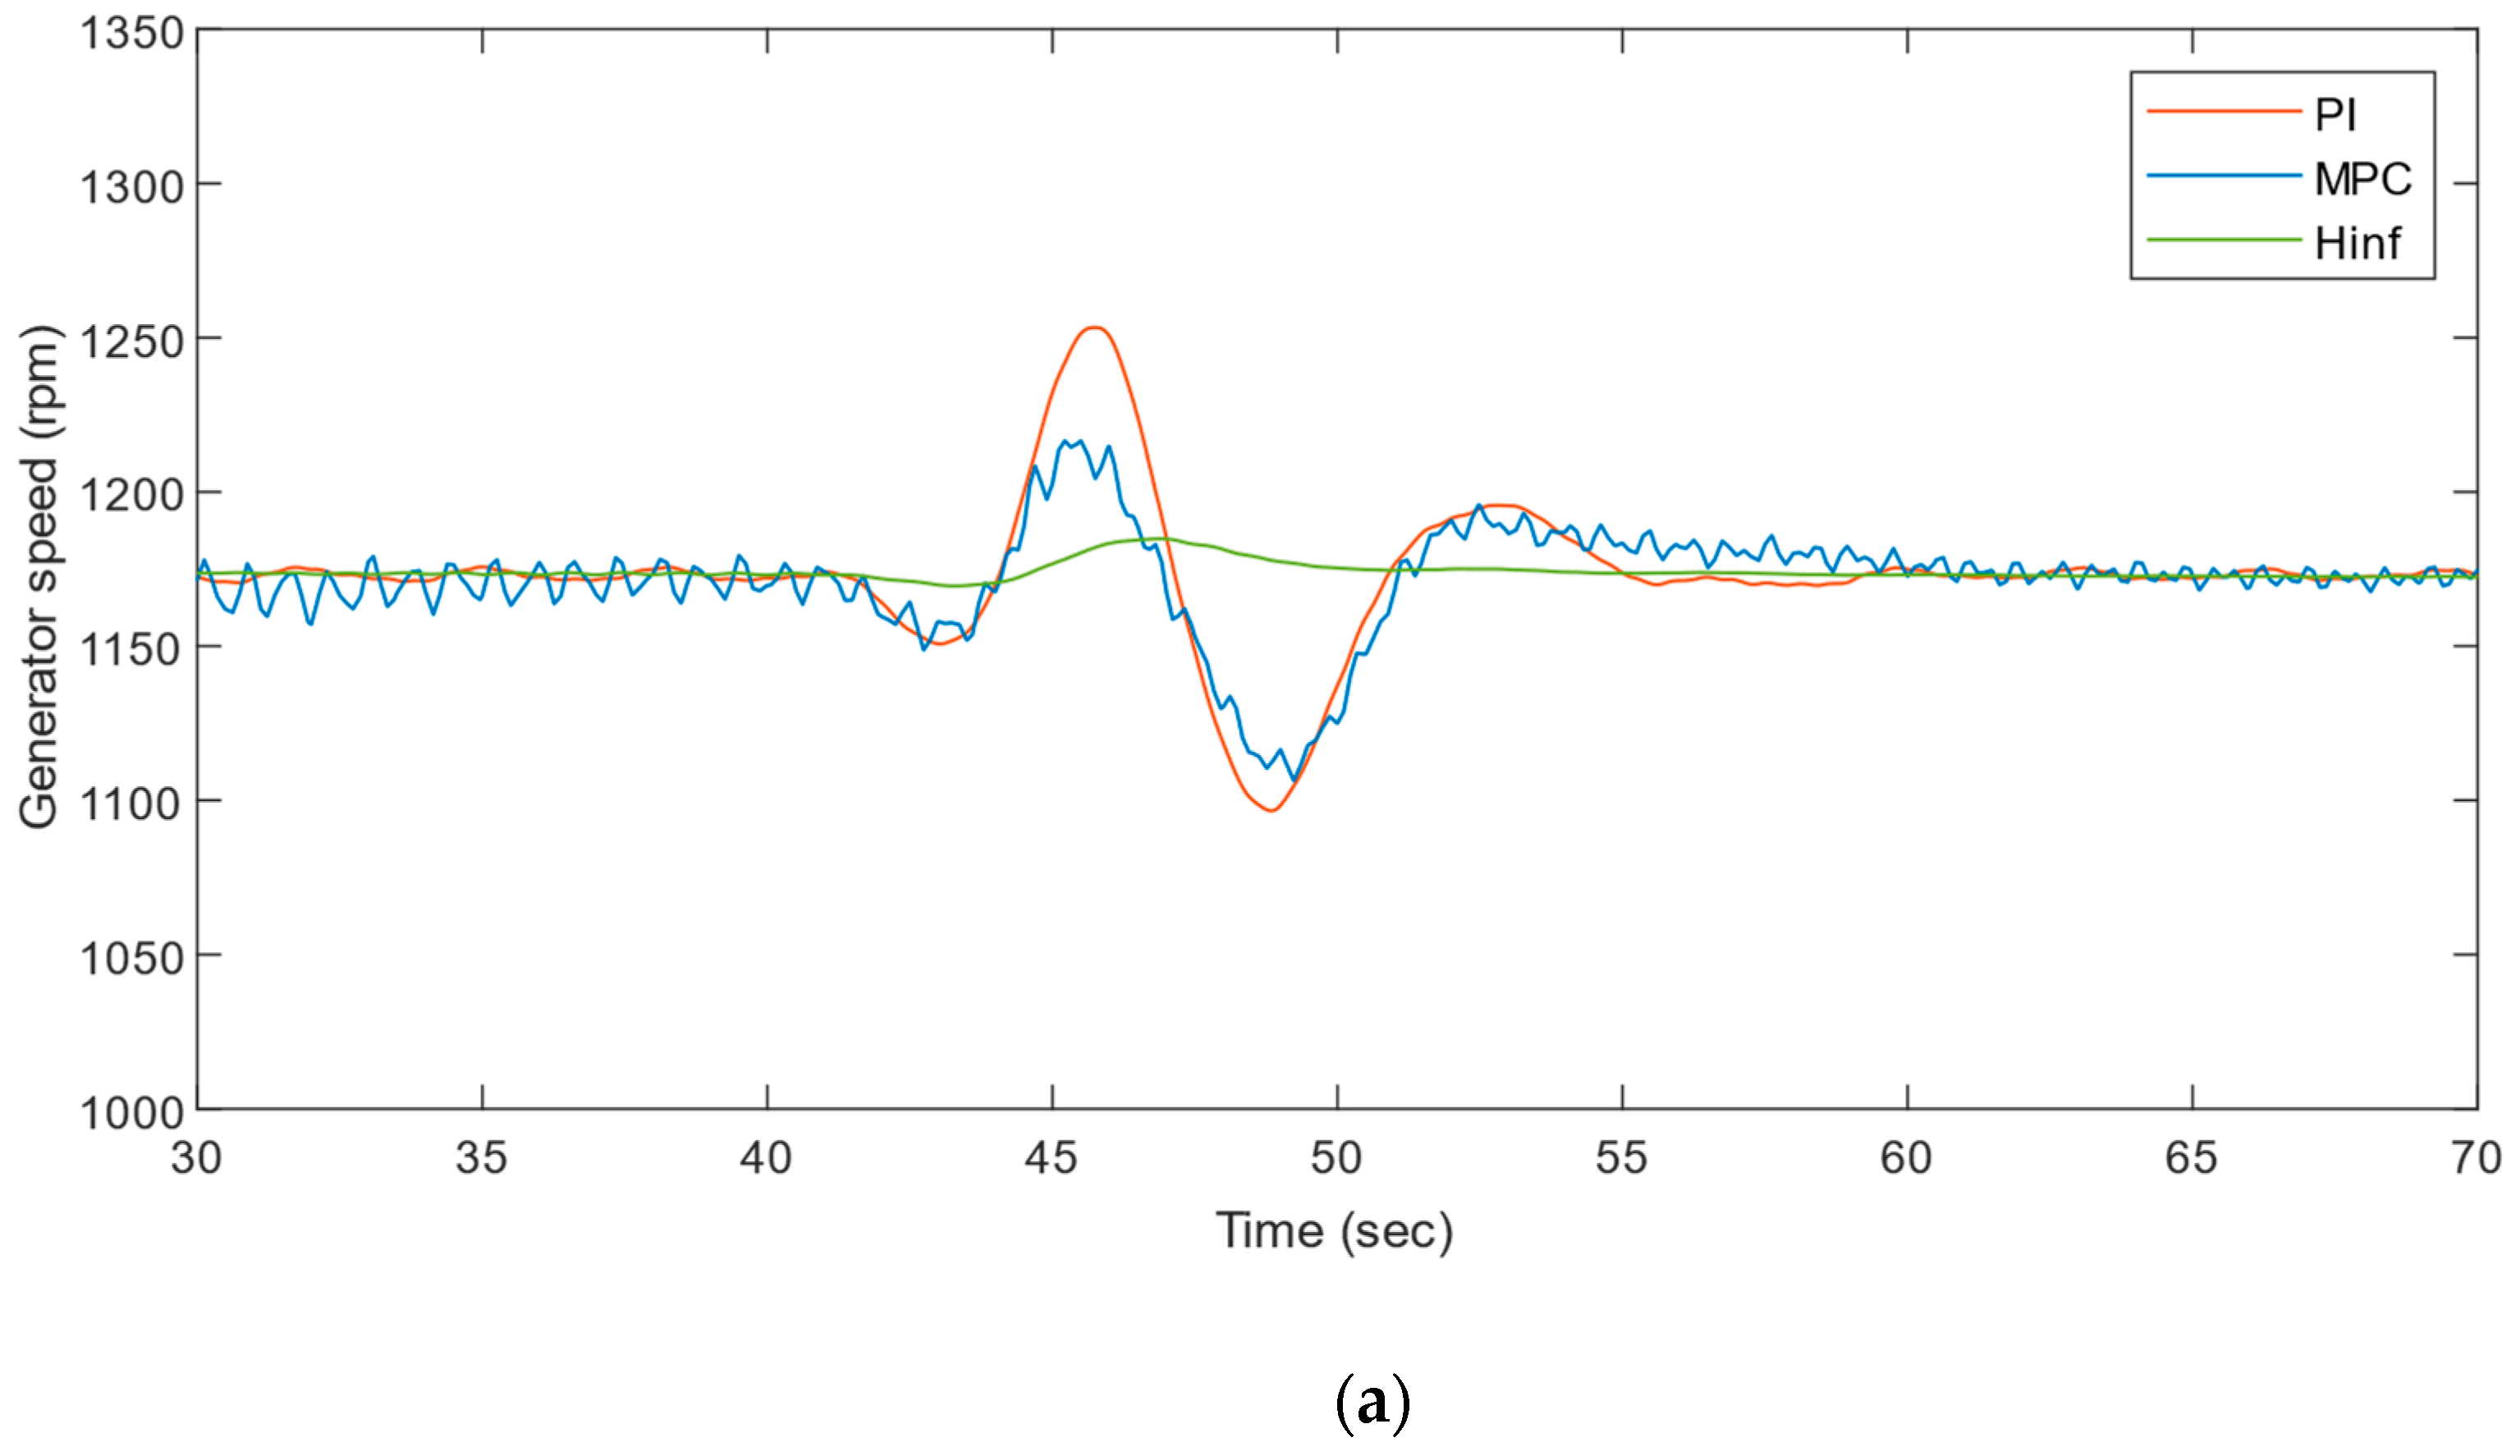
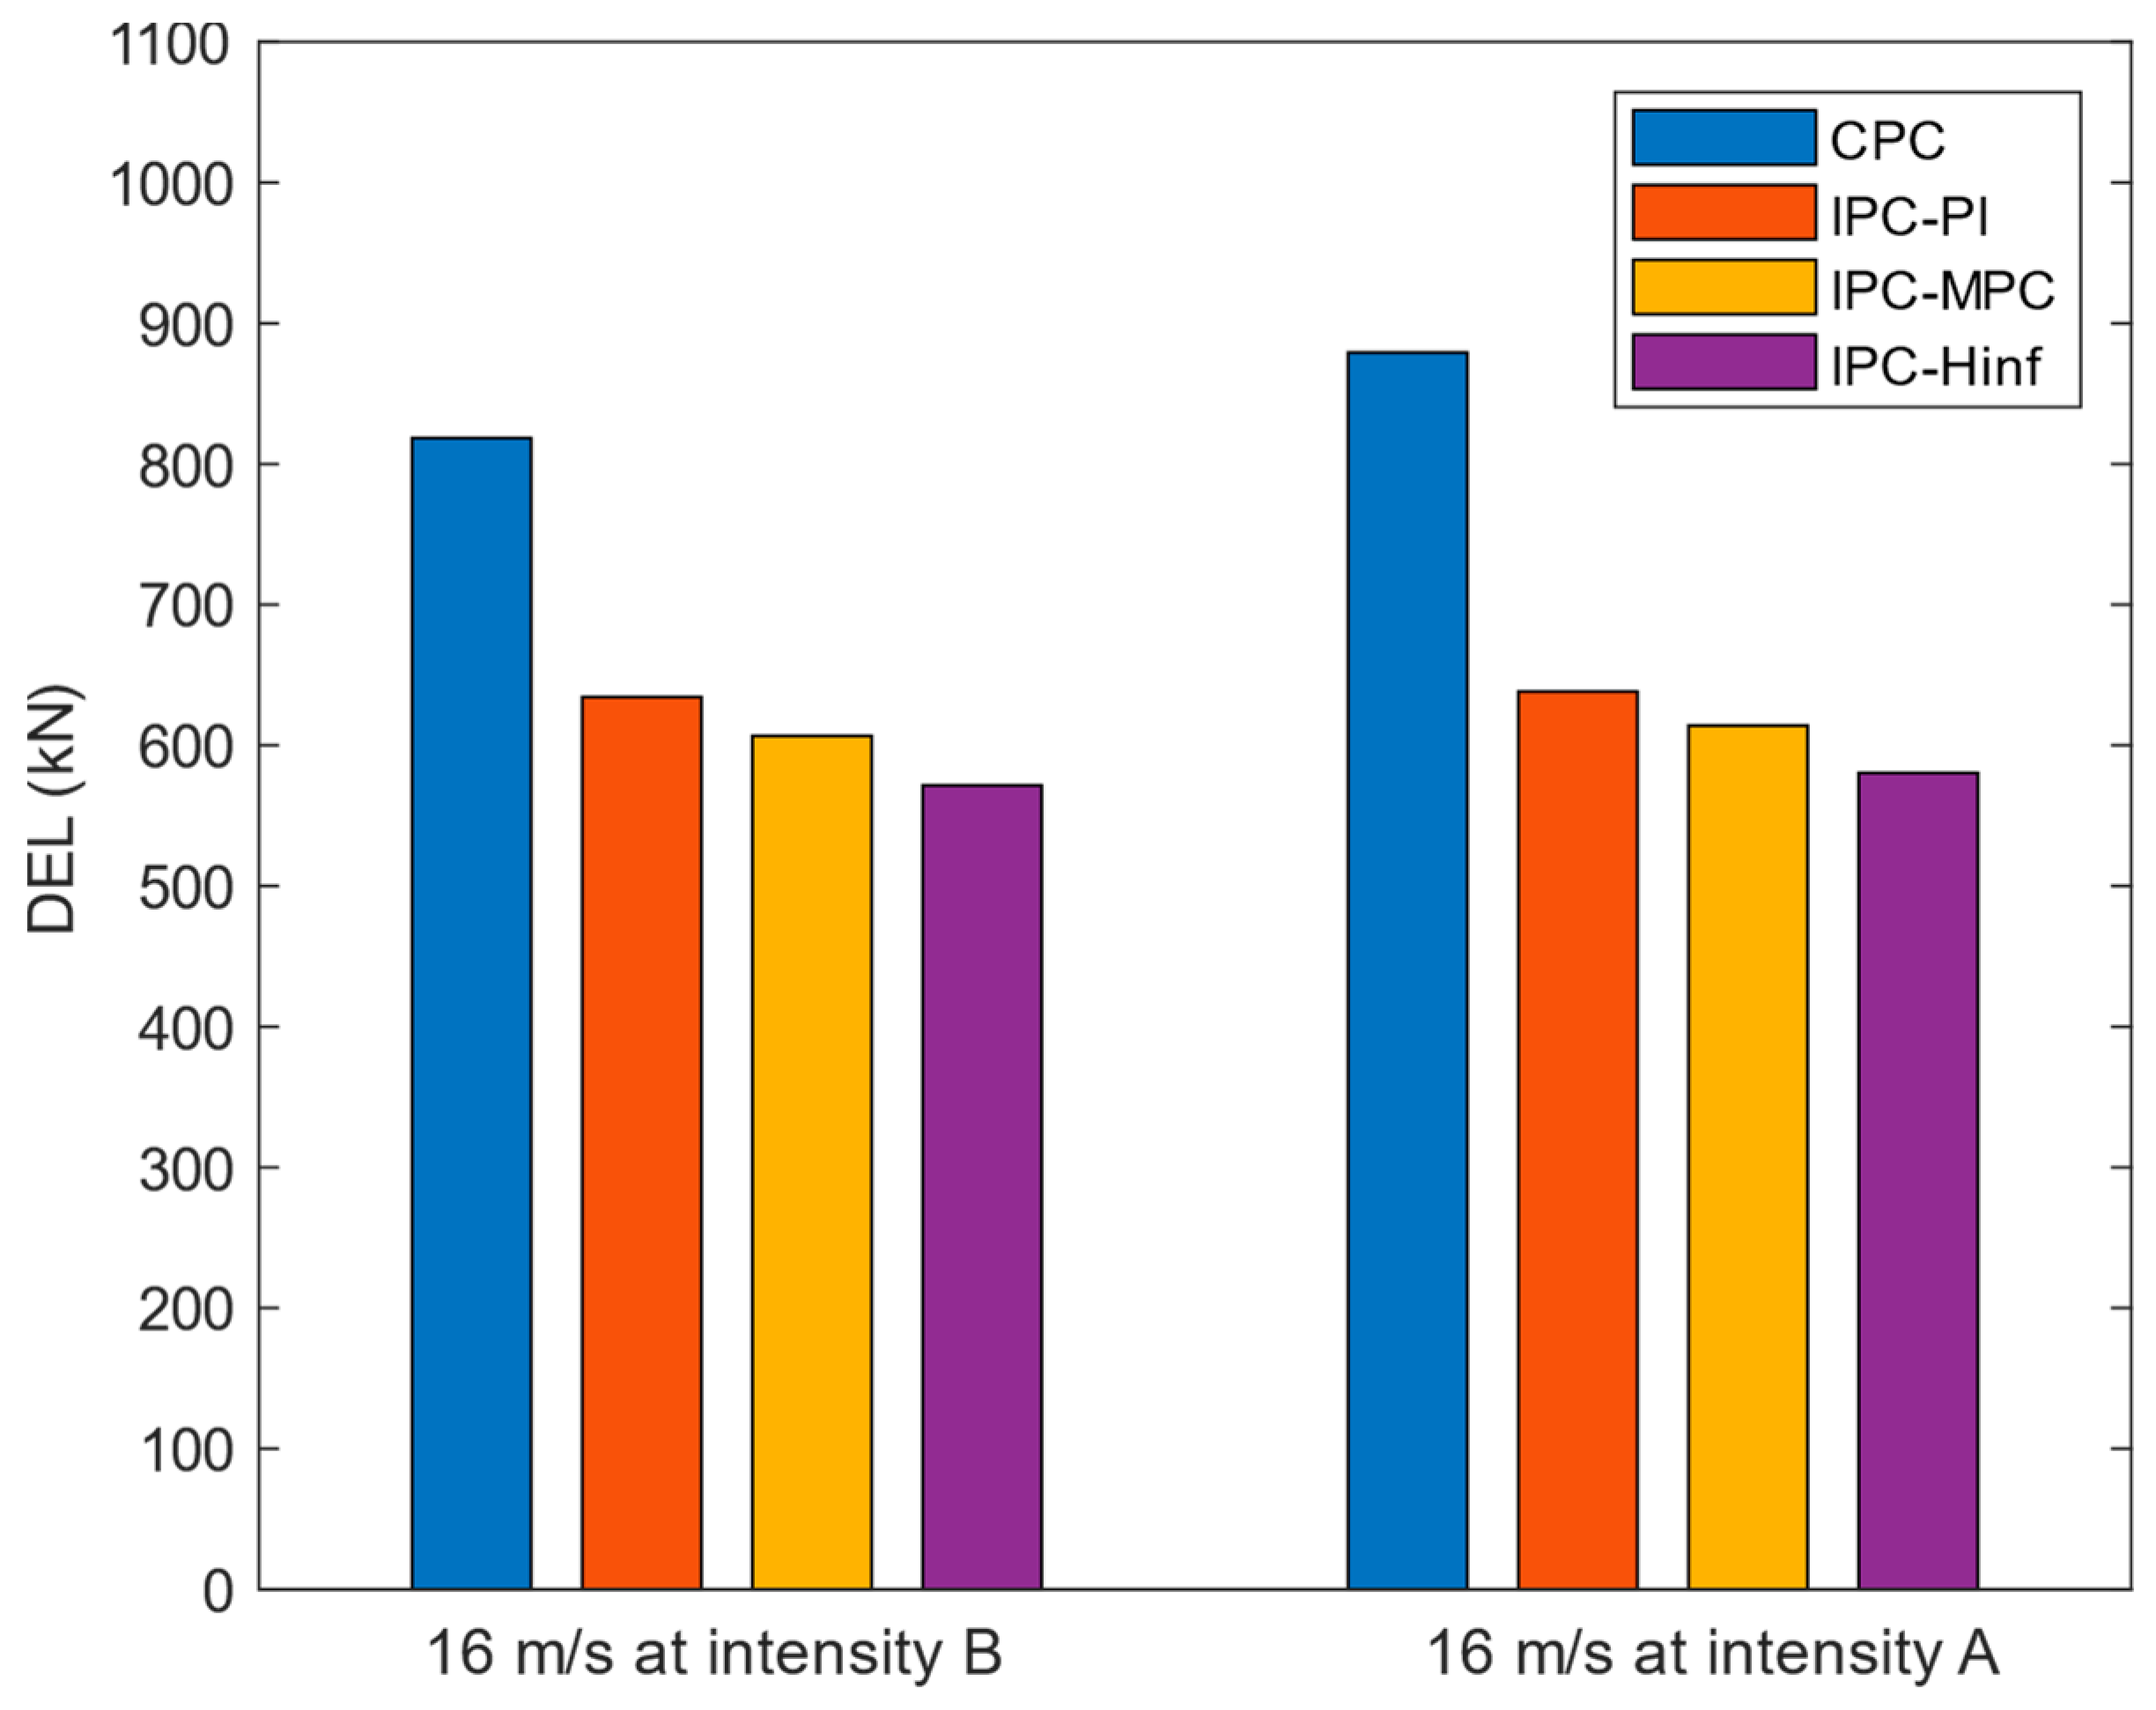
  • The generalizability of the reported controllers is projected using the different operating conditions. All reported controllers are applied with wind fields of different average wind speeds and turbulence intensities as recommended by IEC standards. The quantitative results of the comparison of the performance of the reported controllers are carried out. Also, the performance of controllers is tested with EOG-type wind speeds to study the transient responses, signifying the better performance of the  H  controller in terms of the reduced BRBMs and standard deviation of generator speed compared to reported controllers in the EOG conditions. Furthermore, a detailed DEL analysis is carried out at wind speeds of 14 m/s and 16 m/s with two turbulent intensities to prove the effectiveness of the IPCs. Significant improvement in the case of IPCs is observed from DEL plots compared to CPC. Thus, turbines will require less maintenance, have longer lifetimes, and be more reliable. All simulation studies have been carried out using the high-fidelity aeroelastic FAST-based simulation package.
  • Future studies will consider developing a controller to exploit blade pitch control for reducing loads in the below-rated wind conditions as long as the power generation remains unaffected and will also investigate the further reduction of higher-order harmonics. Future studies will also focus on implementing an online tuning method for the MPC. IPC can also be made to work in a wide range of operation points using the gain scheduling technique. The application of the reported controllers on different wind turbines (offshore and floating) will be considered in the future study of this work.

Author Contributions

Conceptualization, S.-h.H., A.R. and N.S.; writing and review, A.R., S.-h.H., N.S. and D.-j.B.; investigation, A.R., S.-h.H., N.S. and D.-j.B.; editing, S.-h.H., A.R., N.S. and D.-j.B. All authors have read and agreed to the published version of the manuscript.

Funding

This work is supported in part by the Korea Institute of Energy Technology Evaluation and Planning grant funded by the Korean government (MOTIE) (20213030020230, Development of localized control system for wind power systems) and the Korea Electric Power Corporation (KEPCO) (R21XO01-17).

Institutional Review Board Statement

Not applicable.

Informed Consent Statement

Not applicable.

Data Availability Statement

Not applicable.

Conflicts of Interest

The authors declare no conflict of interest.

References

  1. Global Wind Energy Council. Gwec/Global Wind Report 2021; Global Wind Energy Council: Brussels, Belgium, 2021. [Google Scholar]
  2. Barlas, T.; Van, K.G. Review of state of the art in smart rotor control research for wind turbines. Prog. Aerosp. Sci. 2010, 46, 1–27. [Google Scholar] [CrossRef]
  3. Lu, Q.; Bowyer, R.; Jones, B.L. Analysis and design of Coleman transform-based individual pitch controllers for wind-turbine load reduction. Wind Energy 2015, 18, 1451–1468. [Google Scholar] [CrossRef] [Green Version]
  4. Wang, N.; Wright, A.; Johnson, K. Independent Blade Pitch Controller Design for a Three-Bladed Turbine Using Disturbance Accommodating Control. In Proceedings of the American Control Conference, Boston, MA, USA, 6–8 July 2016; pp. 2301–2306. [Google Scholar]
  5. Pao, L.Y.; Johnson, K.E. A tutorial on the dynamics and control of wind turbines and wind farms. In Proceedings of the 2009 American Control Conference, St. Louis, MO, USA, 10–12 June 2009; pp. 2076–2089. [Google Scholar]
  6. Muljadi, E.; Butterfield, C.P. Pitch-controlled variable-speed wind turbine generation. IEEE Trans. Ind. Appl. 2001, 37, 240–246. [Google Scholar] [CrossRef] [Green Version]
  7. Vali, M.; Van Wingerden, J.; Kühn, M. Optimal Multivariable Individual Pitch Control for Load Reduction of Large Wind Turbines. In Proceedings of the American Control Conference, Boston, MA, USA, 6–8 July 2016; pp. 3163–3169. [Google Scholar]
  8. Coleman, R.P.; Feingold, A.M. Theory of Self-Excited Mechanical Oscillations of Helicopter Rotors with Hinged Blades; National Advisory Committee for Aeronautics Report/Patent: (NACA-TR-1351); NASA: Washington, DC, USA, 1958. [Google Scholar]
  9. Vas, P. Electrical Machines and Drives: A Space-Vector Theory Approach; Oxford University Press: New York, NY, USA, 1993. [Google Scholar]
  10. Bossanyi, E.A. Individual blade pitch control for load reduction. Wind Energy 2003, 6, 119–128. [Google Scholar] [CrossRef]
  11. Bossanyi, E.A.; Fleming, P.A.; Wright, A.D. Validation of individual pitch control by field tests on two- and three-bladed wind turbines. IEEE Trans. Control Syst. Technol. 2013, 21, 1067–1078. [Google Scholar] [CrossRef]
  12. Van Engelen, T.G.; Van Der Hooft, E.L. Individual Pitch Control Inventory; Technical Report ECN-E-03-138; Energy Research Centre of the Netherlands ECN: Petten, The Netherlands, 2005. [Google Scholar]
  13. Selvam, K.; Kanev, S.; Van Wingerden, J.; Van Engelen, T.; Verhaegen, M. Feedback–feedforward individual pitch control for wind turbine load reduction. Int. J. Robust Nonlinear Control 2009, 19, 72–91. [Google Scholar] [CrossRef] [Green Version]
  14. Geyler, M.; Caselitz, P. Robust multivariable pitch control design for load reduction on large wind turbines. J. Sol. Energy Eng. 2008, 130, 031014. [Google Scholar] [CrossRef]
  15. Bossanyi, E.A. Further load reductions with individual pitch control. Wind Energy 2005, 8, 481–485. [Google Scholar] [CrossRef]
  16. Van Solingen, E.; Navalkar, S.; Van Wingerden, J.W. Experimental wind tunnel testing of linear individual pitch control for two-bladed wind turbines. J. Phys. Conf. Ser. 2014, 524, 012056. [Google Scholar] [CrossRef]
  17. Stol, K.A.; Moll, H.G.; Bir, G.; Namik, H. A comparison of multi-blade coordinate transformation and direct periodic techniques for wind turbine control design. In Proceedings of the 47th AIAA/ASME, Orlando, FL, USA, 5–8 January 2009. [Google Scholar]
  18. Nourdine, S.; Camblong, H.; Vechiu, I.; Tapia, G. Comparison of wind turbine LQG controllers using Individual Pitch Control to alleviate fatigue loads. In Proceedings of the 18th Mediterranean Conference on Control and Automation, MED’10, Marrakech, Morocco, 23–25 June 2010; pp. 1591–1596. [Google Scholar]
  19. Park, S.; Nam, Y. Two LQRI based Blade Pitch Controls for Wind Turbines. Energies 2012, 5, 1998–2016. [Google Scholar] [CrossRef]
  20. Doyle, J. Guaranteed margins for LQG regulators. IEEE Trans. Autom. Control 1978, 23, 756–757. [Google Scholar] [CrossRef] [Green Version]
  21. McFarlane, D.; Glover, K. A loop shaping design procedure using H∞ synthesis. IEEE Trans. Autom. Control 1992, 37, 759–769. [Google Scholar] [CrossRef]
  22. Skogestad, S.; Postlethwaite, I. Multivariable Feedback Control: Analysis and Design; John Wiley & Sons: Hoboken, NJ, USA, 2001. [Google Scholar]
  23. Reddy, Y.-S.; Hur, S.-H. Comparison of Optimal Control Designs for a 5 MW Wind Turbine. Appl. Sci. 2021, 11, 8774. [Google Scholar] [CrossRef]
  24. Song, Y.; Jeon, T.; Paek, I.; Dugarjav, B. Design and Validation of Pitch H-Infinity Controller for a Large Wind Turbine. Energies 2022, 15, 8763. [Google Scholar] [CrossRef]
  25. Vinnicombe, G. Uncertainty and Feedback, H Loop-Shaping and the V-Gap Metric; Imperial College Press (Verlag): London, UK, 2000. [Google Scholar]
  26. Hyde, R.A.; Glover, K.; Shanks, G.T. VSTOL first flight of an H-infinity control law. Comput. Control Eng. J. 1995, 6, 11–16. [Google Scholar] [CrossRef]
  27. Chu, Y.; Glover, K.; Dowling, A.P. Control of combustion oscillations via H∞ loop-shaping, µ-analysis and Integral Quadratic Constraints. Automatica 2003, 39, 219–231. [Google Scholar] [CrossRef]
  28. Dahan, J.A.; Morgans, A.S.; Lardeau, S. Feedback control for form-drag reduction on a bluff body with a blunt trailing edge. J. Fluid Mech. 2012, 704, 360–387. [Google Scholar] [CrossRef] [Green Version]
  29. Mirzaei, M.; Soltani, M.; Poulsen, N.; Niemann, H. An MPC approach to individual pitch control of wind turbines using uncertain LIDAR measurements. In Proceedings of the 2013 European Control Conference (ECC), Zurich, Switzerland, 17–19 July 2013; pp. 490–495. [Google Scholar]
  30. Routray, A.; Hur, S.-H. Full Operational Envelope Control of a Wind Turbine Using Model Predictive Control. IEEE Access 2022, 10, 121940–121956. [Google Scholar] [CrossRef]
  31. Lio, W.H.; Rossiter, J.A.; Jones, B.L. A review on applications of model predictive control to wind turbines. In Proceedings of the UKACC International Conference on Control (CONTROL), Loughborough, UK, 9–11 July 2014; pp. 673–678. [Google Scholar]
  32. Routray, A.; Reddy, Y.S.; Hur, S.-H. Predictive Control of a Wind Turbine Based on Neural Network-Based Wind Speed Estimation. Sustainability 2023, 15, 9697. [Google Scholar] [CrossRef]
  33. Ungurán, R.; Petrovic, V.; Pao, L.Y.; Kühn, M. Smart rotor control of wind turbines under actuator limitations. In Proceedings of the 2019 American Control Conference (ACC), Philadelphia, PA, USA, 10–12 July 2019; pp. 3474–3481. [Google Scholar]
  34. Jonkman, J.; Butterfield, S.; Musial, W.; Scott, G. Definition of a 5-MW Reference Wind Turbine for Offshore System Development; Nat. Renewable Energy Lab. (NREL) Tech. Rep. NREL/TP-500-38060; NREL: Golden, CO, USA, 2009. [Google Scholar]
  35. Jonkman, J.M.; Buhl, M.L., Jr. Fast User’s Guide; Nat. Renewable Energy Lab. (NREL), Tech. Rep. NREL/EL-500-38230; NREL: Golden, CO, USA, 2005. [Google Scholar]
  36. McFarlane, D.; Glover, K. Robust Controller Design using Normalized Coprime Factor Plant Descriptions; Lecture Notes in Control and Information Sciences; Springer: Berlin/Heidelberg, Germany, 1990; p. 138. [Google Scholar]
  37. IEC 61400-1; Wind Turbines-Part 1: Design Requirements. 3rd ed. International Electrotechnical Commission: Geneva, Switzerland, 2005.
  38. Jonkman, B. TurbSim User’s Guide (Technical Report); Nat. Renewable Energy Lab. (NREL): Golden, CO, USA, 2009. [Google Scholar]
  39. Hayman, G.J.; Buhl, M., Jr. Mlife Users Guide for Version 1.00 (Tech. Rep.); Nat. Renewable Energy Lab. (NREL): Golden, CO, USA, 2012. [Google Scholar]
  40. Leith, D.J.; Leithead, W.E. Appropriate realization of gain-scheduled controllers with application to wind turbine regulation. Int. J. Control 1996, 65, 223–248. [Google Scholar] [CrossRef]
  41. Li, J.; Wang, S.; Hou, Z.; Zhao, J. Multivariable Model-Free Adaptive Controller Design with Differential Characteristic for Load Reduction of Wind Turbines. IEEE Trans. Energy Convers. 2022, 37, 1106–1114. [Google Scholar] [CrossRef]
  42. Wheeler, L. Wind Turbine Collective and Individual Pitch Control Using Quantitative Feedback Theory. Master’s Thesis, Case Western Reserve University, Cleveland, OH, USA, 2017. [Google Scholar]
  43. Simley, E.; Pao, L.Y. A longitudinal spatial coherence model for wind evolution based on large-eddy simulation. In Proceedings of the 2015 American Control Conference (ACC), Chicago, IL, USA, 1–3 July 2015; pp. 3708–3714. [Google Scholar]
  44. Laks, J.; Simley, E.; Pao, L. A spectral model for evaluating the effect of wind evolution on wind turbine preview control. In Proceedings of the American Control Conference, Washington, DC, USA, 17–19 June 2013; pp. 3673–3679. [Google Scholar]
Figure 1. Generic representation of a 5 MW wind turbine.
Sustainability 15 10933 g001
Figure 2. Overall IPC control design model.
Sustainability 15 10933 g002
Figure 3. IPC control design model.
Sustainability 15 10933 g003
Figure 4. Loop-shaping design procedure.
Sustainability 15 10933 g004
Figure 5. Bode plot of the loop-shaping  H  controller.
Sustainability 15 10933 g005
Figure 6. Wind speed at 16 m/s for turbulent intensities NTM A and B.
Sustainability 15 10933 g006
Figure 7. Results at 16 m/s for turbulent intensity B. (a) BRBMs. (b) PSD of BRBMs.
Sustainability 15 10933 g007aSustainability 15 10933 g007b
Figure 8. Individual pitch angles of IPC- H  with the collective pitch at 16 m/s.
Sustainability 15 10933 g008
Figure 9. Results at 16 m/s for turbulent intensity A. (a) BRBMs. (b) PSD of BRBMs.
Sustainability 15 10933 g009
Figure 10. Simulation results at 16 m/s wind speed at turbulent intensity A. (a) Generator speed. (b) Power.
Sustainability 15 10933 g010
Figure 11. Frequency response of the controllers (pitch to BRBMs) at 16 m/s.
Sustainability 15 10933 g011
Figure 12. Wind speed at 14 m/s for turbulent intensities NTM A and B.
Sustainability 15 10933 g012
Figure 13. Results at 14 m/s for turbulent intensity B. (a) BRBMs. (b) PSD of BRBMs.
Sustainability 15 10933 g013aSustainability 15 10933 g013b
Figure 14. Individual pitch angles of IPC- H  versus collective pitch at 14 m/s.
Sustainability 15 10933 g014
Figure 15. Results at 14 m/s for turbulent intensity A. (a) BRBMs. (b) PSD of BRBMs.
Sustainability 15 10933 g015
Figure 16. EOG results for 16 m/s wind speed at turbulent intensity A. (a) Wind speed. (b) BRBMs.
Sustainability 15 10933 g016
Figure 17. EOG results for 14 m/s wind speed at turbulent intensity A. (a) Wind speed. (b) BRBMs.
Sustainability 15 10933 g017
Figure 18. EOG results for 14 m/s wind speed at turbulent intensity A. (a) Generator speed. (b) Power.
Sustainability 15 10933 g018
Figure 19. EOG results for 16 m/s wind speed at turbulent intensity A. (a) Generator speed. (b) Power.
Sustainability 15 10933 g019aSustainability 15 10933 g019b
Figure 20. DEL of the wind turbine at a mean wind speed of 14 m/s with intensities of B and A.
Sustainability 15 10933 g020
Figure 21. DEL of the wind turbine at a mean wind speed of 16 m/s with intensities of B and A.
Sustainability 15 10933 g021
Table 1. Wind turbine specifications.
ParametersValuesUnits
Turbine power5MW
Diameter of blade126m
Diameter of hub3m
Wind speed (cut in and cut out)3, 25m/s
Height of hub90m
Rotor speed (rated)12.1rpm
Table 2. Std. dev. of generator speed at turbulent intensity A.
Std. Dev.
Gen. Speed (rpm)
Mean Wind Speed
14 m/s16 m/s
PI0.18230.1841
MPC
% Reduction
0.07940.0836
56.44%54.59%
H
% Reduction
0.02100.0214
88.48%88.37%
Table 3. Std. dev. of BRBMs at turbulent intensity A.
Std. Dev.
BRBMs (kN.m)
Mean Wind Speed
14 m/s16 m/s
CPC   1.3627 × 10 3   1.5589 × 10 3
IPC-PI   1.0163 × 10 3   1.1350 × 10 3
IPC-MPC962.7452   1.0753 × 10 3
IPC- H 953.0034   1.0459 × 10 3
Table 4. Std. dev. of tilt and yaw moments for 14 m/s at turbulent intensity A.
Std. Dev.
(kN.m)
At Wind Speed
(14 m/s)
MtiltMyaw
CPC   1.2798 × 10 3   1.3167 × 10 3
IPC-PI   1.2645 × 10 3   1.2029 × 10 3
IPC-MPC   1.2383 × 10 3   1.1710 × 10 3
IPC- H   1.1841 × 10 3   1.1238 × 10 3
Table 5. Std. dev. of tilt and yaw moments for 16 m/s at turbulent intensity A.
Std. Dev.
(kN.m)
At Wind Speed
(16 m/s)
MtiltMyaw
CPC   1.4690 × 10 3   1.4704 × 10 3
IPC-PI   1.4283 × 10 3   1.3869 × 10 3
IPC-MPC   1.3824 × 10 3   1.3755 × 10 3
IPC- H   1.2877 × 10 3   1.2591 × 10 3
Disclaimer/Publisher’s Note: The statements, opinions and data contained in all publications are solely those of the individual author(s) and contributor(s) and not of MDPI and/or the editor(s). MDPI and/or the editor(s) disclaim responsibility for any injury to people or property resulting from any ideas, methods, instructions or products referred to in the content.

