Article

Performances Analysis of Three Grid-Tied Large-Scale Solar PV Plants in Varied Climatic Conditions: A Case Study in Algeria

1
Unité de Recherche Appliquée en Energies Renouvelables URAER, Centre de Développement des Energies Renouvelables, CDER, Ghardaïa 47133, Algeria
2
Laboratory of Applied Automation and Industrial Diagnostics (LAADI), Faculty of Science and Technology, Ziane Achour University, Djelfa 17000, Algeria
3
Electrical and Electronics Engineering Department, Nisantasi University, Istanbul 34398, Turkey
4
Chair of High-Power Converter Systems, Technical University of Munich, 80333 Munich, Germany
5
Higher National Scholl of Renewable Energy, Environment and Sustainability, Batna 05078, Algeria
6
Director Center for Energy Transition, Universidad San Sebastián, Santiago 8380000, Chile
7
Department of Electrical Engineering, Faculty of Engineering, Assiut University, Assiut 71516, Egypt
*
Authors to whom correspondence should be addressed.
Sustainability 2023, 15(19), 14282; https://doi.org/10.3390/su151914282
Submission received: 7 August 2023 / Revised: 7 September 2023 / Accepted: 20 September 2023 / Published: 27 September 2023
(This article belongs to the Special Issue Renewable Energy Technologies and Energy Efficient Utilization)

Abstract

:
Currently, for the determination of the suitable and optimal PV power plant according to the climate conditions of the concerned region, researchers focus on the estimation of certain performance factors, which are reported to be the key parameters for the analysis of the performances of grid-connected photovoltaic (PV) power systems. In this context, this paper focuses on on-site real-time analysis of the performance of three solar photovoltaic plants: Sidi-bel-Abbés (12 MWp), Laghouat (60 MWp), and Ghardaïa (1.1 MWp). These plants are located in different regions experiencing diverse climatic conditions in Algeria. The analysis was carried out by the standardized norms of IEC 61724, using monitoring data collected over one year. The photovoltaic power plants were evaluated in terms of performance factors, such as the reference yield (Yr), final yield (Yf), performance ratio (PR), and capacity factor (CF). On the other side, based on real data collected at the concerned sites, two linear functions depending on solar irradiance and the PV module temperature for each site are proposed for the evaluation of the generated alternative power output (PAC) for the three PV plants. The obtained results based on the study presented in this paper can help designers of PV power plants of different technologies and different climate conditions to precisely decide the convenient technology that allows the best production of the electrical energy for grid-tied PV systems. Furthermore, this study can contribute in giving a clear vision of the implementation of upcoming large-scale solar PV power plants in Algeria within the studied area and other areas.

1. Introduction

The location of Algeria is one of the areas most affected by the consequences of climate change. Therefore, Algeria has included the environmental aspect in the economic development process and announced promising programs for the development of renewable energy and energy efficiency since 2011, which were modified and updated in 2015 [1]. This program aims to reach 40% of the electricity production capacity from renewable energy sources by 2030, and to reduce dependence on fossil energy sources, especially natural gas, in the production of electric energy due to the increase in internal demand for electricity and gas needs, which are expected to reach 150 TWh and 55 billion m3 in 2030, respectively (Abada and Bouharkat 2018) [2]. It also aims to develop a real solar industry, associated with a training and capitalization program that will ultimately establish efficient know-how, particularly in terms of engineering and project management. Algeria’s geographical location qualifies it to be a leader in the field of producing electric energy from renewable sources, especially solar energy, because it is the most abundant source, especially in the high plateaus and southern region of the country [3,4,5]. This energy potential is seen as an alternative energy source to provide a comprehensive and sustainable solution to challenges such as conserving fossil fuels, reducing greenhouse gas emissions, and acting as a lever for economic and social development, particularly through the creation of industries that create wealth and jobs.
The delay recorded in the implementation of the national program to reach 22 GW of renewable energy sources by 2030 prompted the Algerian authorities to adopt a new approach that would give a strong impetus to the exploitation of renewable energies and activate their role in achieving the desired sustainable development [6]. In 2020, Algeria adopted a new program with a production of 15,000 MW connected to the national electricity grid by 2035, of which a first tranche of 4000 MW is to be produced by 2024 (Prime Minister of Algeria, 2020) [7].
Since 2014, 24 grid-connected photovoltaic plants and 1 wind farm with a capacity of 354.3 MW have been installed in various regions of the country [8]. The evaluation of their performances becomes a necessity to bring a definitive confirmation of the feasibility of this type of system.
The performance of a solar photovoltaic plant (SPVP) is affected by many specific factors, which are related to the site and the weather conditions such as temperature, wind speed, solar radiation intensity, air pollution, etc. [9,10,11,12,13,14]. Indeed, the most important parameter which usually characterizes the performance of a solar PV power plant is the performance ratio “PR”, which is defined as the ratio between the final yield of the solar PV plant to the reference yield and whose value is independent of the location and size of the solar PV plant. This parameter is very important for designing, monitoring, and planning a solar PV plant at any location and it is furthermore used to compare solar PV systems installed in different directions and/or locations.
Indeed, in the last year, many papers have studied the performance of different grid-connected PV plants, which were localized in different sites in North Africa, Sahel, and Middle Eastern countries. In 2021, the authors in [15] studied the performance of a 48 kWp grid-connected photovoltaic plant installed in Nouakchott, Mauritania, which is characterized by Sahel climate conditions; their research conducted measurements of the ratio performance “PR”, capacity factor “CF”, and the final yield “Yf” which were found to be 77.75%, 19%, and 4.56 kWh/kWp/d, respectively. In 2016, the authors of [16] presented a detailed assessment of a 5 kWp grid-connected photovoltaic system based on experimental data obtained in real-time on-site for one year; the studied PV plant was implemented on a specific location that is the roof of a government building in Tangier, Morocco. Their study allowed the measurement of the three performance parameters PR, CF, and Yf, which were 79%, 14.83%, and 4.45 kWh/kWp/d, respectively. In 2014, Kazem et al. [17] presented a study of a 1.4 kWp grid-connected photovoltaic system installed in Sohar, Oman. This study used real-time on-site measurements based on hourly solar radiation and ambient temperature data during the period from July 2012 to June 2013, where the authors proposed a performance investigation on the studied system based on two main factors as the capacity factor and yield factor which were 21% and 1875 kWh/kWp/year, respectively.
In 2015, the authors of [18] presented the analysis performance assessment of four roof-mounted PV systems (111.4 kWp, 50.4 kWp, 215.7 kWp, and 994 kWp) in Abu Dhabi, UAE, for one year using two different solar cell technologies: multi-crystalline silicon (m-Si) and single-crystalline silicon (c-Si) technologies. The parameters which were taken into consideration in this investigation were the monthly average and annual performance parameters such as the total produced energy, final yield “Yf”, energy payback time (EPBT), capacity factor “CF”, and CO2 emission reduction.
In 2020, the authors of [19] analyzed a grid-connected PV power plant of 2130.7 kWp in the eastern part of Turkey based on several performance parameters, mainly the final yield, reference yield, inverter efficiency, system efficiency, capacity factor, performance ratio, and annual final yield. The analysis led to obtaining the values of 81.15%, 18.86%, and 4.53 kWh/kWp/d for the PR, CF, and Yf, respectively.
In India, Kumar et al. [20] presented the operational performance of a grid-tied solar photovoltaic plant integrated into pre-fabricated portable cabin buildings. This study was carried out based on one year of on-site collected data. The results showed that the final yield was about 3.7 kWh/kWp/d. The performance ratio of the PV plant and the capacity factor were 71.30% and 15.21%, respectively.
In 2009, the performance evaluation of a 171.36 kWp grid-connected PV system installed at the park of C. Rokas SA in Sitia, Crete, was presented based on the obtained on-site measurement data during the year 2007, where the generated energy from this PV plant ranged from 335.48 kWh to 869.68 kWh [21]. It was confirmed by the calculation brought by the authors that the final yield “Yf” ranged from 1.96 h/d to 5.07 h/d, and the performance ratio “PR” ranged from 58 to 73%, leading to an annual PR of 67.36%.
In the last few years, several research works on the performance of grid-connected plants were established in particular regions of Algeria under different climate conditions. In 2015, the authors of [22] studied the operation performance of a grid-connected PV system installed on the roof of the administrative building of the Centre of Renewable Energies Development located in Algiers, Algeria. It was found during the year of the study that the annual injected energy to the grid from this PV system is 10,981 kWh with a performance ratio between 62% and 77%.
In [23], an experimental analysis was performed based on a one-year investigation of a 20 MWp grid-connected PV plant mounted on a ground base at Ain El-Melh in high-plateau climate conditions in Algeria. The obtained ratio performance “PR” was 71.59%, and the capacity factor “CF” was in the range of 16.65–24.57%, while the final yield “Yf” was in the range of 3.99 h/d–5.897 h/d.
In 2022, the performance analysis of a 30 MWp PV plant polycrystalline technology based and which was installed in a semi-arid climate region of Ain Skhouna located in Saida, Algeria, was presented in [24]. This analysis was carried out based on one year (2018) of on-site collected data where a PR value of 85.52% was confirmed. In [25], the evaluation of the performance of a 23.92 MWp PV plant located in the area of El Bayadh, Algeria, was presented. This was carried out during an operation period of 36 months from March 2017 to February 2020. The obtained values of the performance ratio, capacity factor, and mean final yield were 82.02%, 20.64%, and 4.95 kWh/kWp/d, respectively.
In the arid Saharan climate, many grid-connected plants have been installed in the south of Algeria. For example, in [26], a detailed evaluation analysis of a 28 kWp PV plant installed on the rooftop of the Research Unit for Renewable Energies in Adrar in the Saharan region of southern Algeria was carried out from March 2017 to February 2018. It was confirmed by the authors that the yield values of the maximum/minimum monthly average reference and array yield values were 6.7/5.4 h/day and 5.5/3.2 h/day, respectively. Furthermore, the evaluated efficiencies of the annual average PV module, the inverter, and the system reached values of 11.37%, 96.46%, and 10.99%, respectively.
In [27], an experimental analysis was performed based on a 12-month investigation of a 6 MW grid-connected PV plant mounted on a ground base at Zaouiet Kounta in a hot desert climate at Adrar in the southern region of Algeria. The obtained ratio performance (PR) was 73.68%, and the capacity factor “CF” was in the range of 20.32–23.4%, while the final yield “Yf” was 5.15 kWh/kW/d. In [28], a study was carried out based on two commercial simulators, HOMER Pro and RETScreen Expert, for the prediction of the performance of a 20 MWp PV plant in a hot desert climate of the Adrar region in the south of Algeria using real data obtained on-site for 26 months of operation. The obtained values based on real data for the year 2017 of PR and CF were 74.36% and 20.81%, respectively, while the final yield “Yf” was 4.98 kWh/kW/d. In [29], a study was conducted by the authors with four PV plants located in Ghardaïa in the south of Algeria, with the same rated power of 100 kWp under different PV cell technologies such as polycrystalline (poly-Si), 100 kWp monocrystalline (mono-Si), 100 kWp amorphous silicon (a-Si), and 100 kWp thin-film cadmium-telluride (Cd-Te). The obtained PRs for each plant were 78%, 80%, 85%, and 81.50%, respectively. It was also indicated that the capacity factor “CF” values were 19.03%, 20.51%, 22.11%, and 21.22%, respectively, while the final yields “Yf” were 4.54 kWh/kWp/d, 4.85 kWh/kWp/d, 5.29 kWh/kWp/d, and 4.98 kWh/kWp/d, respectively.
In this study, three (3) grid-connected photovoltaic plants were mounted in three different regions in Algeria including Sidi-bel-Abbés, Laghouat, and Ghardaïa based on real-time data obtained from the Supervisory Control and Data Acquisition (SCADA) system. The data were recorded every 30 min. The analysis was carried out by the standardized norms of IEC 61724 [30], using monitoring data collected over one year.
The PV plants were evaluated in terms of the final yield (Yf), reference yield “Yr”, performance ratio “PR”, and capacity factor “CF”.
The main contribution of this research can be summarized as follows:
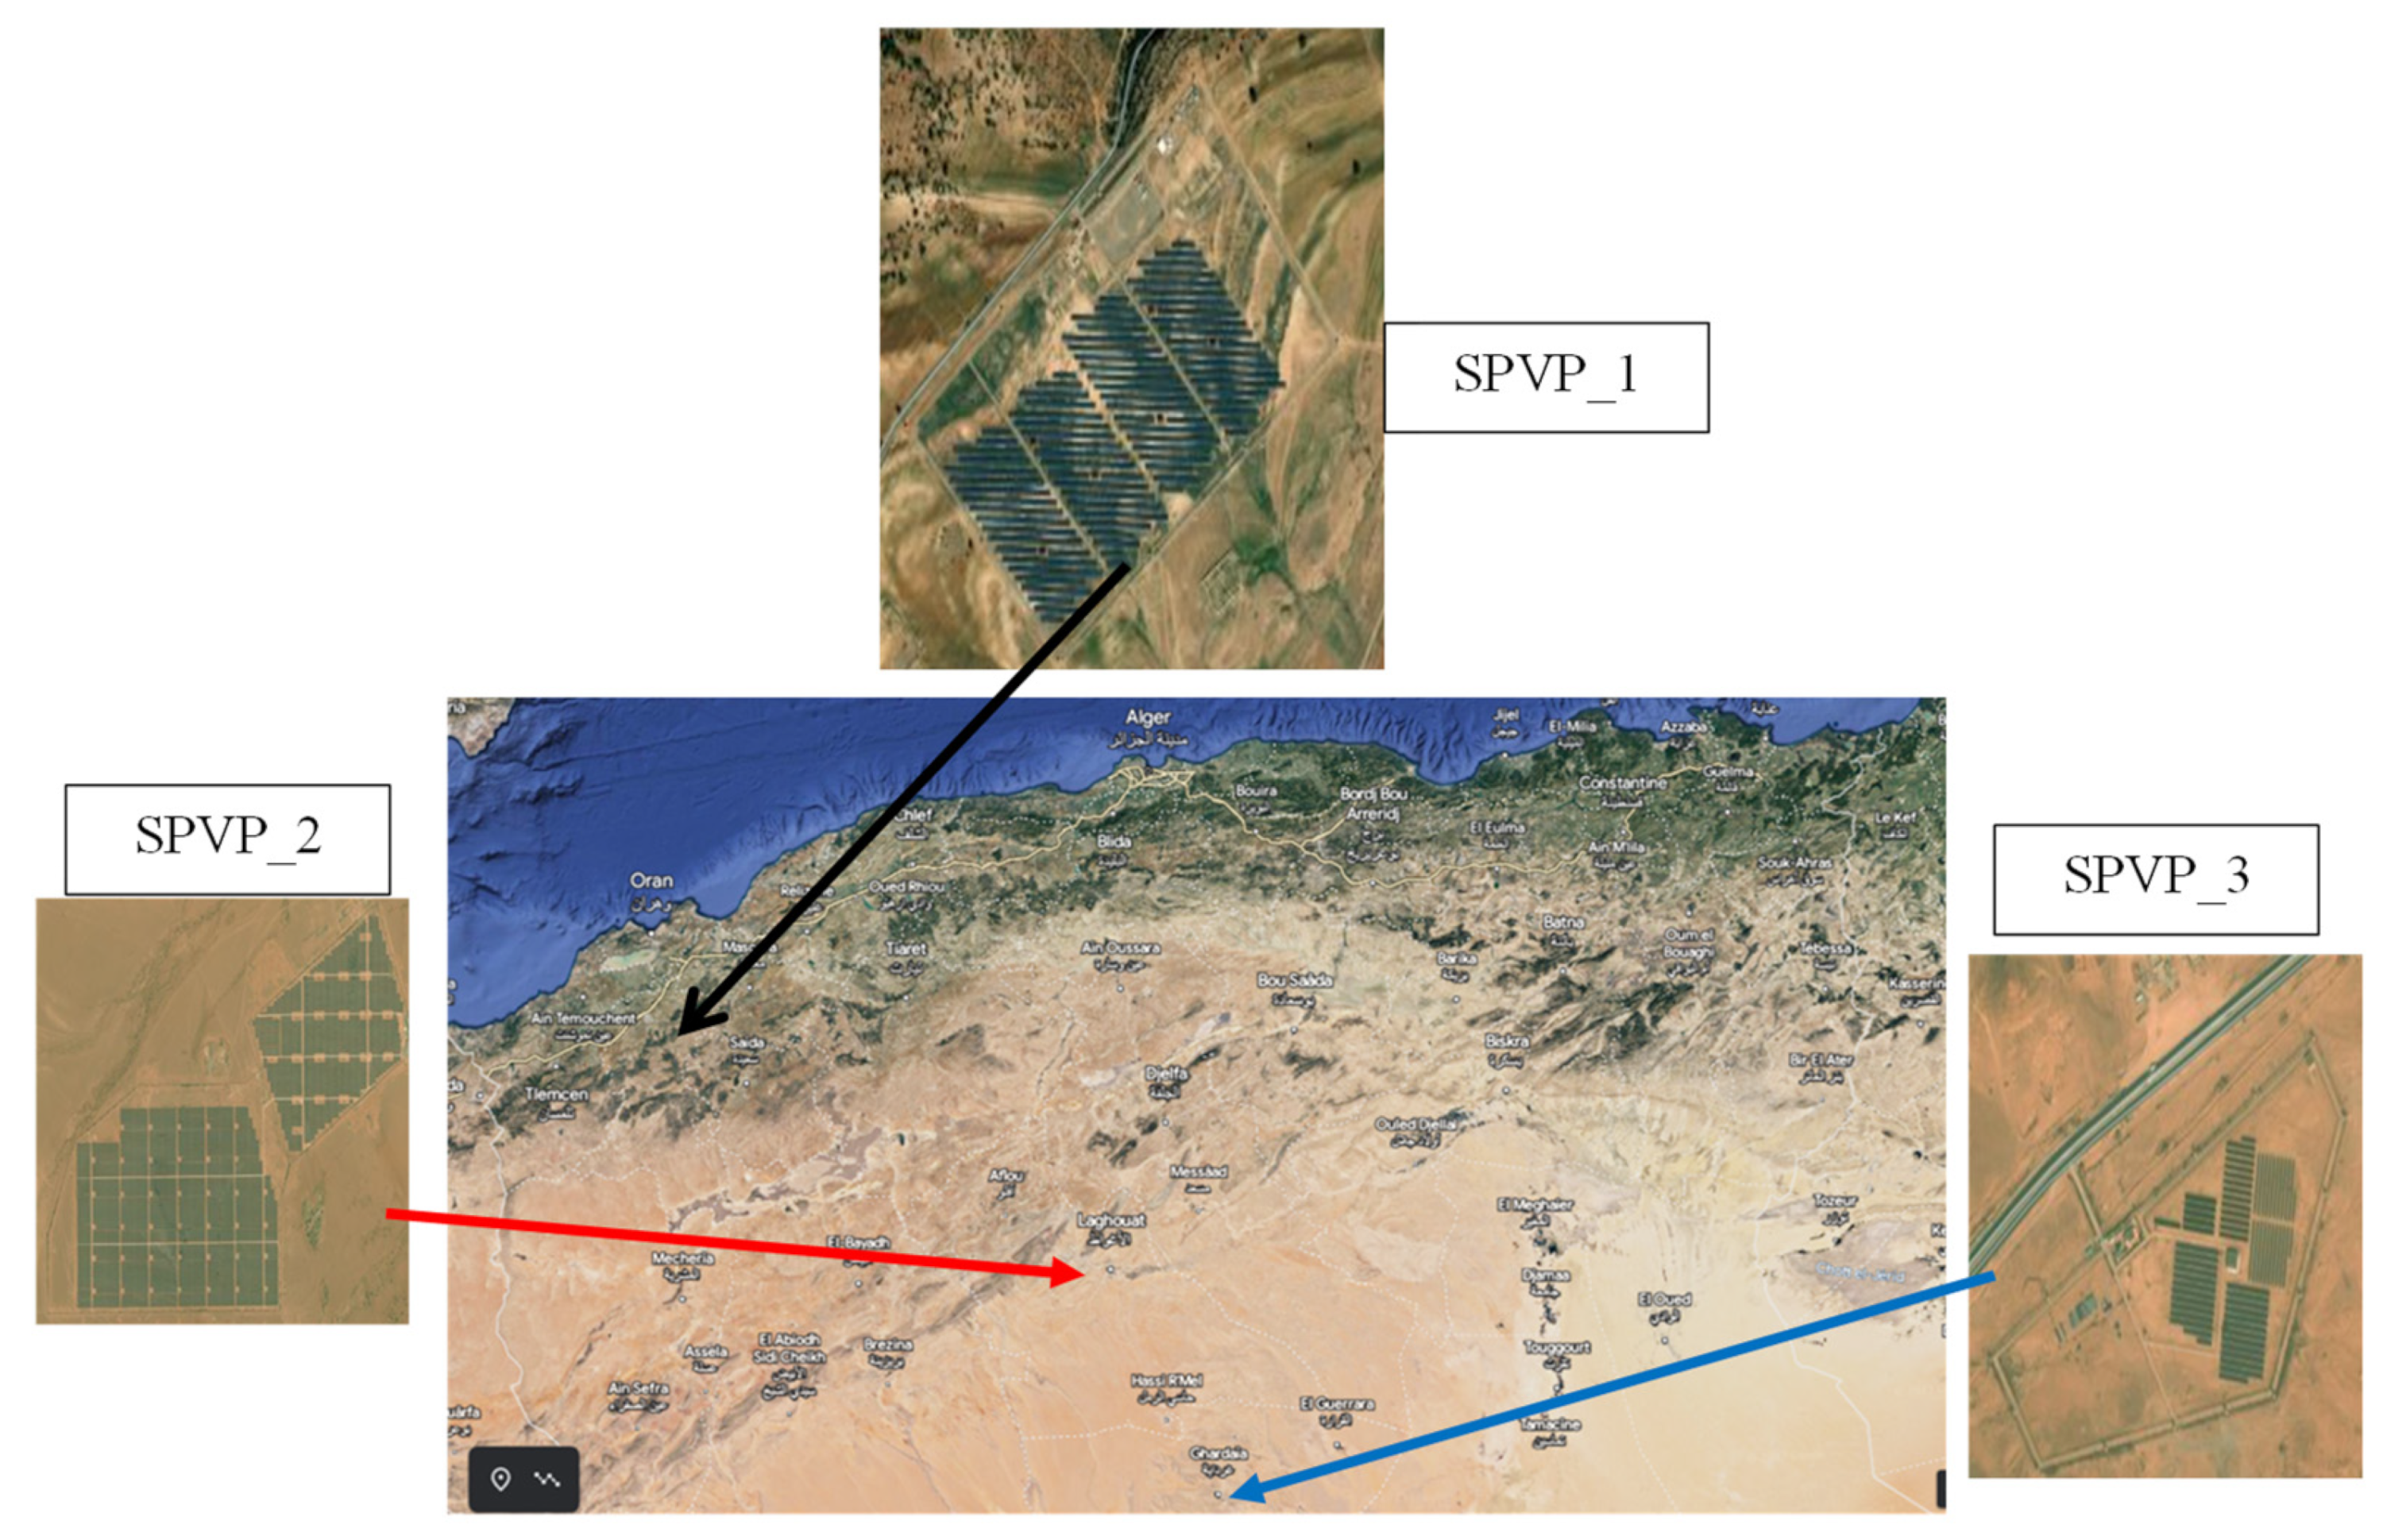
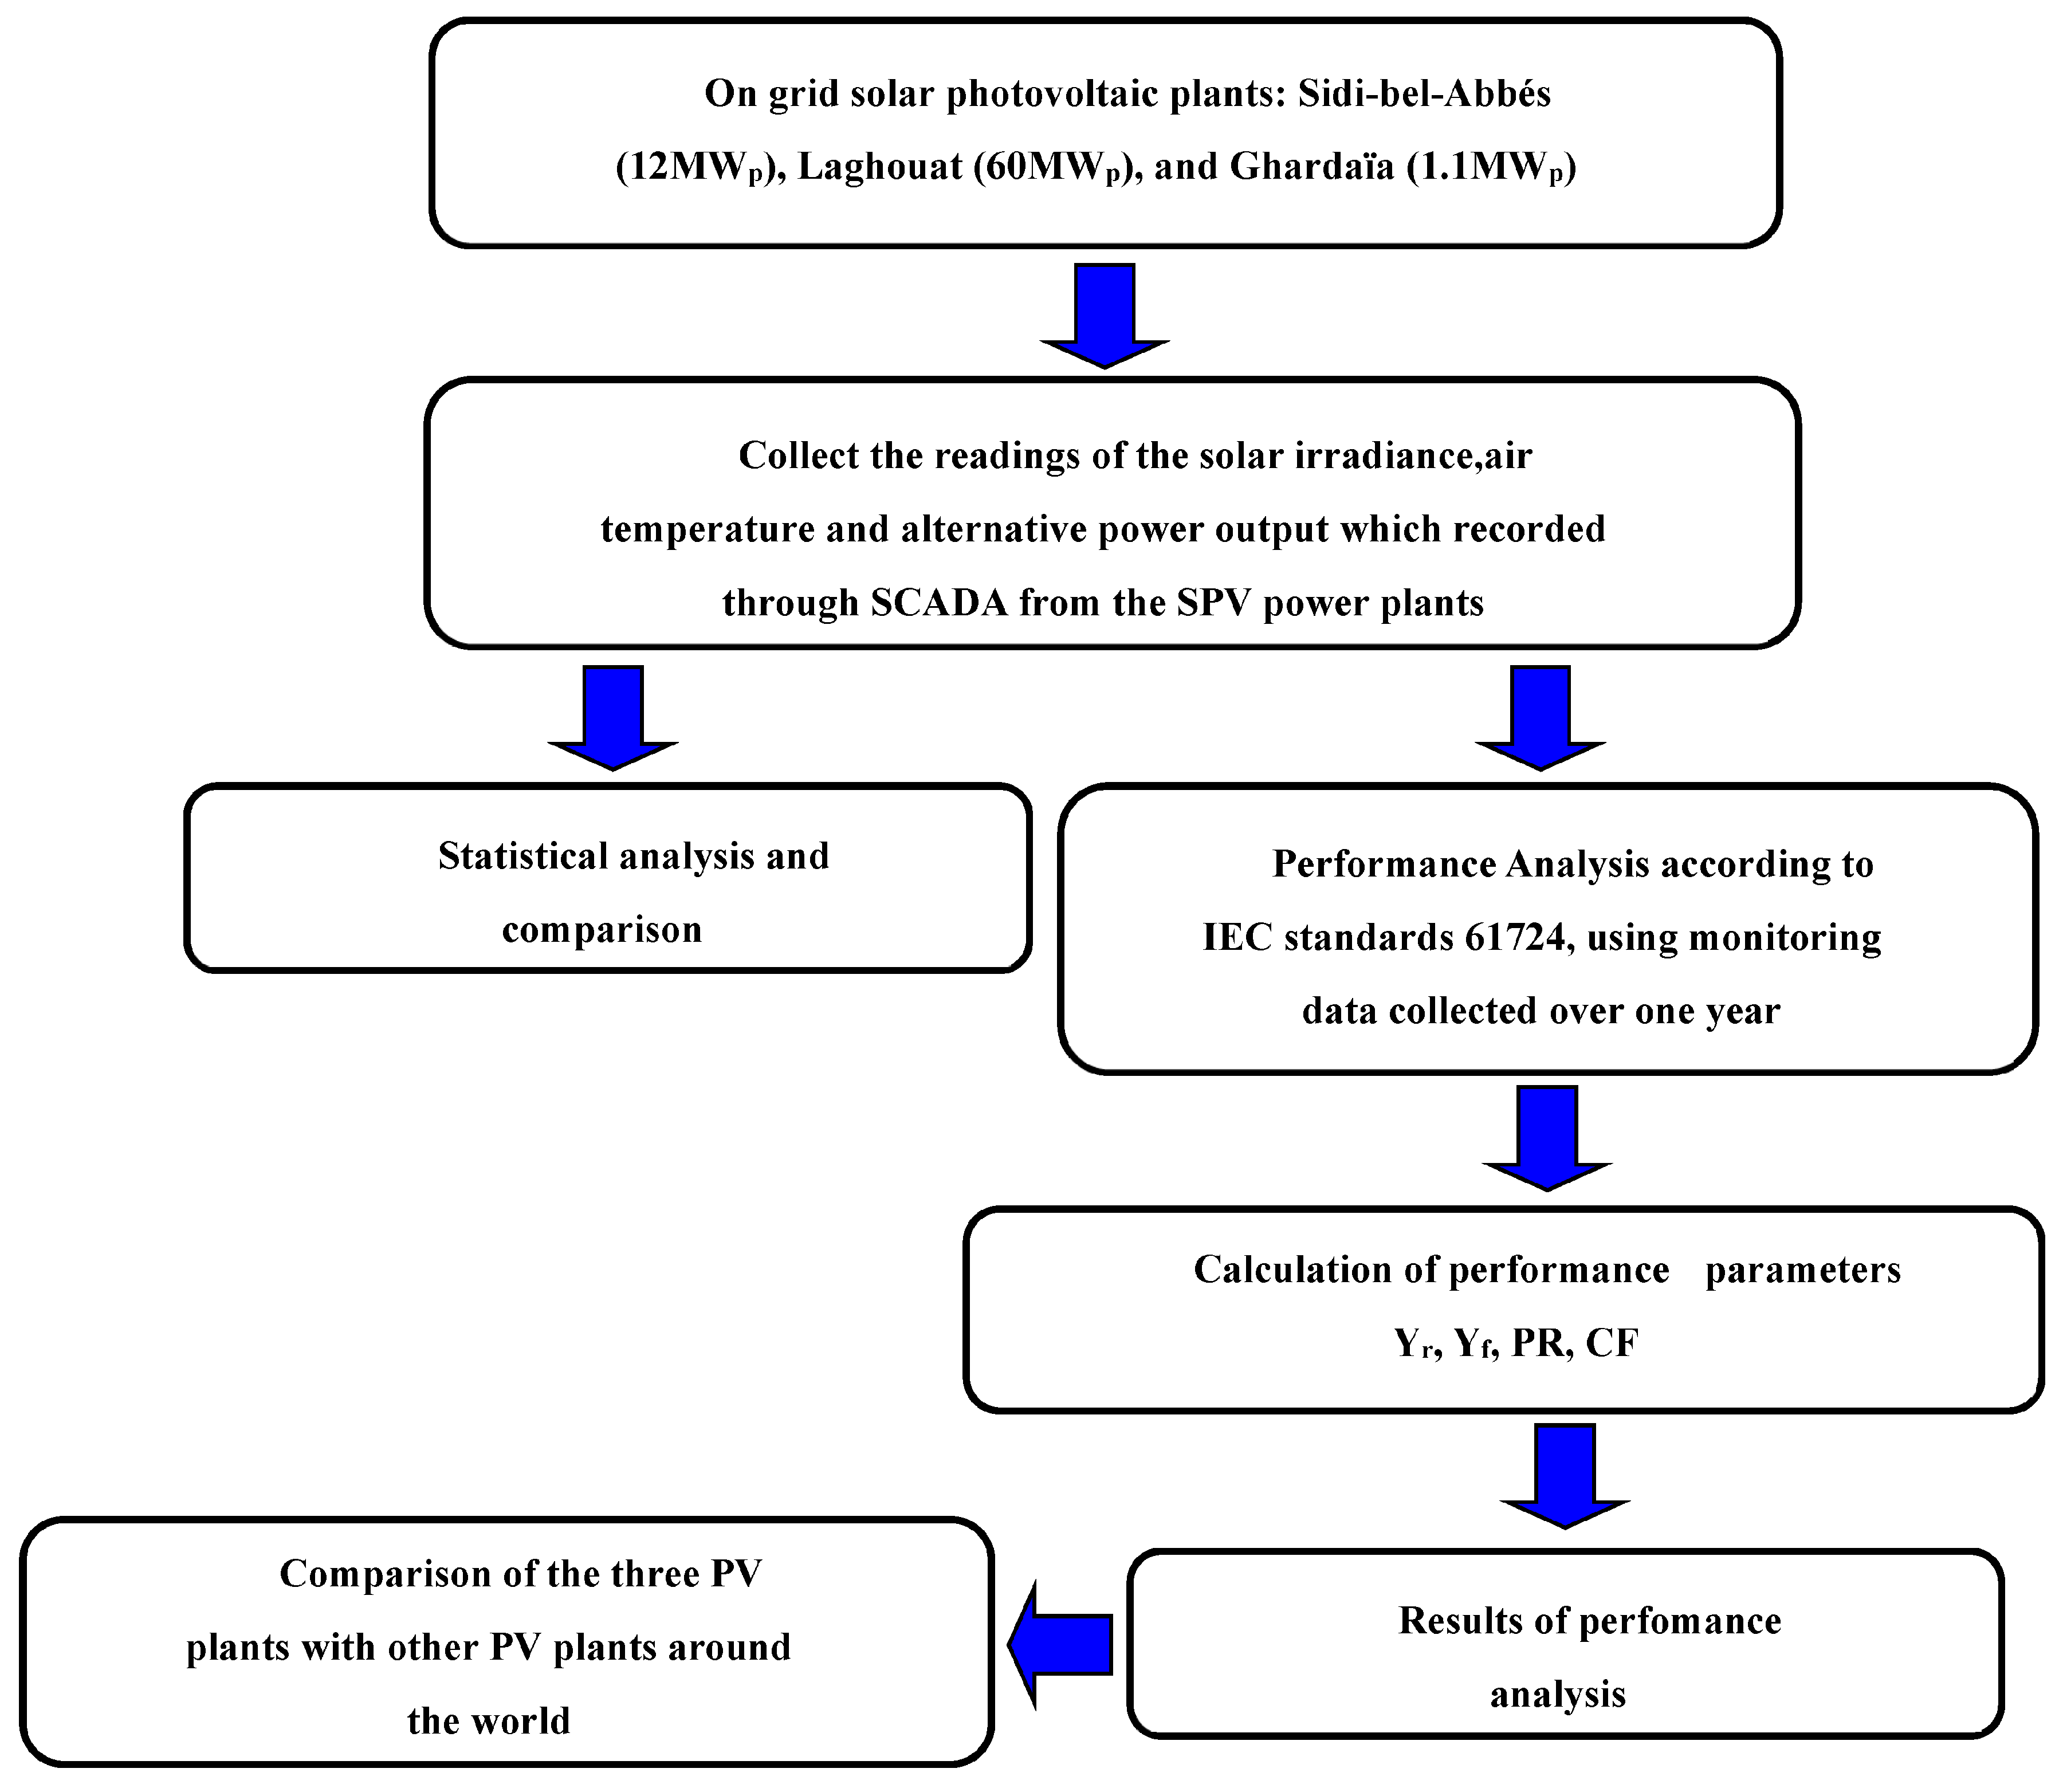
  • An analysis of the performances of three (3) solar photovoltaic plants including Sidi-bel-Abbés (12 MWp), Laghouat, (60 MWp), and Ghardaïa (1.1 MWp) located in different regions covering different climatic conditions in Algeria.
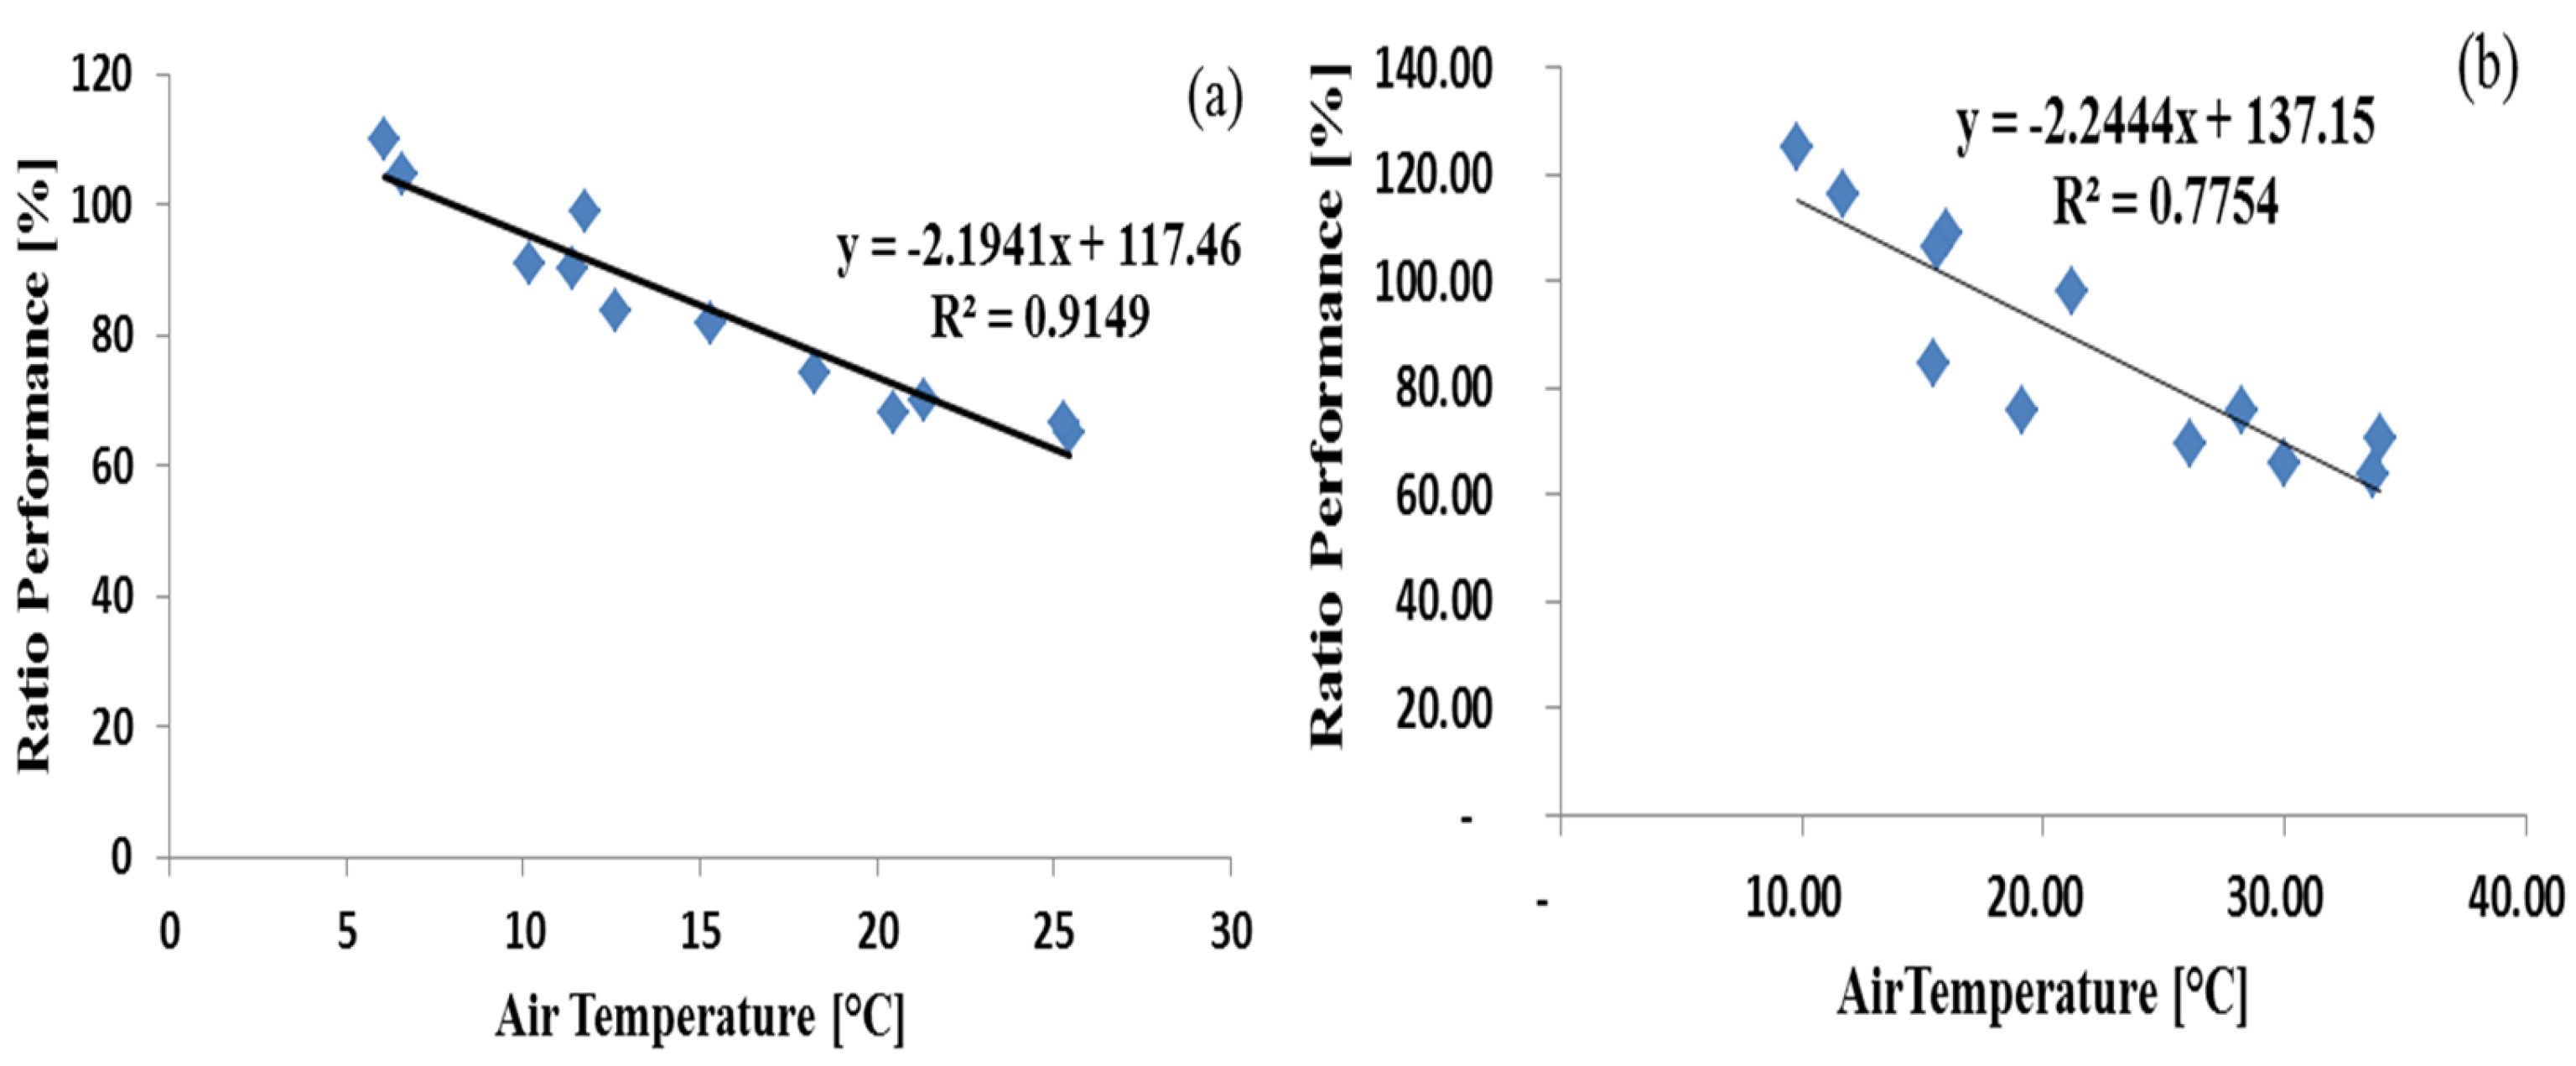
  • The prediction of the relationship between key factors such as the alternative power output “PAC” and ratio performance of three (3) solar photovoltaic plants using module temperature, air temperature, and solar irradiance, based on statistical analysis.
  • A comparison study of the performances of the three studied solar photovoltaic plants with other plants installed across the world.
This work aims to provide the performance analysis of three large-scale grid connected PV plants in varied climate conditions. The results of this analysis can contribute to understanding the challenges faced by PV plants in this environment and can help local and international investors to enhance the design and economic features of upcoming large-scale solar PV power plants in Algeria.
This paper is divided into five sections. Section 2 is devoted to the description of the three plants and the performance analysis. Section 3 is dedicated to the results and discussion. Section 4 focuses on the statistical analysis with a comparative study with other work. The conclusion is presented in the last section of the paper.

2. Materials and Methods

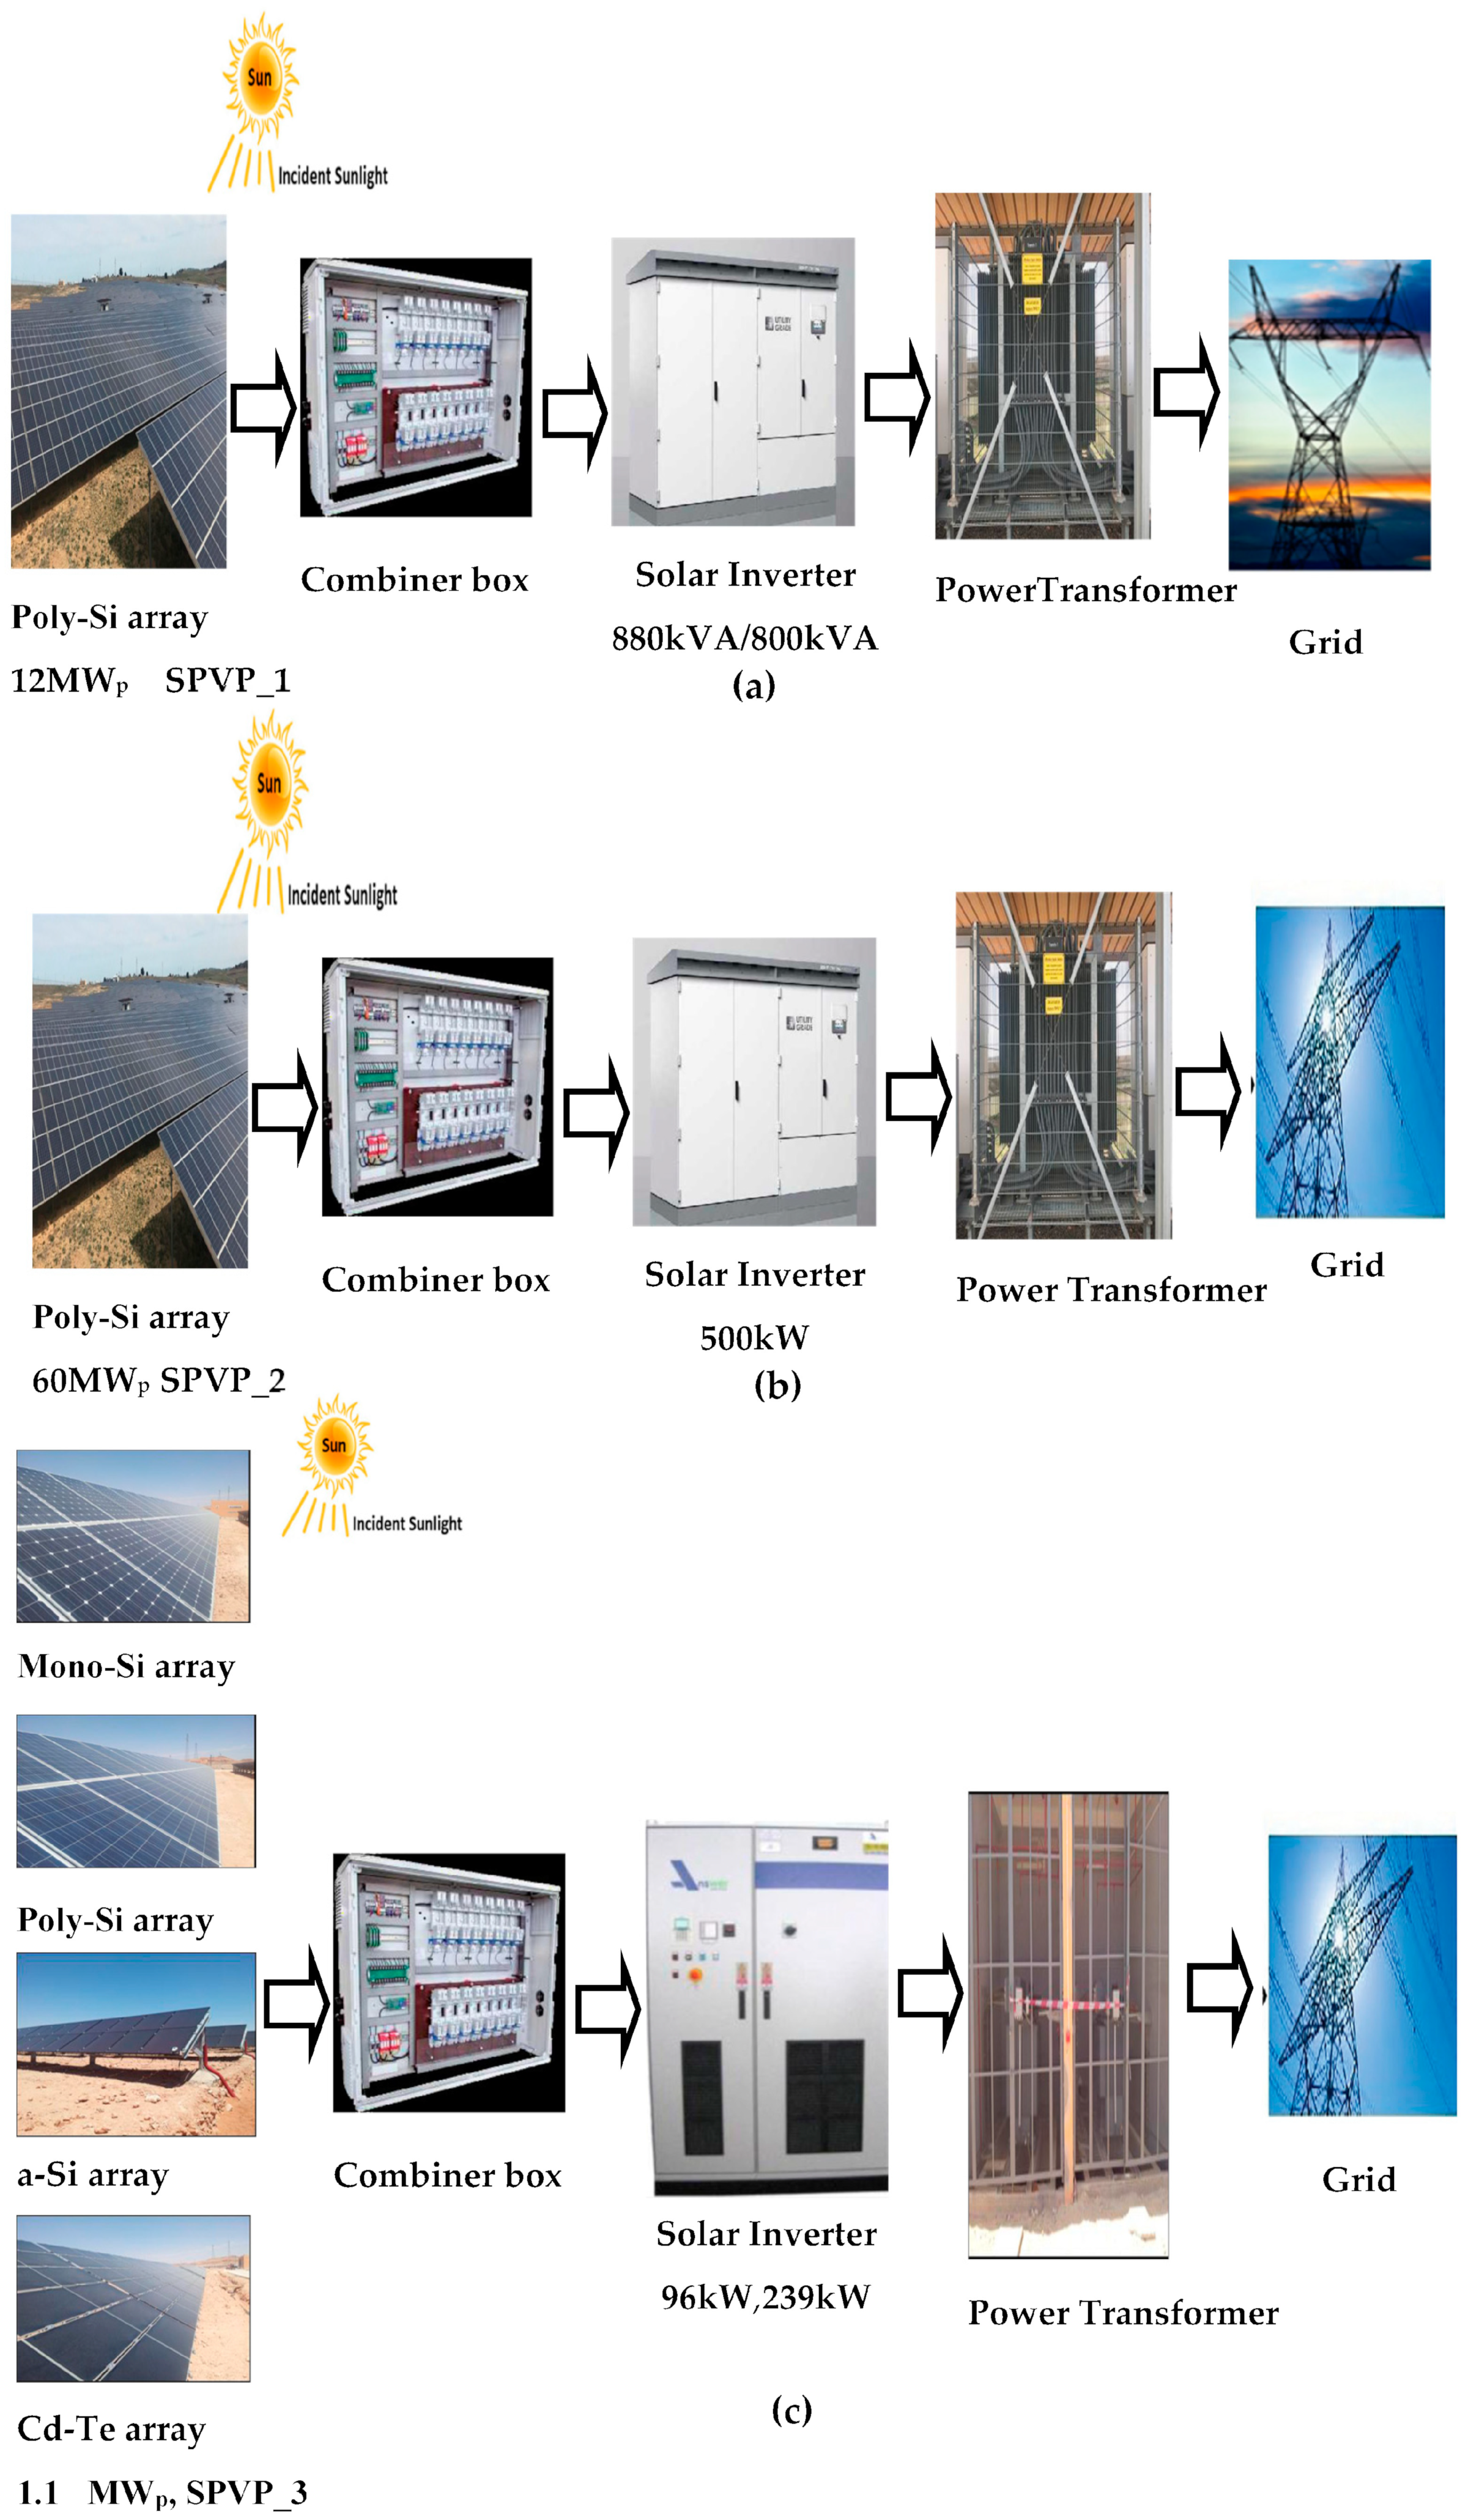
2.1. Description of Three Power Plants

The grid-connected PV systems installed in three different regions covering different climatic conditions in Algeria, which are part of the national renewable energy program, are presented in this study. The first PV plant is 12 MWp which is located in Dhaya of the Sidi-bel-Abbés (SPVP_1) region in the west of Algeria. The PV panels are mounted on a support structure facing south and tilted at 15°. The plant injects its produced power directly into the national 60 kV power system.
The second grid-connected PV power plant has a peak power of 60 MWp and is located in Lekhneg, in the Laghouat region, in the south of Algeria. This PV plant injects its produced power directly into the national 30 kV power system, where the produced energy covers approximately one-seventh of the region’s needs. The PV panels are mounted on a support structure facing south and tilted at 25°.
The third PV power plant has a peak power of 1.1 MWp and is located in Oued Nechou in the south of Algeria within the Ghardaïa region. This PV plant is dedicated to studying the performance of the four technologies: monocrystalline (mono-Si), polycrystalline (ploy-Si), cadmium telluride (Cd-Te), and amorphous (a-Si) under southern climatic conditions and divided into eight (8) sub-systems and two (2) type of structures (fixed and motorized). The PV panels are mounted on a support structure facing south and tilted at 30° for fixed structure sub-systems. The plant injects its produced power directly into the national 30 kV power system. The detailed specifications of the three PV plants are presented in Table 1. Their geographical localization and distribution are shown in Figure 1. A block diagram of the three PV solar plants is shown in Figure 2.

2.2. Performances Analysis of the Three Solar Photovoltaic Plants (SPVP)

The performance of each solar PV power plant grid-connected (SPVP) has been analyzed using the technical indices based on the available data collected on-site, such as the performance indicators developed by the International Energy Agency (IEA) within the Photovoltaic Power Systems Program, which were established initially by the IEC standard 61724 [29,30,31,32,33]. In this study, data were recorded every 30 min and the monitoring system was designed according to IEC 61724 [30] where many parameters, such as solar irradiance, ambient temperature, and power generation, are measured instantly. The methodology followed is shown in Figure 3.
The definitions of the main indices examined in this work for the performance analysis of the aforementioned solar PV plants are presented in detail in the following sub-sections.

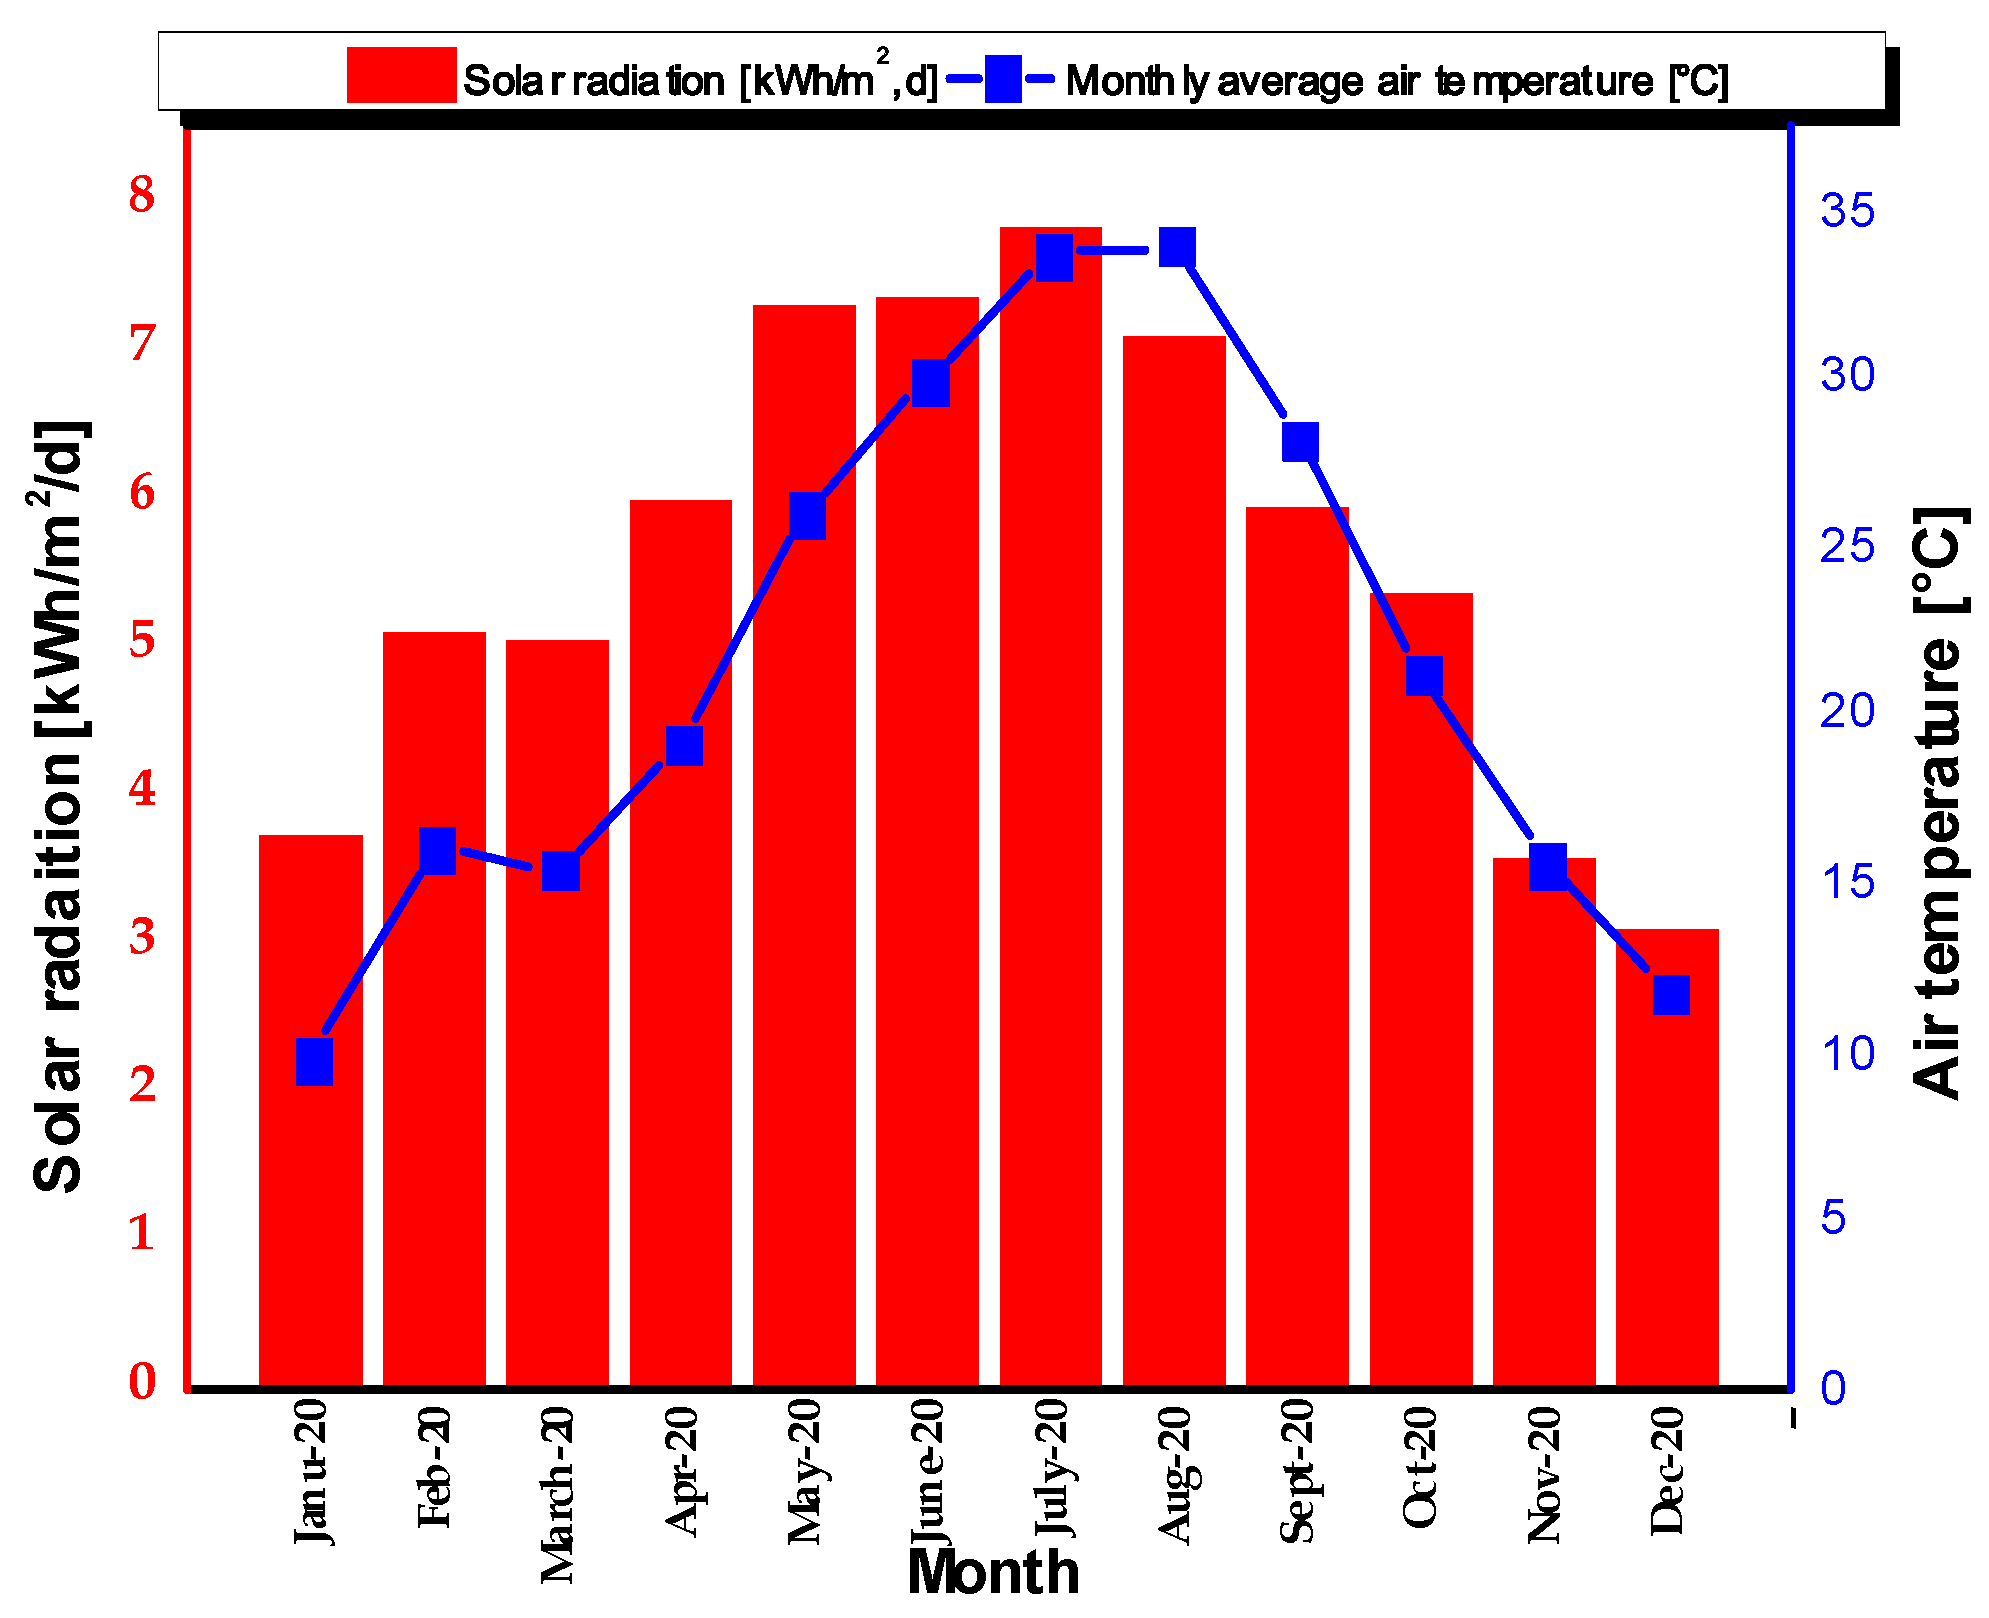
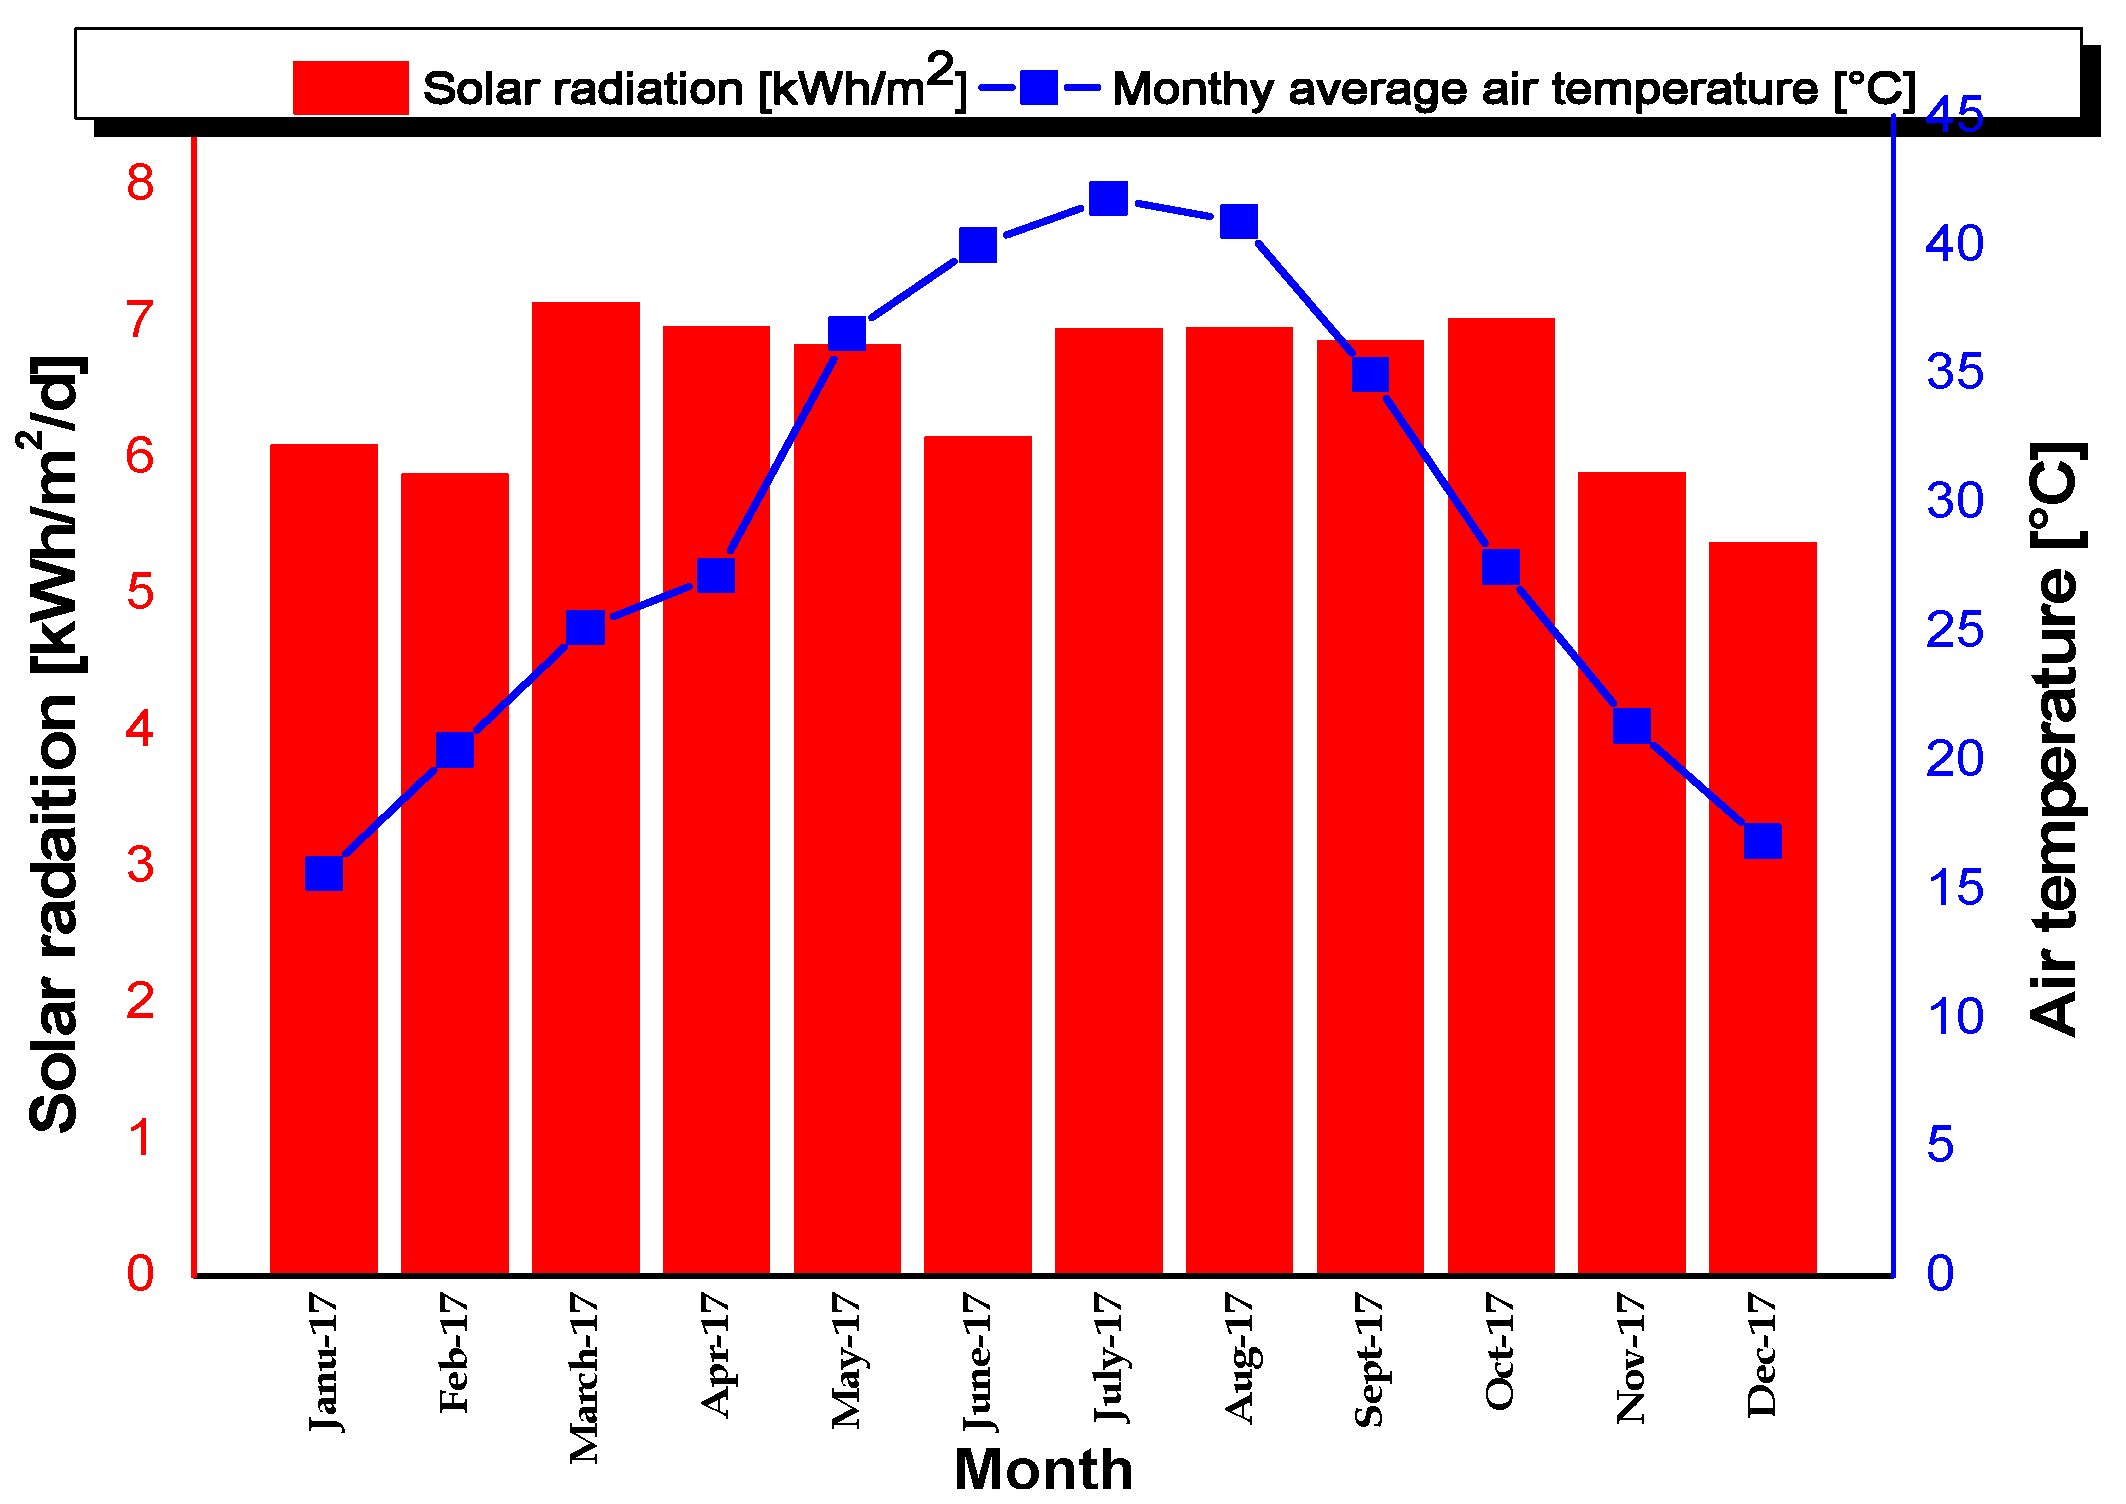
2.2.1. Global Radiation and Alternative Energy Output EAC
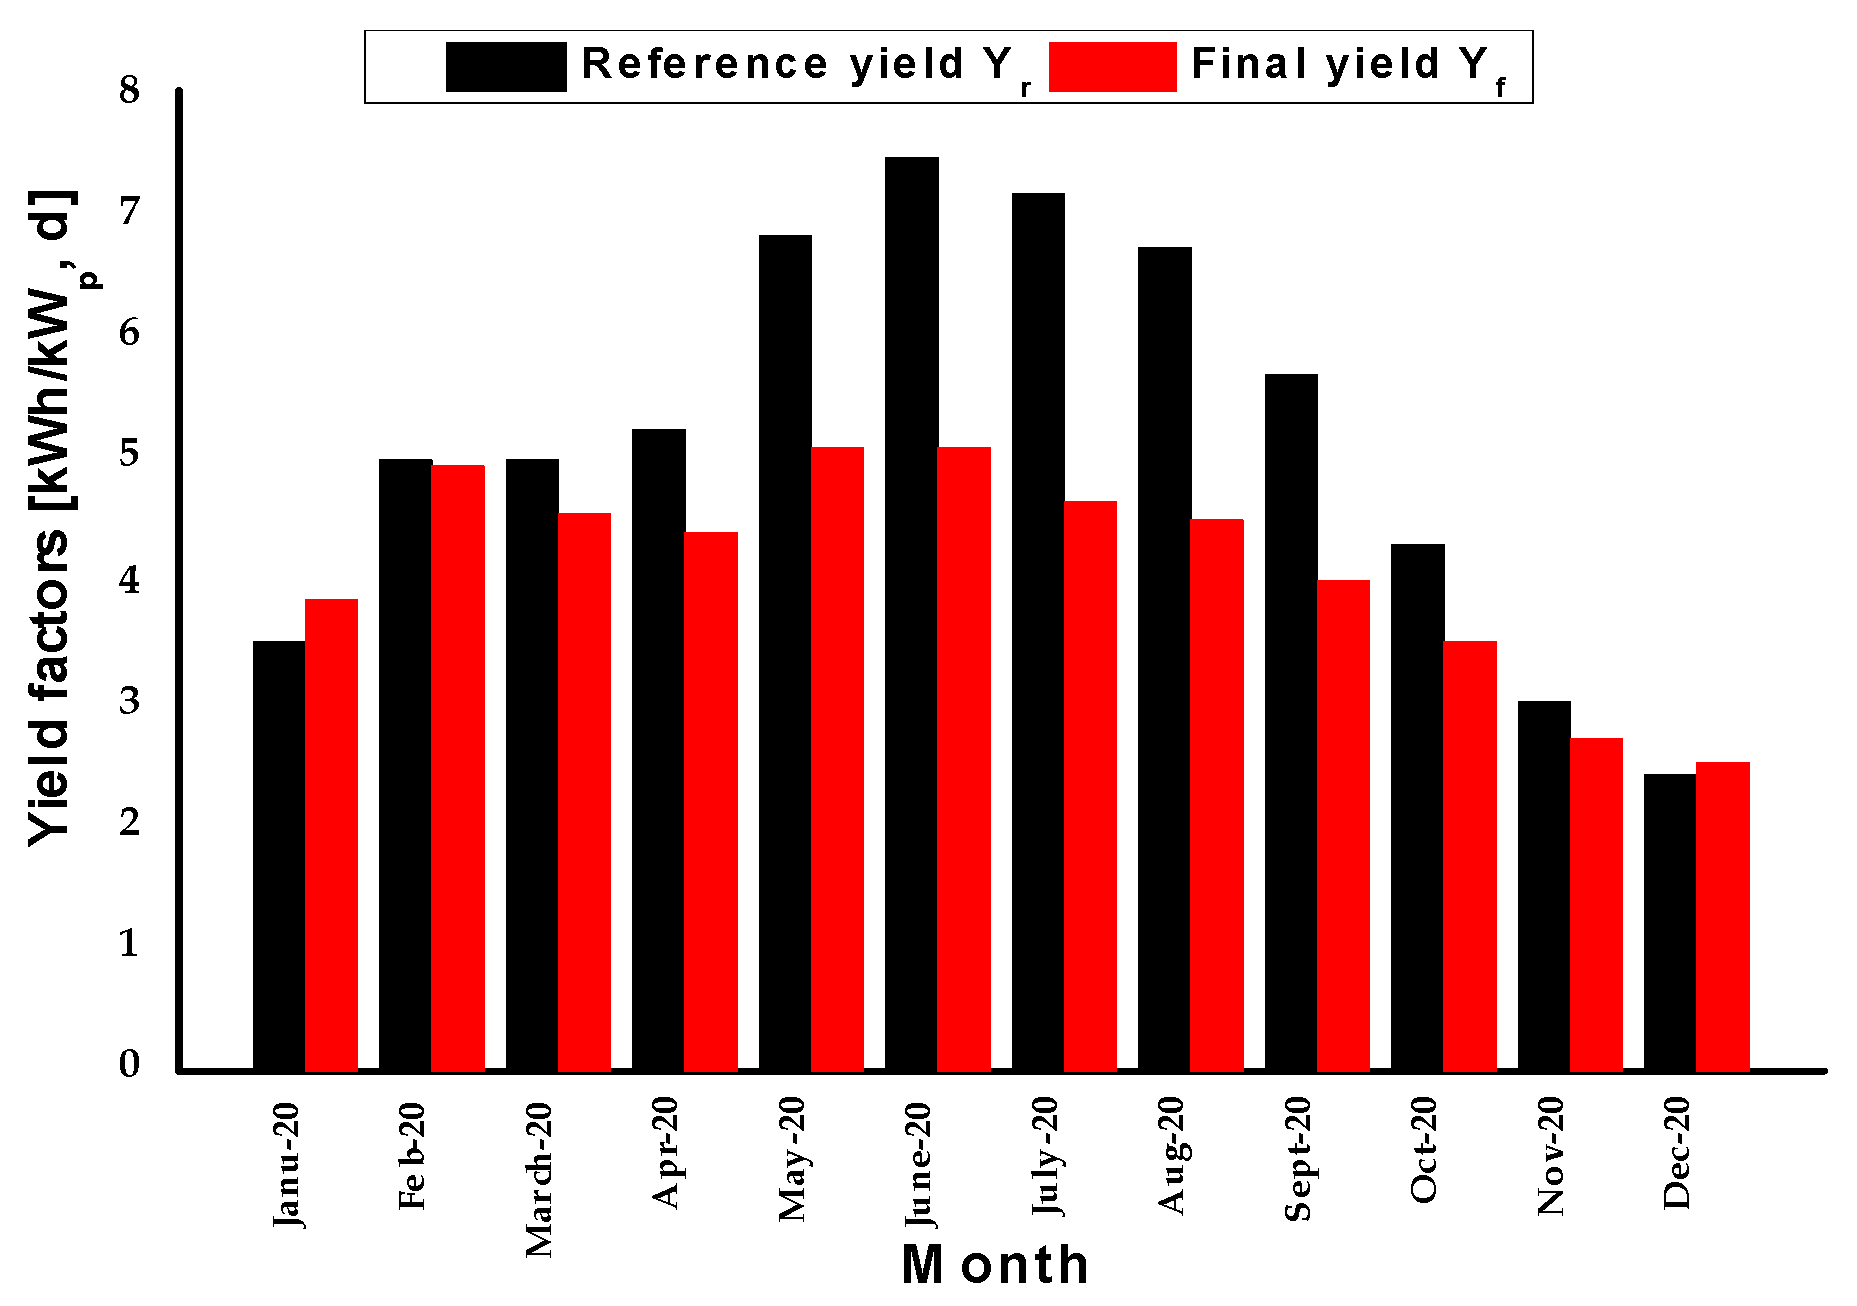
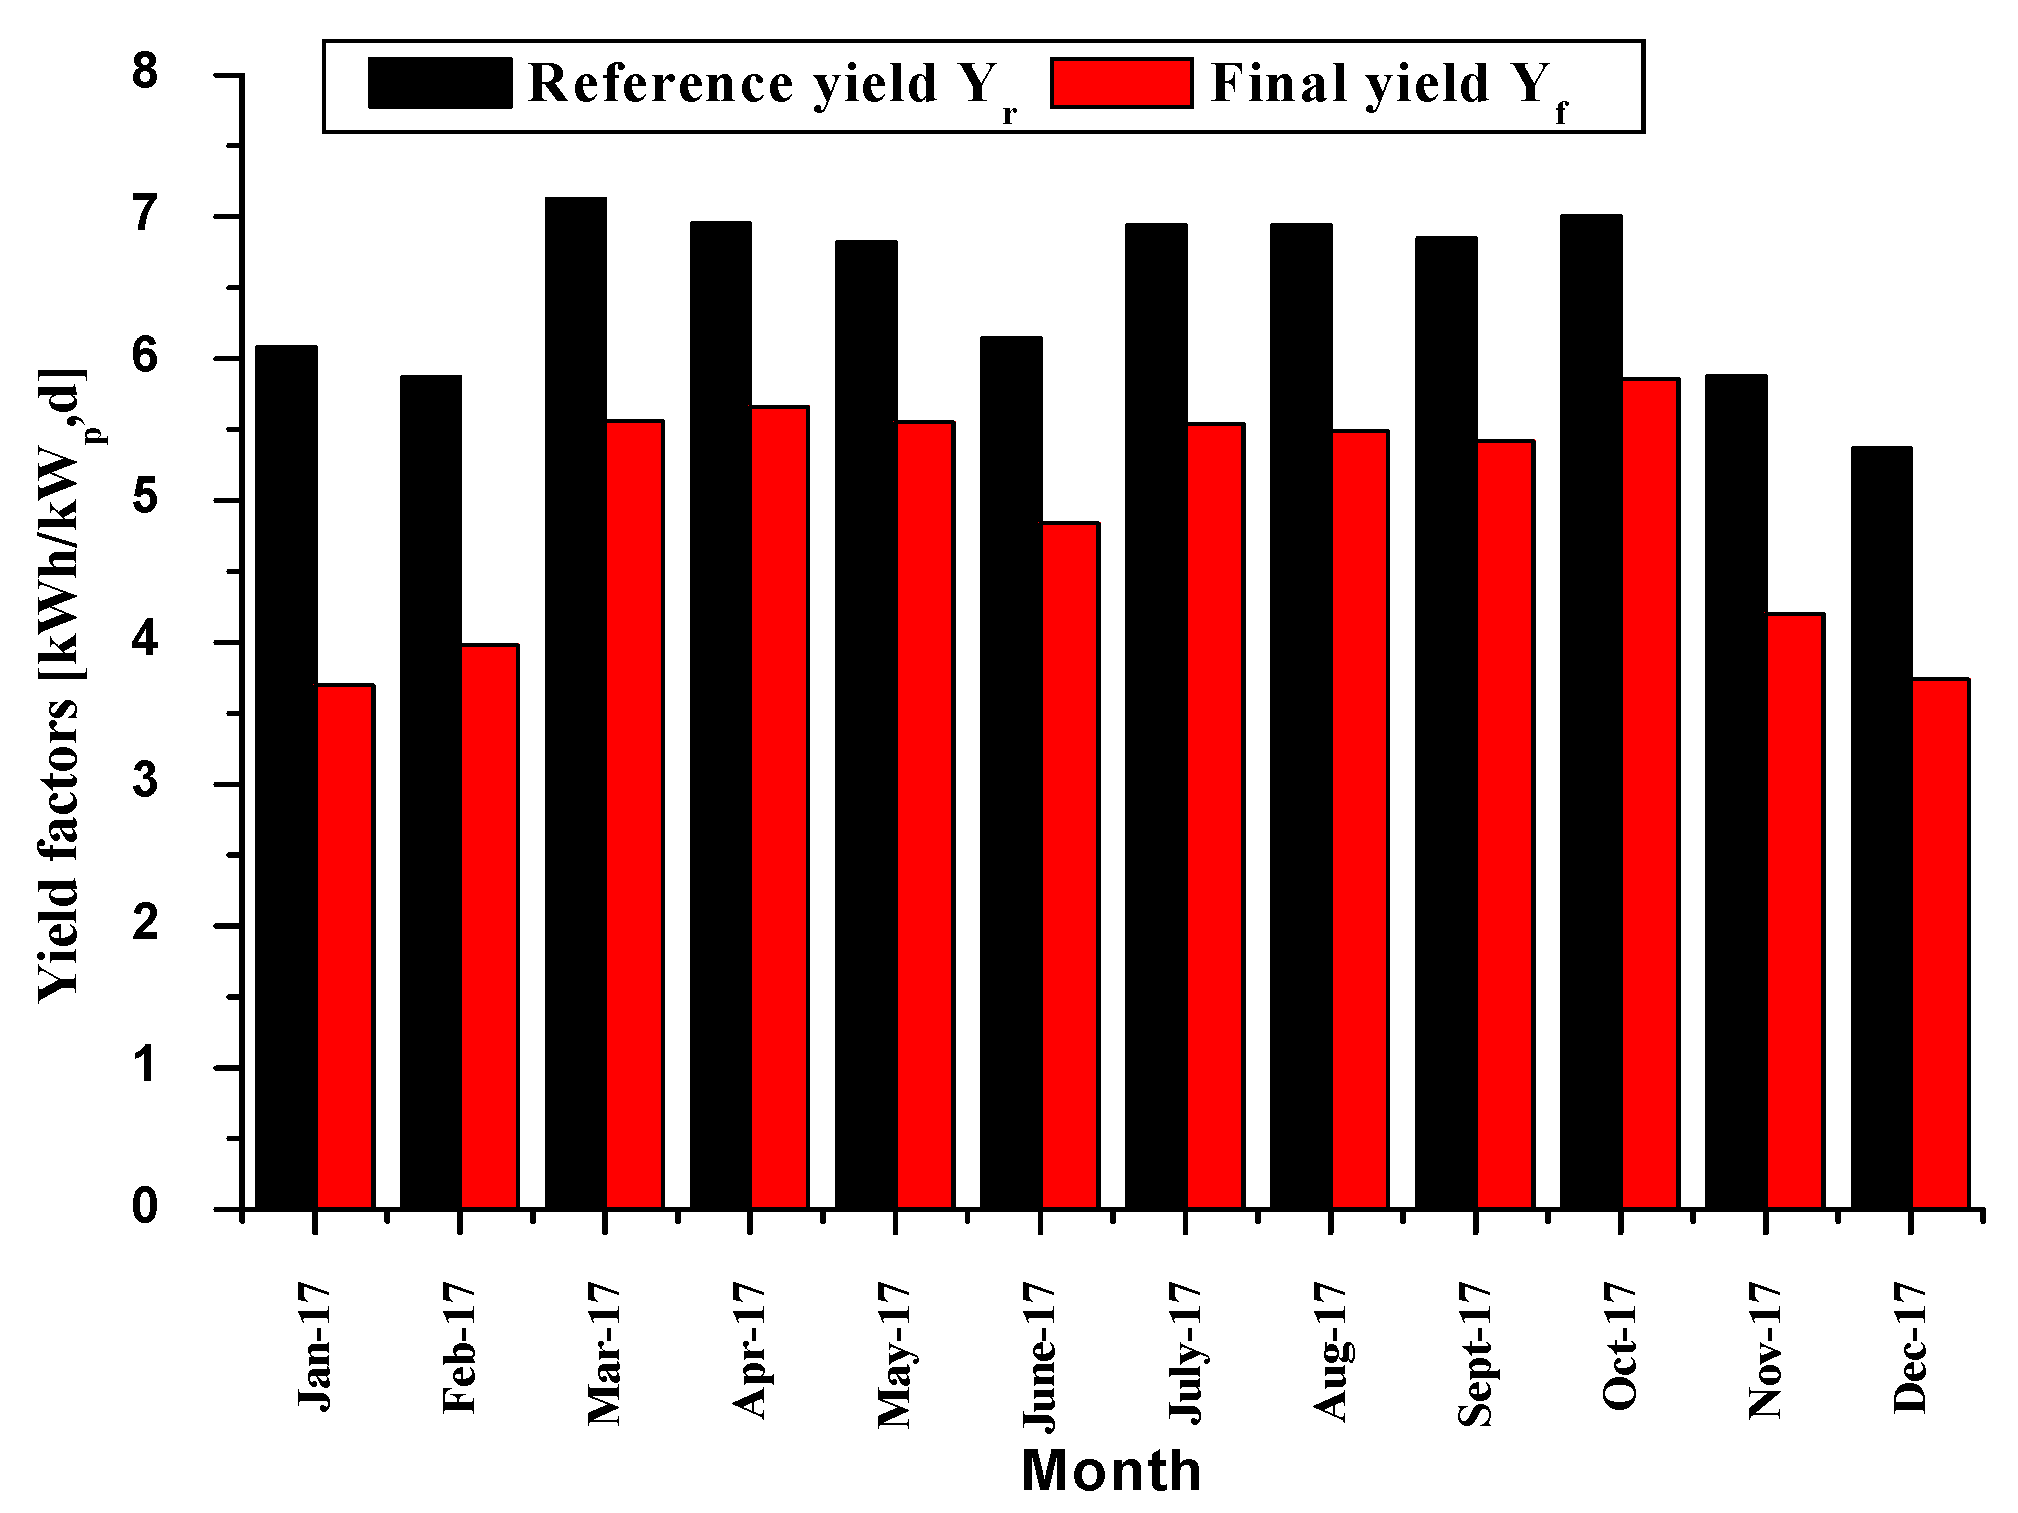
The total in-plane solar radiation refers to the cumulative irradiance observed under real outdoor conditions during the measurement sampling period “τ”, as expressed by the following equation [30]:
H t = τ i = 1 N G mes , i ,
where τ is the sampling time of the measurements presenting the duration of the measurement interval which is considered to be a constant along all of the measurement intervals; Gmes,i (kW/m2) is the measured value of the in-plane irradiance at interval “i” and N is the number of intervals along the entire duration of measurements TM (N = TM/τ).
The alternative energy output is defined as the amount of alternating current (AC) power produced by the solar PV system over a given period.
The total AC energy injected into the grid is expressed as follows [30]:
E AC = τ i = 1 N P mes , i ,
where Pmes,i (kW) is the measured transferred power by the inverter and is injected into the power system at interval “i”.

2.2.2. Reference Yield Factor “Yr

The reference yield “Yr” is defined as the ratio between the global in-plane solar radiation Ht to the reference irradiance HR (1 kW/m2) under standard test conditions (STC). This parameter represents the number of hours of sunshine equivalent to solar irradiance at standard conditions and is dependent on the location, the orientation, and the tilt angle of the PV plant [21,29,31]. It is described by the following Equation (3) [32]:
Y r = H t kWh / m 2 H R kW / m 2 ,

2.2.3. Final Yield Factor “Yf

The final yield factor “Yf” is defined as the ratio between the produced and injected energy output into the grid “EAC” over one day “d”, month “m”, or year and the rated power of the PV array plant (Ppv, rated) under the reference solar irradiance (1 kW/m2) and reference PV cell temperature (25 °C). It can also be described as the number of operational hours that a solar PV plant has to operate at its rated power to provide the same energy as at peak power. Yf provides a convenient way to compare PV plants regardless of their size. The daily final yield “Yf,d” and monthly average final yield “Yf,m” are described by the following equations [21,29,32]:
Y f , d = E AC , d kWh P PV , rated kW ,
Y f , m = 1 N d = 1 N Y f , d ,
where EAC,d is the total daily AC energy output, Ppv, rated is the rated power capacity, and N is the number of days in a month.

2.2.4. Performance Ratio “PR”

The performance ratio plays a crucial role in assessing the performance of a solar PV plant. It represents the overall impact of energy production losses in a solar PV system and remains independent of the system’s installed size and location. Consequently, it serves as a valuable metric for comparing the performance of PV plants installed worldwide [33]. The performance ratio is mathematically defined as the ratio between the final yield “Yf” of the PV system and the reference yield “Yr”, expressed as follows [32]:
PR = Y f Y r ,

2.2.5. Capacity Factor “CF”

The capacity factor “CF” represents the electrical energy injected into the grid by a solar PV system. When a system consistently delivers the maximum energy based on its installed capacity, the capacity factor is equal to one [29]. This factor can be defined as the ratio between the total energy “EAC, T” delivered into the grid and the energy that could be generated if the PV system operated at its peak power “PPV, rated” for 24 h a day throughout the entire year [32,34]. Therefore, it can be expressed as:
CF = Y f 24 . nd = E AC , T P PV , rated . 8760 ,
nd: Number of days of the year.

3. Results and Discussions

3.1. Yield Factors

The study presented in this section focuses on the analysis and presentation of on-site measured data collected for three solar PV plants, namely Sidi-bel-Abbés (SPVP_1), Laghouat (SPVP_2), and Ghardaïa (SPVP_3), situated in different regions during their respective monitoring periods. The data for SPVP_1 and SPVP_2 were recorded from January to December 2020, while the data for SPVP_3 were collected from January to December 2017. The analysis is based on key performance parameters, including monthly average air temperature, daily average solar radiation, final yield (Yf), performance ratio, and capacity factor.
Figure 4, Figure 5 and Figure 6 display the daily solar radiation incident on the PV array plane and the corresponding air temperature for the three studied regions, respectively. Figure 4 illustrates the recorded measurements in Telagh, Sidi-bel-Abbés (SPVP_1), showing the lowest temperature of 6.09 °C in January and the highest temperature of 25.48 °C in July. The daily solar radiation on the PV array plane ranged from 2.42 kWh/m2/d in December to 7.47 kWh/m2/d in June.
Figure 5 presents data for Lekneg, Laghouat (SPVP_2), revealing daily average solar radiation varying between 3.10 kWh/m2/d in December and 7.81 kWh/m2/d in July. The highest monthly average air temperature value of 33.99 °C was recorded in August, whereas the minimum value of 9.82 °C was observed in January.
In Figure 6, the recorded data for Oued Nechou, Ghardaïa (SPVP_3) indicate a maximum daily solar radiation on the PV array plane of 7.14 kWh/m2/d in March and a minimum of 5.38 kWh/m2/d in December. The maximum air temperature of 41.9 °C was observed in July, while the lowest air temperature of 15.7 °C was recorded in December. The yearly average radiation for SPVP_1, SPVP_2, and SPVP_3 were 5.01 kWh/m2/d, 5.3 kWh/m2/d, and 6.51 kWh/m2/d, respectively. Similarly, the yearly average air temperatures for the three sites were 15.5 °C, 21.75 °C, and 29.04 °C, respectively. Notably, the lowest solar radiation value was observed in Telagh, Sidi-bel-Abbés (SPVP_1), whereas the highest was recorded in Oued Nechou, Ghardaïa (SPVP_3). Additionally, the highest air temperature was observed in Oued Nechou, Ghardaïa (SPVP_3), while the minimum was recorded in Sidi-bel-Abbés (SPVP_1).
Figure 7, Figure 8 and Figure 9 depict the daily reference and final yields for the three sites. It is obvious that typically, the PV plant output varies from one month to another along the seasons and the year. It can be observed that the recorded measurements for the sites of Sidi-bel-Abbés (SPVP_1), and Laghouat (SPVP_2) show relative seasonal variations in the reference yield “Yr” which is higher from May to August and lower from November to January. This is contrary to the site of Ghardaïa that shows a relatively mostly stable daily reference yield “Yr” for the most part of the period of monitoring. The yearly average daily reference yield recorded at the three PV plants was 5.01 kWh/kWp/d, 5.30 kWh/kWp/d, and 6.51 kWh/kWp/d, respectively. The highest value of Yr recorded at Ghardaïa shows that a high amount of solar irradiation was received by the PV module surfaces. In contrast, the final yield “Yf” recorded at the three sites varied following this rule between maximum values and minimum values for each site independently; for example, for SPVP_1 it varied between the values of 5.07 kWh/kWp/d in June and 2.52 kWh/kWp/d in December; for SPVP_2, it varied between 5.57 kWh/kWp/d in February and 3.60 kWh/kWp/d in December; and for SPVP_3 it varied between 3.88 kWh/kWp/d in December and 4.60 kWh/kWp/d in April. The gaps between the maximum and minimum recorded values for each site were 2.55 kWh/kWp, 1.97 kWh/kWp, and 0.72 kWh/kWp, respectively. On the other side, it was observed that the average daily values of Yf recorded at the three PV plants were, respectively, 4.15 kWh/kWp/d, 4.68 kWh/kWp/d, and 4.94 kWh/kWp/d. It can be concluded that in the general case, the values of both Yr and Yf were directly proportional to solar radiation and that a higher Yr meant more solar radiation was received in that site [35,36].

3.2. Performance Ratio and Capacity Factor

The performance ratio “PR” remains independent of the solar PV plant’s size and location, serving as a quantifier for the overall impact of losses (losses due to the cell, losses due to non-STC temperature, converter losses, wire losses, and shading losses, etc., [20]) occurring during the plant’s operation, particularly at the output side along the converters’ conversion [37].
Figure 10 and Figure 11 provide insights into the monthly average performance ratio and air temperature, offering a better understanding of the behavior of the solar PV plants at the three study sites, namely SPVP_1, SPVP_2, and SPVP_3. Throughout the study period, the three PV plants exhibit a distinct seasonal pattern for the performance ratio, fluctuating between minimum and maximum values. For SPVP_1, the minimum value of 0.66 and the maximum value of 1.101 were recorded in July and January, respectively, with an average PR of 0.8301. SPVP_2 displayed a minimum PR value of 0.641 and a maximum value of 1.251 in July and January, respectively, with an average of 0.883. SPVP_3 recorded a minimum PR value of 0.607 in January and a maximum value of 0.836 in October, with an average PR of 0.759. Surprisingly, the performance ratio showed lower values during colder months than in warmer months. The lower PR values observed at SPVP_3 were attributed to frequent interruptions in power production in some subsystems at the solar power plant site and the unavailability of measurement data on certain days throughout the year.
Furthermore, the figures indicate that in the winter months, the measured PRs have higher values compared to other months, which can be attributed to the low module temperatures resulting from the colder ambient temperature at the site, as shown in Figure 10. Conversely, lower PR values were measured in the summer months due to the relatively high module temperatures influenced by the elevated ambient temperature at the site, resulting in higher capture losses. This observation aligns with findings reported by Kumar et al. (2020) and Aoun et al. (2017) [20,35].
Moreover, the PRs were greater than 1.00 in January and December for SPVP_1 and during the period from November to February for SPVP_2. These higher PRs can be attributed to the extremely low temperature conditions at both sites during these periods, as shown in Figure 11. However, for SPVP_3, the PRs remained below 1 throughout the year due to significantly higher temperatures compared to the other two sites, as depicted in Figure 11. The gap between the maximum and minimum PR values results is 0.441, 0.61, and 0.229 for SPVP_1, SPVP_2, and SPVP_3, respectively. Overall, the performance of all PV plants is slightly higher in winter than in summer, and the PR values fall within the range considered suitable according to European PV standards.
The PRs values represent the level of losses experienced by the three PV plants, which can be attributed to different losses cited above. PR values within 0.80 and 0.85 are considered good, while values below 0.75 indicate a weak performance of the solar power plant for the respective site [38]. It can be concluded that in order to improve the performance ratio (PR), it is necessary to choose the appropriate module technology and reduce the system losses or this can be achieved by decreasing the module PV temperature [39].
The capacity factor “CF” of solar PV plants depends on the global solar irradiance, the cell conversion efficiency of the PV panels, and the operating time of the solar PV plant (Vasisht et al., 2016) [40]. The CF varies eventually with the AC energy produced in agreement with the Yf of the PV plant (Yadav et al., 2018) [41]. Figure 12, Figure 13 and Figure 14 depict the monthly average capacity factor for the three plants. The monthly CF ranges between 21.13% in May and 10.51% in December for SPVP_1. It varies between a minimum value of 15.11% in December and a maximum value in February of 24.01% for SPVP_2, and it varies between a maximum value of 24.42% in October and a minimum value of 15.41% in January for SPVP_3. The mean CF values of these PV plants are 17.2%, 19.45%, and 20.6% for SPVP_1, SPVP_2, and SPVP_3, respectively, within the study period.
Recently, Kumar et al. [42] reported that the CF ranged from 15.25 to 16.33% depending on the PV module technology, such as crystalline, cadmium telluride (CdTe), and copper indium selenium (CIS). It can be concluded that the overall mean values of the capacity factor for the three sites are compatible with the acceptable values.
Figure 15 summarizes the experimental key performance parameters for each solar PV plant. In fact, the ratio performance of SPVP_2 possesses the highest annual PR (88.3%) which is followed by SPVP_ 1 (83.01%) and finally SPVP_3 (75.9%). It can be said that the values of the annual PR of SPVP_1 and SPVP_2 during the measurement period may be considered acceptable with respect to the values which are reported in the literature.

3.3. Classification of Photovoltaic Power Plants in Algeria

Figure 16 shows the annual average performance ratio for different solar PV plants operating in varied climatic conditions in Algeria. It can clearly be observed that the performance ratio of SPVP_2 (88.3%) is higher than other PV plants installed in other regions in the country, where it is followed by the PV powerplant installed in the region of Saïda (85.52%) based on the study presented in [24], which is using the same module technology (poly-Si) as the first PV plant SPVP_1. In the third position is the PW power plant using a-Si technology which is a part of SPVP_3 that is installed in Ghardaïa (85%) and is discussed separately in the study presented in [29]. It is worthy of note that in this last power plant of Ghardaïa, which is using four different technologies, the performance ratio (78%) that is related to the poly-Si photovoltaic module technology is lower than that of the other technologies used in the same area (mono-Si, Cd-Te, a-Si). From these results, it can be concluded that the optimal choice of photovoltaic array technology leads to an increase in performance ratio. A PR value above 80% is considered good, while values below 75% indicate a weak performance of the solar power plant for the respective site. According to this criterion, the most suitable areas for installing photovoltaic power plants can be classified as follows: Laghoaut, Saida, Ghardaïa, Sidi-bel-Abbés, and El Bayadh, and these areas meet the aforementioned criterion.

3.4. Comparison of the Three PV Plants with Other PV Plants around the World

The performance indicators of the three solar PV plants are compared with solar PV installations in different regions of Algeria and the world as shown in Table 2. From this table, it can be observed that the ratio performance of SPVP_2 (88.3%) is higher than the other systems, followed by Saida, Algeria (85.52%) [24], and finally, Malaysia (85.40%) [39]. The yearly average final yield for SPVP_1 (Sidi-bel-Abbés) is found to be lower than that of Turkey [19] and higher than that of Crete, Greece [21]. The PV system with an amorphous silicon installation in Ghardaïa, Algeria, recorded the highest yearly average final yield of 5.29 kWh/kWp/d [29]. The capacity factors of the present study show a satisfactory result compared with the CF of the other PV plants’ studies in Table 2. The solar PV plants under study demonstrate a superior ratio performance compared to PV plants installed in other locations, even though they operate under similar outdoor conditions. These differences in ratio performance can be attributed to several factors, including the PV panels’ technology [29], the inverter technology utilized [43], and the specific configuration of the PV plants [44]. Overall, these findings indicate that Algeria offers favorable conditions for the efficient deployment of PV systems. The results underscore the potential of solar energy utilization in the country, which could contribute to further advancements in renewable energy initiatives.

4. Statistical Analysis and Comparison

Statistical analysis was carried out to analyze and find the models of the influence between the key performance factors such as the AC power output (PAC,mes) and ratio performance and the environmental factors such as solar irradiance and module temperature of the three (3) solar photovoltaic plants under study.
Temperature is another deciding parameter for the generation of solar power PV plants. A high temperature reduces the energy yield of PV modules operating in real conditions. The relationship between PV cell temperature “Tm” and air temperature “TAir” used in this paper is expressed as follows:
T m = T Air + G 800 T NOCT 20 ,
where NOCT is the nominal temperature operation cell and G is the measured value of the in-plane irradiance at the particular time.
Figure 17 indicates the variation in monthly average module temperature “Tm” for the three PV plants. From this figure, the recorded measurements at Telagh, Sidi-bel-Abbés (SPVP_1) show that the lowest module temperature of 15.28 °C was recorded in December and the highest temperature of 53.02 °C was recorded in July. For Lekneg, Laghouat (SPVP_2), the highest monthly average module temperature value (56.75 °C) was recorded in July and the minimum monthly average module temperature value (22.66 °C) was recorded in December. In contrast, for Oued Nechou, Ghardaïa (SPVP_3), the maximum module temperature (58.23 °C) was observed in July and the lowest module temperature (28.41 °C) was observed in December. Similarly, the yearly average module temperatures recorded for the three PV plants were 34.54 °C, 40.55 °C, and 43.53 °C, respectively. It can be clearly observed that the highest module temperature was recorded at Oued Nechou, Ghardaïa (SPVP_3), and the minimum value was recorded in Sidi-bel-Abbés (SPVP_1).
Figure 18, Figure 19 and Figure 20 show the relationship between the PAC,mes and the in-plane solar irradiance and module temperature for the three power plants over the monitored period. Based on the used data which were obtained for the performed measurements during the month of December with a sampling time of 30 min, the statistical analysis allows us to find the model that allows us to define the relationship between PAC,mes (kW) and the in-plan solar irradiance G (W/m2) of each studied power plant as follows:
P AC _ SPVP _ 1 = 52.434 + 12.882 G mes ,
P AC _ SPVp _ 2 = 365.17 + 74.761 G mes ,
P AC _ SPVP _ 3 = 8.5125 + 0.7957 G mes ,
Equations (9)–(11) show the positive linear relationship between the PAC,mes values and solar irradiance with correlation coefficients (R2) of 0.963, 0.9067, and 0.9368, for the three power plants, respectively.
It is important to clarify that the obtained linear models based on these aforementioned equations for the PV power plants of the three sites are valid for a threshold value of the irradiance (G0) where if the irradiance is below this value, the produced power is considered to be null and the obtained models are not valid. Starting from these values, the obtained model can be used for the prediction and estimation of the output power for the three studied systems according to the obtained models in Equations (9)–(11).
From the experimental data, the minimum solar irradiance (G0) values that enable PV plants to generate electrical energy were 10.85 (W/m2), 14.9 (W/m2), and 41.03 (W/m2) for SPVP_1, SPVP_2, and SPVP_3, respectively.
Similarly, the PAC,mes (kW) values depend on the module PV temperature (°C) according to the obtained linear model for each studied power plant (see Figure 17, Figure 18 and Figure 19) which can be expressed as follows:
P AC _ SPVP _ 1 = 427.88 + 137.96 T m ,
P AC _ SPVP _ 2 = 7703.5 + 529.69 T m ,
P AC _ SPVP _ 3 = 264.06 + 15.40 T m ,
Equations (12)–(14) show the linear relationships between PAC,mes values and the module PV temperature (°C), which present positive correlation coefficients (R2) of 0.5425, 0.334, and 0.6923 for the three power plants, respectively. These linear relationships with positive correlations are due to the fact that a higher temperature is caused by the increased solar irradiance when the sky is clear. However, this should not be confused with the negative effect of the PV module temperature on the alternative power output [39].
In [32], it was found that the linear model between AC power output (W) values and solar irradiance G (W/m2) is PAC = 1.4897G − 22,383 with a correlation coefficient (R2) of 0.9929. In [45], it was found that the linear model between AC power output (W/m2) values and solar irradiance G (W/m2) is PAC = 0.1364G + 0.1358 with a correlation coefficient (R2) of 0.9945. In Brazil, the authors of [46] have developed a relationship between the AC power output (W/m2) values and solar irradiance G (W/m2) based on the linear model PAC = 0.1326G − 1.6457 with a correlation coefficient (R2) of 0.9817. Recently, in [39], the authors have proved that the relationship between the amount of total AC yield (kWh) and the solar irradiation H (kWh/m2) can be presented by the linear model y = 190.75H + 33.44 with a correlation coefficient (R2) of 0.916, while the relationship of the AC power output (kW) with the module temperature “Tm” is represented by y = 4.0741Tm − 104.84 and presents a correlation coefficient (R2) of 0.914. This comparison confirms the results obtained in this paper, which indicates the existence of a strong positive correlation between AC power output (PAC,mes) with the module PV temperature and solar irradiance. It is assumed that the difference between the equations presented in the current study and the previous studies are due to the specific characteristics of each individual PV system, components of PV systems from different manufacturers, and the different climatic conditions related to the location of study [46,47,48].
The influence of temperature on the performance ratios is clearly presented in Figure 21. It can be clearly observed that the negative gradient of the slope proves that an increase in the air temperature reduces the PR of the PV plants. This confirms the results which were obtained in the previous studies of [27,44].

5. Conclusions

The performance assessment of three solar power plants operating in different climate regions in Algeria under outdoor conditions was conducted for 12 months, following the IEC standard 61724, leading to the following conclusions:
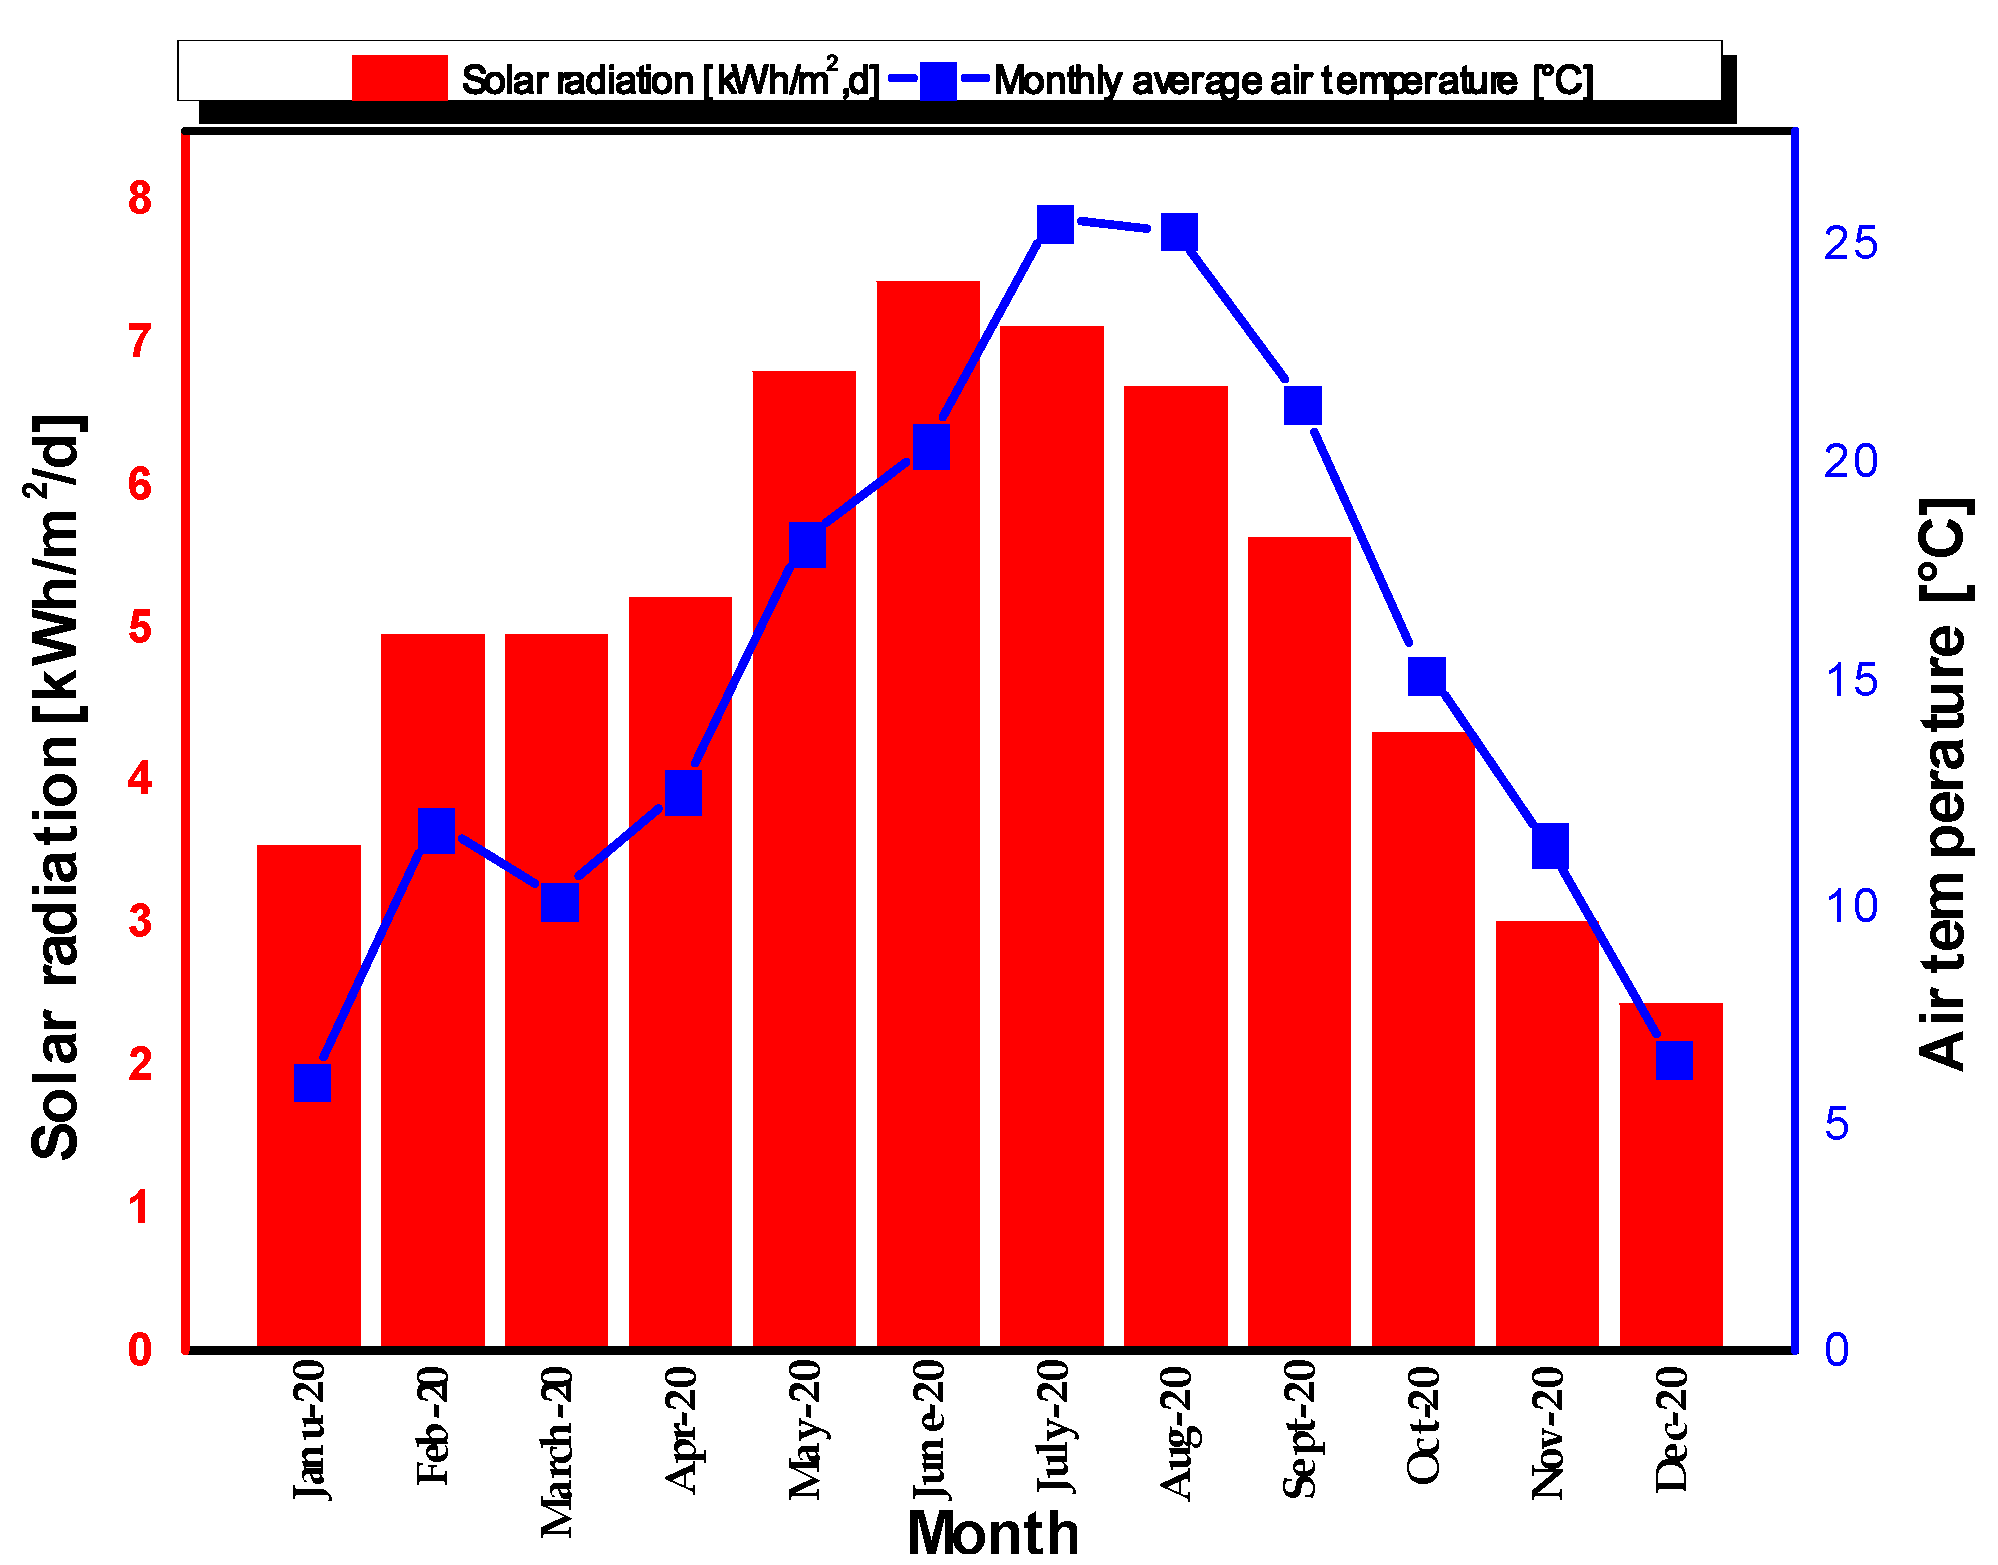
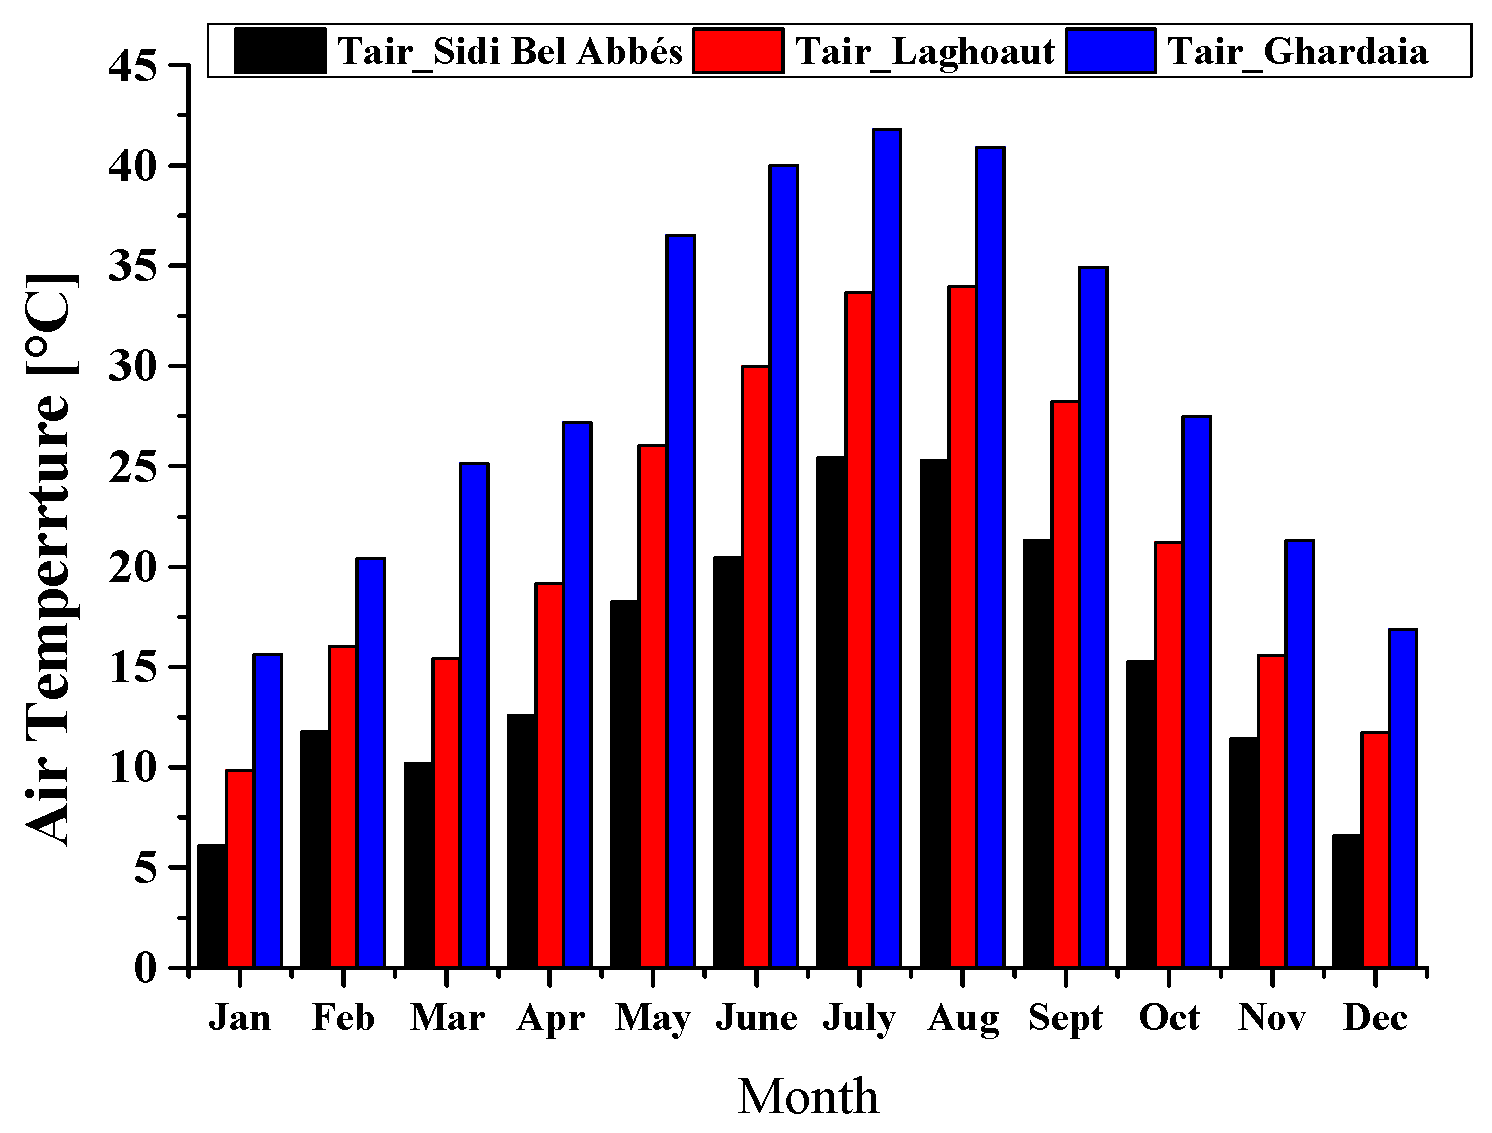
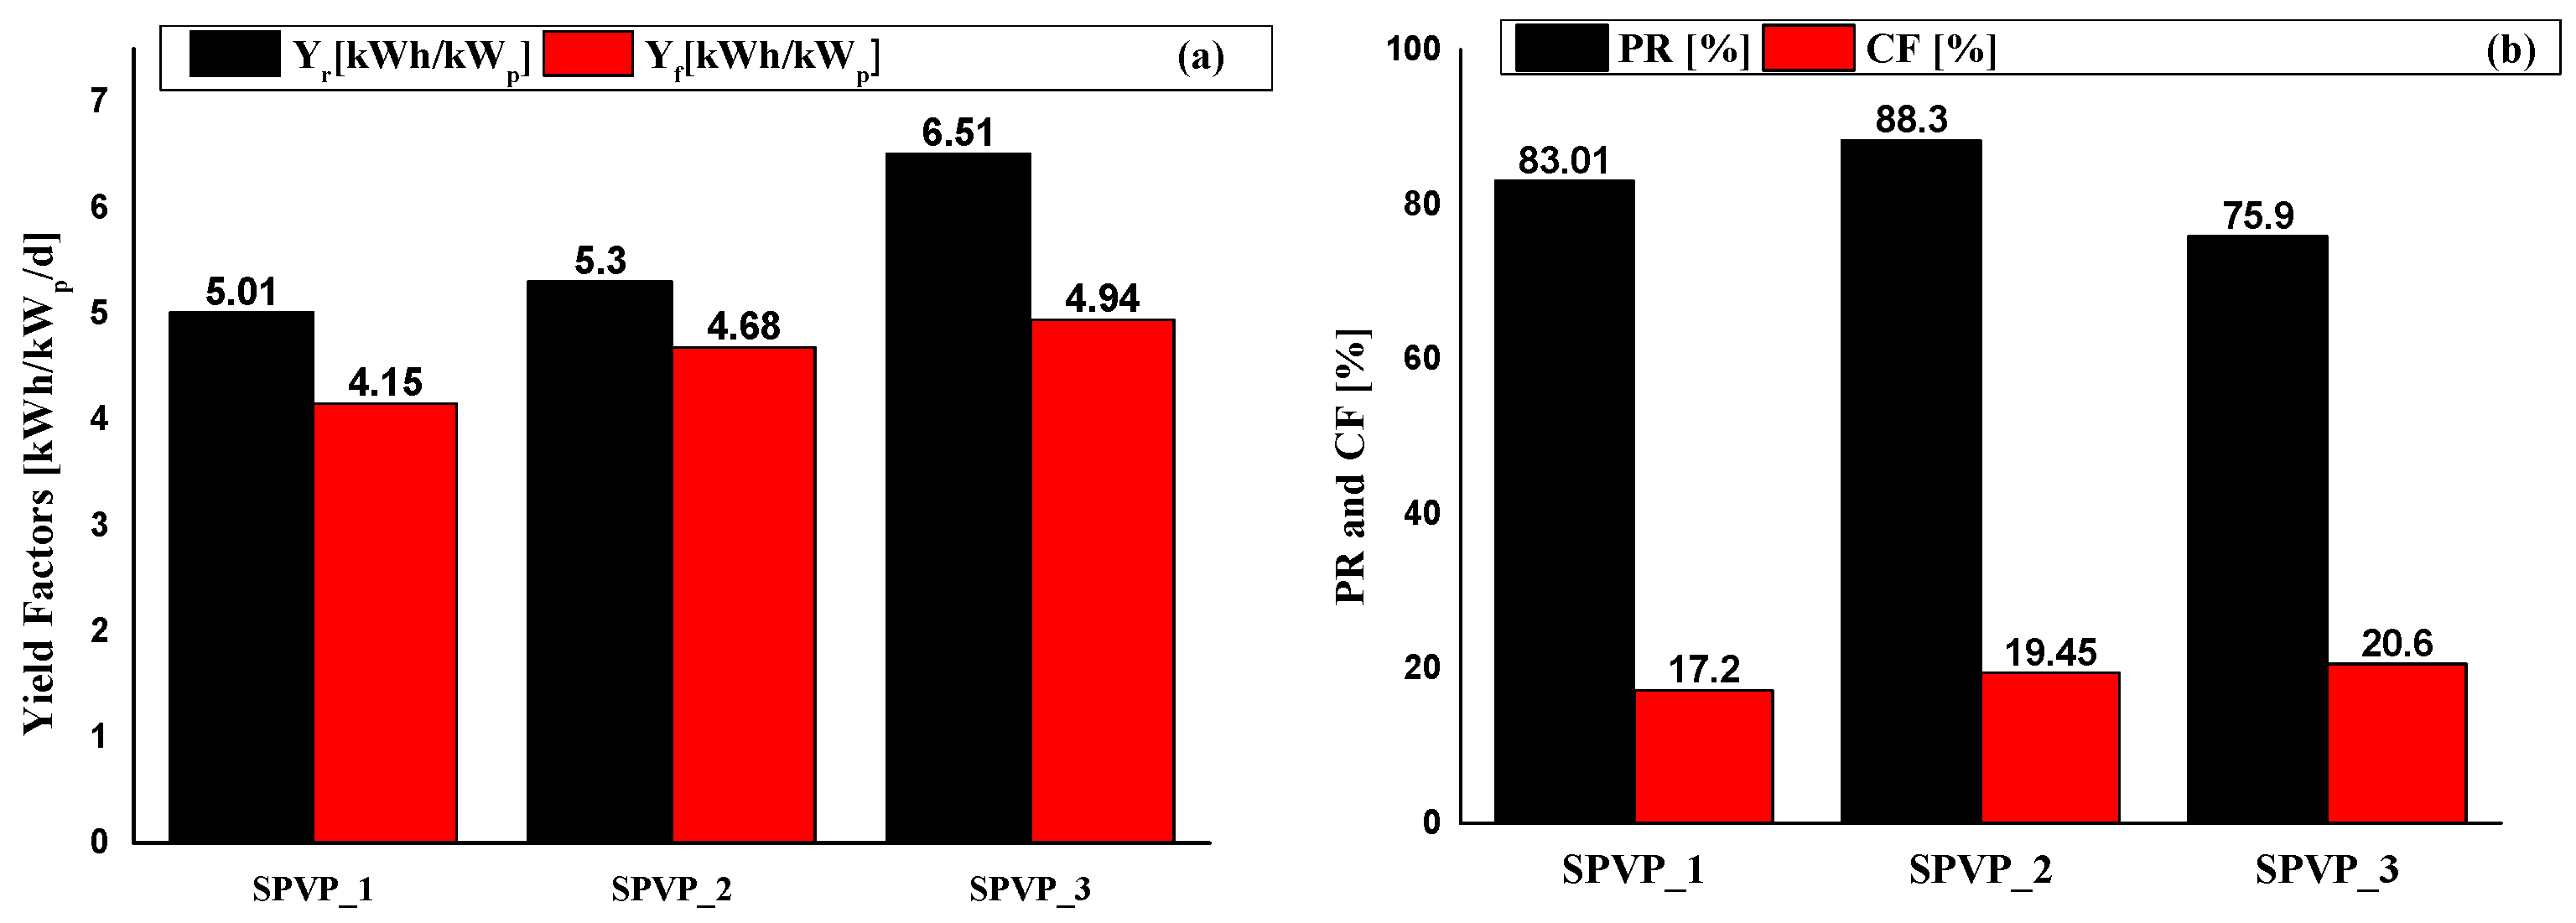
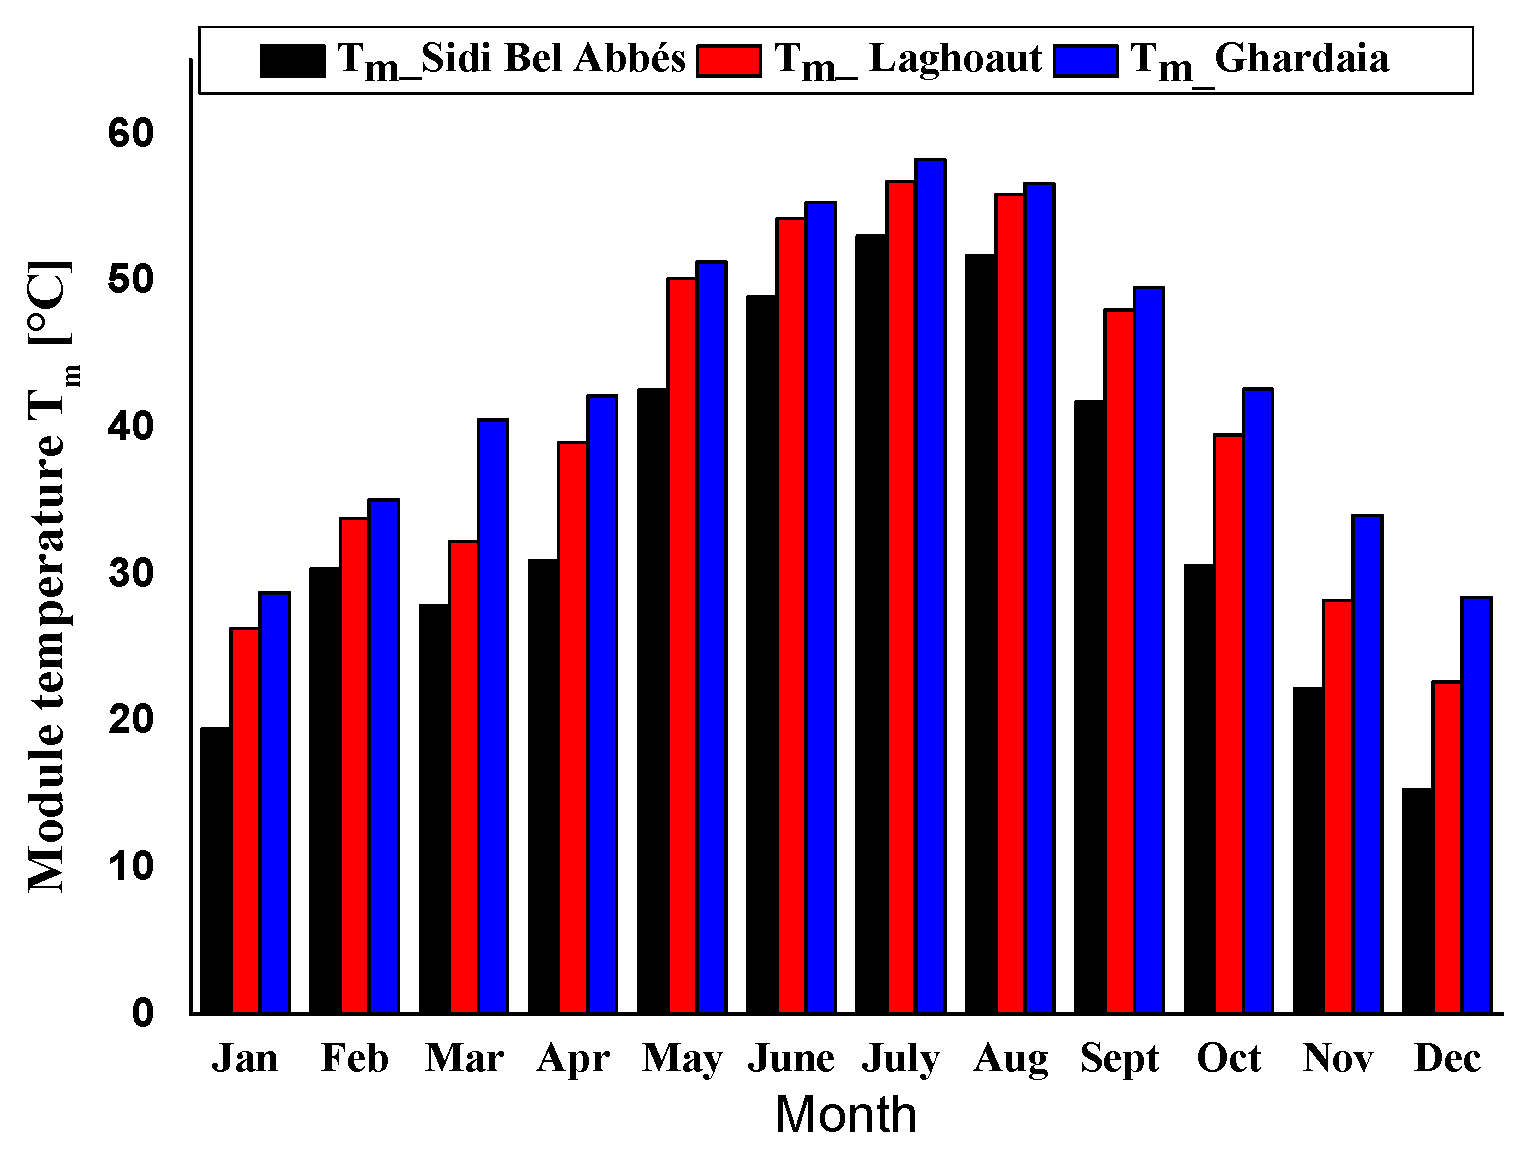
  • The yearly average daily reference yield for the three PV plants was 5.01 kWh/kWp/d, 5.3 kWh/kWp/d, and 6.51 kWh/kWp/d, respectively. Meanwhile, the yearly average air temperatures recorded were 15.5 °C, 21.75 °C, and 29.04 °C, respectively. Based on these values, the average daily final yield “Yf” was found to be 4.15 kWh/kWp/d, 4.68 kWh/kWp/d, and 4.94 kWh/kWp/d for the three plants.
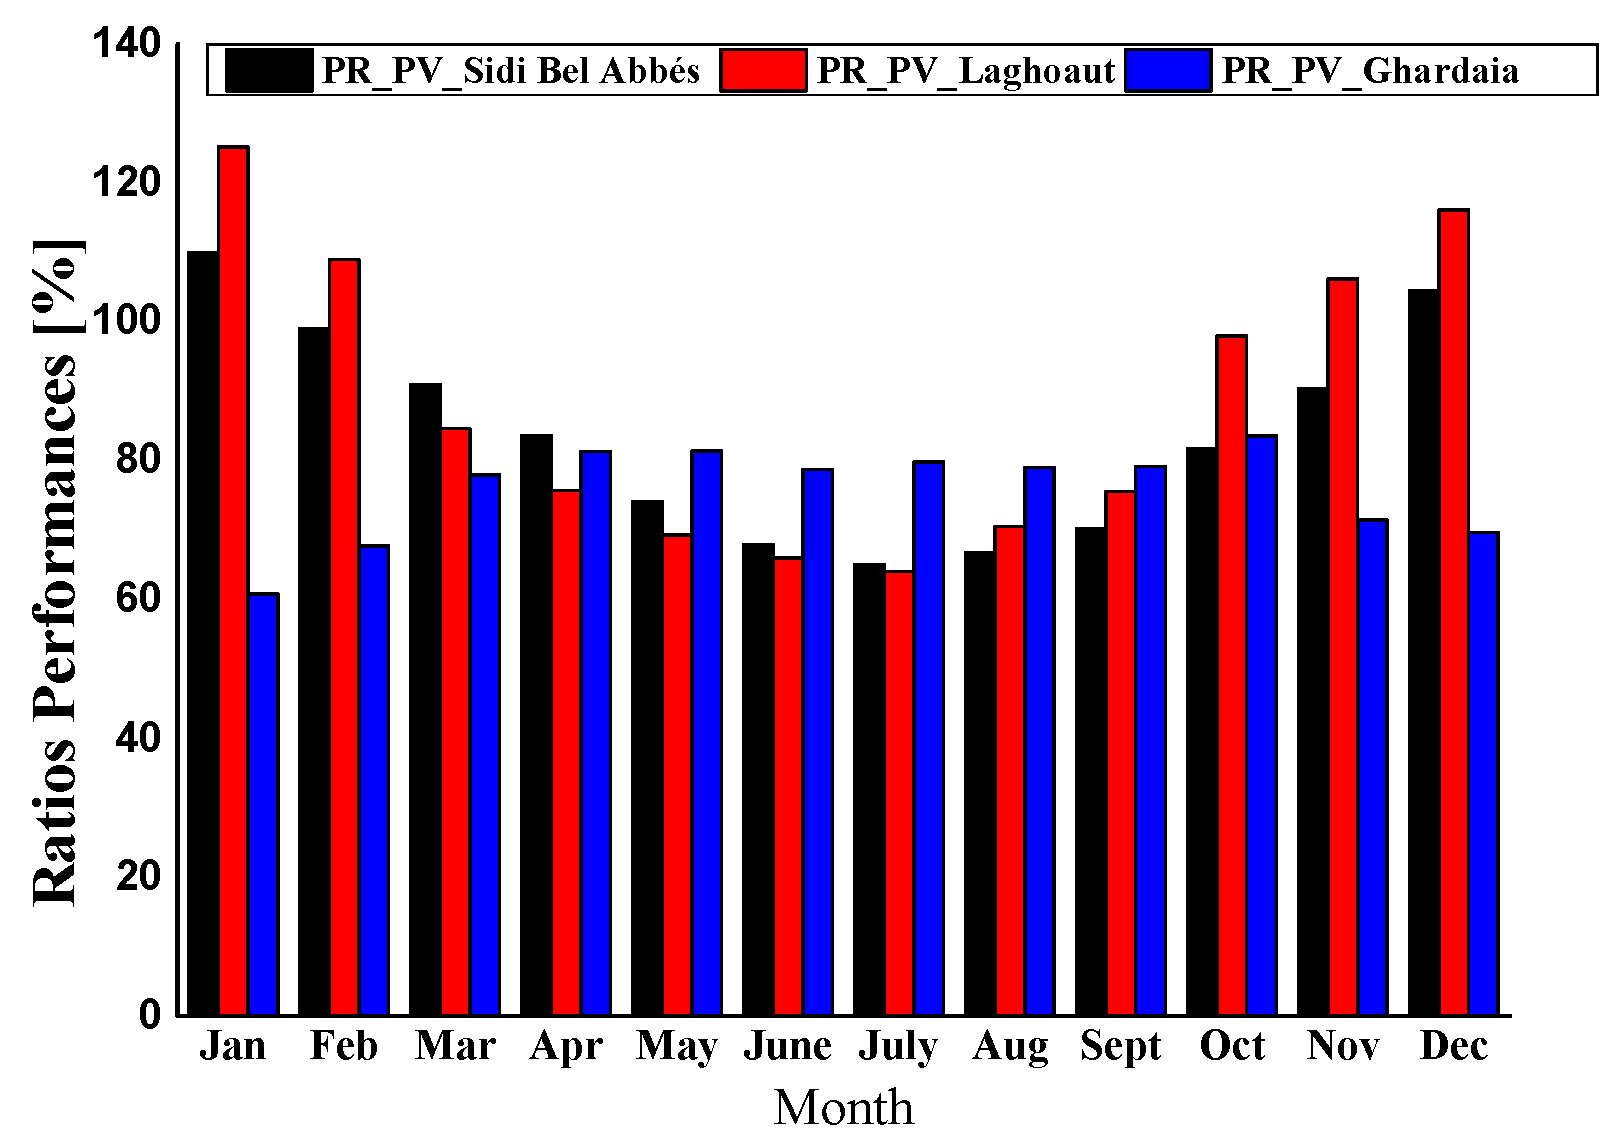
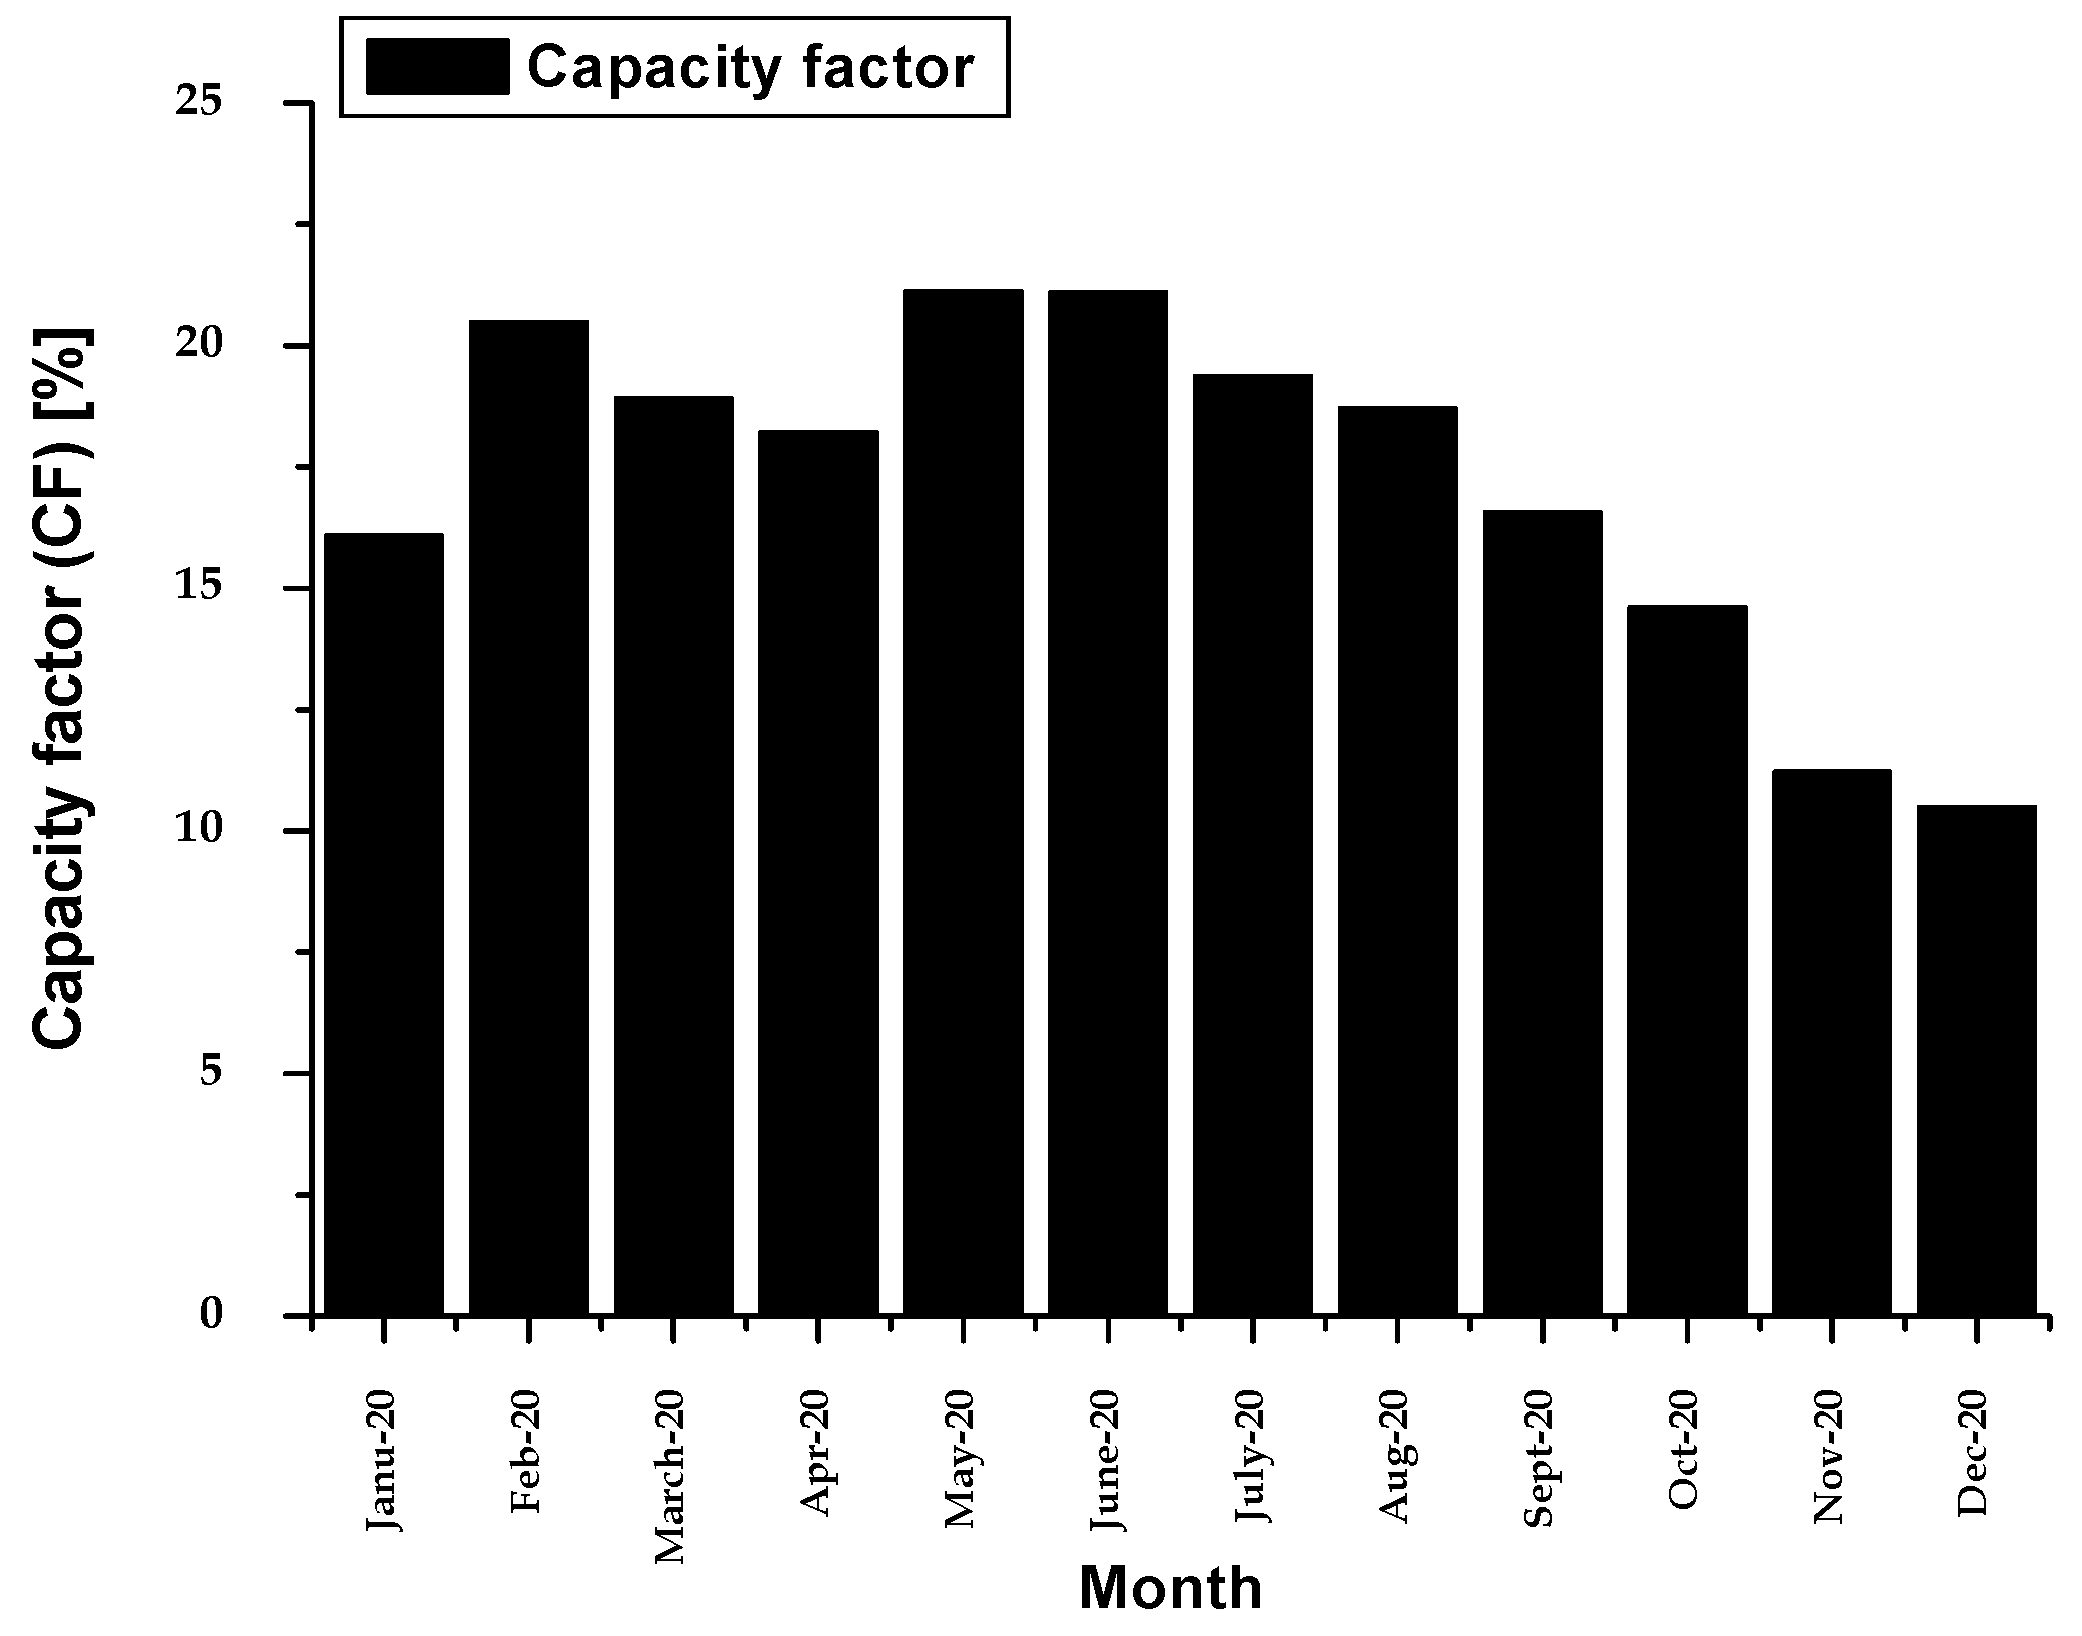
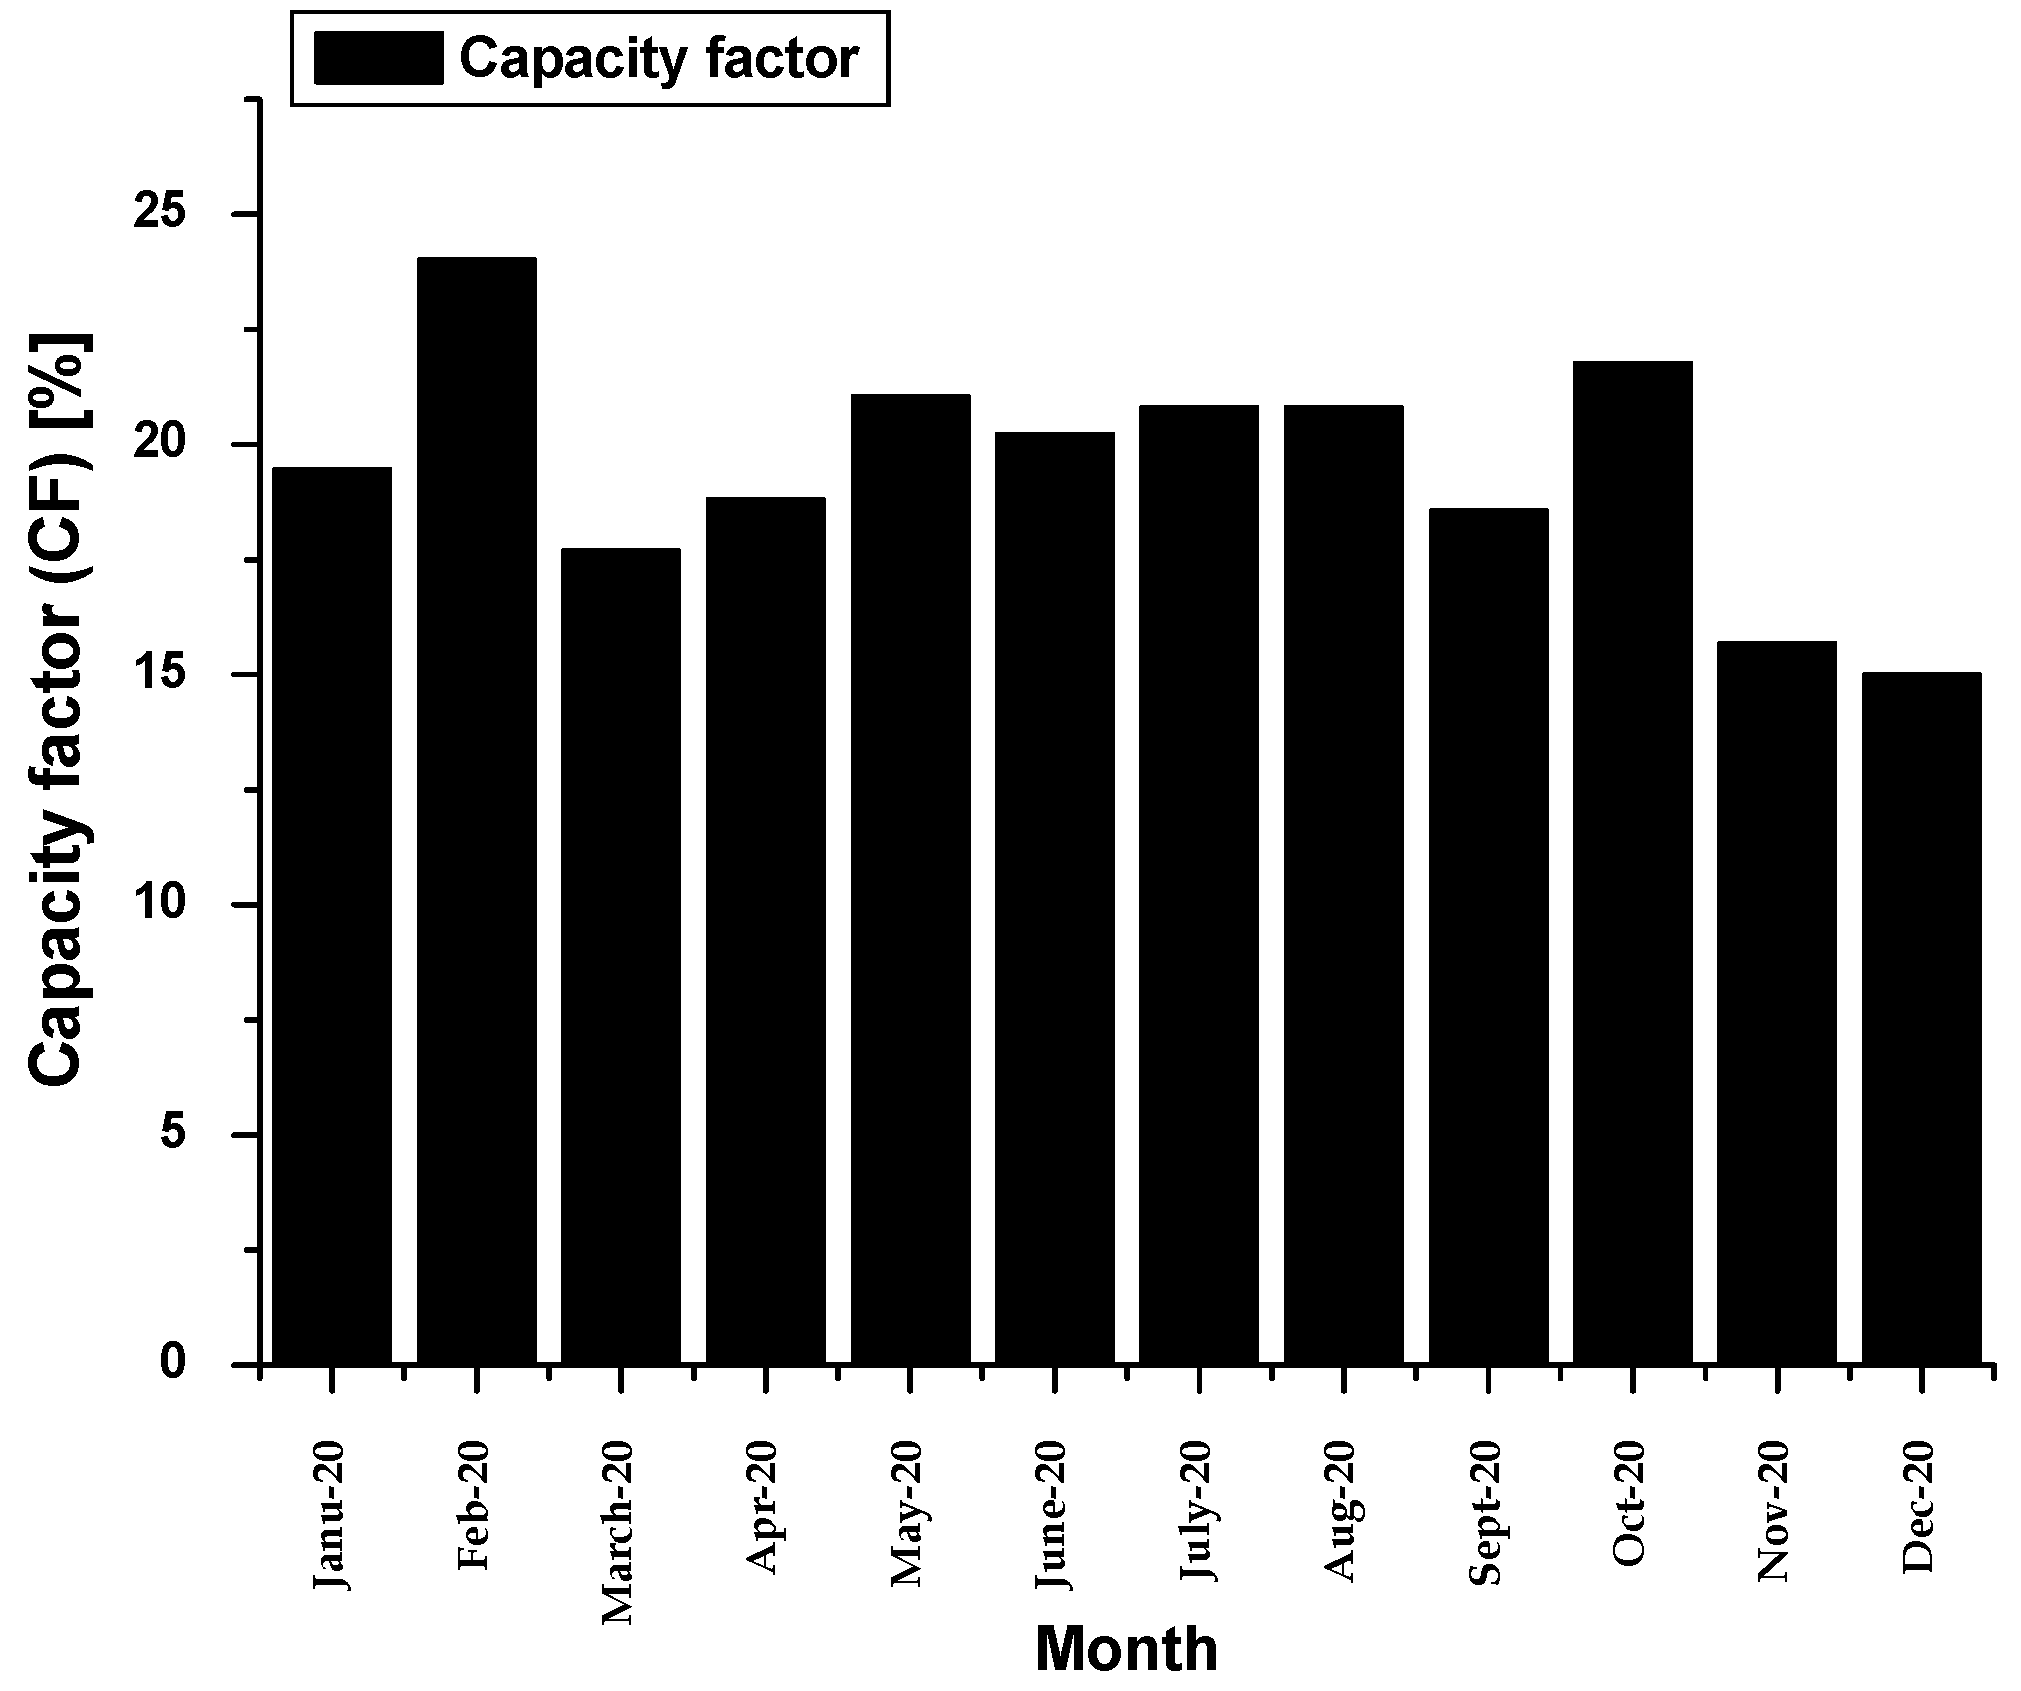
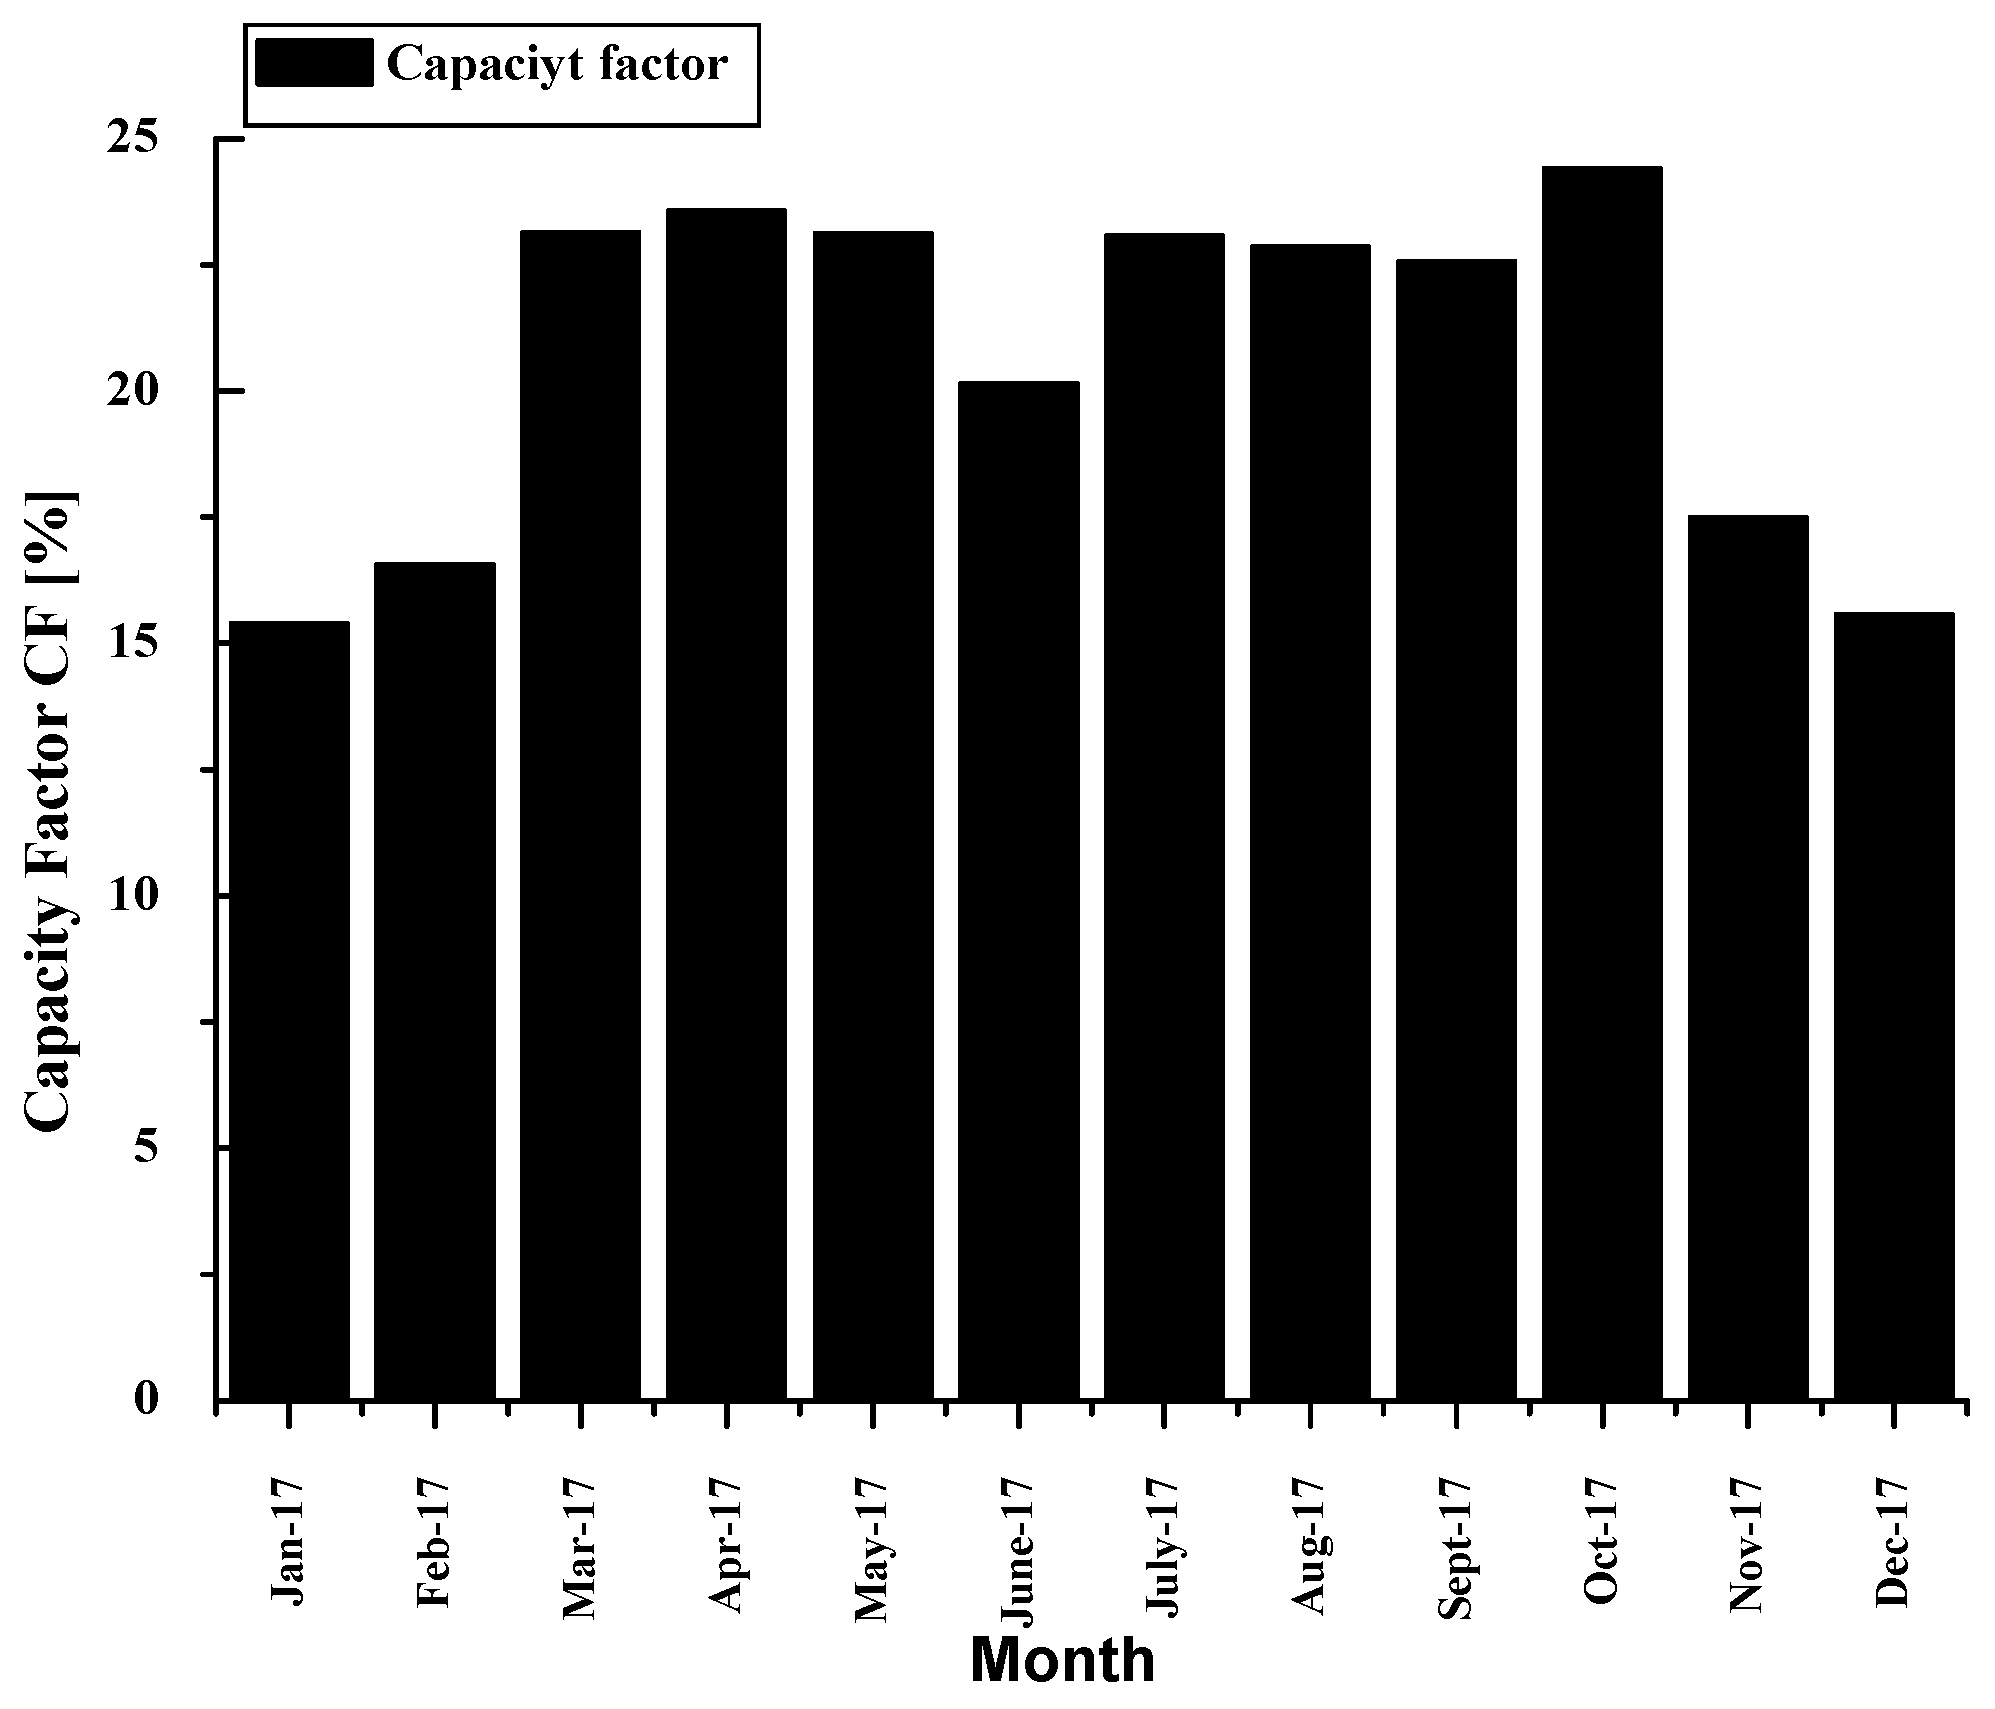
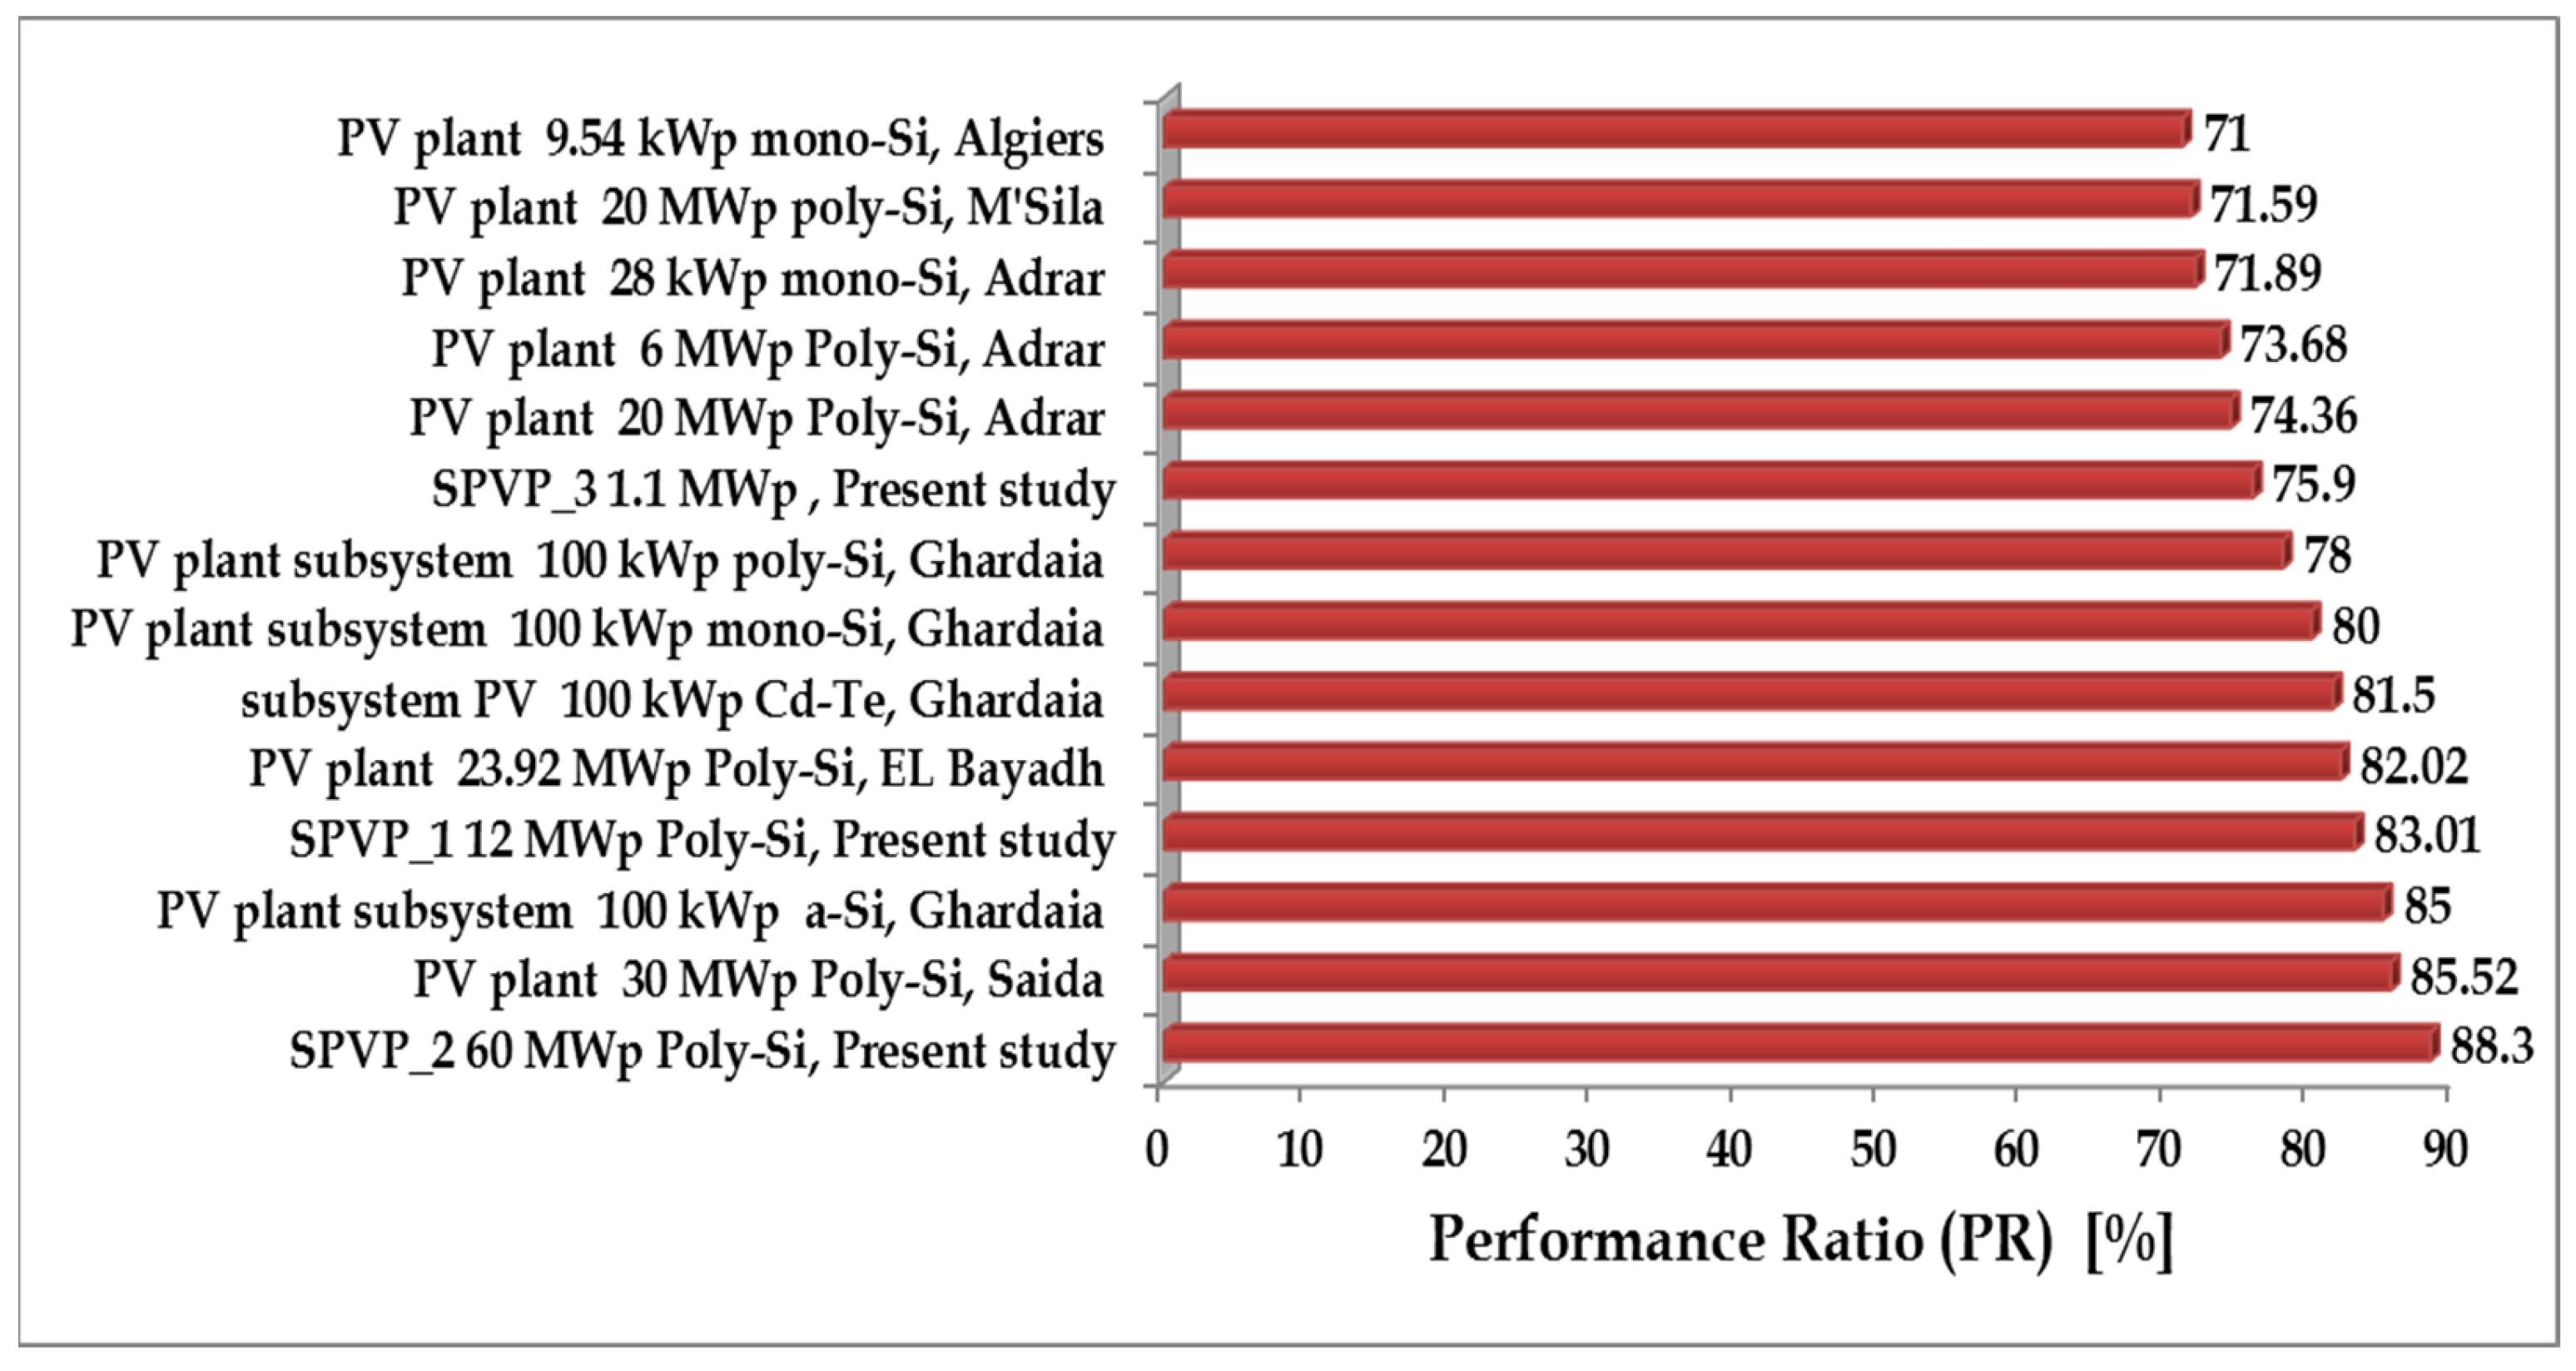
  • The annual average performance ratio “PR” for the three photovoltaic plants was 0.8301, 0.883, and 0.759, respectively. The average capacity factor “CF” values were 17.20%, 19.45%, and 20.6% for SPVP_1, SPVP_2, and SPVP_3, respectively. These results help researchers in the field of solar photovoltaic energy to carry out comparative studies for the design and selection of the best technology related to the concerned location. The results also indicate that SPVP_2 exhibits the highest performance compared to both SPVP_1 and SPVP_3, as well as other PV systems installed at different locations in Algeria, as shown in Table 2. The comparison resulting from the present study proved clearly that the performance of a power PV plant is not only dependent on the solar irradiance but also dependent on the outdoor conditions, which affect significantly the power PV plant performance.
  • Statistical analysis revealed linear models correlating the AC output power (PAC) with solar irradiance and the PV module temperature, as well as the performance ratio with air temperature. These models enable the accurate prediction of the AC output power for the three power plants.
These results are valuable for photovoltaic plant designers to adjust the consumption with photovoltaic power production for off-grid and grid-connected power plants, enabling precise energy production predictions. Moreover, they can help local and international economic factors to enhance the design and economic features of upcoming large-scale solar PV power plants in Algeria.

Author Contributions

Conceptualization, A.F., M.G. and A.K.; methodology, A.F., A.H., L.Z., S.D. and M.A.; software, A.F., A.K. and L.Z.; validation, A.F., A.H., L.Z., S.D. and M.A.; formal analysis, A.F., M.G. and A.K.; investigation, A.F., A.H., L.Z., S.D. and M.A.; resources, A.F., M.G., A.K., A.H., L.Z., S.D., J.R. and M.A.; data duration A.F., M.G. and A.K.; writing—original draft preparation, A.F., M.G., A.K., A.H., L.Z., S.D. and M.A.; writing—review and editing, J.R. and M.A.; visualization, A.F., M.G. and A.K.; supervision, A.K., J.R. and M.A.; project administration, A.K., J.R. and M.A; funding acquisition, A.K., J.R. and M.A. All authors have read and agreed to the published version of the manuscript.

Funding

This project was financially supported by the Directorate General for Scientific Research and Technological Development of the Algerian Ministry of Higher Education and Scientific Research. Authors would like to thank SKTM for providing the data and necessary information.

Institutional Review Board Statement

Not applicable.

Informed Consent Statement

Not applicable.

Data Availability Statement

Not applicable.

Acknowledgments

J. Rodriguez acknowledges the support of ANID through projects FB0008, 1210208, and 1221293.

Conflicts of Interest

The authors declare no conflict of interest.

References

  1. Program for Renewable Energy and Energy Efficiency; Ministry of Energy and Mines of Algeria: Algiers, Algeria, 2011. Available online: https://www.energy.gov.dz/ (accessed on 20 January 2023).
  2. Abada, Z.; Bouharkat, M. Study of management strategy of energy resources in Algeria. Energy Rep. 2018, 4, 1–7. [Google Scholar] [CrossRef]
  3. Bouraiou, A.; Hamouda, M.; Chaker, A.; Lachtar, S.; Neçaibia, A.; Boutasseta, N.; Mostefaoui, M. Experimental evaluation of the performance and degradation of single crystalline silicon photovoltaic modules in the Saharan environment. Energy 2017, 132, 22–30. [Google Scholar] [CrossRef]
  4. Dabou, R.; Bouchafaa, F.; Arab, A.H.; Bouraiou, A.; Draou, M.D.; Neçaibia, A.; Mostefaoui, M. Monitoring and performance analysis of grid connected photovoltaic under different climatic conditions in south Algeria. Energy Convers. Manag. 2016, 130, 200–206. [Google Scholar] [CrossRef]
  5. Boudghene Stambouli, A. Algerian renewable energy assessment: The challenge of sustainability. Energy Policy 2011, 39, 4507–4519. [Google Scholar] [CrossRef]
  6. Zaghba, L.; Khennane, M.; Fezzani, A.; Borni, A.; Hadj Mahammed, I. Experimental outdoor performance evaluation of photovoltaic plant in a Sahara environment (Algerian desert). Int. J. Ambient. Energy 2022, 43, 314–324. [Google Scholar] [CrossRef]
  7. Prime Minister of Algeria. Plan d’action du Gouvernement 16-02-2020. 2020. Available online: http://www.premier-ministre.gov.dz/fr/documents/textes-de-references/plans-d-actions (accessed on 20 January 2023).
  8. Ministère de l’Energie (ME). Energies Nouvelles, Renouvelables et Maitrise de l’Energie. Available online: https://www.energy.gov.dz/?rubrique=energies-nouvelles-renouvelables-et-maitrise-e-lrenergie (accessed on 20 January 2023).
  9. Hassan, Q.; Jaszczur, M.; Przenzak, E.; Abdulateef, J. The PV cell temperature effect on the energy production and module efficiency. In Proceedings of the Contemporary Problems of Power Engineering and Environmental Protection, Gliwice, Poland; 2016; Volume 33, p. 1. [Google Scholar]
  10. Kazem, H.A.; Al-Badi, H.A.; Al Busaidi, A.S.; Chaichan, M.T. Optimum design and evaluation of hybrid solar/wind/diesel power system for Masirah Island. Environ. Dev. Sustain. 2017, 19, 1761–1778. [Google Scholar] [CrossRef]
  11. Fezzani, A.; Hadj-Mahammed, I.; Kouzou, A.; Zaghba, L.; Drid, S.; Khennane, M.; Kennel, R.; Abdelrahem, M. Energy Efficiency of Multi-Technology PV Modules under Real Outdoor Conditions—An Experimental Assessment in Ghardaïa, Algeria. Sustainability 2022, 14, 1771. [Google Scholar] [CrossRef]
  12. Naji Alhsnawi, B.; Jasim, B.H. A New energy management system of On-grid/Off–grid using adaptive Neuro-Fuzzy inference system. J. Eng. Sci. Technol. 2020, 15, 3903–3919. [Google Scholar]
  13. Okonkwo, P.C.; Barhoumi, E.; Murugan, S.; Zghaibeh, M.; Otor, C.; Abo-Khalil, A.G.; Amer Mohamed, A.M. Economic analysis of cross-breed power arrangement for Salalah region in the Al-Khareef season. Int. J. Sustain. Energy 2020, 40, 188–206. [Google Scholar] [CrossRef]
  14. Okonkwo, P.C.; Barhoumi, E.; Emori, W.; Issa Shammas, M.; Uzoma, P.C.; Amer Mohamed, A.M.; Abdullah, A.M. Economic evaluation of hybrid electrical systems for rural electrification: A case study of a rural community in Nigeria. Int. J. Green Energy 2022, 19, 1059–1071. [Google Scholar] [CrossRef]
  15. Med Yahya, A.; Mahmoud, A.K.; Daher, D.H.; Gaillard, L.; Menezo, C.; Youm, I.; Mellit, A. Performance analysis of a 48kWp grid-connected photovoltaic plant in the Sahelian climate conditions of Nouakchott, Mauritania. Preprints 2021, 2021020275. [Google Scholar] [CrossRef]
  16. Attari, K.; Elyaakoubi, A.; Asselman, A. Performance analysis and investigation of a grid-connected photovoltaic installation in Morocco. Energy Rep. 2016, 2, 261–266. [Google Scholar] [CrossRef]
  17. Kazem, H.A.; Khatib, T.; Sopian, K.; Elmenreich, W. Performance and feasibility assessment of a 1.4 kW roof top grid-connected photovoltaic power system under desertic weather conditions. Energy Build. 2014, 82, 123–129. [Google Scholar] [CrossRef]
  18. Emziane, M.; Al Ali, M. Performance assessment of rooftop PV systems in Abu Dhabi. Energy Build. 2015, 108, 101–105. [Google Scholar] [CrossRef]
  19. Cubukcu, M.; Gumus, H. Performance Analysis of a Grid-Connected Photovoltaic Plant in Eastern Turkey. Sustain. Energy Technol. Assess. 2020, 39, 100724. [Google Scholar] [CrossRef]
  20. Kumar, N.M.; Yadav, S.K.; Chopra, S.S.; Bajpai, U.; Gupta, R.P.; Padmanaban, S.; Blaabjerg, F. Operational performance of on-grid solar photovoltaic system integrated into pre-fabricated portable cabin buildings in warm and temperate climates. Energy Sustain. Dev. 2020, 57, 109–118. [Google Scholar] [CrossRef]
  21. Kymakis, E.; Kalykakis, S.; Papazoglou, T.M. Performance Analysis of a Grid Connected Photovoltaic Park on the Island of Crete. Energy Convers. Manag. 2009, 50, 433–438. [Google Scholar] [CrossRef]
  22. Cherfa, F.; Hadj Arab, A.; Oussaid, R.; Abdeladim, K.; Bouchakour, S. Performance analysis of the mini-grid connected photovoltaic system at Algiers. Energy Procedia 2015, 83, 226–236. [Google Scholar] [CrossRef]
  23. Kichene, M.; Boudghene Stambouli, A.; Chouder, A.; Loukriz, A.; Bendib, A.; Hafiz, A. Performance Investigation of a Large-Scale Grid-Tied PV Plant under High Plateau Climate Conditions: Case Study Ain El-Melh, Algeria. J. Eur. Des Systèmes Autom. 2023, 56, 483–492. [Google Scholar] [CrossRef]
  24. Ihaddadene, R.; Elhassen Jed, M.; Ihaddadene, N.; De Souza, A. Analytical assessment of Ain Skhouna PV plant performance connected to the grid under a semi-arid climate in Algeria. Sol. Energy 2022, 232, 52–62. [Google Scholar] [CrossRef]
  25. El-Hadi Dahmoun, M.; Bekkouche, B.; Sudhakar, K.; Guezgouz, M.; Chenafi, A.; Chaouch, A. Performance evaluation and analysis of grid-tied large scale PV plant in Algeria. J. Renew. Sustain. Energy 2021, 224, 279–284. [Google Scholar] [CrossRef]
  26. Sahouane, N.; Dabou, R.; Ziane, A.; Necaibia, A.; Bouraiou, A.; Rouabhia, A.; Mohammed, B. Energy and economic efficiency performance assessment of a 28 kWp photovoltaic grid-connected system under desertic weather conditions in Algerian Sahara. Renew. Energy 2019, 143, 1318–1330. [Google Scholar] [CrossRef]
  27. Dahbi, H.; Aoun, N.; Sellam, M. Performance analysis and investigation of a 6 MW grid-connected ground-based PV plant installed in hot desert climate conditions. Int. J. Energy Environ. Eng. 2021, 12, 577–587. [Google Scholar] [CrossRef]
  28. Bentouba, S.; Bourouis, M.; Zioui, N.; Pirashanthan, A.; Velauthapillai, D. Performance assessment of a 20MWphotovoltaic power plant in a hot climate using real data and simulation tools. Energy Rep. 2021, 7, 7297–7314. [Google Scholar] [CrossRef]
  29. Chikha, M.; Berkane, S.; Mahrane, A.; Sellami, R.; Yassaa, N. Performance assessment of a 400 kWp multi- technology photovoltaic grid-connected pilot plant in arid region of Algeria. Renew. Energy 2021, 172, 488–501. [Google Scholar] [CrossRef]
  30. BS EN 61724:1998; Photovoltaic System Performance Monitoring-Guidelines for Measurement, Data Exchange and Analysis. Technical Committee GEL/82; B.E. British Standards Institution: London, UK, 1998.
  31. Marion, B.; Adelstein, J.; Boyle, K.; Hayden, H.; Hammond, B.; Fletcher, T.; Canada, B.; Narang, D.; Shugar, D.; Wenger, H.; et al. Performance Parameters for grid-connected PV systems. Energy Rep. 2005, 3, 76–84. [Google Scholar]
  32. Ayompe, L.M.; Duffy, A.; Mccormack, S.J.; Conlon, M. Measured performance of a 1.72 kW rooftop grid connected photovoltaic system in Ireland. Energy Convers. Manag. 2011, 52, 816–825. [Google Scholar] [CrossRef]
  33. Sreenath, S.; Sudhakar, K.; Yusop, A.F.; Solomin, E.; Kirpichnikova, I.M. Solar PV energy system in Malaysian airport: Glare analysis, general design and performance assessment. Energy Rep. 2020, 6, 698–712. [Google Scholar] [CrossRef]
  34. Moore, L.M.; Post, H.N. Five years of operating experience at a large. Utility scale photovoltaic generating plant. Prog. Photovolt. Res. Appl. 2008, 16, 249–259. [Google Scholar] [CrossRef]
  35. Aoun, N.; Bouchouicha, K.; Chenni, R. Performance evaluation of a mono-crystalline photovoltaic module under different weather and sky conditions. Int. J. Renew. Energy Res. 2017, 7, 292–297. [Google Scholar]
  36. Allouhi, A.; Saadani, R.; Buker, M.S.; Kousksou, T.; Jamil, A.; Rahmoune, M. Energetic, economic and environmental (3E) analyses and LCOE estimation of three technologies of PV grid-connected systems under different climates. Sol. Energy 2019, 178, 25–36. [Google Scholar] [CrossRef]
  37. Sukumaran, S.; Sudhakar, K. Fully solar powered Raja Bhoj International Airport: A feasibility study. Resour.-Eff. Technol. 2017, 3, 309–316. [Google Scholar] [CrossRef]
  38. Bhola, P.; Bhardwaj, S. Clustering-based computation of degradation rate for photovoltaic systems. J. Renew. Sustain. Energy 2019, 11, 014701. [Google Scholar] [CrossRef]
  39. Saleheen, M.Z.; Salema, A.A.; Mominul Islam, S.M.; Sarimuthu, C.R.; Hasan, M.Z. A target-oriented performance assessment and model development of a grid-connected solar PV (GCPV) system for a commercial building in Malaysia. Renew. Energy 2021, 171, 371–382. [Google Scholar] [CrossRef]
  40. Vasisht, M.; Shravanth Srinivasan, J.; Ramasesha Sheela, K. Performance of solar photovoltaic installations: Effect of seasonal variations. Sol. Energy 2016, 131, 39–46. [Google Scholar] [CrossRef]
  41. Yadav, S.K.; Bajpai, U. Performance evaluation of a rooftop solar photovoltaic power plant in Northern India. Energy Sustain. Dev. 2018, 43, 130–138. [Google Scholar] [CrossRef]
  42. Kumar, M.N.; Sudhakar, K.; Samykano, M. Performance comparison of BAPV and BIPV systems with c-Si, CIS and CdTe photovoltaic technologies under tropical weather conditions. Case Stud. Therm. Eng. 2019, 13, 100374. [Google Scholar] [CrossRef]
  43. Zhang, W.; Zheng, Z.; Liu, H. Droop control method to achieve maximum power output of photovoltaic for parallel inverter system. CSEE J. Power Energy Syst. 2022, 8, 1636–1645. [Google Scholar] [CrossRef]
  44. Malvoni, M.; Leggieri, A.; Maggiotto, G.; Congedo, P.M.; De Giorgi, M.G. Long Term Performance, Losses and Efficiency Analysis of a 960 kWp Photovoltaic System in the Mediterranean Climate. Energy Convers. Manag. 2017, 145, 169–181. [Google Scholar] [CrossRef]
  45. Adaramola, M.S.; Vågnes, E.E.T. Preliminary assessment of a small-scale rooftop PV-grid tied in Norwegian climatic conditions. Energy Convers. Manag. 2015, 90, 458–465. [Google Scholar] [CrossRef]
  46. De Lima, L.C.; de Araújo Ferreira, L.; de Lima Morais, F.H.B. Performance analysis of a grid connected photovoltaic system in North-Eastern Brazil. Energy Sustain. Dev. 2017, 37, 79–85. [Google Scholar] [CrossRef]
  47. Huang, N.; Zhao, X.; Guo, Y.; Cai, G.; Wang, R. Distribution network expansion planning considering a distributed hydrogen-thermal storage system based on photovoltaic development of the Whole County of China. Energy 2023, 278, 127761. [Google Scholar] [CrossRef]
  48. Ban, Y.; Liu, X.; Yin, Z.; Li, X.; Yin, L.; Zheng, W. Effect of urbanization on aerosol optical depth over Beijing: Land use and surface temperature analysis. Urban Clim. 2023, 51, 101655. [Google Scholar] [CrossRef]
Figure 1. Location and snapshot of the three studied PV power plants.
Sustainability 15 14282 g001
Figure 2. Block diagram of the three PV solar plants: (a) SPVP_1, (b) SPVP_2, (c) SPVP_3.
Sustainability 15 14282 g002
Figure 3. Methodology followed in this study.
Sustainability 15 14282 g003
Figure 4. Values of monthly average of solar radiation and air temperature for SPVP_1 in Sidi-bel-Abbés.
Sustainability 15 14282 g004
Figure 5. Values of monthly average of solar radiation and air temperature for SPVP_2 in Laghouat.
Sustainability 15 14282 g005
Figure 6. Values of monthly average of solar radiation and air temperature for SPVP_3 in Ghardaïa.
Sustainability 15 14282 g006
Figure 7. Values of monthly average reference and final daily yield in Sidi-bel-Abbés.
Sustainability 15 14282 g007
Figure 8. Values of monthly average reference and final daily yield in Laghouat.
Sustainability 15 14282 g008
Figure 9. Values of monthly average reference and final daily yield in Ghardaïa.
Sustainability 15 14282 g009
Figure 10. Values of monthly average performance ratio for the three PV plants.
Sustainability 15 14282 g010
Figure 11. Values of monthly average air temperature for the three PV plants.
Sustainability 15 14282 g011
Figure 12. Values of monthly average capacity factor in Sidi-bel-Abbés.
Sustainability 15 14282 g012
Figure 13. Values of monthly average capacity factor in Laghouat.
Sustainability 15 14282 g013
Figure 14. Values of monthly average capacity factor in Ghardaïa.
Sustainability 15 14282 g014
Figure 15. The experimental performance parameters for each solar PV plant: (a) reference yield “Yr” and final yield “Yf”, (b) performance ratio “PR” and capacity factor “CF”.
Sustainability 15 14282 g015
Figure 16. Classification of PV power plants in Algeria.
Sustainability 15 14282 g016
Figure 17. Values of monthly average module temperature for the three PV plants.
Sustainability 15 14282 g017
Figure 18. Relationship for SPVP_1 in Sidi-bel-Abbés: (a) Between PAC,mes (kW) values and solar irradiance (W/m2) for the month of December, (b) between PAC,mes (kW) values and the module PV temperature (°C) during a whole year.
Sustainability 15 14282 g018
Figure 19. Relationship for SPVP_2 in Laghouat: (a) Between PAC,mes (kW) values and solar irradiance (W/m2) for the month of December, (b) between PAC,mes values and the module PV temperature (°C) during a whole year.
Sustainability 15 14282 g019
Figure 20. Relationship for SPVP_3 in Ghardaïa: (a) between PAC,mes (kW) values and solar irradiance (W/m2) for the month of December, (b) between PAC,mes values and the module PV temperature (°C) during a whole year.
Sustainability 15 14282 g020
Figure 21. Relationship between PR values and air temperature (C°) for: (a) SPVP_1, (b) SPPV_2.
Sustainability 15 14282 g021
Table 1. The specifications of the three power plants.
PV Solar FieldsSidi-bel-AbbésLaghouat I and IIGhardaïa
Latitude and longitude34°41′32.23″ N, 0°36′2.89″ O 33°43′26.74″ N, 2°48′45.27″ E32°36′1.46″ N, 3°42′3.42″ E
Installed capacity12 MWp60 MWp1.1 MWp
Number of solar panels47,808 (×250 W, Poly-Si)240,000 (×250 W, Poly-Si)6089 (1880 × 250 W (mono-Si), 1960 × 235 W (poly-Si), 988 × 103 W (a-Si), 1261 × 80 W (Cd-Te))
Number of inverters12 (×880 kVA)120 (×500 kW)8 (6 × 96 kW + 2 × 239 kW)
Area32.6 Ha120 Ha10 Ha
Table 2. Performance parameters of solar PV plants for different locations.
LocationPlants Capacity [kWp]PV TypeFinal Yield Yf [kWh/kWp/d]PR [%]CF [%]References
Sidi-bel-Abbés, Algeria
Laghoaut, Algeria
Ghardaïa, Algeria
12,000poly-Si4.1583.0117.20Present Study
60,000poly-Si4.6888.319.45
455.9 *poly-Si
465 *mono-Si
100.1168 **a-Si 4.9475.920.60
100.8 **Cd-Te
Ghardaïa, Algeria100poly-Si4.547819.03[29]
100mono-Si4.858020.51
100a-Si5.298522.11
100Cd-Te4.9881.5021.22
M’Sila, Algeria20,000poly-Si3.99–5.89771.5921.16[23]
Adrar, Algeria28mono-Si4.471.8918.58[26]
Adrar, Algeria6000poly-Si5.1573.6820.32–23.4[27]
Adrar, Algeria20,000poly-Si4.9874.3620.81[28]
Bouzareah, Algeria
(rooftop PV)
9.54mono-Si2.15–4.3071--[22]
Saida, Algeria30,000poly-Si4.985.52--[24]
El Bayadh, Algeria23,920poly-Si4.9582.0220.64[25]
Nouakchoutt, Mauritania (rooftop PV)48poly-Si4.5677.7519[15]
Tangier, Morocco
(rooftop PV)
5poly-Si4.457914.84[16]
Sohar, Oman1.4poly-Si5.1484.621[17]
Abu Dhabi, UAE
(rooftop PV)
114.4poly-Si4.168017.37[18]
50.4poly-Si4.938120.57
215.7mono-Si3.637015.13
994mono-Si3.94--16.40
Turkey2130.7poly-Si4.5381.1518.86[19]
Crete, Greece171.1poly-Si3.6667.4015.30[21]
Malaysia
(rooftop PV)
232.50mono-Si--85.4014.85[39]
* Motorized and ** fixed structure.
Disclaimer/Publisher’s Note: The statements, opinions and data contained in all publications are solely those of the individual author(s) and contributor(s) and not of MDPI and/or the editor(s). MDPI and/or the editor(s) disclaim responsibility for any injury to people or property resulting from any ideas, methods, instructions or products referred to in the content.

