Article

Deep Reinforcement Learning-Based Holding Control for Bus Bunching under Stochastic Travel Time and Demand

1
School of Management Science and Engineering, Southwestern University of Finance and Economics, Chengdu 611130, China
2
Smart City Data Center, Chengdu 610041, China
3
Chengdu Transportation Operation Coordination Center, Chengdu 610041, China
*
Author to whom correspondence should be addressed.
Sustainability 2023, 15(14), 10947; https://doi.org/10.3390/su151410947
Submission received: 17 June 2023 / Revised: 7 July 2023 / Accepted: 11 July 2023 / Published: 12 July 2023
(This article belongs to the Special Issue Urban Intelligent Traffic System Control and Optimization)

Abstract

:
Due to the inherent uncertainties of the bus system, bus bunching remains a challenging problem that degrades bus service reliability and causes passenger dissatisfaction. This paper introduces a novel deep reinforcement learning framework specifically designed to address the bus bunching problem by implementing dynamic holding control in a multi-agent system. We formulate the bus holding problem as a decentralized, partially observable Markov decision process and develop an event-driven simulator to emulate real-world bus operations. An approach based on deep Q-learning with parameter sharing is proposed to train the agents. We conducted extensive experiments to evaluate the proposed framework against multiple baseline strategies. The proposed approach has proven to be adaptable to the uncertainties in bus operations. The results highlight the significant advantages of the deep reinforcement learning framework across various performance metrics, including reduced passenger waiting time, more balanced bus load distribution, decreased occupancy variability, and shorter travel time. The findings demonstrate the potential of the proposed method for practical application in real-world bus systems, offering promising solutions to mitigate bus bunching and enhance overall service quality.

1. Introduction

In the past few decades, cities have witnessed urban sprawl and continuous population growth in tandem with the demand for transportation. Residents in urban areas generally have two options for transportation: public transit or private cars. Public transit is emphasized over private cars in some aspects, including traffic congestion relief [1], emissions reduction [2,3], air quality improvement [4], and a lower price, since the same amount of travel demand can be satisfied by much fewer vehicles. For these reasons, public transit is regarded as a vital part of sustainable transportation and is supported by the government. A reliable public transport system encourages residents to choose environmentally friendly travel modes and promotes sustainable development in three dimensions: environment, economy, and society [5].
One problem in bus operations is called bus bunching, referring to the phenomenon when two or more buses serving the same line arrive at a stop simultaneously [6]. Several factors contribute to this problem. Compared with metro systems that are equipped with tracks and run underground, bus operations are more susceptible to road conditions (e.g., signal control, accidents, congestion, and weather). In addition to external disturbances, the differences in driving behavior increase the variability of bus travel time, and the uncertainties in passengers’ demand also cause the variability of bus dwell time. The external and internal disruption could result in irregular service headways, and the deviations from the regular headways accumulate and amplify when buses move along the corridor. The buses with larger headways are likely to serve more passengers than average at stops and will be further delayed.
Bus bunching is undesirable for both transit users and transit operators. For passengers, bus bunching would lead to longer waiting times and travel times due to irregular and larger headways. For transit operators, the occupancy profiles are highly unbalanced since the leading buses tend to load more passengers and the following buses have fewer, resulting in the issue of wasting bus resources. Another disadvantage for operators is higher costs, as they need to provide a higher frequency of bus services to offset the longer waiting time caused by bunching.
One major characteristic of bus bunching lies in the irregular headways between buses, and equalizing the headways is the common approach to addressing this problem. With even headways, buses will have a more balanced load distribution, and passengers will experience reduced waiting time and travel time.
Many researchers have proposed various control strategies to alleviate the bus bunching problem caused by the inherent instability of the bus transit system, such as bus holding, stop-skipping, rescheduling, and traffic signal priority. In recent years, machine learning has achieved remarkable success in many fields and has been an attractive topic in both academia and industry. By contrast with supervised and unsupervised learning, reinforcement learning mainly relies on the experience generated by the interaction with the environment to make sequential decisions, aiming to maximize the expected reward. Novel control methods built upon reinforcement learning can handle complex decision problems and have already surpassed humans in domains such as Go and electronic games [7,8,9]. With the application of reinforcement learning-based holding strategies, this study aims to address bus bunching and improve reliability in the bus transit system, considering the uncertainty of bus travel times and passenger demands.
The remainder of this paper is structured as follows: Section 2 reviews the literature on control strategies and the application of reinforcement learning to bus control. In Section 3, the characteristics and assumptions of the bus system are presented. Section 4 formulates the real-time holding problem as a decentralized partially observable Markov decision process (Dec-POMDP), introduces the deep reinforcement learning framework, and provides details of the event-driven simulator. Section 5 conducts experiments and analyzes the performance of the proposed approach against other strategies. Section 6 summarizes the findings and provides directions for future work.

2. Literature Review

To achieve reliability and effectiveness in bus systems, a variety of control strategies have been proposed and proven to be useful. By allowing buses to skip some stops, stop-skipping control is expected to narrow the large headways so that the rear buses can catch up with the preceding buses [10,11,12]. The main idea of the rescheduling strategy is to modify the dispatching time of future trips from the terminal (the first stop) [13,14]. The traffic signal priority strategy focuses on the optimization of the traffic flow by defining the combination of traffic lights for delaying or releasing buses [15,16]. Another strategy to prevent bunching is speed regulation, which controls the bus’s speed along its route to maintain a regular headway [17,18,19]. However, these solutions have some limitations in practice: Stop-skipping will force the waiting passengers at skipped stops to board the next bus, which in turn frustrates their interest in using public transport. Speed regulation requires a non-congested road situation in which the bus can be less affected by the surroundings and then freely adjust its speed.
Among these control strategies, bus holding control, in which a bus is detained for an extra period at a stop, has emerged as a widely applied method to intervene in bus operations in practice due to its maneuverability. Fu and Yang investigated two holding control strategies with real-time information: one-headway-based holding control and two-headway-based holding control. The former considered only the headway to the front bus (i.e., forward headway), while the latter takes forward headway and backward headway into account [20]. Zhao et al. proposed a holding control approach based on negotiation between two agents, aiming to minimize passengers’ waiting time while considering nonstationary passenger arrivals [21]. Considering vehicle capacity constraints, Zolfaghari et al. formulated a mathematical control model minimizing the waiting time of both passengers who arrive at a stop and those who are left behind at a stop due to an overloaded bus [22]. To maintain regular headways, scholars introduced an adaptive control scheme that dynamically determines bus holding times based on real-time headway information [23,24]. Moreira-Matias et al. developed a mathematical model that incorporates dynamic running times and demand to produce a plan of holding times for all running vehicles [25]. While bus overtaking is not allowed in most works, Wu et al. proposed a propagation model that considers overtaking, distributed passenger boarding behavior, and bus capacity, introducing a quasi-first-depart-first-hold rule to minimize the deviation from the targeted headway [26]. Different from the aforementioned studies, which only utilized actual data, Andres and Nair managed to address bus bunching by first predicting headway data and then adopting dynamic holding strategies based on predicted data [27]. However, these traditional approaches primarily focus on the short-term impact of each single decision and may teach short-sighted strategies. It would be important to explore the long-term effect of each control decision and achieve system-wide efficiency.
The recent process of deep reinforcement learning has facilitated the development of innovative solutions utilizing real-time information. Recent works in reinforcement learning have shown great promise for solving complex sequential decision-making problems since this emerging technique based on the sequential process excels at capturing long-term feedback [28,29,30]. As urban transportation is a complex system, reinforcement learning has been quickly adopted by scholars in the field of transportation to aid in the development of intelligent transportation systems. Researchers presented a distributed cooperative holding control formulation based on a multi-agent reinforcement learning (MARL) framework to optimize real-time operations of the public transport system [31]. However, their approach has limitations in utilizing the full potential of deep reinforcement learning and learned policies with limited state space. Using unlimited state space, a study introduced a deep reinforcement learning approach to implement real-time holistic holding control for high-frequency services [32]. In an effort to achieve headway equalization, a dynamic holding control strategy in a multi-agent deep reinforcement learning framework was successfully implemented in a deterministic environment [33]. To address bus bunching, some researchers proposed a machine learning-based procedure merging holding control with adjusting cruising speed, which controls the travel time between stops and ignores the road conditions [34,35]. Although these novel reinforcement learning methods have showcased satisfying results, this brief literature review shows some research gaps: Most proposed reinforcement learning algorithms are trained on simulators with fixed time steps, making the learning process computationally expensive and limiting their application to the real world. Moreover, previous works often assume deterministic inter-stop travel times and demand patterns and thus overlook the stochastic nature of bus systems.
To solve the problem of the computation-consuming fixed-time-step simulator and the stochastic nature of traffic flows and passenger demand, the present paper presents a reinforcement learning framework to achieve bus system efficiency. The main contributions of the work are summarized as follows: (1) A novel deep reinforcement learning framework is proposed for real-time holding control in a multi-agent system. By formulating the holding problem as a decentralized partially observable Markov decision process, we introduce a decentralized policy for making decisions and adopt a novel algorithm based on deep Q-network and parameter sharing to train the agent. The learned policy can capture the long-term effect of each control decision and is superior to baseline strategies; (2) an event-driven simulator is developed, on which the experiments and result analyses are conducted. Compared to the traditional fixed-time-step simulator, the event-based technique mitigates the problem of data sparsity and achieves a substantial computational advantage. Moreover, the policy trained on such a simulator could effectively transfer to the real world; (3) we consider a bus transit system, taking into account the stochastic vehicle travel times and passenger demand, which characterize the stochasticity of the bus system. Notation is defined as needed throughout the paper and is summarized in Table 1 for the reader’s convenience.

3. Bus System Model Formulation

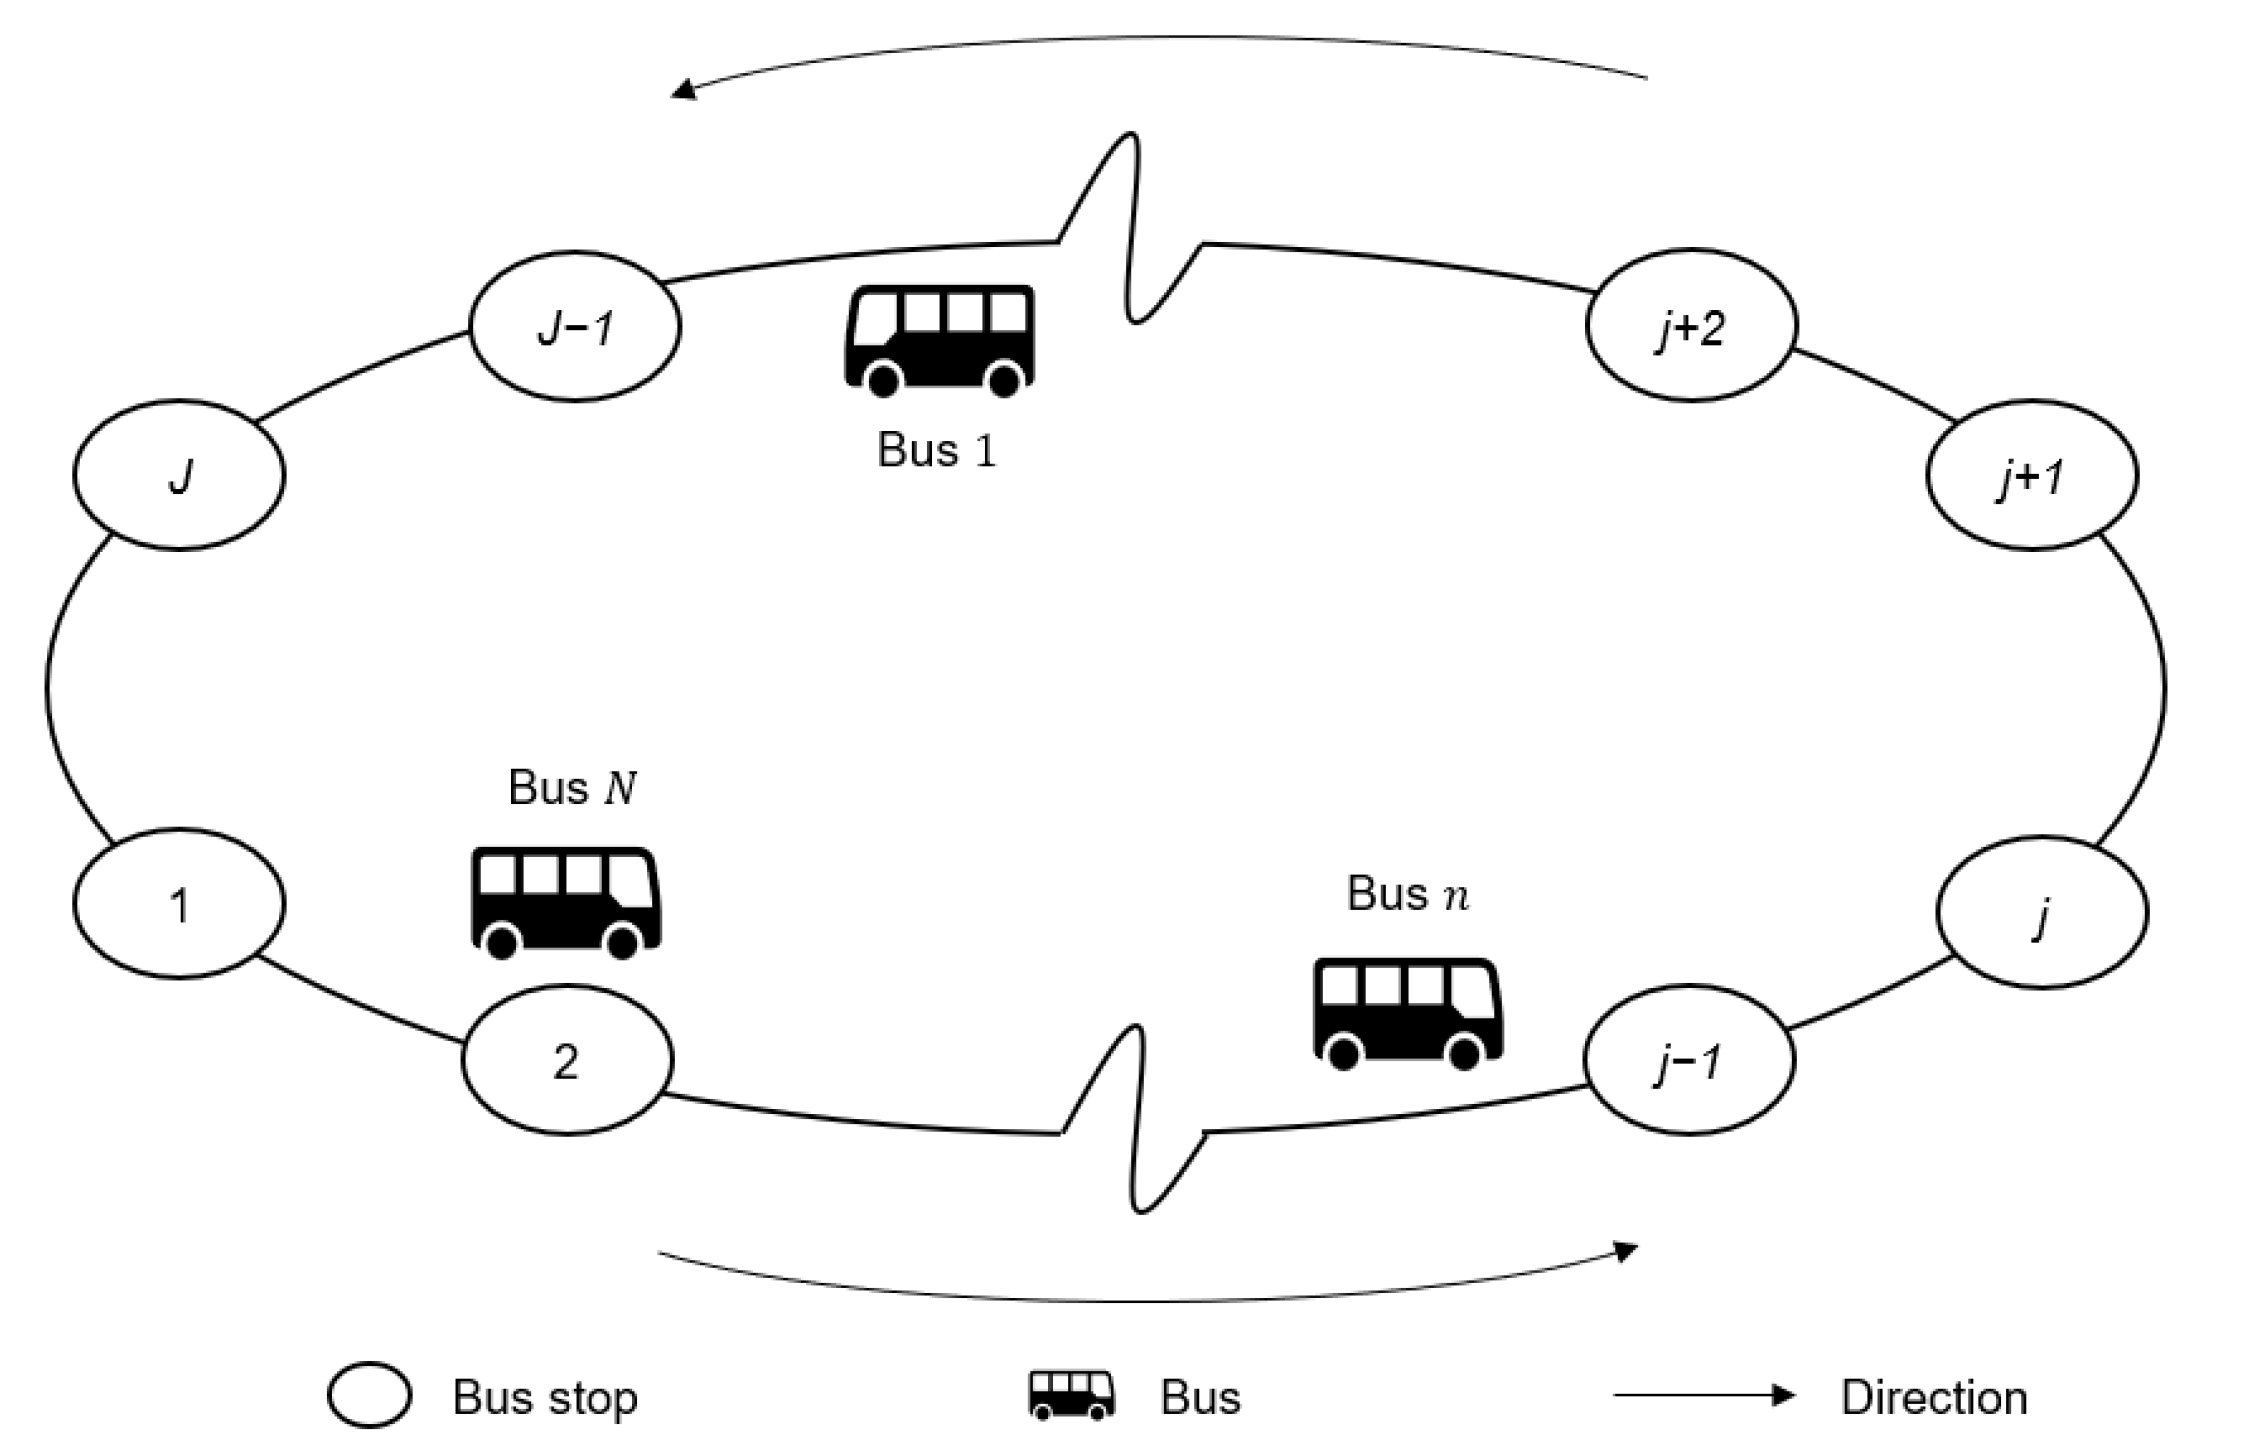
Consider the one-way loop bus corridor depicted in Figure 1, consisting of J bus stops and a fleet of N homogenous buses providing I trips. A single bus may serve multiple trips. Buses are dispatched from stop 1 at a regular interval H , serve all stops downstream (2, 3, …, J ), and return to stop 1. Upon arrival at a bus stop, the buses require dwell times for passenger boarding and alighting, and control decisions are made after the dwelling process is completed. Overtaking is not allowed along the corridor, i.e., the leading bus trip i 1 always precedes the following bus trip i . We assume that bus capacity is unlimited and passenger arrival follows a Poisson process. The assumption of unlimited capacity has minimal effects on the results, as the proposed approach ensures a balanced load among buses.
At stop 1, the bus fleet initiates its first cycle (bus trip i = 1,2 , N ) with planned headways H , and we have the initial condition a 1,1 = 0 for the first bus trip at stop 1:
a i , 1 = i 1 H , i = 1,2 , , N
For trip i ( i > N ) at stop 1, a bus cannot commence a new trip until it has completed the previous trip i N , and the bus returns to stop 1 from the terminal stop (i.e., stop J ). This can be expressed as:
a i , 1 = d i N , J + t i N , J , i = N + 1 , , I
When the bus i arrives at downstream stops j = 2,3 , , J , the arrival time is written as:
a i , j = d i , j 1 + t i , j 1 ,   i = 1,2 , , I ;   j = 2,3 , , J
The departure time of the bus i from the stop j is calculated as:
d i , j = a i , j + w i , j + x i , j ,   i = 1 , 2 , , I ;   j = 1,2 , , J
The dwell time, w i , j , refers to the duration required to complete the boarding and alighting activities. We assume that the boarding and alighting times are linear functions of the number of passengers. Since most buses have two doors allowing for simultaneous boarding and alighting processes, the dwell time is determined by the longer duration between the boarding and alighting times:
s i , j = max ( t b b i , j , t a l i , j ) , i = 1 , 2 , , I ;   j = 1,2 , , J
The number of passengers boarding at a stop is determined by headway and arrival rate:
b i , j = λ j h i , j , i = 2,3 , , I ;   j = 1,2 , , J
h i , j = a i , j a i 1 , j , i = 2,3 , , I ;   j = 1,2 , , J
When a bus arrives at a stop, a portion of the passengers onboard will alight from the bus:
l i , j = o i , j ρ j , i = 1,2 , , I , j = 1,2 , , J
The number of passengers onboard a bus is updated after the passenger boarding and alighting process finishes at a stop:
o i , j + 1 = o i , j + b i , j l i , j , i = 1,2 , , I , j = 1,2 , , J
In addition, considering all buses adhere to a strict sequential order to avoid overtaking, we ensure that a bus enters a stop after its predecessor has departed. The constraint is implemented as follows:
a i , j d i 1 , j , i = 2 , , I , j = 1,2 , , J

4. Methodology

Based on the design of the bus system model developed in Section 3, we next present the deep reinforcement learning framework.

4.1. Event-Driven Simulator

An essential component for effectively applying deep reinforcement learning approaches is a suitable learning environment. However, the high stochasticity and randomness of the real-world environment make it difficult to train deep reinforcement learning algorithms. Additionally, the training process requires plenty of trajectories generated by repeated interaction with the environment, so relying solely on historical data is insufficient for training and evaluating algorithms. Researchers commonly build simulators calibrated with historical data to mimic the real-world environment.
Many methods for training reinforcement learning algorithms use simulators performed with fixed time steps. These simulators will result in a sparse number of decision activities in this holding problem since the bus control process is asynchronous and event-driven. The decisions are triggered by bus arrivals, and no holding decisions are made when buses are running along sections between stops. This case can be framed as a decentralized partially observable Markov decision process, detailed in the next section [36]. Naturally, we view this multi-agent decision process as an event-driven process in which the bus agents choose actions when specific events occur, such as bus arrivals. Consequently, we developed an event-driven simulator.
By employing event-driven simulators, one can focus on specific timestamps regardless of redundant timestamps, significantly reducing the length of an episode. As a result, the training process becomes much more time-saving with such simulators. Considering the presence of numerous bus lines and buses in a metropolitan area, utilizing event-driven simulators will achieve a significant computational advantage.

4.2. Dec-POMDP and Parameter Sharing

In the framework, buses are running along the loop corridor. When a bus arrives at a stop, the bus system generates the states, and the holding decision is made based on the states. The reward is obtained upon the bus arriving at the next stop, according to the definition in Section 4.3. Since each single bus can be treated as an independent agent, we model the holding problem as a Markov game and solve it via reinforcement learning [37]. In its general form, a Markov game is defined by a tuple ( K , S , A , P , R , γ ) , where K is the number of agents, S is the set of states, A is the set of joint actions, P : S × A 1 × × A K S denotes the state transition function from the current state to the next state after taking a joint action, γ is a discount factor, R is the set of reward functions, and each reward R i is determined by the current state and the joint actions: S × A 1 × × A K R i . A policy dictates how agents execute joint action at each state, and the agents’ goal is to find an optimal policy that maximizes the expected sum of discounted rewards.
To solve the multi-agent reinforcement learning problem, one way is to train a centralized policy that maps the current state of the environment to joint action. However, this will lead to exponential growth in the state and action spaces with the number of agents [38]. Moreover, the central controller incurs a significant communication overhead as it needs to communicate with each agent to exchange information in centralized settings [39]. Coupled with the event-driven process, we deal with the intractability by factoring the joint action into individual components for each agent and modeling the holding problem as a decentralized partially observable Markov decision process. In discrete action systems, the size of the action space is reduced from A K to K A . Since all the individual agents in a decentralized reinforcement learning system can operate in parallel based on their individual action spaces, the learning speed is faster compared to a centralized agent exploring a larger action space [40]. Another reason to adopt the decentralized framework lies in the uniqueness of the holding problem. The control decisions are triggered by vehicle arrivals, which means that one vehicle instead of all vehicles needs to take an action at a specific timestamp. The decentralized framework guarantees the asynchronous decision-making of the control problem.
In this framework, each bus agent has access to only partial observations of the environment and must make a decision based on its local observations. In the context of Dec-POMDP, an agent executes a decentralized policy that maps an agent’s local observations to an action. In our case, each individual bus agent observes its observations and determines its holding time based on the local observations upon arriving at a stop.
In addition, when agents are homogeneous, their policies can be trained more effectively using parameter sharing. With the parameter sharing approach, a common policy is adopted for all agents, allowing the training of the policy with the collective experiences of all agents. In this study, we enable agents to execute decentralized policies with shared parameters so that some off-the-shelf reinforcement learning algorithms, such as deep Q-network (DQN) or deep deterministic policy gradient, can be extended to multi-agent systems.

4.3. Components of Reinforcement Learning

Building upon the formulation in Section 3, we consider a bus system with I bus trips and J stops. The basic components of the reinforcement learning framework for this holding problem are described below.
State: Within the Dec-POMDP context, the state used to determine the holding time relies on the agent’s local information. The state is defined as a four-dimensional vector indicating detailed information when the bus trip i arrives at the stop j , denoted as S i , j = [ j , h i , j , o i , j , b i , j ] : the index of a stop j is the location the bus is in; headway h i , j represents the bus trip’s regularity status; o i , j and b i , j account for bus load and passenger demand.
Action: A bus trip determines its holding time once it arrives at a bus stop. The holding duration is formulated as x i , j = u i , j T , where T is a fixed positive value for the constraint of applying in practice and u i , j is a nonnegative integer. This design is a practical consideration. The discrete values can be encoded in a user interface, and the bus driver can easily interpret and execute these commands compared to continuous values. In our simulation experiments, we set T = 30   s and an action space u i , j [ 0 , 1 , 2 , 3 ] . u i , j = 0 denotes no holding action executed and immediate dispatch of the bus after finishing passenger boarding and alighting.
Reward: One effective way to avoid bus bunching is to achieve headway equalization. To that end, the reward function is defined as the absolute value of the difference between the actual headway and the planned headway. The reward for an independent bus agent is designed as: r i , j = h i , j + 1 H . The closer the actual headway is to the planned one, the greater the reward.
In the aforementioned settings, the holding control process is framed as an event-driven process, and an event-driven simulator is built to train and test the proposed algorithm on it. When the bus trip i arrives at the stop j , it receives the state S i , j and chooses a holding action u i , j , leading to a state transition. It should be noted that once this bus trip arrives at the next stop j + 1 , it will observe the next state S i , j + 1 and the reward feedback r i , j is calculated accordingly.

4.4. Training Algorithm

For the finite action space in this problem, the Q-learning algorithm is commonly suggested. Considering that the state space is infinite, we adopt an adapted version of the DQN method called PS-DQN, which incorporates the parameter sharing technique. The procedure of the PS-DQN training process is summarized in Algorithm 1.
Algorithm 1. Training procedure of PS-DQN algorithm in a multi-agent system.
Initialize the memory buffer B to capacity M .
Initialize the action-value function Q with random weights θ and target the action-value function Q with weights θ = θ .
for episode = 1 to E  do
for trip i = 1 to I  do
  Initialize initial state;
  if trip i arrives at stop j ,  then
   Obverse the current observation S i , j ;
   Select action u i , j using the ε -greed policy with regard to θ ;
   Execute action u i , j on an event-driven simulator and observe the next observation S i , j + 1 and reward r i , j ;
   Store the experience ( S i , j , u i , j , r i , j , S i , j + 1 ) in the memory buffer B ;
   Sample a minibatch of experiences from B ;
   Calculate the target values y i , j via Equation (11);
   Update θ by minimizing Equation (12);
  end if
end for
 Reset θ = θ every T episodes
end for
We establish two sets of feedforward neural networks (FNN): the evaluation network Q and the target network Q . Both networks have the same architecture and are used to represent the action-value (also known as Q ) function, which maps from state and action to Q -values. The evaluation network updates its parameters at each training step, while the target network parameters are updated with a delay and remain fixed between individual updates. The advantage of using a separate target network is that it improves the stability of the training process.
Every time an event of bus arrival is triggered, this bus agent i observes its local state at the stop j , S i , j . After the boarding and alighting process finishes, the agent takes an action u i , j according to the ε-greedy policy (i.e., selecting an action that produces the maximum Q-value with probability 1-ε and selecting a random action with probability ε). To balance exploration and exploitation, we apply the search-then-converge procedure [41]. The agent’s exploration rate is higher at the beginning of training and decays to a minimum value during training. Once the bus imposes an action, the bus system environment changes accordingly. By the time the agent reaches the next stop j + 1 , it will observe the next state S i , j + 1 and receive the reward r i , j . This process generates an experience defined by ( S i , j , u i , j , r i , j , S i , j + 1 ). With buses running in the bus system, we will accumulate a collection of experiences and store them in a memory buffer.
The goal of the algorithm is to learn a policy to enable the agents to achieve the expected discounted cumulative reward as large as possible. We draw a batch of experiences from the buffer and put the current states S i , j and executed actions u i , j as the input into the evaluation network and derive the predicted Q-values Q ( S i , j , u i , j ; θ ) where θ is the parameters of the evaluation network. Consequently, we can calculate the target Q-values y i , j :
y i , j = r i , j + γ m a x u Q ( S i , j + 1 , u ; θ ) ,
where r i , j is the immediate reward, γ is the discount factor, and θ is the parameters of the target network. The evaluation network is updated through supervised learning by minimizing the mean square loss function, which is formulated as:
L θ = y i , j Q ( S i , j , u i , j ; θ ) 2
Finally, we perform a gradient descent step on the loss function with respect to the evaluation network parameters θ . During this step, we update the evaluation network while keeping the target network unchanged. The target network is cloned from the evaluation network Q after a certain number of delay steps T . This separation between updating the networks helps stabilize the learning process.

5. Experiment and Analysis

5.1. Simulation Setup

The experiment is conducted on a bus system comprising 10 bus stops and a fleet of six buses. The travel time between consecutive bus stops follows the normal distribution N 180 , 18 2 [11]. The boarding and alighting times per passenger are set as t b = 3   s / p a x and t a = 1.8   s / p a x , respectively. The discrete action space consists of U = 0 , 30 , 60 , 90 seconds, representing the available holding durations. The planned headway, H , is set to 6 min. During the simulation, the bus fleet operates for four cycles, which corresponds to approximately 200 min in the simulated environment.
Passenger arrival at each stop follows a Poisson process, and the number of passengers alighting is a proportion of the total passengers on the bus upon arrival at the stop. The arrival rate in the experiment is associated with a standard deviation equaling to 10% of its mean value, which characterizes stochastic passenger demand. The average arrival rate and the alighting proportion at each stop are given in Table 2.

5.2. Baseline and Evaluation Indicators

In this paper, no-holding (NH), an optimized threshold holding strategy (OT), and a one-headway-based holding strategy (OH) are selected for comparison. The NH does not involve any proactive control.
The OT strategy determines the holding time based on the following rule, and the action space of this method is consistent with that of the proposed method:
x i , j = 90 ,   h i , j < T 1 60 , T 1 h i , j < T 2 30 , T 2 h i , j < T 3 0 ,   h i , j T 3 ,
where the values T 1 , T 2 , and T 3 are optimized using the differential evolution method [42], which is a heuristic approach based on genetic algorithm. The optimization objective is to maximize the expected total reward, which is also used to optimize the proposed reinforcement learning method.
Under the OH strategy, the holding decision of the bus i at the stop j depends on the current time after the dwelling process finishes a i , j + s i , j , the departure time of the preceding bus at the same stop d i 1 , j , and the planned headway H . The holding time is determined as follows:
x i , j = H ( a i , j + s i , j d i 1 , j ) , a i , j + s i , j < d i 1 , j + c H 0 , o t h e r w i s e ,
where c is a parameter called control strength with values ranging from 0.0 to 1.0. By including this parameter, the holding decision would be invoked only when the actual headway is less than c H called threshold headway. No holding control will be exercised when c = 0.0 , and a c-value of 1.0 demands full control. The control strength is set to c = 0.8 , because this value considers a trade-off between passenger waiting time and travel time. Any actual headway less than 0.8 H would trigger the control strategy, and this value avoids excessive control leading to an increase in travel time compared to a higher value of c .
Meanwhile, we present some metrics to reflect the performance of bus transport services:
  • Average waiting time, which measures how long passengers have waited at stops on average. This is a frequently-used metric to reflect the overall service level. It is formulated as:
E h 2 + v a r h 2 E h ,
where E h is the average headway between buses, and v a r h is the variance of headway. This relationship implies that a control method that can minimize the variability of bus headways is expected to decrease the average waiting time for passengers.
  • Bus load at stops. When bus hunching occurs, the leading buses tend to serve more passengers and the following buses load fewer ones, which could cause an unbalanced passenger load pattern among buses.
  • Occupancy variability at stops, which quantifies the dispersion of passenger occupancy across buses. A higher occupancy variability indicates an unbalanced use of vehicle sources, which impacts passenger comfort and satisfaction. It is computed as:
v a r o E o
  • Total trip time variability is regarded as an indicator of service stability by transit operators. Holding control will increase the travel times for extra delays, yet it may decrease the total trip time variability.

5.3. Model Training

The Q -value function discussed in Section 4.4 is approximated by a neural network that has one hidden layer consisting of 256 neurons with a rectified linear unit (ReLU) activation function. The neural network is shared among all bus agents in the system. The output layer takes a linear activation, and its size corresponds to the number of actions. The training process involves a total of 500 episodes, and each episode represents a simulation in which the bus fleet operates for 4 cycles. There are 23 trips to be dispatched, and all 10 stops will be served, as the initial state depends on the first trip. Consequently, the parameter updating will be performed around 230 times within one single training episode and 115,000 times throughout the entire training process. Following the search-then-converge procedure, the exploration rate is calculated according to the following equation:
ε t = ε 0 1 + t 2 γ + t ,
where ε 0 is the initial exploration rate, γ is the decay parameter, and t is the updating time. In this study, ε 0 and γ are set to 1.0 and 1 × 10 8 , respectively (see Figure 2). The exploration rate starts at 1.0 in the early stages of training, representing full exploration, and decays to 0.01 towards the end of training. The experience buffer has a size of 10,000. During each training step, a batch of 64 transitions is sampled from the buffer to update the evaluation network parameters. The target network, on the other hand, copies the parameters of the evaluation network every 20 episodes. The Adam optimizer with a learning rate of 0.001 is employed for the parameter updates. The simulation environment is coded in Python 3.8, and the related learning algorithm is implemented using Pytorch 1.7 [43]. The model training is conducted on a laptop equipped with an Intel Core i7 processor and 8 GB of RAM.
To evaluate the adaptability of the proposed approach under different scenarios, we train the algorithm under both deterministic and stochastic travel times and passenger demands. The deterministic scenario refers to fixed travel times and passenger arrival rate, while the stochastic scenario follows the settings in Section 5.1. The training process under different scenarios is presented in Figure 3. In the figure, the gray lines are the profiles of the reward value at each training episode under different scenarios. The black lines are the moving average values over 30 episodes. The figure shows that the training process converges after around 100 episodes under deterministic and stochastic scenarios. One can observe that the lines under a deterministic scenario are lightly smooth, and the uncertainty of travel time and demand has an impact on the training process. The proposed reinforcement learning framework has the capacity to address the uncertainties in the bus system.

5.4. Performance Analysis

Figure 4 plots the simulated bus trajectories under different holding strategies in a typical run. In the figure, each line represents a bus trip serving all stops, and bus bunching occurs when different colored lines overlap each other. It is evident that, without holding control, bus bunching happens as the vehicles move along the route. Buses 3 and 4 arrive at stop 6 at the same time in the first cycle, and they are caught up by bus 5 in the second cycle. Meanwhile, buses 1, 2, and 6 also bunch up. The six vehicles naturally form two groups, with bus 3 and bus 6 leading their respective groups. The headway between buses is highly uneven, meaning the bus system without control lacks stability. Under OT, headway variation is significantly reduced. However, a notable gap emerges between bus 4 and bus 5, indicating a tendency for buses 5 and 6 to bunch together eventually. The OH strategy achieves headway equalization within the bus fleet. With the application of the proposed deep reinforcement learning method, more uniform headway is obtained compared to other strategies. This is attributed to the reward design, which aims to minimize the gap between the actual headway and the planned headway.
Figure 5 illustrates the average loads of each bus at different stops. Intuitively, under no holding control, there is significant variability in the loads among buses at a stop, resulting in inefficient utilization of bus transport resources. Specifically, buses 6 and 3 carry more passengers as they are the leading buses in their respective groups. Obviously, proactive control strategies (i.e., OT, OH, and PS-DQN) can improve this situation. Due to the gap between the bus and its leading bus, bus 5 under OT and bus 1 under OH have to carry more passengers while other buses have similar loads. The proposed method achieves the most equal distribution of bus loads at each stop, suggesting more equitable utilization of vehicle resources and improved passenger comfort.
For comparison and reliability, we have conducted 20 replications for all control cases, and the results are analyzed based on average values. We compare two metrics: average waiting time and average occupancy variability, and the error bar represents the standard deviation. Among the control methods, the reinforcement learning method achieves the best performance in terms of mean value and fluctuation, surpassing NH, OT, and OH in both metrics. This superior performance can be attributed to the incorporation of additional passenger information into the proposed method. As depicted in Figure 6, the average waiting time increases from upstream stops to downstream stops when there is no intervention. In contrast, proactive strategies produce shorter and more uniform headways, leading to reduced waiting times for passengers. Figure 7 demonstrates the average occupancy variability, representing the variation in vehicle usage. Similar to the average waiting time, proactive holding strategies contribute to lower occupancy variability. As bus bunching leads to unequal headways, the following buses accommodate fewer passengers, while the leading buses may serve the most passengers.
Furthermore, Figure 8 displays the distribution of the total trip time under different strategies, and the black dashed lines represent the average values of the total trip time. Despite the implementation of holding decisions in the system, these control methods significantly decrease the average total trip time. Specifically, when comparing the average values, the proposed method exhibits a significant 1.6% reduction in total trip time when the OH strategy is used and a marginal 0.4% reduction when the OT strategy is applied. Notably, the PS-DQN approach demonstrates the least variability in total trip time compared to the other control cases, indicating its ability to provide more consistent and predictable travel experiences for passengers.

5.5. Sensitivity Analysis

Finally, we conduct a sensitivity analysis of the reinforcement learning-based approach by setting different numbers of hidden layers, each with the same number of 256 neurons. Figure 9 depicts the effect of models with different numbers of hidden layers on the training process. The figure shows that deeper models achieve faster convergence and more stable performance. The training time for a one-layer model takes 214 s, while for models with two layers and three layers, the values are 555 s and 875 s, respectively. The stable performance and longer training time are mainly because the deeper models contain more parameters that require optimization. Another insight is that even with deeper models, the achieved performance is quite close.

6. Conclusions

This paper introduces a novel approach based on deep reinforcement learning to tackle the issue of bus bunching. The proposed framework leverages the principles of reinforcement learning to enable each bus to act as an independent agent and implement a holding strategy, ultimately aiming to achieve global headway equalization. To facilitate the learning process, a real-time event-driven transit simulator has been developed, providing a realistic environment for training and evaluation. Furthermore, an efficient learning algorithm called PS-DQN has been devised, specifically tailored to train the deep neural network used in the framework.
Extensive experiments have been conducted to assess the effectiveness of the deep reinforcement learning framework against three baseline strategies. The results clearly demonstrate the superiority of the proposed approach across multiple performance metrics. Firstly, the framework achieves more equal headway distribution, effectively reducing the occurrence of bus bunching. This contributes to a more stable and reliable bus service. Additionally, the average waiting time for passengers is significantly reduced compared to the baseline strategies, indicating improved service quality and passenger satisfaction. The proposed framework addresses the issue of uneven bus loads at stops, ensuring efficient utilization of vehicle resources and improved passenger comfort. Finally, the average occupancy variation at stops is also decreased by the reinforcement learning-based approach.
Overall, the extensive experimental results validate the effectiveness of the deep reinforcement learning framework in improving various aspects of bus service performance. By achieving more equal headway, reducing average waiting time, balancing bus loads, and minimizing occupancy variability, the proposed approach offers a promising solution to address the challenges associated with bus bunching, ultimately enhancing the quality and efficiency of bus services.
For future work, besides achieving headway equalization in this paper, other objectives could be considered, such as minimizing the waiting time and/or trip travel time of passengers, minimizing the operational cost of operators, etc. Hence, the reward function in the reinforcement learning framework should be specifically designed. In addition, the integration of different control strategies, such as holding, stop-skipping, and speed control, has been a promising research direction that can derive better results than a single strategy.

Author Contributions

Conceptualization, D.L., F.X. and J.L.; methodology, D.L., F.X., J.L. and F.Y.; software, J.L. and F.Y.; validation, F.X. and F.Y.; formal analysis, D.L., F.X. and J.L.; investigation, D.L., F.X. and F.Y.; resources, F.X., J.L. and F.Y.; data curation, D.L. and F.Y.; writing—original draft preparation, D.L. and F.X.; writing—review and editing, J.L. and F.Y.; visualization, D.L., J.L. and F.Y.; supervision, F.X.; project administration, J.L. and F.Y.; funding acquisition, F.X. All authors have read and agreed to the published version of the manuscript.

Funding

This research was funded by the Fundamental Research Funds for the Central Universities, grant number JBK2103009.

Institutional Review Board Statement

Not applicable.

Informed Consent Statement

Not applicable.

Data Availability Statement

The data presented in this study are available on request from the corresponding author.

Conflicts of Interest

The authors declared that they have no conflict of interest in this work. The funders had no role in the design of the study, in the collection, analysis, or interpretation of data, in the writing of the manuscript, or in the decision to publish the results.

References

  1. Adler, M.W.; Liberini, F.; Russo, A.; van Ommeren, J.N. The Congestion Relief Benefit of Public Transit: Evidence from Rome. J. Econ. Geogr. 2021, 21, 397–431. [Google Scholar] [CrossRef]
  2. Jing, Q.-L.; Liu, H.-Z.; Yu, W.-Q.; He, X. The Impact of Public Transportation on Carbon Emissions—From the Perspective of Energy Consumption. Sustainability 2022, 14, 6248. [Google Scholar] [CrossRef]
  3. Carroll, P.; Caulfield, B.; Ahern, A. Measuring the Potential Emission Reductions from a Shift towards Public Transport. Transp. Res. Part D Transp. Environ. 2019, 73, 338–351. [Google Scholar] [CrossRef]
  4. Sun, C.; Zhang, W.; Fang, X.; Gao, X.; Xu, M. Urban Public Transport and Air Quality: Empirical Study of China Cities. Energy Policy 2019, 135, 110998. [Google Scholar] [CrossRef]
  5. Miller, P.; de Barros, A.G.; Kattan, L.; Wirasinghe, S. Public Transportation and Sustainability: A Review. KSCE J. Civ. Eng. 2016, 20, 1076–1083. [Google Scholar] [CrossRef]
  6. Newell, G.F.; Potts, R.B. Maintaining a Bus Schedule. In Proceedings of the 2nd Australian Road Research Board (ARRB) Conference, Melbourne, VIC, Australia, 20–24 October 1964. [Google Scholar]
  7. Mnih, V.; Kavukcuoglu, K.; Silver, D.; Rusu, A.A.; Veness, J.; Bellemare, M.G.; Graves, A.; Riedmiller, M.; Fidjeland, A.K.; Ostrovski, G. Human-Level Control through Deep Reinforcement Learning. Nature 2015, 518, 529–533. [Google Scholar] [CrossRef]
  8. Silver, D.; Schrittwieser, J.; Simonyan, K.; Antonoglou, I.; Huang, A.; Guez, A.; Hubert, T.; Baker, L.; Lai, M.; Bolton, A. Mastering the Game of Go without Human Knowledge. Nature 2017, 550, 354–359. [Google Scholar] [CrossRef] [Green Version]
  9. Vinyals, O.; Babuschkin, I.; Czarnecki, W.M.; Mathieu, M.; Dudzik, A.; Chung, J.; Choi, D.H.; Powell, R.; Ewalds, T.; Georgiev, P. Grandmaster Level in Starcraft Ii Using Multi-Agent Reinforcement Learning. Nature 2019, 575, 350–354. [Google Scholar] [CrossRef]
  10. Sun, A.; Hickman, M. The real–Time Stop–Skipping Problem. J. Intell. Transp. Syst. 2005, 9, 91–109. [Google Scholar] [CrossRef]
  11. Liu, Z.; Yan, Y.; Qu, X.; Zhang, Y. Bus Stop-Skipping Scheme with Random Travel Time. Transp. Res. Part C Emerg. Technol. 2013, 35, 46–56. [Google Scholar] [CrossRef]
  12. Delgado, F.; Munoz, J.C.; Giesen, R. How Much Can Holding and/or Limiting Boarding Improve Transit Performance? Transp. Res. Part B Methodol. 2012, 46, 1202–1217. [Google Scholar] [CrossRef]
  13. Gkiotsalitis, K.; Stathopoulos, A. Demand-Responsive Public Transportation Re-Scheduling for Adjusting to the Joint Leisure Activity Demand. Int. J. Transp. Sci. Technol. 2016, 5, 68–82. [Google Scholar] [CrossRef] [Green Version]
  14. Tang, X.; Lin, X.; He, F. Robust Scheduling Strategies of Electric Buses under Stochastic Traffic Conditions. Transp. Res. Part C Emerg. Technol. 2019, 105, 163–182. [Google Scholar] [CrossRef]
  15. Koehler, L.A.; Kraus, W., Jr. Simultaneous Control of Traffic Lights and Bus Departure for Priority Operation. Transp. Res. Part C Emerg. Technol. 2010, 18, 288–298. [Google Scholar] [CrossRef]
  16. Van Oort, N.; Boterman, J.; van Nes, R. The Impact of Scheduling on Service Reliability: Trip-Time Determination and Holding Points in Long-Headway Services. Public Transp. 2012, 4, 39–56. [Google Scholar] [CrossRef] [Green Version]
  17. Daganzo, C.F.; Pilachowski, J. Reducing Bunching with Bus-to-Bus Cooperation. Transp. Res. Part B Methodol. 2011, 45, 267–277. [Google Scholar] [CrossRef] [Green Version]
  18. Ampountolas, K.; Kring, M. Mitigating Bunching with Bus-Following Models and Bus-to-Bus Cooperation. IEEE Trans. Intell. Transp. Syst. 2020, 22, 2637–2646. [Google Scholar] [CrossRef] [Green Version]
  19. Wang, Y.; Ma, W.; Yin, W.; Yang, X. Implementation and Testing of Cooperative Bus Priority System in Connected Vehicle Environment: Case Study in Taicang City, China. Transp. Res. Rec. 2014, 2424, 48–57. [Google Scholar] [CrossRef]
  20. Fu, L.; Yang, X. Design and Implementation of Bus–Holding Control Strategies with Real-Time Information. Transp. Res. Rec. 2002, 1791, 6–12. [Google Scholar] [CrossRef] [Green Version]
  21. Zhao, J.; Bukkapatnam, S.; Dessouky, M.M. Distributed Architecture for Real-Time Coordination of Bus Holding in Transit Networks. IEEE Trans. Intell. Transp. Syst. 2003, 4, 43–51. [Google Scholar] [CrossRef]
  22. Zolfaghari, S.; Azizi, N.; Jaber, M.Y. A Model for Holding Strategy in Public Transit Systems with Real-Time Information. Int. J. Transp. Manag. 2004, 2, 99–110. [Google Scholar] [CrossRef]
  23. Daganzo, C.F. A Headway-Based Approach to Eliminate Bus Bunching: Systematic Analysis and Comparisons. Transp. Res. Part B Methodol. 2009, 43, 913–921. [Google Scholar] [CrossRef]
  24. Xuan, Y.; Argote, J.; Daganzo, C.F. Dynamic Bus Holding Strategies for Schedule Reliability: Optimal Linear Control and Performance Analysis. Transp. Res. Part B Methodol. 2011, 45, 1831–1845. [Google Scholar] [CrossRef]
  25. Moreira-Matias, L.; Cats, O.; Gama, J.; Mendes-Moreira, J.; De Sousa, J.F. An Online Learning Approach to Eliminate Bus Bunching in Real-Time. Appl. Soft Comput. 2016, 47, 460–482. [Google Scholar] [CrossRef] [Green Version]
  26. Wu, W.; Liu, R.; Jin, W. Modelling Bus Bunching and Holding Control with Vehicle Overtaking and Distributed Passenger Boarding Behaviour. Transp. Res. Part B Methodol. 2017, 104, 175–197. [Google Scholar] [CrossRef]
  27. Andres, M.; Nair, R. A Predictive-Control Framework to Address Bus Bunching. Transp. Res. Part B Methodol. 2017, 104, 123–148. [Google Scholar] [CrossRef]
  28. Xu, Z.; Li, Z.; Guan, Q.; Zhang, D.; Li, Q.; Nan, J.; Liu, C.; Bian, W.; Ye, J. Large-Scale Order Dispatch in On-Demand Ride-Hailing Platforms: A Learning And Planning Approach. In Proceedings of the 24th ACM SIGKDD International Conference on Knowledge Discovery & Data Mining, London, UK, 19–23 August 2018. [Google Scholar]
  29. Li, Y.; Zheng, Y.; Yang, Q. Dynamic Bike Reposition: A Spatio-Temporal Reinforcement Learning Approach. In Proceedings of the 24th ACM SIGKDD International Conference on Knowledge Discovery & Data Mining, London, UK, 19–23 August 2018. [Google Scholar]
  30. Jintao, K.; Yang, H.; Ye, J. Learning to Delay in Ride-Sourcing Systems: A Multi-Agent Deep Reinforcement Learning Framework. IEEE Trans. Knowl. Data Eng. 2020, 34, 2280–2292. [Google Scholar]
  31. Chen, W.; Zhou, K.; Chen, C. Real-Time Bus Holding Control on a Transit Corridor Based on Multi-Agent Reinforcement Learning. In Proceedings of the 2016 IEEE 19th International Conference on Intelligent Transportation Systems (ITSC), Rio de Janeiro, Brazil, 1–4 November 2016. [Google Scholar]
  32. Alesiani, F.; Gkiotsalitis, K. Reinforcement Learning-Based Bus Holding for High-Frequency Services. In Proceedings of the 2018 21st International Conference on Intelligent Transportation Systems (ITSC), Maui, HI, USA, 4–7 November 2018. [Google Scholar]
  33. Wang, J.; Sun, L. Dynamic Holding Control to Avoid Bus Bunching: A Multi-Agent Deep Reinforcement Learning Framework. Transp. Res. Part C Emerg. Technol. 2020, 116, 102661. [Google Scholar] [CrossRef]
  34. Comi, A.; Sassano, M.; Valentini, A. Monitoring and Controlling Real-Time Bus Services: A Reinforcement Learning Procedure for Eliminating Bus Bunching. Transp. Res. Procedia 2022, 62, 302–309. [Google Scholar] [CrossRef]
  35. Shi, H.; Nie, Q.; Fu, S.; Wang, X.; Zhou, Y.; Ran, B. A Distributed Deep Reinforcement Learning–Based Integrated Dynamic Bus Control System in a Connected Environment. Comput.-Aided Civ. Infrastruct. Eng. 2022, 37, 2016–2032. [Google Scholar] [CrossRef]
  36. Oliehoek, F.A.; Amato, C. A Concise Introduction to Decentralized Pomdps; Springer: Berlin/Heidelberg, Germany, 2016. [Google Scholar]
  37. Littman, M.L. Markov Games as a Framework for Multi-Agent Reinforcement Learning. In Machine Learning Proceedings 1994; Elsevier: Amsterdam, The Netherlands, 1994. [Google Scholar]
  38. Gupta, J.K.; Egorov, M.; Kochenderfer, M. Cooperative Multi-Agent Control Using Deep Reinforcement Learning. In Proceedings of the International Conference on Autonomous Agents and Multiagent Systems, São Paulo, Brazil, 8–12 May 2017. [Google Scholar]
  39. Zhang, K.; Yang, Z.; Liu, H.; Zhang, T.; Basar, T. Fully Decentralized Multi-Agent Reinforcement Learning with Networked Agents. In Proceedings of the International Conference on Machine Learning, Stockholm, Sweden, 10–15 July 2018. [Google Scholar]
  40. Leottau, D.L.; Ruiz-del-Solar, J.; Babuška, R. Decentralized Reinforcement Learning of Robot Behaviors. Artif. Intell. 2018, 256, 130–159. [Google Scholar] [CrossRef] [Green Version]
  41. Darken, C.; Chang, J.; Moody, J. Learning Rate Schedules for Faster Stochastic Gradient Search. In Proceedings of the Neural Networks for Signal Processing, Helsingoer, Denmark, 31 August–2 September 1992. [Google Scholar]
  42. Storn, R.; Price, K. Differential Evolution–A Simple and Efficient Heuristic for Global Optimization over Continuous Spaces. J. Glob. Optim. 1997, 11, 341–359. [Google Scholar] [CrossRef]
  43. Paszke, A.; Gross, S.; Chintala, S.; Chanan, G.; Yang, E.; DeVito, Z.; Lin, Z.; Desmaison, A.; Antiga, L.; Lerer, A. Automatic Differentiation in Pytorch. In Proceedings of the 31st Conference on Neural Information Processing Systems (NIPS 2017), Long Beach, CA, USA, 4–9 December 2017. [Google Scholar]
Figure 1. Bus loop corridor model.
Sustainability 15 10947 g001
Figure 2. Exploration rate in the training process.
Sustainability 15 10947 g002
Figure 3. Training process for PS-DQN under different scenarios.
Sustainability 15 10947 g003
Figure 4. Trajectories under different strategies.
Sustainability 15 10947 g004
Figure 5. Bus loads at stops under different strategies.
Sustainability 15 10947 g005
Figure 6. Comparison of average waiting time under different strategies.
Sustainability 15 10947 g006
Figure 7. Comparison of average occupancy variability under different strategies.
Sustainability 15 10947 g007
Figure 8. Comparison of the distribution of total trip time under different strategies.
Sustainability 15 10947 g008
Figure 9. The effect of different numbers of hidden layers on the training process.
Sustainability 15 10947 g009
Table 1. List of notations, definitions, and units.
NotationDefinitionUnit
i Index of bus trip
j Index of bus stop
a i , j The arrival time of the bus trip i at the stop j s
d i , j The departure time of the bus trip i from the stop j s
t i , j The travel time between stops j and j + 1 for the bus trip i s
h i , j The headway between the bus trip i 1 and the bus trip i when they arrive at the stop j s
t a The alighting time per passengers/pax
t b The boarding time per passengers/pax
x i , j The holding time of the bus trip i at the stop j s
w i , j The dwell time of the bus trip i at the stop j s
λ j The passenger arrival rate at the stop j pax/min
ρ j The alighting proportion at the stop j %
o i , j The number of onboard passengers on the bus trip i when arriving at the stop j pax
b i , j The number of passengers waiting to board the bus trip i at the stop j pax
l i , j The number of passengers alighting from the bus trip i at the stop j pax
I The total number of bus trips ( I > N )
J The total number of stops
N The number of buses in a fleet
Table 2. Average arrival rate and alighting proportion at each stop.
Stop12345678910
λ j (pax/min)0.51.44.541.81.451.050.750.450.2
ρ j (%)10002525505010752010
Disclaimer/Publisher’s Note: The statements, opinions and data contained in all publications are solely those of the individual author(s) and contributor(s) and not of MDPI and/or the editor(s). MDPI and/or the editor(s) disclaim responsibility for any injury to people or property resulting from any ideas, methods, instructions or products referred to in the content.

