Article

Research on Operation Efficiency Prediction and Optimization of Biological Retention System Based on GA-BP Neural Network Model

1
College of Hydraulic Engineering, Tianjin Agricultural University, Tianjin 300384, China
2
Tianjin Center, China Geological Survey, Tianjin 300170, China
*
Author to whom correspondence should be addressed.
Sustainability 2023, 15(14), 10990; https://doi.org/10.3390/su151410990
Submission received: 19 May 2023 / Revised: 19 June 2023 / Accepted: 7 July 2023 / Published: 13 July 2023

Abstract

:
Bioretention systems are an important measure in sandy city construction to remove pollutants. This study collected all the operating data samples of bioretention ponds currently in operation in China and used the Mantel test and Redundancy Analysis (RDA) to optimize the main factors that affect the changes in pollutant-removal efficiency. Genetic Algorithms (GA) were used to optimize the Back Propagation (BP) neural network model, and a predictive index system was established to predict the efficiency of removing typical pollutants (ammonia nitrogen and nitrite nitrogen) by bioretention ponds. The operating efficiency of bioretention ponds was evaluated and predicted based on the GA-BP neural network model. The results indicated that the highest positive correlation with the operating efficiency of the bioretention system was X3 (rainfall duration), with a correlation coeffi-cient of 0.79, while the highest negative correlation was with X7 (percentage of strong percolating soil) and X12 (the proportion of mineral fillers), with correlation coefficients of −0.89. The overall regression coefficients of the GA-BP model for predicting the efficiency of removing typical pollu-tants (ammonia nitrogen and nitrite nitrogen) were 0.9397 and 0.9303, respectively, indicating high accuracy and representativeness. The overall regression index of the model is 0.9298, and the overall predicted removal rates of typical pollutants in the blank area are 78.72%, 70.31%, and 86.92%, re-spectively. The model can provide a basis and reference for the construction and planning of bio-retention ponds in areas lacking them.

1. Introduction

In recent years, China has undergone a significant scale of urbanization development, which has increased the coverage of impermeable surfaces and accelerated and expanded the transformation of rainfall-runoff and exacerbated surface source pollution [1]. Cities are gradually becoming growth centers of high population and economic concentration, while also facing increasing risks of flooding and urban water ecological safety [2] with the frequent occurrence of extreme weather. How to protect urban water ecological safety and enhance the resilience and sustainability of cities has become a hotspot of research in related fields. Therefore, China has proposed a new concept of urban rainwater management, “sponge city” [3], in order to prevent or alleviate urban flooding and runoff pollution and improve the functionality of urban ecosystems.
In the various measures of the sponge city system, the purification effect of bioretention ponds has received widespread recognition and application [4]. Bioretention ponds are small-scale natural treatment systems that use porous filter media for growing one or more vegetation species to filter pollutants in rainwater [5]. The aim is to overcome the negative impact of urbanization on water quality by simulating the natural water cycle in urban planning and design, which helps the system return to its natural hydrological condition before development. This delay of peak flow and reduction of peak flow total volume can prevent sewage overflow. Additionally, it can remove total suspended solids, nitrogen, phosphorus, heavy metals, and carbon-based pollutants [6]. Current research on bioretention ponds mainly focuses on three aspects: types of filler, species of plants, and the design size of the bioretention area. Robert [7] et al. tested the accumulation, distribution, and concentration of 38 organic pollutants in 12 bioretention facilities and found that the concentration of pollutants in the upper media layer was higher, and it decreased as the surface depth increased. Öhrn Sagrelius [8] studied the impact of different construction designs and building components on different bioretention systems and summarized the function of hydrological cycling in plants and microbes in bioretention systems. Mehmood [9] summarized the functions of plant and microbial studies in the hydrological cycle of biological retention systems and proposed to characterize rainwater and allocate water sources in different regions according to socio-economic, topographic, and climatic conditions.
To effectively design biological retention areas and predict their processing effects and rainwater retention capabilities, it is necessary to explore and improve various factors that affect them. Currently, scholars have chosen hydrological models to predict the operating performance of biological retention ponds. For example, Diab [10] used the DRAINMOD-Urban model to conduct fine hydrological modeling of biological retention ponds, simulating ponds with different media depths, site conditions, and overflow tendencies. Under different design configurations, the drainage process line shape could be accurately simulated on a time scale. Similarly, Tansar [11] used two global sensitivity analysis methods, VARS and Sobol, to quantitatively analyze the effects of parameters and hydrological model changes on parameters under different rainfall conditions and scales. Lisenbee [12] quantified the performance of the DRAINMOD-Urban and SWMM LID modules, providing a calibration for the runoff path in the biological retention model to better represent the drainage and overflow of the pond. These models are typically complex and emphasize the changes in hydrological runoff. However, this study suggests that the role of biological retention ponds in removing contaminants should also be evaluated. In addition, artificial neural network algorithms are widely popular due to their ability to analyze complex data and make predictions without making too many assumptions. For example, Li [13] and others used a BP neural network combined with landscape ecology principles to integrate ecological and urban development evaluation indicators into urban green space landscape planning. By predicting the impact of human behavior on urban ecology, a more comprehensive evaluation and prediction of urban green space landscape planning can be made. Similarly, Hu [14] collected relevant data related to 30 urban road networks across the country and used an improved BP neural network to evaluate the level of ecological civilization. Wu [15] and others used a particle swarm optimization algorithm to obtain the parameters of a BP neural network and established a model for predicting the concentration of dissolved oxygen in water quality, providing a decision-making basis for water pollution control and water management. From these studies, it can be seen that the artificial neural network algorithm is an effective data processing method which can be used to predict the processing effect of biological interception pool.
Based on the above analysis, current research on biological retention ponds mainly simulates drainage, overflow, and seepage, but lacks the simulation analysis of the removal efficiency of typical pollutants. Therefore, this study collected all the operating data samples of biological retention ponds in China using the Mantel test and RDA analysis to select the main factors affecting the variation in pollutant removal efficiency and analyzed the correlation between the removal efficiency of nitrogen and various factors, thereby optimizing the main factors. Then, using a genetic algorithm (GA) to optimize a BP neural network, a prediction framework was established to predict the removal efficiency of biological retention ponds for typical pollutants (ammonium nitrogen and nitrate nitrogen). The simulation and prediction of the removal efficiency of nitrogen in different scenarios were performed, and the research provided theoretical reference and practical basis for the construction of biological retention facilities in subsequent blank areas.

2. Methods and Materials
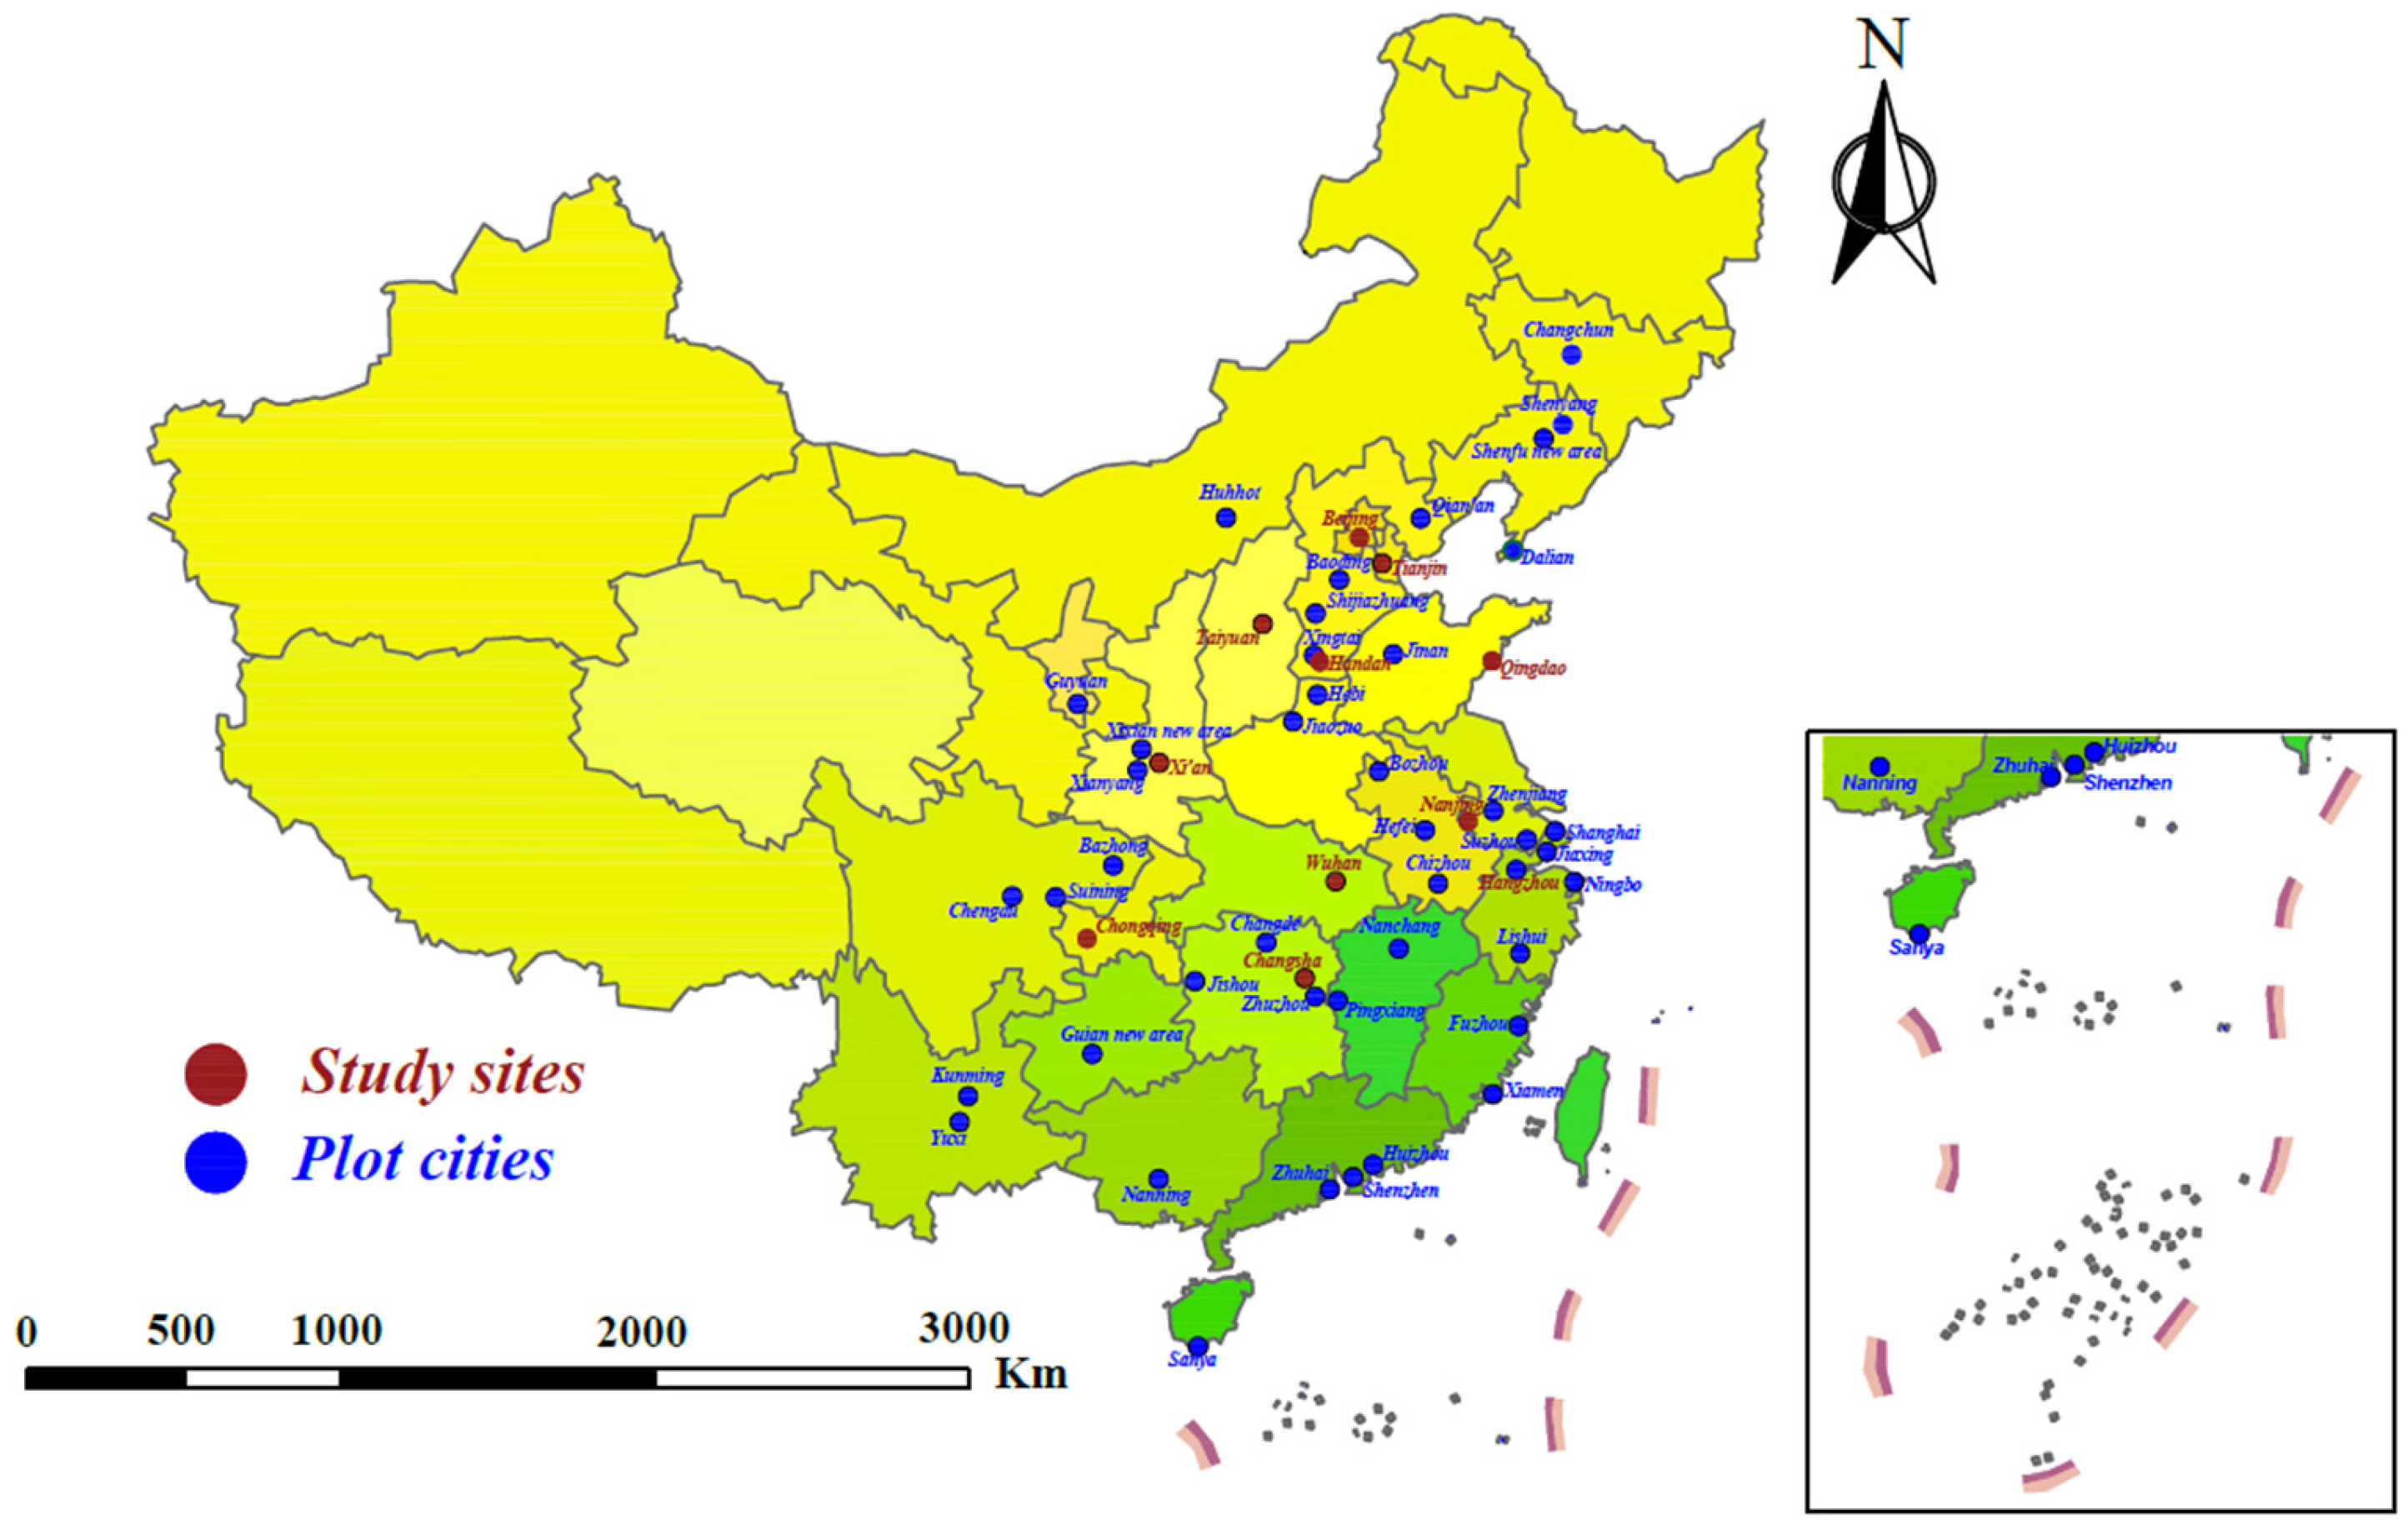
2.1. Study Area

China is located in the east of Asia and on the west coast of the Pacific Ocean, with a total land area of approximately 9.6 million square kilometers. It spans a wide latitude range, and the terrain is diverse, with various terrain types and mountain orientations. Therefore, the combination of temperature and precipitation is greatly different, resulting in a variety of climates throughout the country. The seasonal distribution of rainfall in China follows a pattern of decreasing amounts from the coastal areas of the southeast to the interior of the northwest. The geographical location across three climate belts makes China’s water resources highly unequally distributed. Currently, the Chinese government has established 33 sponge city pilot cities (blue in Figure 1), with construction sites mainly distributed in central and eastern China. Fewer construction sites are located in the northeast and west. Based on the completion level and construction time of the sponge city construction, and the degree of completeness of published data, 11 cities were collected with detailed research data on biological retention ponds as research areas (red in Figure 1).

2.2. Article Search and Data Extraction

To establish a prediction framework for the removal efficiency of typical pollutants (ammonium nitrogen and nitrate nitrogen) by biological retention ponds (Figure 2) and explore the current situation and influencing factors of biological retention ponds in China, the study conducted a literature search using the keywords “biological retention”, “artificial wetland”, and “nitrogen”.
Multiple search engines were used to retrieve relevant articles, with Chinese literature and data sourced from the National Knowledge Infrastructure website, and English literature retrieved using the Web of Science and ScienceDirect databases. The number and quality of samples determine the effectiveness and reliability of the prediction model. To avoid poor sample quality and low predictive accuracy of the number of samples, The study selected data from high-impact journals (works from the Chinese literature come from primary journals, those from the English literature come from SCI).
This article combines the research progress of model prediction systems at home and abroad, considering the three aspects of filler type, environmental factors, and design parameters. At the same time, in order to avoid data distortion caused by different regions and protect the availability and integrity of data, the study selected 15 comprehensive indicators, including the duration of rainfall, concentration of inflow, and depth of the retention layer, as explanatory variables, and the removal efficiency of ammonium nitrogen and nitrate nitrogen as response variables. The study collected 120 valid datasets [16,17,18,19,20,21,22,23,24,25,26,27,28,29,30,31,32,33,34,35,36,37,38,39,40,41,42,43,44,45,46,47,48,49,50,51,52,53,54,55,56,57,58,59,60,61,62,63,64,65,66,67]. The prediction framework is listed in Table 1, and the indicators marked with * are special indicators, while the others are general indicators.

2.3. Statistical Methods

2.3.1. Typical BP Neural Network

BP neural network is a multi-layer feedforward neural network with its main feature being the forward propagation of data but the backward propagation of error signals. The BP neural network is composed of the topology of three neural networks: the input layer, the hidden layer, and the output layer. Therefore, the entire network based on its main features and topology could be built.
  • Network initialization
Assume that the number of nodes in the output layer is n , the number of nodes in the hidden layer is l , the number of nodes in the output layer is m , the weight from the input layer to the hidden layer is ω i j , the weight from the hidden layer to the output layer is ω j k , the bias from the input layer to the hidden layer is a j , the bias from the hidden layer to the output layer is b k , the learning rate is η , the excitation function (EF) is g ( x ) , and x is the input value. The EF can be calculated using the following formula [68]:
g ( x ) = 1 1 + e x
2.
Hidden layer output
The hidden layer output can be calculated using the following formula [69]:
H j = g ( i = 1 n ω i j x i + a j )
3.
Output layer output
The output layer output can be calculated using the following formula [70]:
O k = j = 1 l H j ω j k + b k
4.
Error analysis
The equation is shown as Formula (4):
Y k O k = e k
where Y k is the expected output, and the error (E) can be calculated using the following formula [71]:
E = 1 2 k = 1 m e k 2
5.
Update of weights
The update of weights can be calculated using the following formula [72]:
{ ω i j = ω i j + η H j ( 1 H j ) x i k = 1 m ω j k e k ω j k = ω j k + η H j e k
6.
The update of offset
The update of offset can be calculated using the following formula [73]:
{ a j + η H j ( 1 H j ) k = 1 m ω j k e k b k = b k + η e k
7.
Determine whether the algorithm iteration is complete
When the network error decreases to the preset minimum value or the preset training times, the iteration ends.

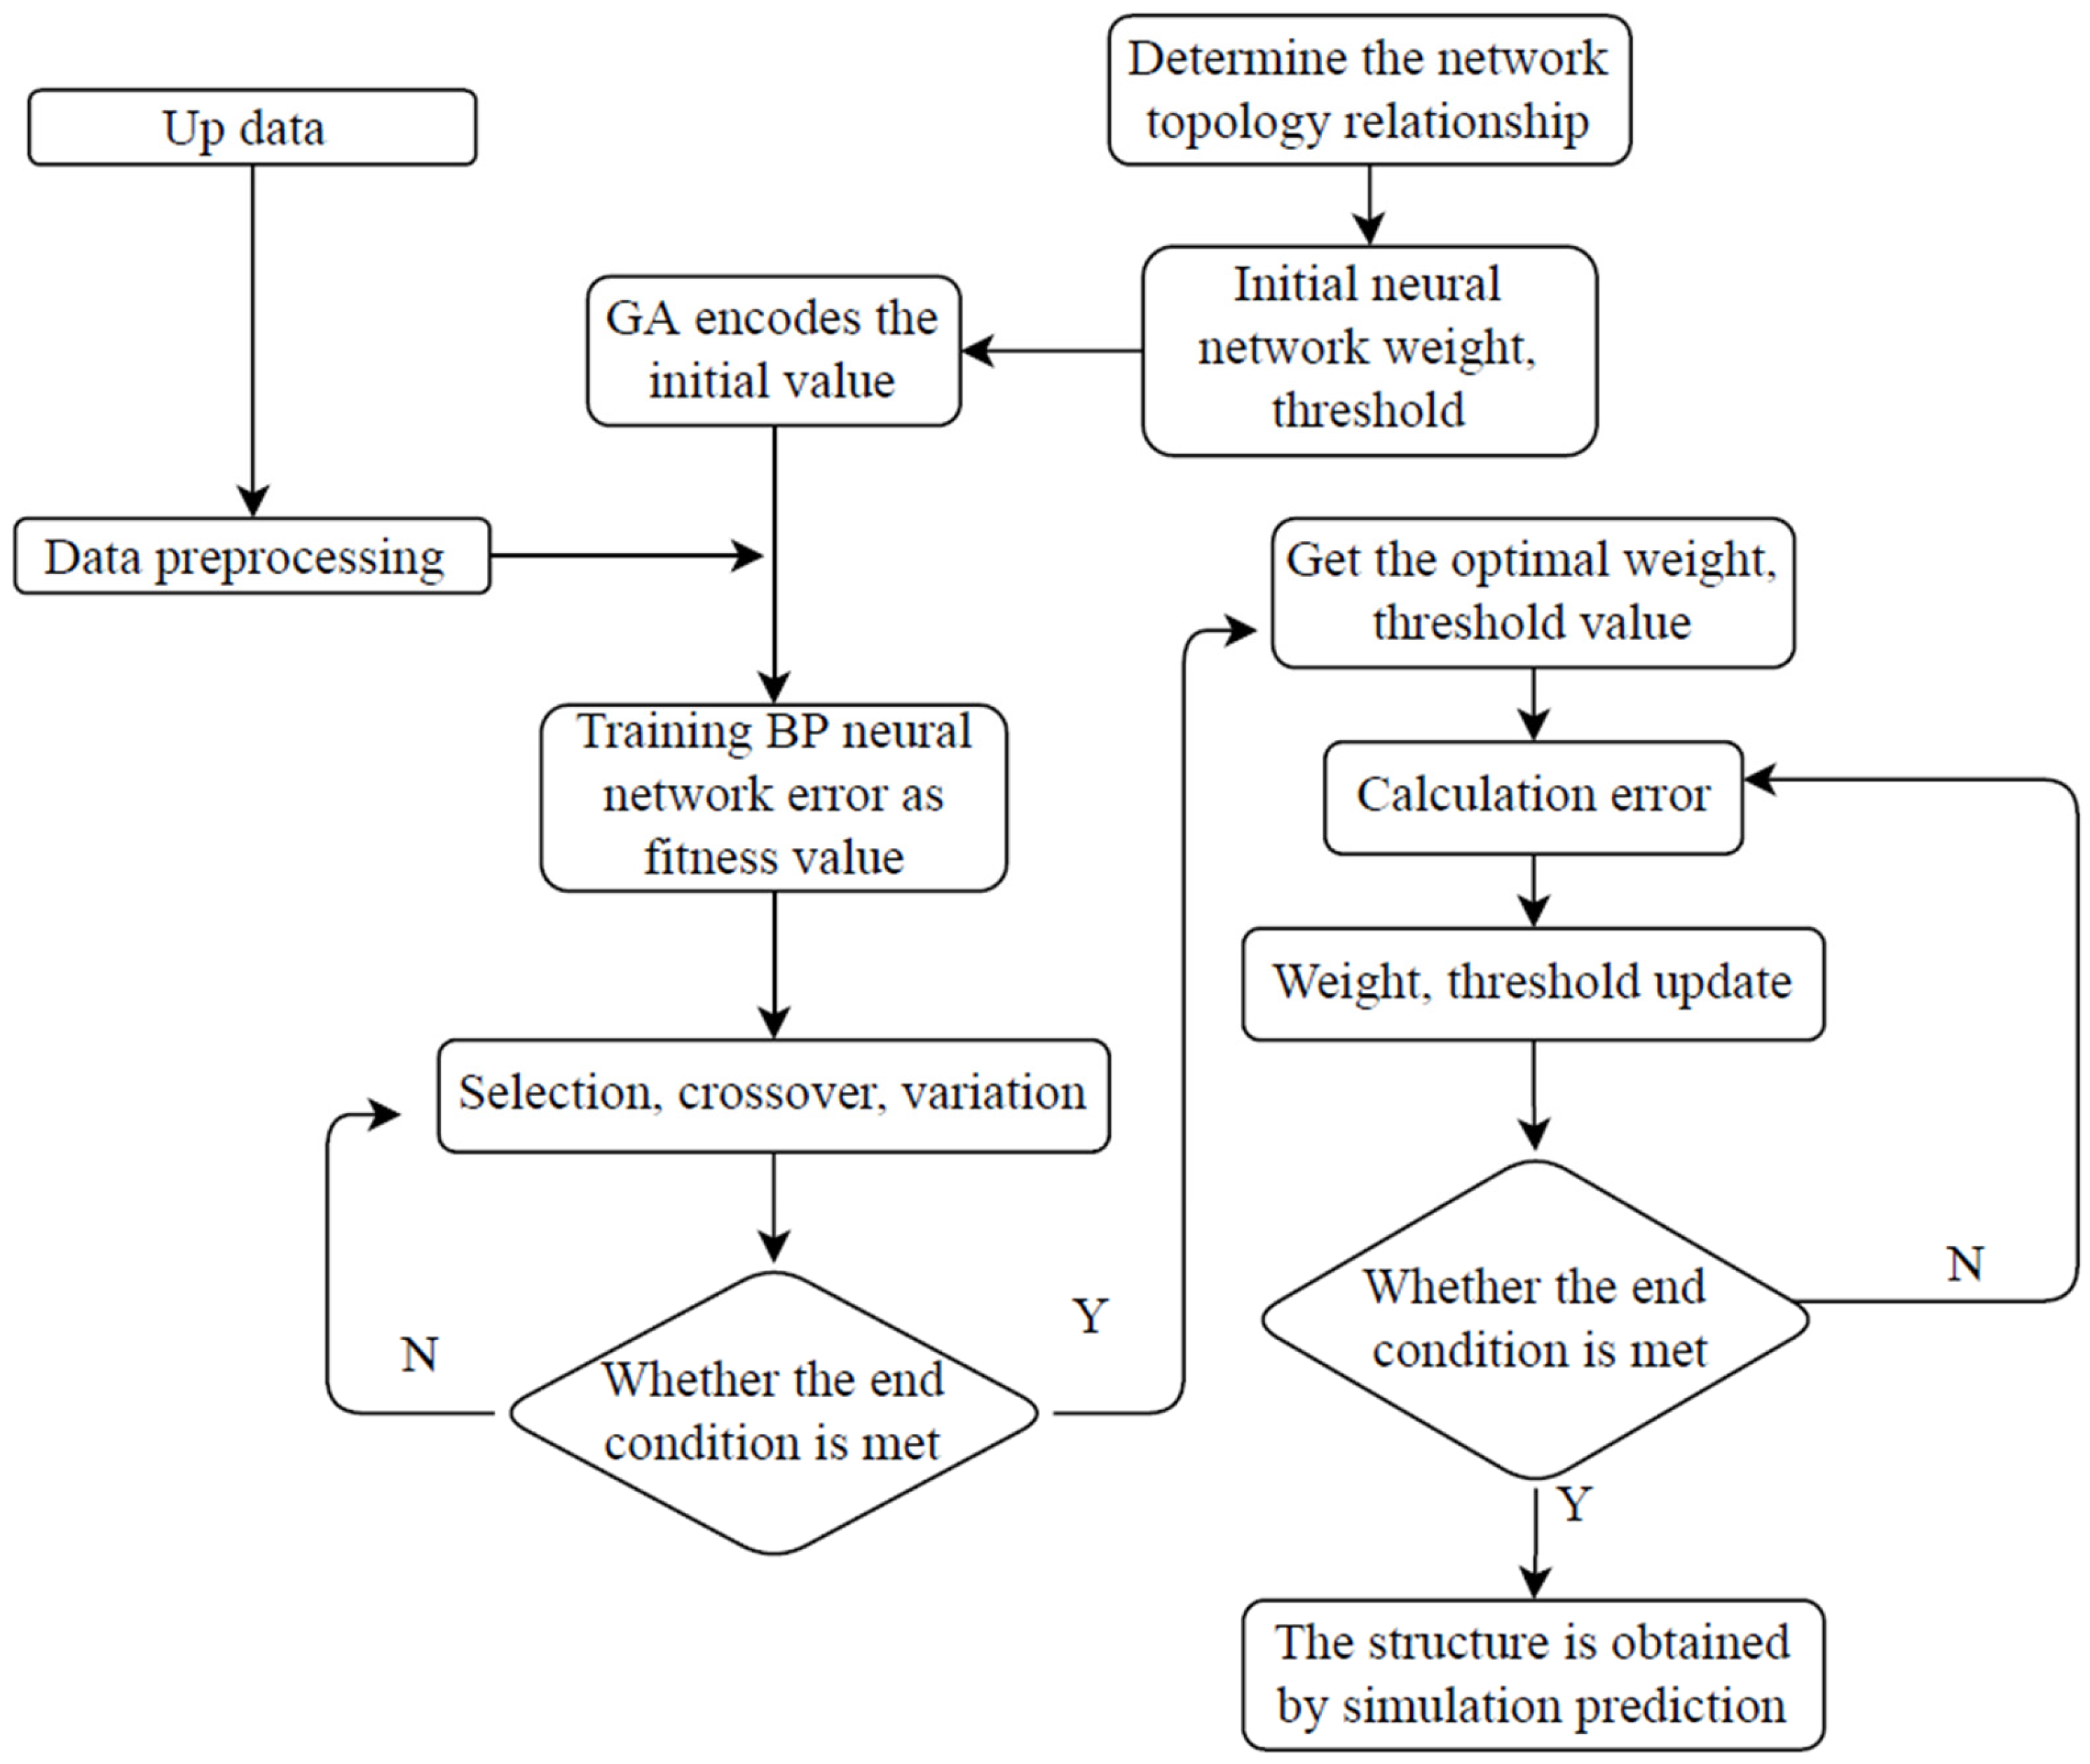
2.3.2. Optimization of BP Neural Network Based on Genetic Algorithm

GA is an optimization algorithm based on the theory of natural selection and genetic mechanism. It simulates the process of biological evolution to generate the solutions of the problem through operations such as replication, crossover, and mutation. It gradually eliminates the solutions with low fitness function values and increases the solutions with high fitness function values. After evolving for N generations, it is possible to evolve individuals with high fitness function values, which are the optimal solutions of the target function values we want. BP neural networks have strong local search abilities but are easy to get stuck in local minima. GA has the characteristics of self-adaptability, global optimization, and implicit parallelism, so both GA and BP neural networks can be perfectly combined to achieve automatic optimization and improve learning efficiency. The specific optimization flow chart is shown in Figure 3.
Firstly, the randperm ( ) function was used to randomly shuffle the sample data and repeat the parallel modeling 5 times to better demonstrate the stability and reliability of the model prediction. Of the randomly shuffled data, 82% were used for model training and 18% were used for data testing. The data used for testing were not involved in model training. However, due to the differences in the units and scales of the input data, the mapminmax ( ) function was used to firstly normalized the data, and then, to perform inverse normalization, the mapminmax ( ) function was used after model training and testing. The genetic algorithm generations were set to 100, the population size was set to 20, and the training target was set to 0.000001.

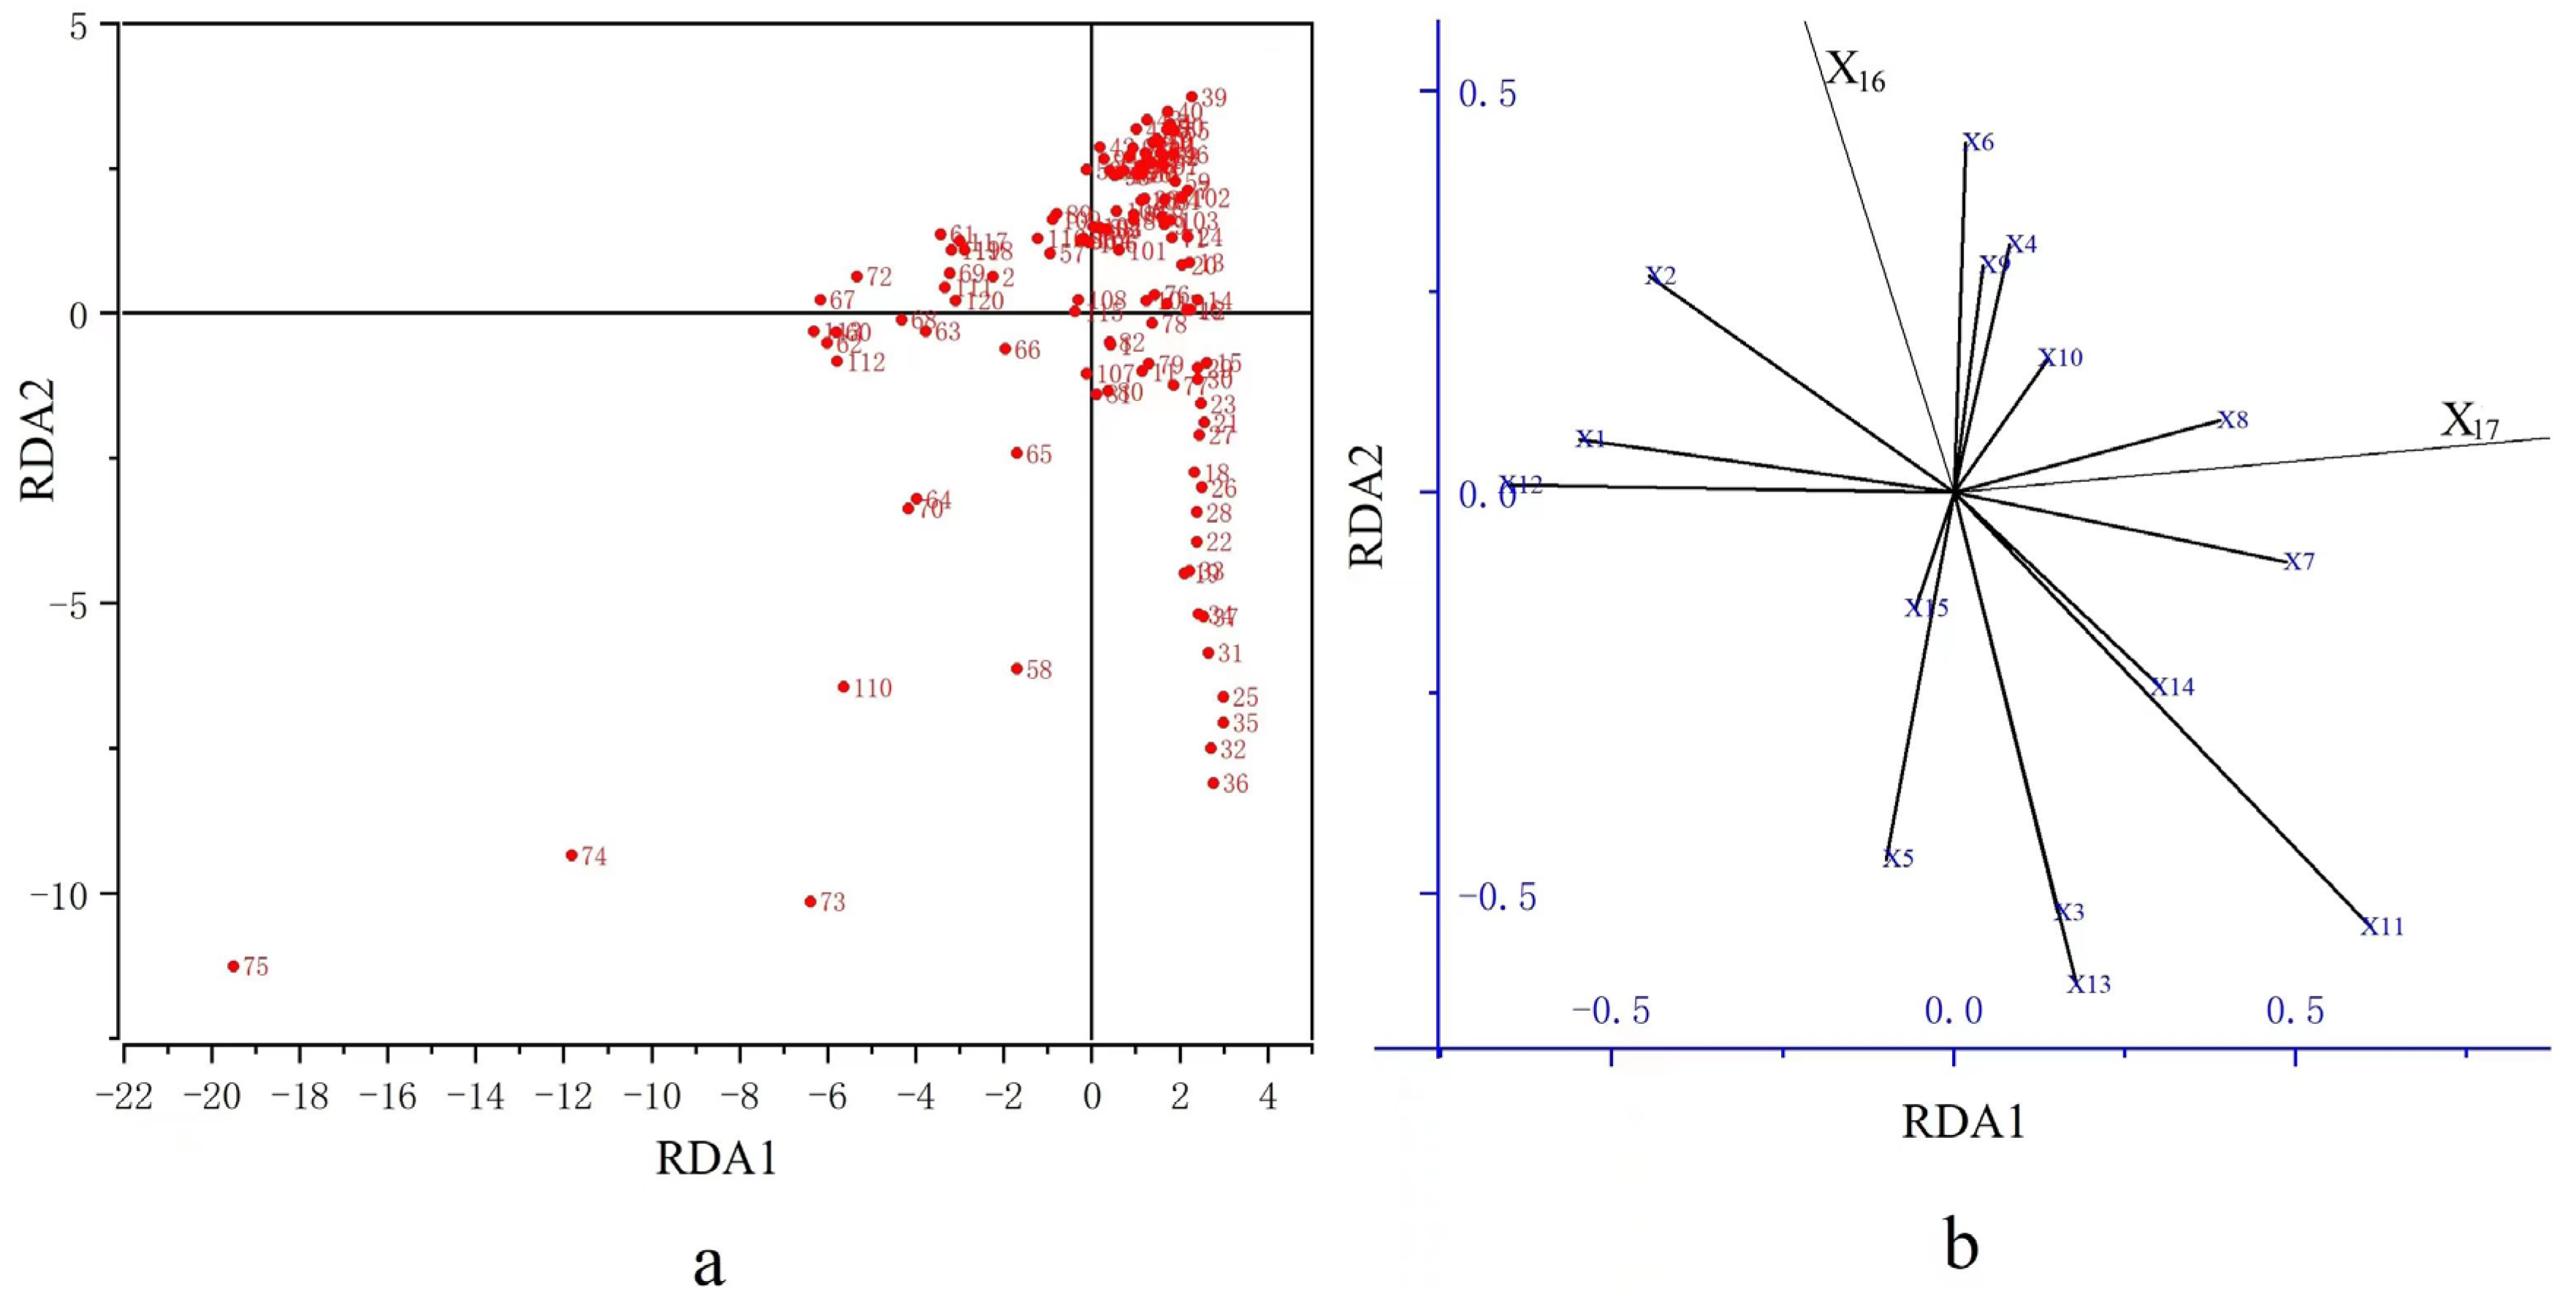
2.3.3. Mantel Test and RDA Analysis

The correlation coefficient can only handle the correlation between two columns of data, but it has no way of dealing with the correlation between two matrices. However, the Mantel test [74] can be used to test for the correlation between two matrices. Since it is a test, there must be a null hypothesis. The null hypothesis of the Mantel test is that there is no correlation between the two matrices. The testing process is as follows: both matrices are expanded correspondingly, and two variables are selected. The correlation coefficient is calculated, and then one column or both columns are permuted simultaneously. A new value is calculated, and the process is repeated thousands of times. The actual r value is compared with the distribution of r values obtained through permutation. If the actual r value stands far away from the distribution of r values obtained through permutation, then there is no significant correlation. If it is relatively close to the distribution of r values obtained through permutation, then there is a significant correlation.
RDA analysis [75] is a PCA analysis of the regression values matrix between the response variable matrix and the explanatory variable matrix through multiple linear regression. At each calculation step, the regression is performed between the factors. Also known as multi-dimensional direct gradient analysis, this analysis is commonly used to reflect the relationship between microbiota and environmental factors.

3. Results

3.1. Main Influencing Factors of Nitrogen Removal Rate

Using the R language software, Mantel test analysis results were conducted, as shown in Figure 4, to determine the statistical differences between each indicator and their correlation coefficients. The color gradient represents the correlation coefficient, while * and ** indicate significant correlations at p < 0.05 and p < 0.01, *** indicate significant correlations at p < 0.001, respectively. The width of the lines corresponds to the Mantel R statistical parameter, while the color of the lines corresponds to the statistical significance based on connectivity.
From Figure 4, it can be seen that X16 (NH4+-N removal rate) has a higher statistical significance than X3 (rainfall duration), X5 (NH4+-N influent concentra-tion), X10 (organic filler ratio), X13 (drainage layer depth), X14 (accumulation layer depth), and X15 (filler layer depth) (p < 0.05), indicating that ammonium nitrogen removal rate is mainly influenced by environmental and design parameters. On the other hand, X17 (nitrate nitrogen removal rate) has a higher statistical significance than X7 (strong percolation rate) and X12 (mineral filler rate), and is relatively influenced by the filler. In terms of the correlation coefficients between indicators, the highest positive correlation is between X3 (rainfall duration) and X13 (drainage layer depth), with an R value of 0.79; the highest negative correlation is between X7 (strong percolation rate) and X12 (mineral filler rate), with an R value of −0.89. The correlation coefficient between X5 (ammonium nitrogen input concentration) and X8 (weak percolation rate) is only −0.01.

3.2. Relationship between Nitrogen Removal and Its Factors

To further understand the relationship between nitrogen removal and various indicators, the study applied Redundancy Analysis (RDA) and selected ammonium nitrogen removal rate (X16) and nitrate nitrogen removal rate (X17) as response variables, while environmental factors (X1, X2, X3, X4, X5, X6), filler types (X7, X8, X9, X10, X11, X12), and design parameters (X13, X14, X15) were selected as explanatory variables. In the RDA sorting diagram, samples are plotted as points directly at the corresponding coordinates. Variables are represented as vectors. The angle between the vector of the response variable and the vector of the explanatory variable reflects their correlation, with correlation equal to the cosine of the angle between the vectors.
The spatial distribution of data samples in the four quadrants is shown in Figure 5a. The overall distribution of all samples has certain spatial similarity, and most of them are clustered in the first, second, and fourth quadrants, which indicates that our data are highly correlated. However, there are also significant differences among the samples, including samples 58, 73, 74, 75, and 110. In order to improve the accuracy of the subsequent model, we eliminated these five groups of obviously abnormal data. It can be seen from Figure 5b that X7 and X8 are highly positively correlated with X17, while X1 and X12 are highly negatively correlated with X6. X16 has a high positive correlation with X2 and X6; a high negative correlation with X11, X14, and X5; but an extremely negative correlation with X3 and X13. The overall situation is consistent with Figure 4, indicating the reliability of the data.

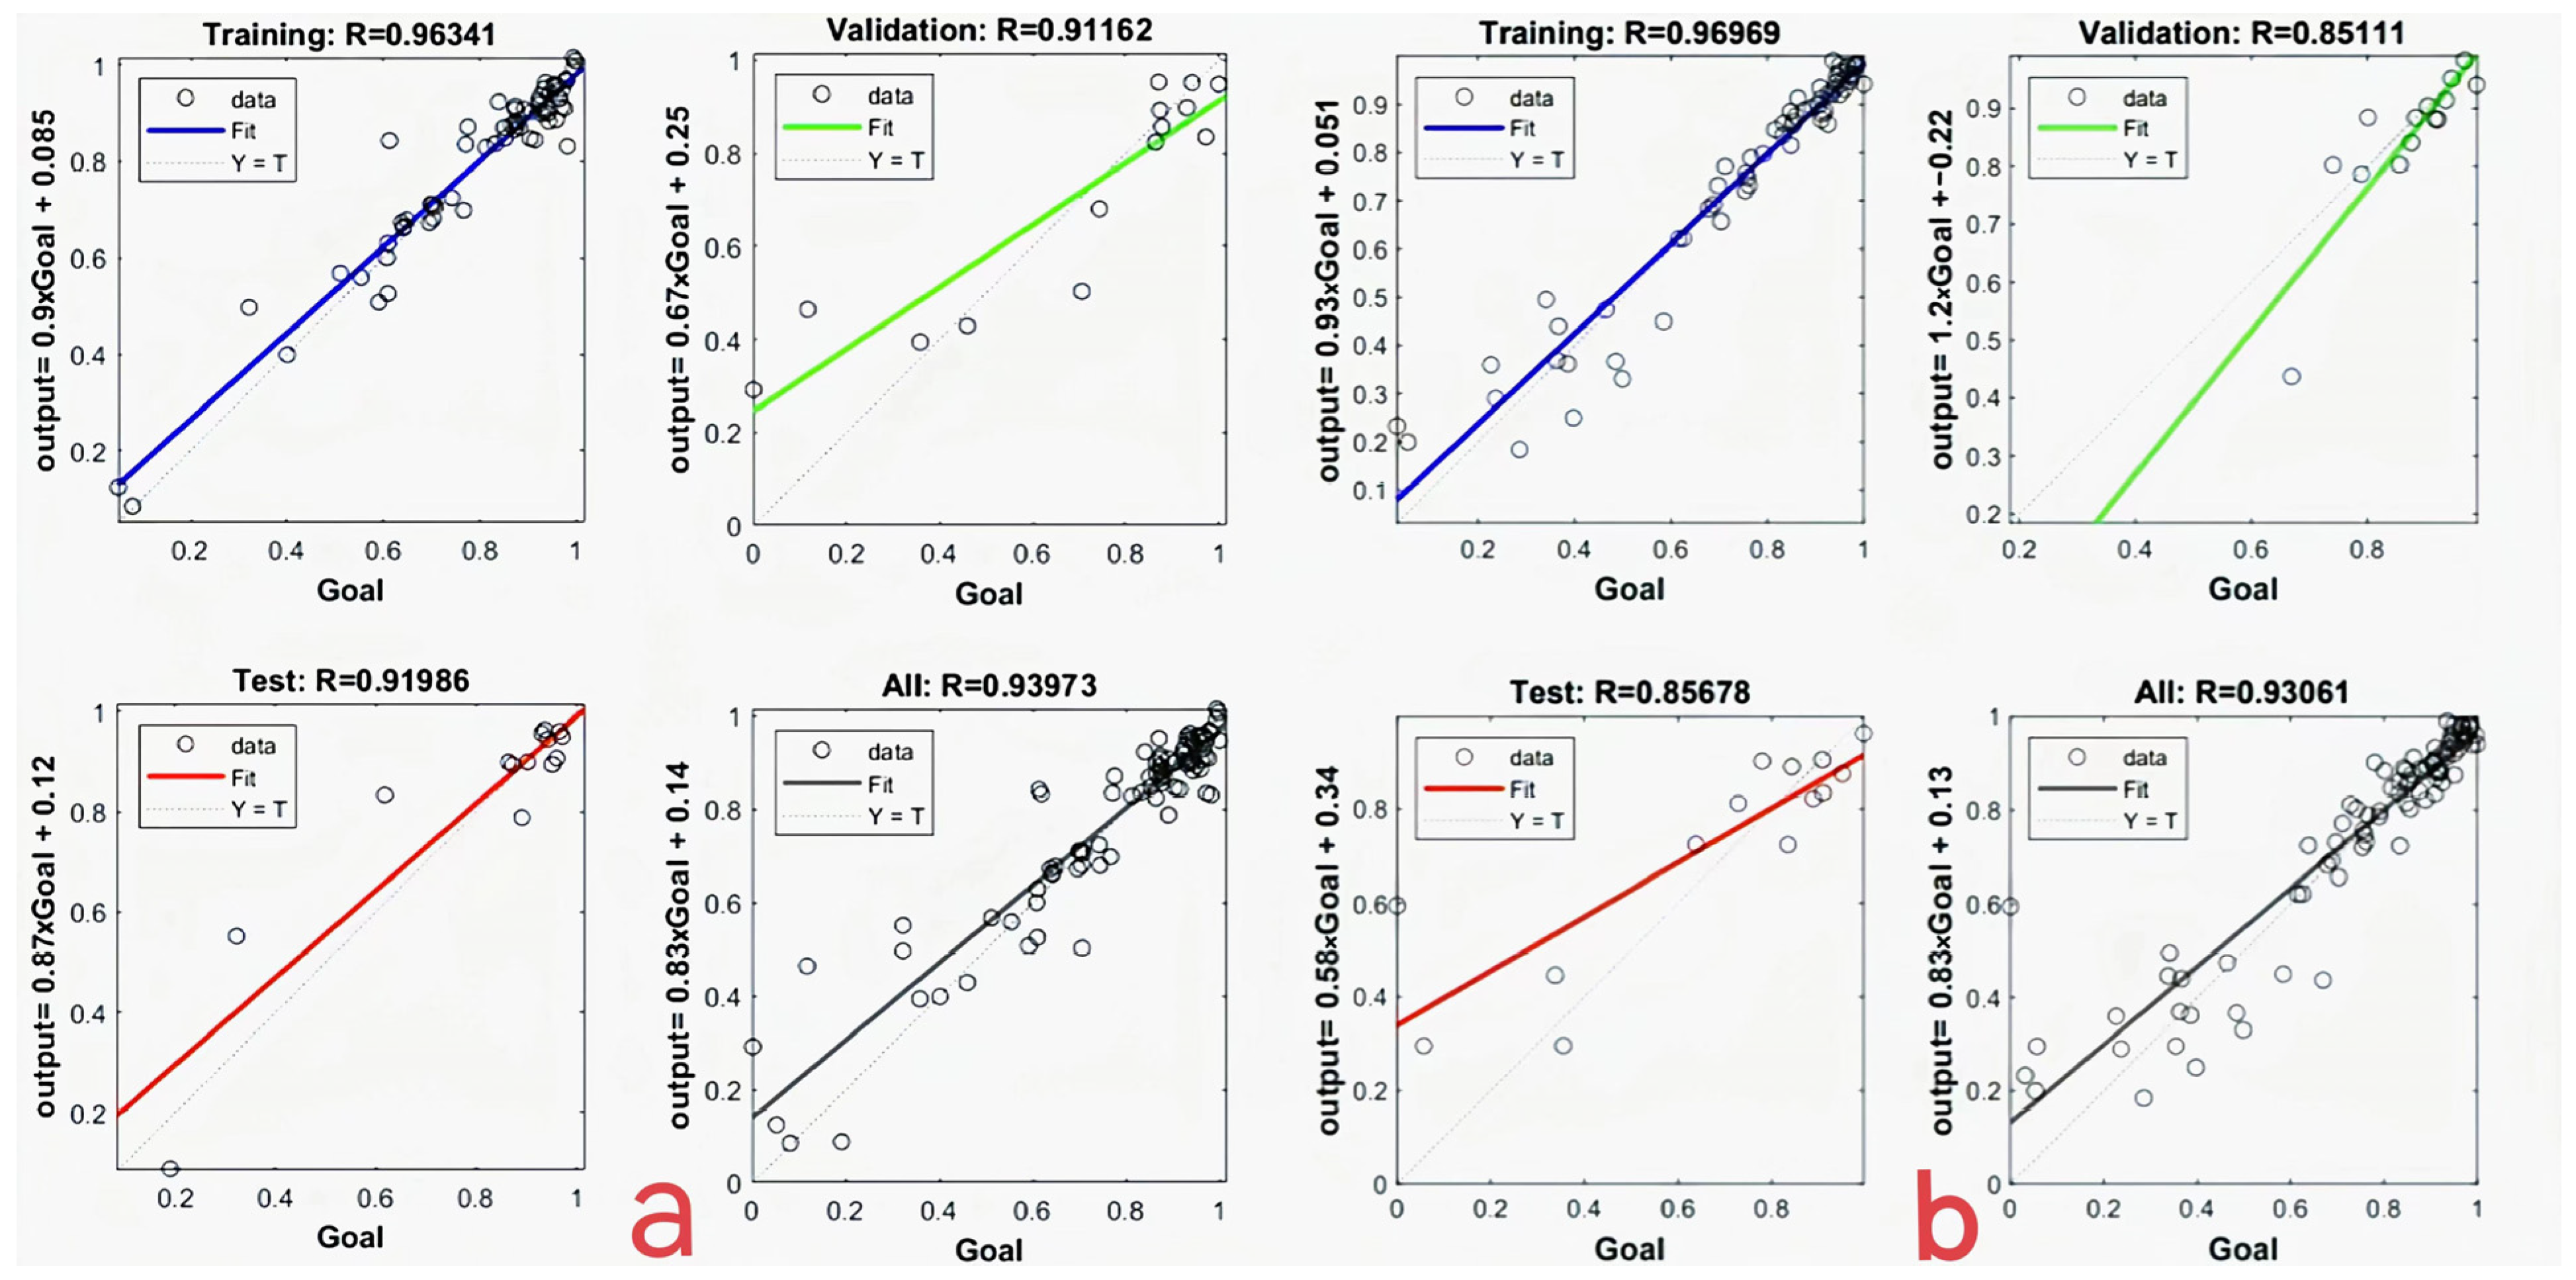
3.3. GA-BP Neural Network Model Training Results

The training results generated after the GA-BP neural network training are shown in Figure 6. According to the results of Figure 6a, the regression coefficients R of the training group, the verification group, and the test group are 0.9634, 0.9116, and 0.91986, respectively, while the overall regression coefficient R is 0.9397. The regression coefficient R of the training group, the verification group, and the test group of group Figure 6b is 0.9697, 0.8511, and 0.8568, respectively, and the overall regression coefficient R is 0.9303. It can be seen from the sample results of the two groups that there is a strong correlation between the simulated value of the model and the measured value. At this time, the model has high accuracy for predicting the removal of typical pollutants by a biological retention system.

4. Discussion

4.1. Mechanism Analysis of Influencing Factors for Removal of Typical Pollutants

The migration and cycling of nitrogen in the soil can be summarized as nitrification and denitrification.
During nitrification, NH4+-N enters the atmosphere layer of the soil, and after experiencing mineral fixation, biological fixation, ammonia volatilization, leaching, and adsorption by soil particles, the remaining portion is converted into NO3-N by microorganism action. The process of nitrification requires oxygen and alkalinity, and changes in pH value and oxygen concentration can affect the occurrence and progress of nitrification [76,77].
For the migration and cycling of ammonia nitrogen, its removal is mainly achieved through adsorption by adsorbents and biological fixation. However, some of it is also migrated to the deeper soil layer through rainwater erosion [78], resulting in leaching losses. Studies have shown that the amount of ammonia nitrogen lost is closely related to rainfall factors (X1–X6): as the rainfall amount (X1) increases and the rainfall intensity increases, the number of pollutants lost and the migration intensity also increase accordingly. The longer the rainfall duration (X3), the more gradually the rainwater force accumulates through sedimentation, suspension, and sedimentation in the entire environment, leading to a gradual shift from quantity to quality, making leaching more likely to occur [79]. The structure of adsorbents (X7–X12) affects the soil moisture content, porosity, solute migration rate in pores, and organic matter content, thereby affecting the leaching of ammonia nitrogen. The stronger the intermolecular force and chemical bond between different adsorbents and ammonia nitrogen, the stronger their adsorption ability and the less likely they are to leach. Intelligent drainage layer (X13) and retention layer (X14) depth can quickly empty the water in the adsorbent layer, improve the soil permeability and water-conducting rate, and increase the oxygen content, making nitrification bacteria the dominant species, thereby enhancing nitrification and causing NH4+-N adsorbed on adsorbents to be quickly decomposed, freeing more adsorption sites and improving the adsorption ability of adsorbents and soil [80].
In contrast to denitrification, for nitrate, mineral adsorbents (X12) are beneficial for water storage due to their large specific surface area and strong adsorption ability and have a relatively strong water-holding capacity. The properties of their chemical bonds can provide electrons donors for NO3-N denitrification [81] or provide suitable reaction spaces for nitrogen-functional microorganisms to promote the removal of NO3-N. The frequency of inflow (X4) and the intensity of rainfall affect the hydraulic residence time and NO3-N input load of runoff pollutants in the system. Influenced by soil profile structure, the NO3-N content in each profile soil also has spatial heterogeneity. Therefore, appropriately increasing the depth of the adsorbent layer (X15) can extend the hydraulic residence time while creating a better anaerobic environment, allowing denitrifying bacteria to accelerate denitrification reactions [82]. The loss and removal rate of NO3-N are significantly positively related to the inflow concentration (X6): high NO3-N concentration can affect the soil pH value and the content of dissolved oxygen, eventually affecting the activity of plants and microorganisms [83]. After NO3-N passes through the root zone, a large amount of NO3-N is accumulated and stored in the atmosphere layer, resulting in a longer time for NO3-N to enter groundwater. These nitrogen species left in the atmosphere layer can be slowly output through the base flow process as a long-term source of groundwater pollution [84]. Therefore, high permeability (X7) soil is a significant factor causing increases in NO3-N.

4.2. GA-BP Model Based Biological Retention Pool Design of Sponge City Blank Area in China

Due to the existence of significant regional differences in precipitation spatial distribution, there is also large heterogeneity in the annual runoff volume control rate in each region. Therefore, in order to achieve better upstream control effects, the scale of sponge facilities needs to be matched with the spatial distribution of rainfall in order to better design the scale of sponge facilities and harmoniously coordinate the relationship between urban artificial systems and ecosystems, thereby optimizing the overall layout of sponge cities.
According to the data [85], with the increase in the annual total runoff control rate, the standard deviation of designed rainfall in different provinces also increases in different amplitudes, especially in Guangdong, Guangxi, Sichuan, Hebei, Henan, and other regions, which is 1.5~3 times the average level. Based on the frequency of urban flood disasters in China, we selected Nanning in Guangxi, Suining in Sichuan, and Jiaozuo in Henan as the research objects to provide references for the planning and design of biological retention ponds. Before designing the scheme, in order to ensure the scientific validity of the model as much as possible, the current situation of the underlying surface in each region was investigated, and the basic data were obtained by combining the sponge city construction guidelines and precipitation characteristics in each region. Specific index parameters (see Table 2) are input into the model so as to obtain the simulation operation of biological detention facilities.

4.3. Operational Efficiency Prediction and Planning of Bioretention System in Construction Area

Note: The forecast results were for the three regions as a whole.
The study put specific index parameters into the model, and the results are shown in Figure 7. Based on the above data, the overall regression index of the model is 0.9298, and the overall predicted removal rates of typical pollutants in Suining, Nanning, and Jiaozuo are, respectively, 78.72%, 70.31%, and 86.92%.
The removal of pollutants is influenced by multiple parameters, such as climate variables, plant diversity, and microorganisms, which leads to different levels of deviation between the theoretical design of the model and its actual performance. Therefore, in actual construction, we should comprehensively design factors such as scale, surface conditions, and climate conditions to improve the operating efficiency of biological retention facilities.
Among them, the internal water storage area is a field relatively rarely studied at present, but setting the internal water storage area has been proven to significantly reduce the volume of runoff, effectively maintain the intensity of microbial activity, improve the denitrification reaction rate [86], and enhance the adsorption of harmful microorganisms in the system by enhancing the formation of biofilms, thus reducing the outflow concentration of harmful microorganisms [87]. System blockage is also an important problem to pay attention to. Blockage will lead to a decrease in system permeability, the deposition of pollutants, and also to a series of safety problems. Tedoldi [88] found that the higher the pollutant concentration in runoff, the more easily the system will be blocked. Therefore, plants with thicker rhizomes and fewer fiber roots should be planted in the construction of biological retention ponds in highly polluted areas [89,90] to give full play to the adsorption effect of rhizomes. Furthermore, the addition of drainage pipes in aquifers is also conducive to easing the system blockage [91].
Based on the above analysis, project managers, when working with a blank area, should specifically analyze the main influencing factors according to the relationship between different regions and indicators; comprehensively consider the project construction, maintenance, and related issues; and carry out cost-benefit analyses so as to realize the cost optimization of ecological and economic construction and make the construction of biological retention tanks more in line with the local construction needs.

4.4. Limitations of the Model

The model generally classifies the types of fillers when selecting indicators, but the types of fillers today are far from the same, so the model may be insufficient in the training of the types of fillers. It is inevitable that complex geographical conditions and climatic conditions will also lead to deviations in model predictions. Plants and microorganisms are an important part of the operation efficiency of bioretention ponds, but due to their complex mechanisms and unquantifiable characteristics, they cannot be accurately predicted in this study. In addition, the operation effect of biological retention ponds is affected by comprehensive factors such as climatic conditions, underlying surface characteristics, different scales, operation, and maintenance investment, which poses a complex environmental problem, so what studies can do is rationally analyze the change trend with a comprehensive method.

5. Conclusions

In this paper, all operational data samples of biological retention ponds in China were collected and analyzed by Mantel test and RDA to optimize the main factors affecting the change in pollutant removal efficiency. The GA-BP neural network algorithm was used to construct the evaluation model system of a biological retention pool planning scheme based on optimization factors to predict the operational efficiency of biological retention pools, and the following conclusions were obtained:
(1) Among the correlations of each influence factor, X3 (rainfall duration) and X13 (drainage layer depth) have the highest positive correlation, and the correlation coefficient is 0.79; X7 (proportion of strong permeable soil) and X12 (proportion of mineral filler) have the highest negative correlation, and the correlation coefficient is −0.89. Almost irrelevant is X8 (the proportion of weakly permeable soil), with a correlation coefficient of only −0.01.
(2) GA-BP model has high accuracy, and compared with the traditional model, the GA-BP neural network algorithm can directly predict the removal efficiency of typical pollutants, and the overall regression coefficient is as high as 0.9303, which directly proposes a scientific and reasonable evaluation for the construction of the program and ensures the reasonable construction of biological detention facilities under scientific guidance.
(3) The biological detention facilities in the blank area were predicted. The overall regression index of the model was 0.9298, and the overall predicted removal rates of typical pollutants in Suining, Nanning, and Jiaozuo were 78.72%, 70.31%, and 86.92%, respectively. The formation of harmful biofilms and root blockage of plants should be noted.

Author Contributions

F.C.: Writing—Original Draft; Q.Z.: Writing—Review and Editing; S.C.: Data Curation; Y.Y.: Software. All authors have read and agreed to the published version of the manuscript.

Funding

This study was supported by [the National Natural Science Foundation of China] (NO. 41907149) and [the China Postdoctoral Science Foundation] (NO. 2018M631732).

Data Availability Statement

All the data in this manuscript are derived from the references.

Conflicts of Interest

The authors declare no conflict of interest.

References

  1. Eckart, K.; McPhee, Z.; Bolisetti, T. Performance and implementation of low impact development—A review. Sci. Total Environ. 2017, 607–608, 413–432. [Google Scholar] [CrossRef] [PubMed]
  2. Jiang, Y.; Zevenbergen, C.; Ma, Y. Urban pluvial flooding and stormwater management: A contemporary review of China’s challenges and “sponge cities” strategy. Environ. Sci. Policy 2018, 80, 132–143. [Google Scholar] [CrossRef]
  3. Yuan, Y.; Zhang, Q.; Chen, S.; Li, Y. Evaluation of comprehensive benefits of sponge cities using meta-analysis in different geographical environments in China. Sci. Total Environ. 2022, 836, 155755. [Google Scholar] [CrossRef]
  4. Shreewatsav, M.; Sheriff, V.A. Augmentation of the urban green infrastructure using stormwater surface runoff as a resource in the NICE expressway, Karnataka, India. J. Environ. Eng. Landsc. Manag. 2022, 30, 165–178. [Google Scholar] [CrossRef]
  5. Morash, J.; Wright, A.; LeBleu, C.; Meder, A.; Kessler, R.; Brantley, E.; Howe, J. Increasing Sustainability of Residential Areas Using Rain Gardens to Improve Pollutant Capture, Biodiversity and Ecosystem Resilience. Sustainability 2019, 11, 3269. Available online: https://www.mdpi.com/2071-1050/11/12/3269 (accessed on 6 July 2023). [CrossRef] [Green Version]
  6. Muerdter, C.; Wong, C.; LeFevre, G. Emerging investigator series: The Role of Vegetation in Bioretention for Stormwater Treatment in the Built Environment: Pollutant Removal, Hydrologic Function, and Ancillary Benefits. Environ. Sci. Water Res. Technol. 2018, 4, 592–612. [Google Scholar] [CrossRef]
  7. Furén, R.; Flanagan, K.; Winston, R.J.; Tirpak, R.A.; Dorsey, J.D.; Viklander, M.; Blecken, G.-T. Occurrence, concentration, and distribution of 38 organic micropollutants in the filter material of 12 stormwater bioretention facilities. Sci. Total Environ. 2022, 846, 157372. [Google Scholar] [CrossRef]
  8. Öhrn Sagrelius, P.; Blecken, G.; Hedström, A.; Ashley, R.; Viklander, M. Environmental impacts of stormwater bioretention systems with various design and construction components. J. Clean. Prod. 2022, 359, 132091. [Google Scholar] [CrossRef]
  9. Mehmood, T.; Gaurav, G.K.; Cheng, L.; Klemeš, J.J.; Usman, M.; Bokhari, A.; Lu, J. A review on plant-microbial interactions, functions, mechanisms and emerging trends in bioretention system to improve multi-contaminated stormwater treatment. J. Environ. Manag. 2021, 294, 113108. [Google Scholar] [CrossRef]
  10. Diab, G.; Hathaway, J.M.; Lisenbee, W.A.; Brown, R.A.; Hunt, W.F. Fine scale hydrologic modelling of bioretention using DRAINMOD-urban: Verifying performance across multiple systems. J. Hydrol. 2022, 614, 128571. [Google Scholar] [CrossRef]
  11. Tansar, H.; Duan, H.-F.; Mark, O. Global sensitivity analysis of bioretention cell design for stormwater system: A comparison of VARS framework and Sobol method. J. Hydrol. 2023, 617, 128895. [Google Scholar] [CrossRef]
  12. Lisenbee, W.A.; Hathaway, J.M.; Winston, R.J. Modeling bioretention hydrology: Quantifying the performance of DRAINMOD-Urban and the SWMM LID module. J. Hydrol. 2022, 612, 128179. [Google Scholar] [CrossRef]
  13. Li, S.; Fan, Z. Evaluation of urban green space landscape planning scheme based on PSO-BP neural network model. Alex. Eng. J. 2022, 61, 7141–7153. [Google Scholar] [CrossRef]
  14. Hu, P. Evaluation algorithm of coastal city ecological civilization development level based on improved BP neural network. J. Environ. Manag. 2022, 321, 116039. [Google Scholar] [CrossRef] [PubMed]
  15. Wu, J.; Li, Z.; Zhu, L.; Li, G.; Niu, B.; Peng, F. Optimized BP neural network for Dissolved Oxygen prediction. IFAC-Pap. 2018, 51, 596–601. [Google Scholar] [CrossRef]
  16. Chai, H.; Chen, Y.; Shao, Z.; Yuan, Y.; Xu, Y.; Ni, Q.; Chai, H. Performance of Pyrite Substrate Bioretention System for Treatment of Rainfall Runoff. China Water Wastewater 2022, 38, 112–117. [Google Scholar]
  17. Chen, Y.; Cheng, Q.; Zheng, S.; Yu, X.; Ren, P. Effects of drying-rewetting alternating on nitrogen-related microbial functional communities in bioretention systems. Acta Microbiol. Sin. 2020, 60, 533–544. [Google Scholar]
  18. Chen, Y.; Li, X.-R.; Zheng, S.; Liu, Z.; Yu, X.-H.; Cheng, Q.-H. Influence of Antecedent Dry Days on Nitrogen Removal in Bioretention Systems. Environ. Sci. 2021, 42, 263–273. [Google Scholar]
  19. Cheng, Q.; Chen, Y.; Liu, Z.; Tang, Y.; Yuan, S. Multi-objective evaluation method of bioretention system based on random forest-projection pursuit method. J. Water Resour. Water Eng. 2022, 33, 85–90+96. [Google Scholar]
  20. Qiu, F.; Wang, K.; Yu, D.; Fu, K. Study on Removal of Pollutants by Zeolite Modified Bioretention System. Environ. Sci. Technol. 2018, 41, 124–129. [Google Scholar]
  21. Duan, X.; Li, J.; Jiang, C. Research Progress on Design of Stormwater Bioretention System. Saf. Environ. Eng. 2022, 29, 111–119. [Google Scholar]
  22. Guo, H.; Zhou, G.; Zhao, Y.; Zhan, L.Q.; Jia, H. Experimental study on soil moisture conservation and nitrogen removal of the modified bioretention facility. Water Wastewater Eng. 2021, 57, 66–71. [Google Scholar]
  23. Han, S.; Qian, D.; Yang, Y.; He, Q.; Lin, Z.; Lu, M. A proportioning method of sand-based fillers for bioretention fillers. Water Wastewater Eng. 2021, 57, 30–36. [Google Scholar]
  24. Huang, Y.; Zhao, W.; Li, W. Study on control Effect of Runoff Pollution in Corridor Bioretention. J. Fudan Univ. (Nat. Sci.) 2020, 59, 761–768. [Google Scholar]
  25. Lei, W.; Huang, Q.; You, C.; Sheng, C.; Zhang, R. Effect simulation and influence research of bioretention in red soil region of southern China. Environ. Eng. 2018, 36, 23–28. [Google Scholar]
  26. Li, Q.; Zhang, W.; Sang, M.; Sun, H.; Huang, M. Review on purification mechanism and performance optimization methods of bioretention for nitrogen and phosphorus in urban stormwater. Environ. Eng. 2020, 38, 77–82+113. [Google Scholar]
  27. Li, J.; Jiang, Y.; Li, X. Response relationship between stormwater runoff pollution reduction and source volume control. China Water Wastewater 2021, 37, 102–109. [Google Scholar]
  28. Li, J.; Sun, M.; Li, X.; Li, J.; Li, Z. Experimental study on thermal pollution control of storwater runoff by bioretention. Water Resour. Prot. 2022, 38, 6–12. Available online: https://kns.cnki.net/kcms/detail/32.1356.tv.20220519.1817.020.html (accessed on 6 July 2023).
  29. Li, L.; Liu, Y.; Yang, J.; Wang, J. Urban runoff phosphorus removal pathways in bioretention systems. Environ. Sci. 2018, 39, 3150–3157. [Google Scholar]
  30. Li, P.; Su, Y.; Jia, Y.; Hao, F. optimization and experimental study on structural parameters of biological cells. J. Drain. Irrig. Mach. Eng. 2022, 40, 611–617. Available online: https://kns.cnki.net/kcms/detail/32.1814.TH.20220606.1321.014.html (accessed on 6 July 2023).
  31. Li, Y.; Zhao, L.; Li, J.; Zhang, Z. Progesses in removal effects and mechanisms of bio-retention systems on pathogenic microorganisms from urban rainfull runoff. J. Water Resour. Water Eng. 2020, 31, 14–22. [Google Scholar]
  32. Li, Y.; Tu, A.; Zhang, H.; Han, X.; Yuan, J.; Zan, Y. Effect of the sand/soil ratio in filling on the environmental hydrological effect of bioretention pool in red soil region. J. Water Resour. Water Eng. 2019, 30, 68–72+80. [Google Scholar]
  33. Liang, X.; Wei, Z.; Shang, G.; Yu, L. Research on the emptying time of biological detention facility in sponge city construction. Water Wastewater Eng. 2018, 54, 26–30. [Google Scholar]
  34. Lin, H.; Wang, J.; Zhao, M.; Sun, B.; Li, J. Study on water quantity and water quality control effect of inverted bioretention technology. Water Resour. Hydropower Eng. 2019, 50, 11–17. [Google Scholar]
  35. Lin, X.; Wang, S.; Li, Q.; Xie, Y. Water quality and three-dimensional fluorescence of stormwater runoff from lined bioretention field cells. Environ. Sci. 2018, 39, 4539–4546. [Google Scholar]
  36. Liu, Z.; Li, J.; Jiang, C.; Chen, M. Comparison of purification effects pf 4 kinds of bioretention fillers on tunoff pollutants. Water Resour. Prot. 2018, 34, 71–79. [Google Scholar]
  37. Ma, J.; Lin, X.; Shi, Z.; He, W.; Chen, S.; Chen, F. Control effect of combined process of biofilter and bioretention ponds on cso pollution. China Water Wastewater 2021, 37, 131–138. [Google Scholar]
  38. Meng, H.; Wang, Y.; Wang, C. Nitrogen and phosphorus leaching characteristics and adsorption properties of hardwood biochar in stormwater runoff. Environ. Sci. 2021, 42, 4332–4340. [Google Scholar]
  39. Meng, K.; Wang, Y.; Wang, C.; Wang, B. Improvement of nitrogen and phosphorus adsorption and stormwater retention capacity by hardwood biochar as an additive material in filler soil. Environ. Sci. 2021, 42, 5876–5883. [Google Scholar]
  40. Mu, Y.; Wang, J.; Zhang, H.; Li, S.; Ge, T.; Liu, J. Study on theplant optimization of biological detention facilities in the north saline soil area. Environ. Sci. Technol. 2020, 43, 111–116. [Google Scholar]
  41. Pan, J.; Liu, Y.; Qu, Y.; Gao, J.; Zhang, X. Removal effect of runoff pollutants by bioretention of composite filler. Yellow River 2020, 42, 93–99. [Google Scholar]
  42. Pan, W.; Luo, L.; Wang, S.; Li, Q.; Wen, L.; Zhou, Y. Seasonal changes in the decontamination effect of the biological retention system with improved filler. Chin. J. Environ. Eng. 2021, 15, 1763–1772. Available online: https://kns.cnki.net/kcms/detail/11.5591.X.20210519.0853.030.html (accessed on 6 July 2023).
  43. Qi, M.; Liu, Q.; Wang, Y. Permeability and denitrification performance of unplanted bioretention cells with long-term operation. Technol. Water Treat. 2021, 47, 29–32. [Google Scholar]
  44. Ran, Y.; Fu, Z.R.; Ma, M.Y.; Wang, Y.; Ye, Q.Y. Effect of amended filler fold-flow bioretention system on nitrogen and phosphorus reduction in rainwater. J. Environ. Eng. Technol. 2022, 12, 1484–1491. [Google Scholar]
  45. Ran, Y.; Fu, Z.; Tang, N.; Ma, M. Enhanced bioretention systems for nutrients removal from rain-runoff. Environ. Sci. Technol. 2021, 44, 49–57. [Google Scholar]
  46. Ran, Y.; Fu, Z.; Tang, N.; Ma, M. Adsorption characteristics and mechanism of hydroxy aluminum vermiculite sludge on phosphorus in rainwater. Environ. Sci. Technol. 2021, 44, 113–120. [Google Scholar]
  47. Shi, L.; Yang, X.; Wu, Q.; Xu, J. Combination of ecological ditch and bioretention pod to control tural runoff pollution. Environ. Sci. 2022, 43, 3160–3167. [Google Scholar]
  48. Tang, Y.; Chen, Y.; Yuan, S.; Zhu, J.; Liu, Z. The effect of the modified soil media on the performance of the bioretention system. China Rural Water Hydropower 2022, 9, 31–37. Available online: https://kns.cnki.net/kcms/detail/42.1419.TV.20211020.0919.018.html (accessed on 6 July 2023).
  49. Tian, J.; Liu, D. Effects of biochar on hydrologic performance of bioretention. J. Southwest Jiaotong Univ. 2018, 53, 420–426. Available online: https://kns.cnki.net/kcms/detail/51.1277.U.20180413.1542.006.html (accessed on 6 July 2023).
  50. Tu, G.; Li, Y.; Mo, M.; Nie, X. Hydrological effects of design parameters optimization of bioretention facility based on RECARGA Model. J. Soil Water Conserv. 2020, 34, 149–153. [Google Scholar]
  51. Wang, C.; Li, F.; Han, Z.; Zhua, J.; Ynag, J.; Liu, Z.; Qu, W. The effect of bioretention systems on stormwater runoff of Shijiazhuang. J. Irrig. Drain. 2022, 41, 87–94+105. [Google Scholar]
  52. Wang, H.; Zhao, F.; Li, J. Effects of plants on long-term nitrogen removal function of bioretention system in loess distribution area. Water Sav. Irrig. 2022, 12, 94–99. Available online: https://kns.cnki.net/kcms/detail/42.1420.tv.20220916.1915.002.html (accessed on 6 July 2023).
  53. Wang, J.; Sun, Y.; Zhang, H.; Ge, T.; Mu, Y.; Li, S.; Liu, J. Optimization of bioretention facility filler based on runoff pollution control. China Water Wastewater 2020, 36, 110–116. [Google Scholar]
  54. Wang, Q.; Chen, T.; Qiu, N. Effects of carbon sources and their amounts on bioretention. Appl. Chem. Ind. 2021, 50, 2057–2061. [Google Scholar]
  55. Wang, W.; Liu, Z.; Chen, Y.; Feng, L.; Chen, R.; Zheng, X. Dual-mode greywatet-stormwater bioretention:The impact of cellulose soild-state carbon sources on treatment performance. China Rural Water Hydropower 2022, 9, 75–82. Available online: https://kns.cnki.net/kcms/detail/42.1419.TV.20220121.0838.002.html (accessed on 6 July 2023).
  56. Wang, Y.; Chen, T.; Li, J. Permeability characteristics test on wastewater in unplanted bioretention cell under continuous operation. Environ. Eng. 2022, 40, 27–31+51. [Google Scholar]
  57. Wang, Y.; Geng, C.; Xu, Y.; Xi, M.; Wang, J. Effect of different enhanced methods on efficiency of denitrification and phosphorus removal in bioretention cell. China Water Wastewater 2020, 36, 77–82. [Google Scholar]
  58. Wu, Q.; Tang, Y.; Chen, Y.; Liu, Z.; Yuan, S. Effect of climatic Variables and design parameters on nitrate removal of bioretention system. China Environ. Sci. 2022, 43, 2328–2340. [Google Scholar]
  59. Xiong, J.; He, Y.; Bai, X.; Wang, X. Removal effect of phosphorus in rain-runoff by the media-improved bioretention tank. Chin. J. Environ. Eng. 2019, 13, 2164–2172. Available online: https://kns.cnki.net/kcms/detail/11.5591.x.20190821.0927.014.html (accessed on 6 July 2023).
  60. Xu, Y.; Xi, M.; Geng, C.; Xu, L.; Liu, Z.; Fu, D.; Wang, Y. Removals of typical antibitics in sewage by unplanted bioretention cells:efficiency and its enhancement. J. Southeast Univ. (Nat. Sci. Ed.) 2020, 50, 748–759. [Google Scholar]
  61. Yang, Q.; Yang, Q.; Tang, X.; Yao, Y.; Yao, J. Influence of Biologic Retention Zone Structure on Its Infiltration-Storage. J. Southwest Jiaotong Univ. 2020, 55, 804–810. Available online: https://kns.cnki.net/kcms/detail/51.1277.U.20190403.1029.006.html (accessed on 6 July 2023).
  62. Yang, X.; Wang, S.; Hu, C.; Li, Q.; Ran, X.; Wen, L. Comparative study of nitrogen and phosphorus removal efficiency by two bioretention systems. Acta Sci. Circumstantiae 2021, 41, 2162–2168. [Google Scholar]
  63. Zhang, J.; Song, M.; Gao, X.; Geng, X. Effect of biochar filling mode and aging on leaching of nitrogen and phosphorus in bioretention facilities. China Water Wastewater 2020, 36, 100–106. [Google Scholar]
  64. Zhang, R.; Pan, Z.; Xi, D.; Zhou, N.; Zu, B. Effect of aluminum sludge filler improved bioretention tank on runoff pollutant reduction. J. Environ. Eng. Technol. 2021, 11, 756–762. [Google Scholar]
  65. Zhang, S.; Li, J.; Li, X.; Sun, Y. Reduction effect of bioretention on urban stormwater runoff thermal pollution. China Water Wastewater 2021, 37, 116–120. [Google Scholar]
  66. Zhang, Z.; Wang, Q.; Li, Y.; Chen, T. Removal of pollutants by adding fermented wood chips in bioretention system. Environ. Sci. Technol. 2022, 45, 74–79. [Google Scholar]
  67. Zhao, F.; Wang, H.; Li, J.; Xue, T.; Yao, Y. Removal effect of nitrogen in rain-runoff by loess media improved bioretention system. Water Resour. Power 2022, 40, 74–78. [Google Scholar]
  68. Chen, R.; Song, J.; Xu, M.; Wang, X.; Yin, Z.; Liu, T.; Luo, N. Prediction of the corrosion depth of oil well cement corroded by carbon dioxide using GA-BP neural network. Constr. Build. Mater. 2023, 394, 132127. [Google Scholar] [CrossRef]
  69. Jiao, L.; Wang, L.; Lu, H.; Fan, Y.; Zhang, Y.; Wu, Y. An assessment model for urban resilience based on the pressure-state-response framework and BP-GA neural network. Urban Clim. 2023, 49, 101543. [Google Scholar] [CrossRef]
  70. Zou, M.; Xue, L.; Gai, H.; Dang, Z.; Wang, S.; Xu, P. Identification of the shear parameters for lunar regolith based on a GA-BP neural network. J. Terramechanics 2020, 89, 21–29. [Google Scholar] [CrossRef]
  71. Wang, H.; Li, J.; Liu, L. Process optimization and weld forming control based on GA-BP algorithm for riveting-welding hybrid bonding between magnesium and CFRP. J. Manuf. Process. 2021, 70, 97–107. [Google Scholar] [CrossRef]
  72. Wang, Z.; Fei, Y.; Ye, P.; Qiu, F.; Tian, G.; Woo, W.L. Crack characterization in ferromagnetic steels by pulsed eddy current technique based on GA-BP neural network model. J. Magn. Magn. Mater. 2020, 500, 166412. [Google Scholar] [CrossRef]
  73. Cao, H.; Liu, L.; Wu, B.; Gao, Y.; Qu, D. Process optimization of high-speed dry milling UD-CF/PEEK laminates using GA-BP neural network. Compos. Part B Eng. 2021, 221, 109034. [Google Scholar] [CrossRef]
  74. Forcino, F.L.; Ritterbush, K.A.; Stafford, E.S. Evaluating the effectiveness of the Mantel test and Procrustes randomization test for exploratory ecological similarity among paleocommunities. Palaeogeogr. Palaeoclimatol. Palaeoecol. 2015, 426, 199–208. [Google Scholar] [CrossRef]
  75. Legendre, P.; Gallagher, E.D. Ecologically meaningful transformations for ordination of species data. Oecologia 2001, 129, 271–280. [Google Scholar] [CrossRef] [PubMed]
  76. Park, M.; Kim, J.; Lee, T.; Oh, Y.-K.; Nguyen, V.K.; Cho, S. Correlation of microbial community with salinity and nitrogen removal in an anammox-based denitrification system. Chemosphere 2021, 263, 128340. [Google Scholar] [CrossRef]
  77. Tripathee, L.; Kang, S.; Chen, P.; Bhattarai, H.; Guo, J.; Shrestha, K.L.; Sharma, C.M.; Ghimire, P.S.; Huang, J. Water-soluble organic and inorganic nitrogen in ambient aerosols over the Himalayan middle hills: Seasonality, sources, and transport pathways. Atmos. Res. 2021, 250, 105376. [Google Scholar] [CrossRef]
  78. Matsumoto, K.; Ogawa, T.; Ishikawa, M.; Hirai, A.; Watanabe, Y.; Nakano, T. Organic and inorganic nitrogen deposition on the red pine forests at the northern foot of Mt. Fuji, Japan. Atmos. Environ. 2020, 237, 117676. [Google Scholar] [CrossRef]
  79. Shetye, S.S.; Kurian, S.; Naik, H.; Gauns, M.; Chndrasekhararao, A.V.; Kumar, A.; Naik, B. Variability of organic nitrogen and its role in regulating phytoplankton in the eastern Arabian Sea. Mar. Pollut. Bull. 2019, 141, 550–560. [Google Scholar] [CrossRef]
  80. Tunçsiper, B. Nitrogen removal in an aerobic gravel filtration-sedimentation pond-constructed wetland-overland flow system treating polluted stream waters: Effects of operation parameters. Sci. Total Environ. 2020, 746, 140577. [Google Scholar] [CrossRef]
  81. Anggo Krisbiantoro, P.; Togawa, T.; Mahardiani, L.; Aihara, H.; Otomo, R.; Kamiya, Y. The role of cobalt oxide or magnesium oxide in ozonation of ammonia nitrogen in water. Appl. Catal. A Gen. 2020, 596, 117515. [Google Scholar] [CrossRef]
  82. Maslov, M.N.; Maslova, O.A. Temperate peatlands use-management effects on seasonal patterns of soil microbial activity and nitrogen availability. Catena 2020, 190, 104548. [Google Scholar] [CrossRef]
  83. Nagappan, S.; Devendran, S.; Tsai, P.-C.; Jayaraman, H.; Alagarsamy, V.; Pugazhendhi, A.; Ponnusamy, V.K. Metabolomics integrated with transcriptomics and proteomics: Evaluation of systems reaction to nitrogen deficiency stress in microalgae. Process Biochem. 2020, 91, 1–14. [Google Scholar] [CrossRef]
  84. Fan, G.; Li, Z.; Wang, S.; Huang, K.; Luo, J. Migration and transformation of nitrogen in bioretention system during rainfall runoff. Chemosphere 2019, 232, 54–62. [Google Scholar] [CrossRef]
  85. Zhang, Z.; Hu, B.; Li, J.; Wang, W.; Wang, S. Influence of spatial variation in daily rainfall on volume capture of rainfall by source control facilities in China. Adv. Water Sci. 2018, 29, 465–472. [Google Scholar]
  86. Winston, R.J.; Dorsey, J.D.; Hunt, W.F. Quantifying volume reduction and peak flow mitigation for three bioretention cells in clay soils in northeast Ohio. Sci. Total Environ. 2016, 553, 83–95. [Google Scholar] [CrossRef]
  87. Søberg, L.C.; Viklander, M.; Blecken, G.-T.; Hedström, A. Reduction of Escherichia coli, Enterococcus faecalis and Pseudomonas aeruginosa in stormwater bioretention: Effect of drying, temperature and submerged zone. J. Hydrol. X 2019, 3, 100025. [Google Scholar] [CrossRef]
  88. Tedoldi, D.; Chebbo, G.; Pierlot, D.; Branchu, P.; Kovacs, Y.; Gromaire, M.-C. Spatial distribution of heavy metals in the surface soil of source-control stormwater infiltration devices—Inter-site comparison. Sci. Total Environ. 2017, 579, 881–892. [Google Scholar] [CrossRef]
  89. Rippy, M.A.; Krauss, L.; Pierce, G.; Winfrey, B. Plant functional traits and viewer characteristics co-regulate cultural services provisioning by stormwater bioretention. Ecol. Eng. 2021, 168, 106284. [Google Scholar] [CrossRef]
  90. Tirpak, R.A.; Hathaway, J.M.; Franklin, J.A. Investigating the hydrologic and water quality performance of trees in bioretention mesocosms. J. Hydrol. 2019, 576, 65–71. [Google Scholar] [CrossRef]
  91. Voisin, J.; Cournoyer, B.; Vienney, A.; Mermillod-Blondin, F. Aquifer recharge with stormwater runoff in urban areas: Influence of vadose zone thickness on nutrient and bacterial transfers from the surface of infiltration basins to groundwater. Sci. Total Environ. 2018, 637–638, 1496–1507. [Google Scholar] [CrossRef] [PubMed]
Figure 1. Data distribution of sponge city construction pilot cities and study areas in China.
Sustainability 15 10990 g001
Figure 2. Diagram of biological retention tank installation.
Sustainability 15 10990 g002
Figure 3. GA-BP neural network algorithm flow.
Sustainability 15 10990 g003
Figure 4. Ammonia removal rate was determined by Mantel test and Pearson correlation matrix.
Sustainability 15 10990 g004
Figure 5. RDA analysis results. Note: (a) shows the spatial distribution of data samples in four quadrants and (b) shows the correlation coefficient of each index.
Sustainability 15 10990 g005
Figure 6. Neural network training results. Note: (a) is ammonia nitrogen and (b) is nitrate nitrogen; Training, Validation, Test, and All represent the regression analysis results of each group’s data, respectively. R is the regression coefficient; Fit is the result of linear fitting; Y is the linear fitting result in an ideal state; and Output is the output result of the simulation function.
Sustainability 15 10990 g006
Figure 7. Prediction results of removal of typical pollutants in blank area.
Sustainability 15 10990 g007
Table 1. Biological retention tank model index system.
SubsystemIndex LayerNoUnit
Environmental FactorRainfallX1mm
Water inflowX2L
Rainfall durationX3min
Water intake intervalX4d
NH4+-N influent concentrationX5mg/L
NO3-N influent concentrationX6mg/L
Filler TypeRatio of strong permeable soil *X7%
Proportion of weakly permeable soil *X8%
Biochar ratio *X9%
Organic filler ratio *X10%
Iron base ratio *X11%
Mineral filler ratio *X12%
Design ParameterDrainage depthX13mm
Aquifer depthX14mm
Packing depthX15mm
Response VariableNH4+-N removal rateX16mm
NO3-N removal rateX17mm
Table 2. Biological detention facilities’ index planning parameters.
SuiningNanningJiaozuoUnit
Design ValueRainfall17.233.425.2mm
Water inflow10.64012L
Rainfall duration18012060min
water intake interval333d
NH4+-N influent concentration546mg/L
NO3-N influent concentration376mg/L
Ratio of strong permeable soil 655530%
Proportion of weakly permeable soil 202055%
Biochar ratio 005%
Organic filler ratio 10510%
Iron base ratio 0200%
Mineral filler ratio 500%
Drainage depth250150150mm
Aquifer depth175225150mm
Packing depth800850600mm
Target ValueNH4+-N removal rate818285mm
NO3-N removal rate758085mm
Disclaimer/Publisher’s Note: The statements, opinions and data contained in all publications are solely those of the individual author(s) and contributor(s) and not of MDPI and/or the editor(s). MDPI and/or the editor(s) disclaim responsibility for any injury to people or property resulting from any ideas, methods, instructions or products referred to in the content.

