Article

Beijing Heavy-Duty Diesel Vehicle Battery Capacity Conversion and Emission Estimation in 2022

1
School of Environmental Science and Safety Engineering, Tianjin University of Technology, Tianjin 300384, China
2
China Automotive Technology and Research Center Co., Ltd., Tianjin 300300, China
3
Beijing Municipal Ecological and Environmental Monitoring Center, Beijing 100048, China
4
Hefei Institutes of Physical Science, Chinese Academy of Sciences, Hefei 230031, China
*
Author to whom correspondence should be addressed.
These authors contributed equally to this work.
Sustainability 2023, 15(14), 11019; https://doi.org/10.3390/su151411019
Submission received: 8 June 2023 / Revised: 30 June 2023 / Accepted: 12 July 2023 / Published: 14 July 2023
(This article belongs to the Section Sustainable Transportation)

Abstract

:
Road transport is a scenario for the use of fossil fuels to a large extent, and the process of electrification can slow down this use of fossil fuels. This study analyzes the annual emissions of nitrogen oxides (NOX) and carbon dioxide (CO2) from heavy-duty diesel vehicles (HDDVs) and the feasibility of electrification in Beijing based on the on-board diagnostics (OBD) of remote monitoring data from more than 9000 HDDVs. The annual NOX and CO2 emissions of 13 industry types were 44,980.9 and 6,658,722.6 tons in 2022. The highest contributor to these NOX and CO2 emissions was concrete trucks, accounting for 27.1% and 17.0% of the 13 industry type vehicles. The electrification of concrete trucks can greatly reduce the diesel emissions in Pinggu and other districts and realize regional emission reduction management. The CO2 emission factor of passenger buses in the Pinggu district was significantly higher than that in other districts, which was 1212.4 g/km, and the electrification of passenger buses could significantly reduce the CO2 emissions in the Pinggu district. This study investigates HDDVs in Beijing, provides a scientific basis for the electrification management of key models in Beijing, and provides a regional reference for the electrification trend of HDDVs in various countries worldwide.

Graphical Abstract

1. Introduction

With the continuous improvement in China’s per capita income, the penetration rate of motor vehicles in China is close to the level of that in developed countries. At the same time, with the vigorous development of the motor vehicle industry, motor vehicle exhaust emissions have increased, increasing the number of smog days and aggravating air pollution. “In 2020, the nitrogen oxides (NOx) emissions of diesel in China were 5.449 million tons, accounting for 88.8% of the total vehicle emissions” [1]. Carbon dioxide (CO2) is the main greenhouse gas (GHG) that contributes to global warming, with severe impacts on climate, people, and ecosystems around the world [2]. Degraeuwe et al. [3] and Tong et al. [4] reported that motor vehicle emissions played an important role in the accumulation of local pollution, which has been proven to be one of the main factors causing urban air pollution. These pollutants have adverse effects on the environment and human health. With the booming transportation industry, the CO2 emissions from the excessive use of multiple energy sources by the transportation industry have exacerbated the Earth’s greenhouse effect [5]. As a human activity, transportation has the most significant impact on the increase in GHG emissions [6]. Reducing the NOX and CO2 emissions of heavy-duty diesel vehicles (HDDVs) is considered to be one of the most important steps in improving the air quality in many urban areas. The power source for the electrification of diesel vehicles relies on Beijing increasing the transfer of green power from overseas ports and deepening its energy cooperation with Inner Mongolia, Shanxi, Zhangjiakou [7], and other surrounding areas. Therefore, the electrification of diesel vehicles in Beijing is an effective way of reducing regional pollutant emissions. In this study, we will not only analyze HDDVs’ emission levels of NOX and CO2 in Beijing, but also study the trend of electrification and analyze its advantages in combination with emissions.
To estimate the annual emissions of HDDVs in a region, most studies are based on questionnaires [8,9] or a small amount of OBD data [10] estimates of annual activity levels. However, in our actual monitoring of 9000 vehicles, we found that some HDDVs were suspected of severe tampering, which made the actual emission data much larger than the value we estimated based on a small amount of data combined with theoretical experience. This study bridges the problem of small theoretical emission values caused by actual human tampering [11] that should have been addressed in previous studies. The results are close to the actual vehicle activity level and emission level. It is worth mentioning that this study obtained the population of HDDVs in various regions of Beijing through the actual research of the institute, which is not available in the database published by government departments and previous studies. The data from this study make the annual NOx and CO2 emissions of 13 industry types of HDDVs in Beijing in 2022 closest to the actual emissions.
In order to reduce the exhaust emissions of HDDVs, the country has considered measures such as using stricter diesel and setting stricter vehicle emission standards. However, the transition to electrification is the most direct way of eliminating these exhaust emissions during vehicle use. Electric vehicles (EVs) are inherently zero-emission when running. “Many see it as the most promising solution to reduce emissions from all models in the future” [12]. “Europe has just released a revised proposal to the 100% zero-emission target for urban buses by 2030” [13]. Yang et al. [14] investigated the CO2 and NOx emission trends in the UK trucking industry after the internal combustion engine (ICE) phase-out in 2030, and the results showed that, in all cases, trucks were on track to reach net zero emissions by 2050, and the rate of NOx reduction was even faster. “California issued an executive order enacting legislation requiring all passenger car sales to be zero-emission vehicles, trailer trucks to be zero-emission vehicles by 2035, and, where feasible, transition its fleet of medium and heavy-duty vehicles to 100% zero-emission vehicles by 2045” [15]. In recent years, China has been working to reduce its vehicle emissions, and the study found that the effect of vehicle electrification was the obvious. Zhang et al. [16] showed that the economic and environmental benefits of electric taxis are significantly better than fuel taxis, verifying that the electrification of fuel taxis is a more environmentally friendly and economically feasible measure. China is considering implementing similar regulations to accelerate its domestic electrification. However, the vast cost of EVs limits this electrification process, especially during the transportation of HDDVs.
Research on vehicle electrification is prevalent at home and abroad. These studies have focused on using models to assess the energy consumption of EVs [17]. Alternatively, they have estimated the energy consumption of EVs by using a chassis dynamometer for individual vehicles [18]. Ma et al. [19] used high-resolution GPS and intelligent card transaction data to calculate the energy consumption of diesel buses (DB) and electric buses. Xu et al. [20] studied the “economic value of Beijing’s bus transition from fossil fuel-powered buses to battery-electric buses from the perspective of carbon asset theory.” The analysis of the electrification of HDDVs was mainly calculated in terms of energy consumption or carbon emission reduction [21,22]. Although energy consumption can judge the feasibility of electrification from a particular perspective, in actual scenarios, it is still necessary to combine the absolute activity level of different transportation industries in different regions to analyze it comprehensively. This analysis requires a large amount of data to be completed. There is no doubt that the work in this study is complex and novel.
This study analyzes the annual emissions of heavy-duty diesel vehicles (HDDVs) and the feasibility of electrification in Beijing based on the on-board diagnostics (OBD) of remote monitoring data from more than 9000 HDDVs. The analysis of this study is not limited to theoretical calculations, but is closer to the level of actual and implementable policy management recommendations. Therefore, this study investigates HDDVs in Beijing, which provides a scientific basis for the electrification management of critical models in Beijing, and can also provide a regional reference for the electrification trend of HDDVs in various countries worldwide.

2. Materials and Methods

2.1. Test the Equipment

OBD remote monitoring comprises a vehicle’s own OBD system, OBD decoder, and remote monitoring platform. When the engine of the monitoring vehicle is started, before the vehicle is driving, the vehicle terminal should read the OBD diagnostic information of the vehicle according to the following table, including the OBD diagnostic protocol, malfunction indicator lamp (MIL) status, diagnostic support status, diagnostic readiness status, vehicle identification code, calibration identification code, calibration verification code, in-use performance ratio (IUPR) value, total number of fault codes, and fault code information list. The vehicle-mounted terminal collects data related to engine emissions. The data required for this study and the frequency of the acquisition are shown in Table 1.
HDDVs are equipped with vehicle-mounted terminals and are connected to the OBD port of the OBD system to obtain the vehicle and engine operation data, including the inlet air flow, instantaneous NOx concentration, accumulated mileage, and other data, and these vehicle terminals collect these vehicle data according to a 1 Hz frequency. The sample vehicles selected for the analysis are equipped with vehicle terminals following the technical requirements of Beijing’s local standard, DB11/1475-2017 [23].
The vehicle-mounted terminal of the vehicle configuration collects the NOx concentration and other monitoring data based on sensor monitoring using the electronic control unit (ECU) [24], which can realize the real-time monitoring and analysis of the critical parameters of the vehicle emissions and operation. A Telematics-box (T-Box) is installed on the vehicle before it leaves the factory, is connected to the vehicle’s controller area network (CAN), and collects the corresponding data information on the CAN. The T-BOX will collect the collected data information into data packets according to the requirements of the data protocol, and use the built-in 4G module of the T-BOX to send it to the corresponding data-receiving platform according to the specified IP address through the 4G network.

2.2. Test Vehicle

Heavy-duty vehicles refer to M- and N-class cars with a maximum total mass more than 3500 kg [25]. Thirteen HDDV industry types were selected as the objects of this study, and their specific information is shown in Table 2. In this study, 9460 HDDVs were collected from the OBD data, including 3351 National-V HDDVs and 6109 National-VI HDDVs.

2.3. Calculation Formula

2.3.1. NOx and CO2 Emission

HDDVs currently monitor the real-time contaminant of NOx, and the NOx volume concentration value can be obtained using the NOx sensor. The NOx emission mass can be calculated by combining the air density and exhaust gas flow at that time. The volume of the expansion of the exhaust gas changes when heated, but the volume expansion of the NOx gas and air does not change, so its volume concentration does not change, and it can be directly converted using the air density in the standard state. The formula used to calculate the mass of NOx emissions is as follows:
m N O x = m a i r + m f u e l × u × C N O x
where   m N O x is the NOx mass (kg/L); m a i r is the air mass flow rate (kg/h), m f u e l is the fuel mass flow rate (kg/h), and u is the NOx molecular weight/air molecular weight in the normal state, because the main NOx is NO, which can reach more than 90% [26]). The NO molecular weight directly replaces the NOx molecular weight, being 30.01, the air molecular weight generally takes the value of 28.959, and the value of u is 1.04. C N O x is the downstream concentration value of the nitrogen and oxygen transmitted by the SCR sensor and the unit is ppm.
E C O 2 = η × m f u e l × ρ × 1000 3600
E C O 2 is the instantaneous CO2 mass emission rate (g/s), η is the coefficient for converting diesel into CO2 per unit mass of complete combustion of diesel engines, with a value of 3.1863, mfuel is the fuel volume flow (L/h), and ρ is the diesel density (kg/L).

2.3.2. Battery Capacities Conversion

The formula for the conversion of the corresponding capacity required to replace HDDVs with batteries is as follows:
E = V i ¯ × ρ × 1000 k
where E is the required capacity of the battery (kWh), Vi is the average daily fuel consumption (L), ρ is the density of the diesel fuel (kg/L), taking the value of 830, and k is the average daily fuel consumption factor (g/kWh), calculated by randomly selecting 10 vehicles of 13 industry types (Table 2). Its calculation method is that the diesel engine uses a fuel consumption meter on the dynamometer to measure the fuel consumption. The dynamometer can measure the instantaneous power of the engine in kW. The fuel consumption meter can measure the instantaneous mass fuel consumption of the engine in g/s.

2.3.3. Emission Estimates

The improved calculation method is based on the Technical Guide for the Preparation of Road Motor Vehicle Emission Inventories [27] to estimate the annual exhaust emissions of NOx or CO2 in HDDVs across 13 industry types. The formula used to calculate the annual exhaust emissions of NOx or CO2 emissions is as follows:
E i = P i × E F i × V K T × 10 6
where Ei is the NOx or CO2 annual emissions (ton) (I = 1,2,…,13) corresponding to HDDVs of 13 industry types, Pi is the population of HDDVs across 13 industry types, EFi is the emission factors of NOx or CO2 with HDDVs of 13 industry types (g/km) (I = 1,2,…,13), and VKT is the annual average mileage (km) of HDDVs of 13 industry types.

3. Results

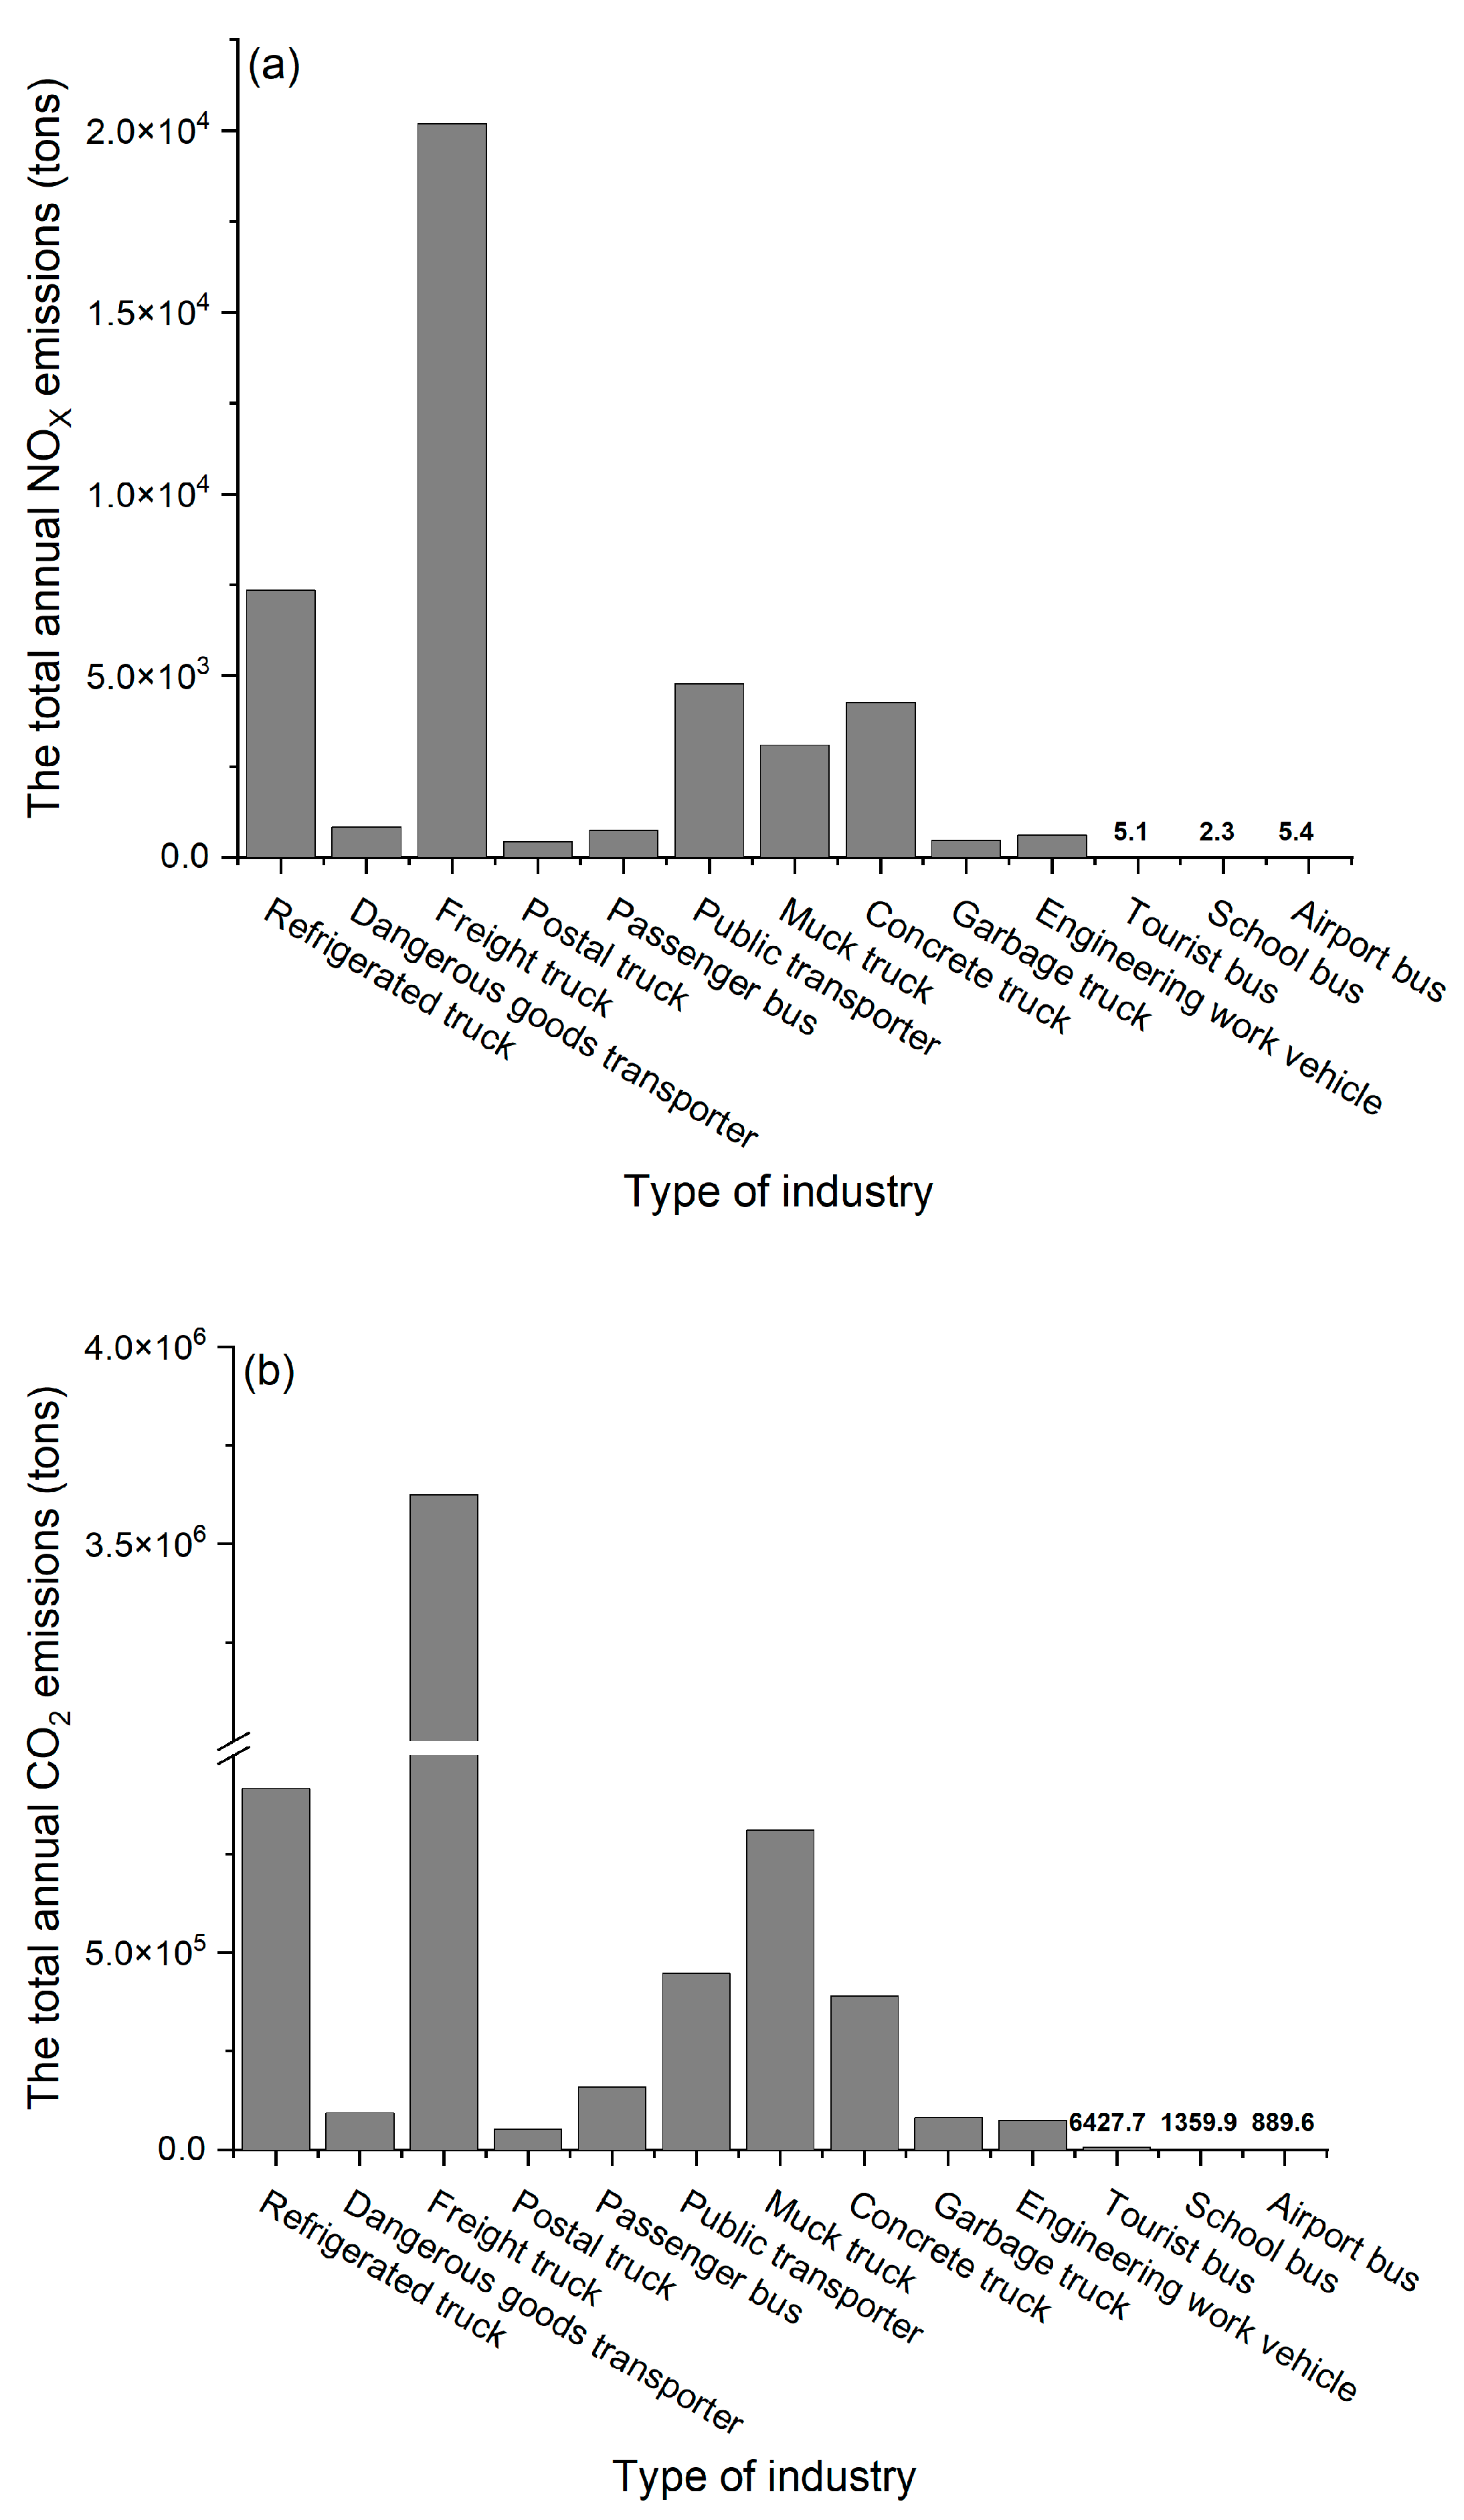
3.1. NOX and CO2 Annual Emissions
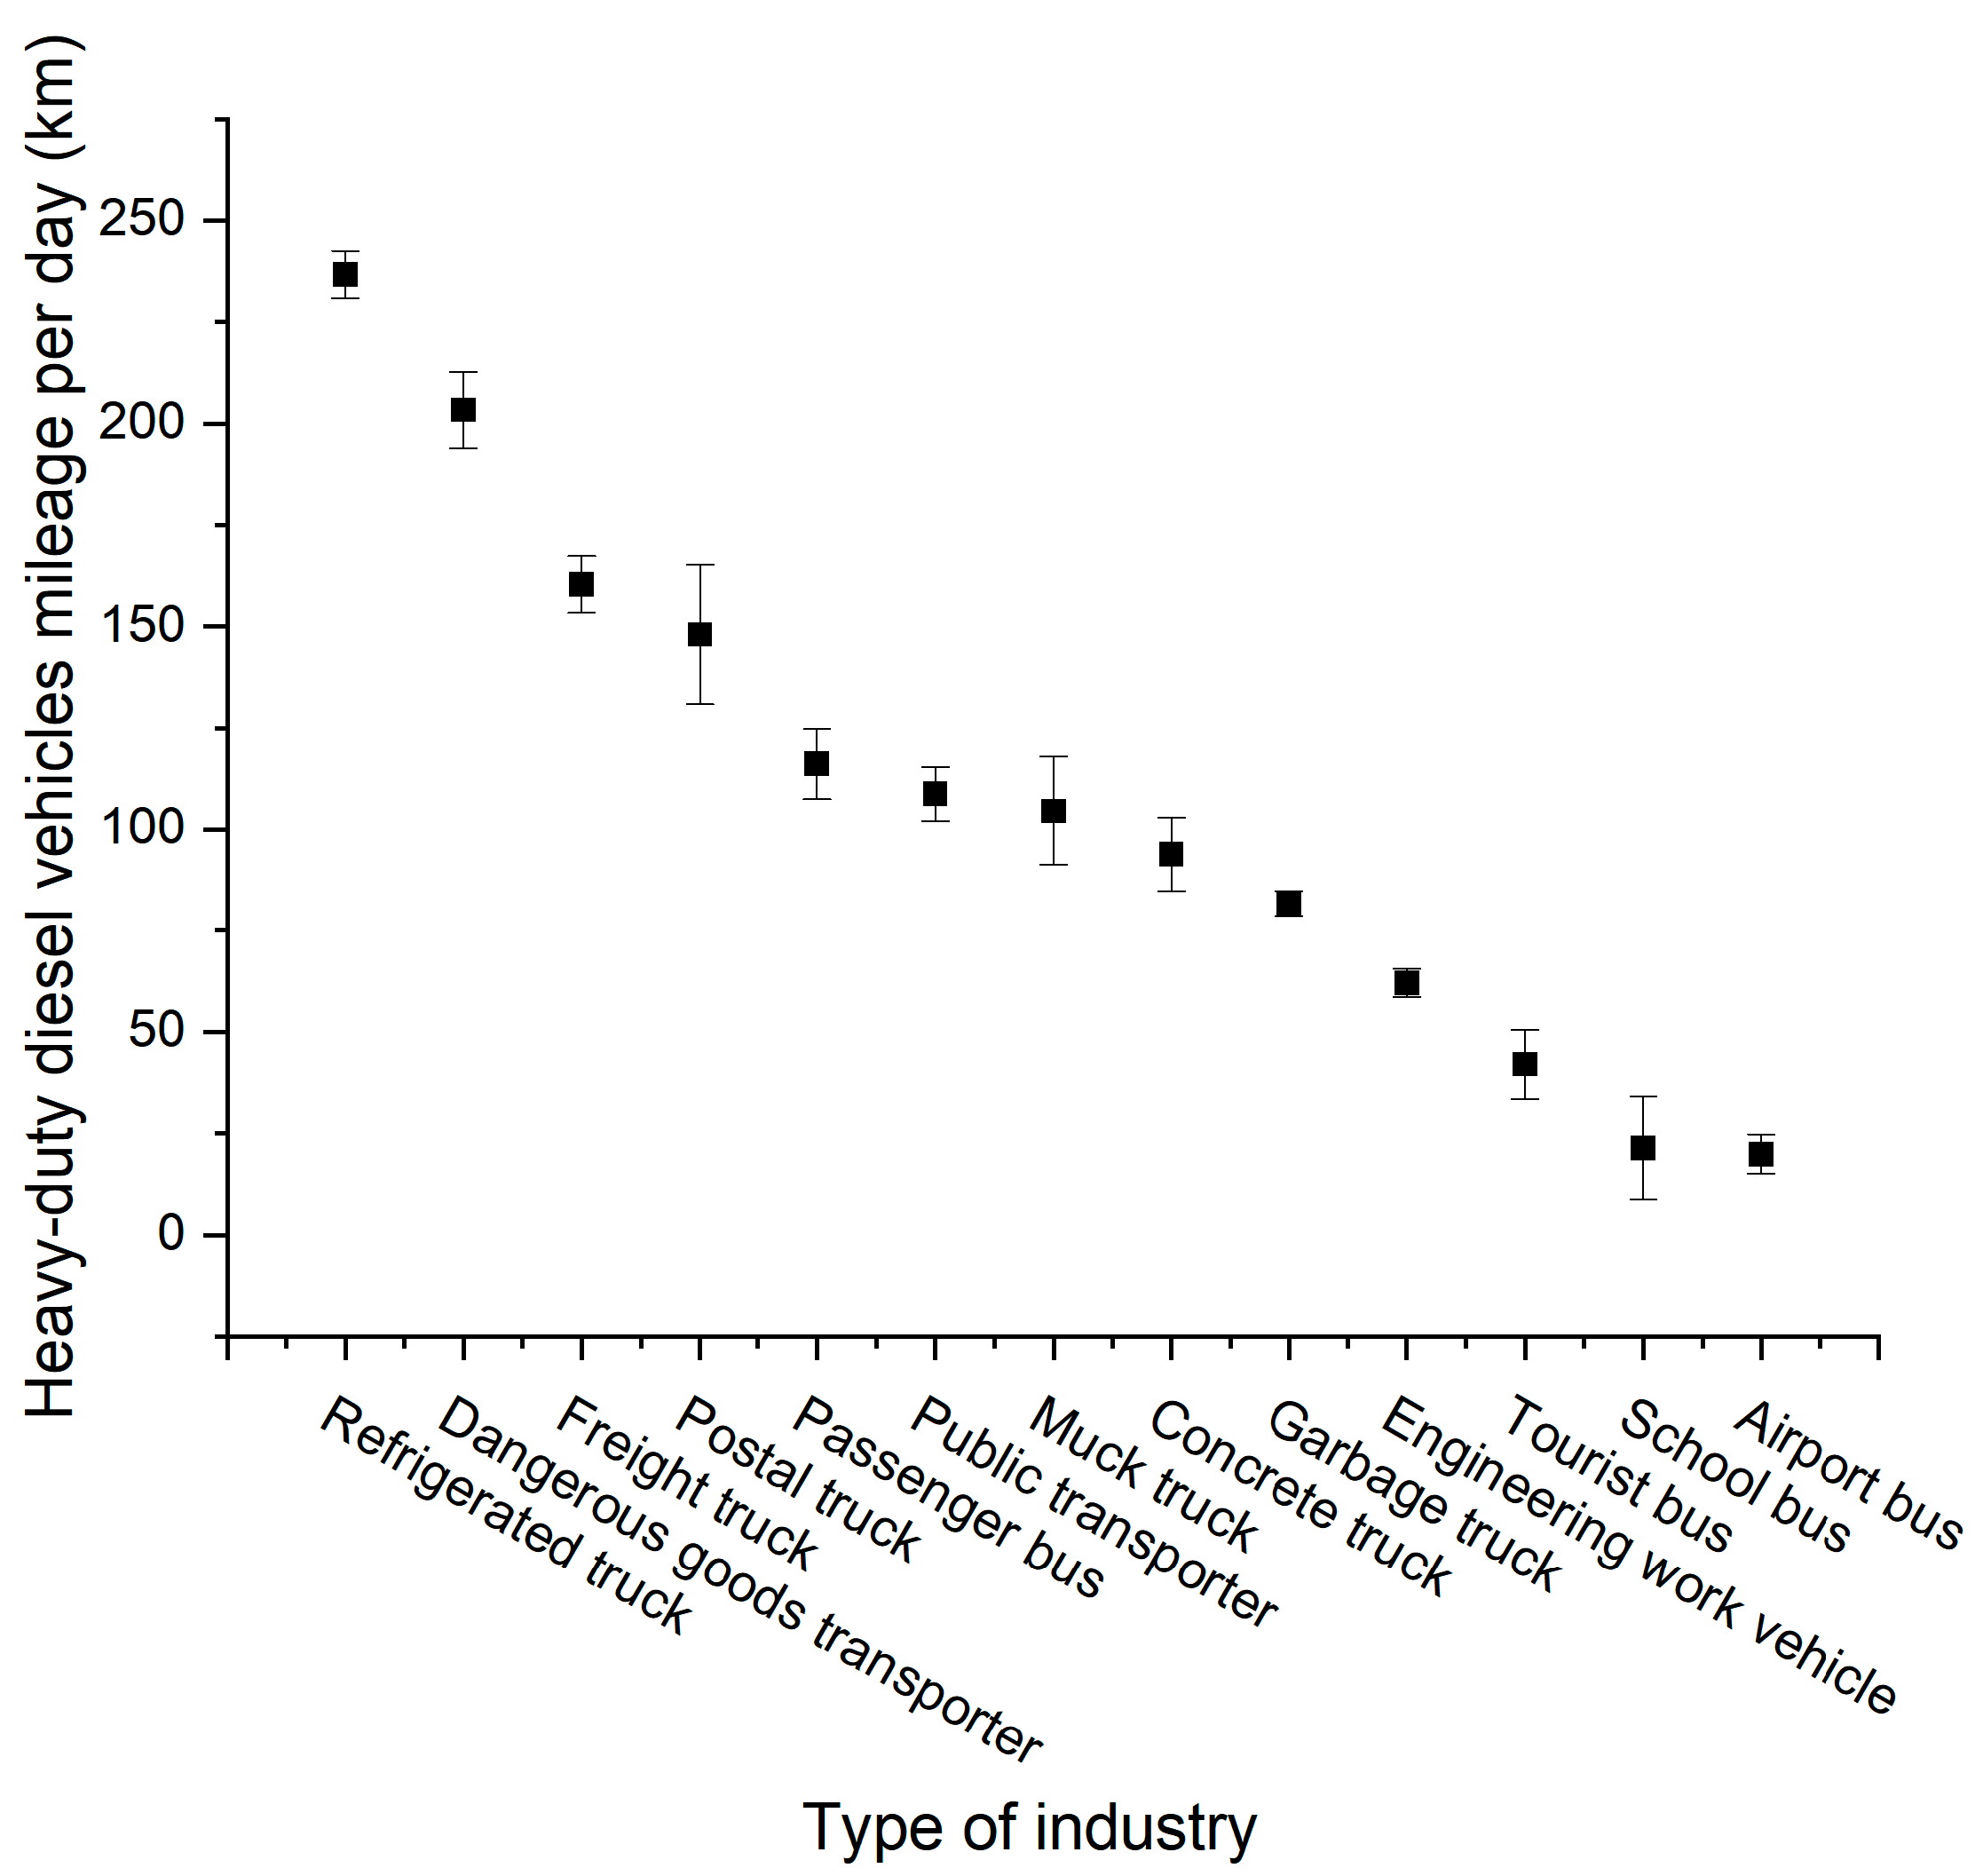
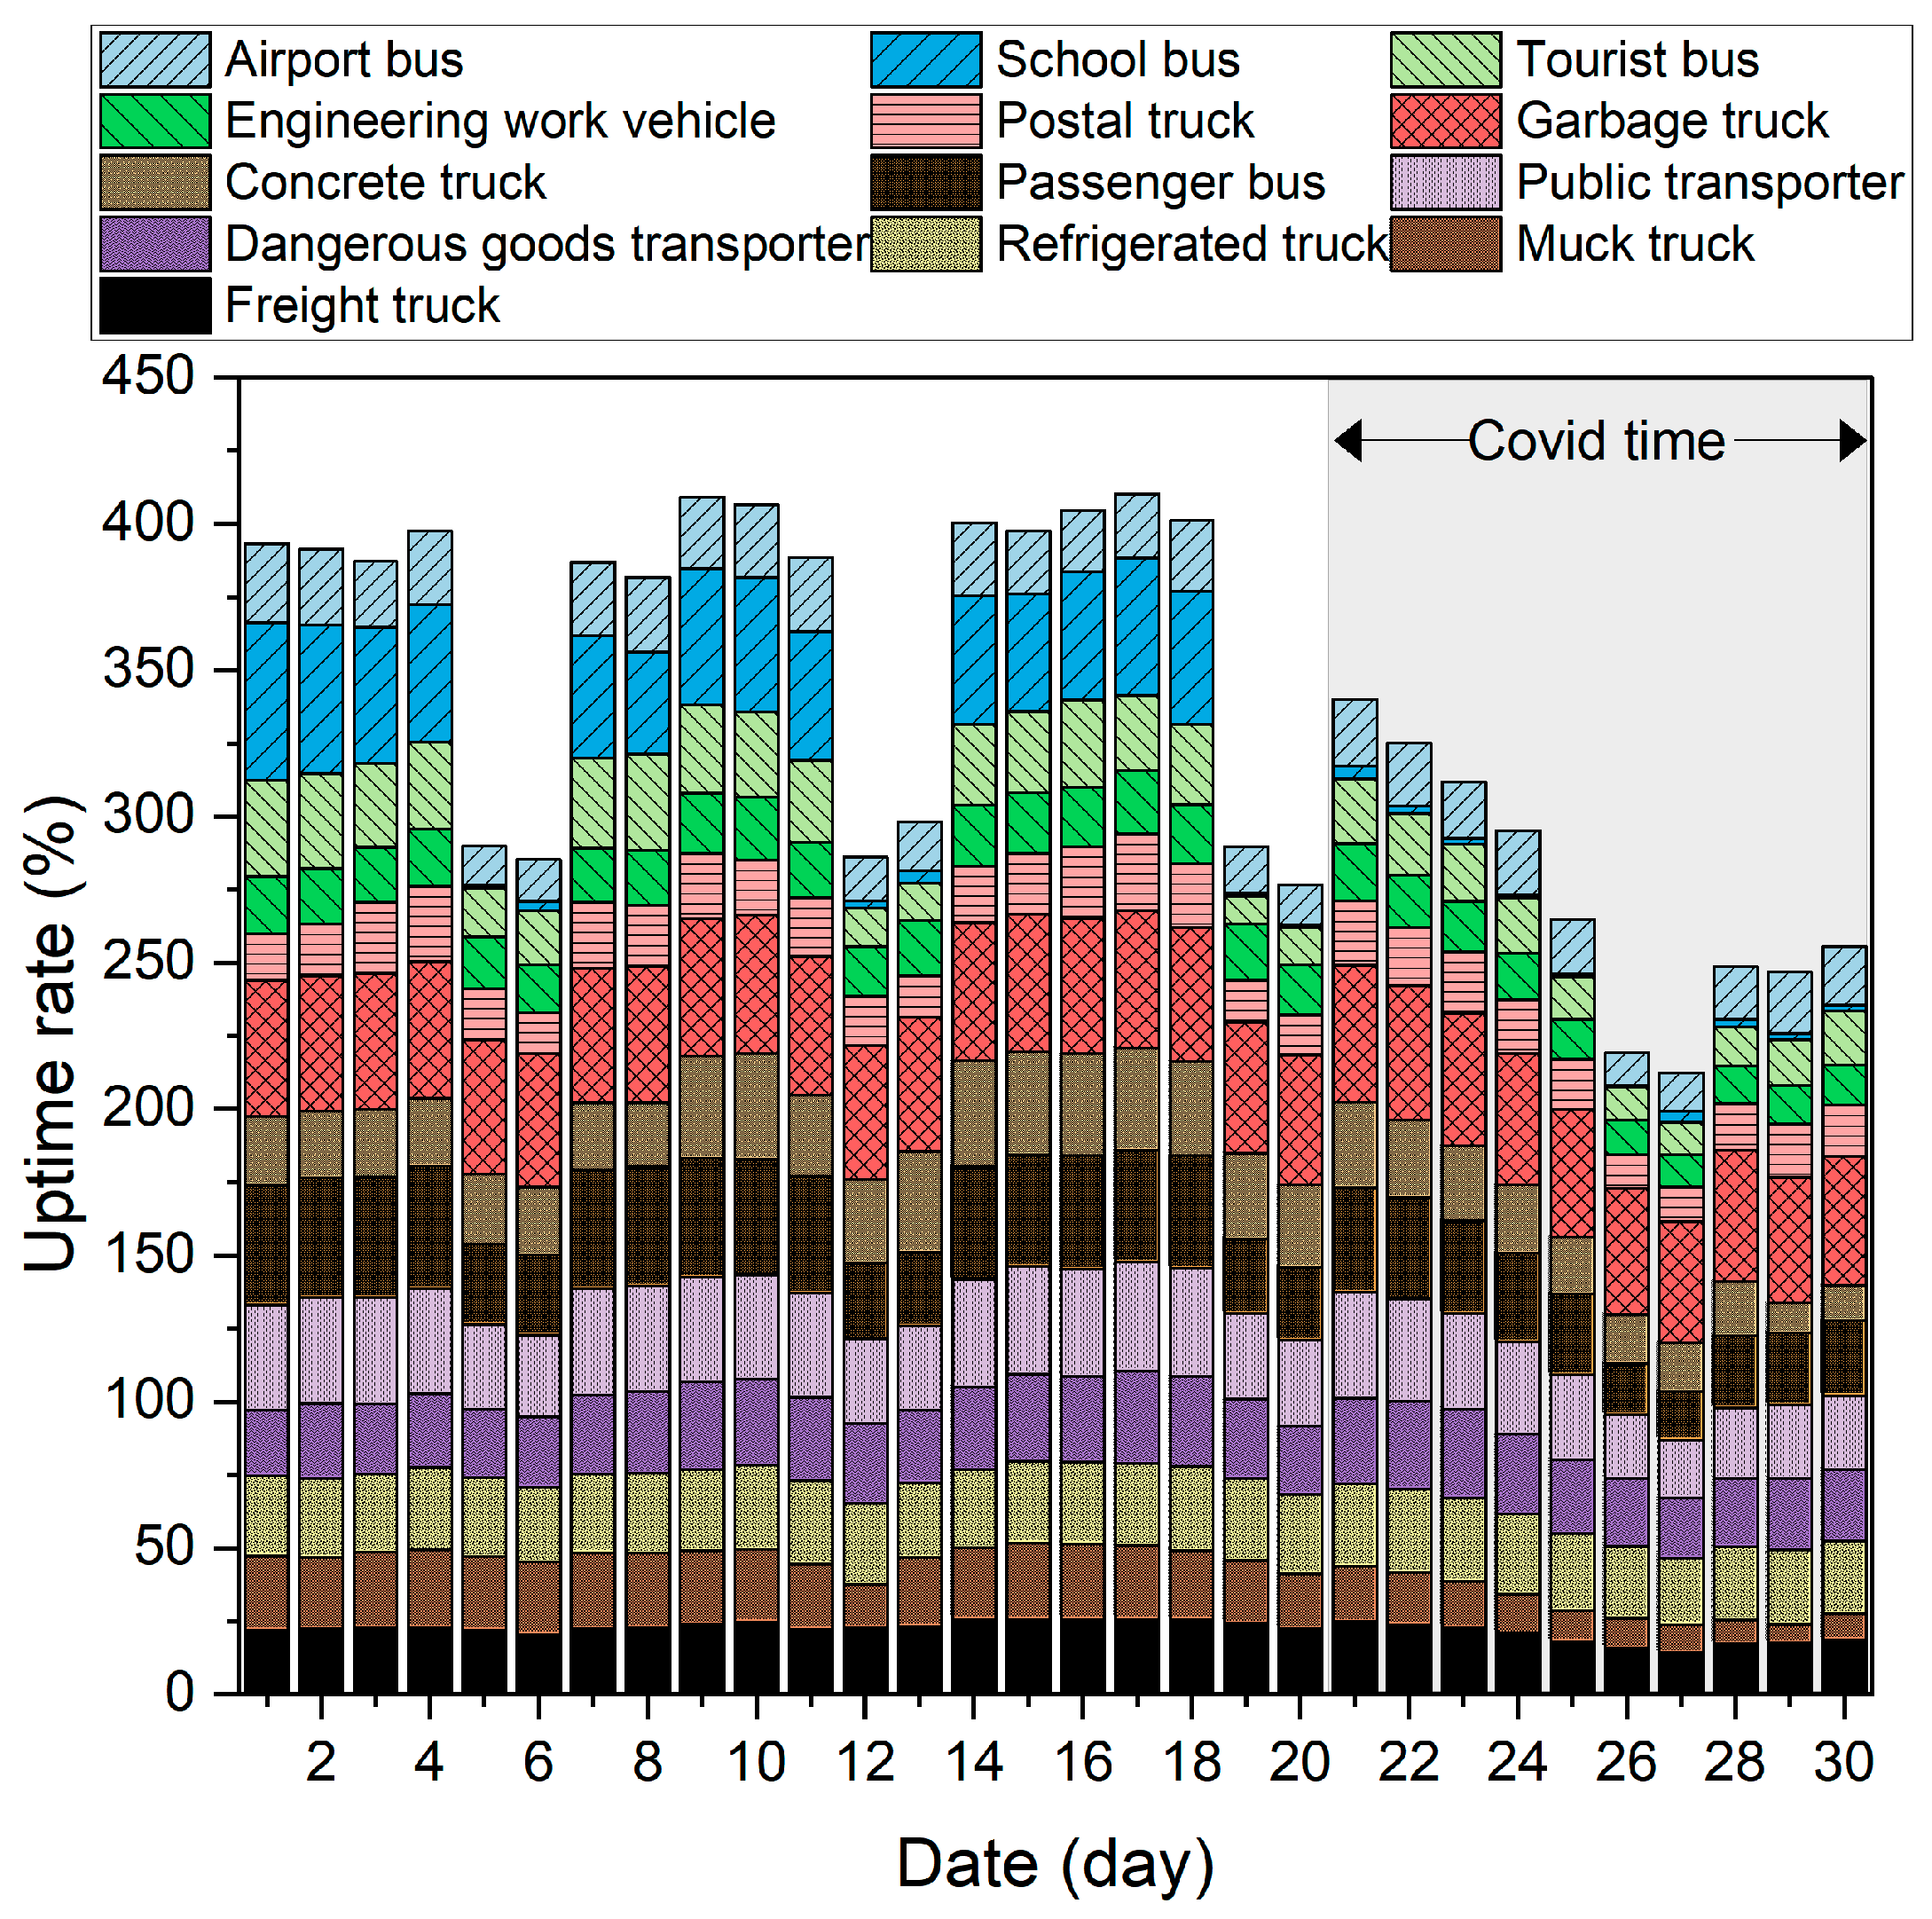
According to the survey and estimation of the HDDVs in various industries in Beijing by the China Automotive Technology and Research Center, the statistics on the population of HDDVs (National-V and National-Ⅵ standards) of 13 industry types are shown in Table 2. The annual mileage and emission factor of these HDDVs are estimated from the OBD data of a given month. According to Formula (4), the total annual NOx (a) and CO2 (b) emissions of HDDVs in Beijing in 2022 for 13 industry types are shown in Figure 1.
China Mobile’s annual report on the environmental management of diesel vehicles in 2020 showed that the NOX emissions of diesel vehicles in 2020 were 6.137 million tons [1] and 5.021 million tons [28] in 2021. From the data from 2020 to 2021, it is expected that the NOX annual emissions of the 13 industry types in this study will account for about 0.5% of the total diesel vehicle emissions within the country in 2022.
According to the “CO2 Emissions in 2022” [29] released by the IEA, China’s CO2 emissions in 2022 were 11,477,000 tons, and the annual CO2 emissions of the 13 industry types in this study account for 0.06% of the country’s total annual CO2 emissions. Teixeira and Sodré [30] found that, in Sete Lagoas city, to replace the ICE with an EV completely, the reduction in CO2 emissions would range from 3800 tons to 5600 tons per year.

3.2. Activity Level

The activity level data for the whole month of November 2022 are compiled (Figure 2). Long-distance freight trucks represented by tractors had an average daily mileage of about 160.4 km and a high load. Moreover, a long-distance freight must be on the highway and sensitive to the vehicle weight (increased high-speed fees). Electrification has a faster weight gain on vehicles, such as batteries with a lower energy density (such as lead-acid batteries: 40 Wh/kg), which has an additional impact on electrified vehicles.
The essence of postal trucks is similar to that of freight trucks, which are used for commercial use and are not significantly affected by holidays, etc. The activity level of postal trucks on weekends decreases. Refrigerated trucks and dangerous goods transporters had higher daily mileages of 236.7 and 203.3 km among the 13 industry types in this study, which are unsuitable for electrification.
Muck trucks and engineering work vehicles mainly operate at construction sites, with single-day mileages of 104.6 and 62.0 km. Muck trucks and engineering work vehicles are also suitable for electrification reform if the cost of installing charging piles on the construction site is not considered. The average daily mileage of concrete trucks is small, and the NOx and CO2 emission factors of concrete trucks were 16.8 and 1463.1 g/km, which accelerates the electrification process of concrete trucks and can quickly reduce emissions.
Airport buses, school buses, and tourist buses have fixed, round-trip locations and short mileages, at about 19.9, 21.4, and 42.0 km, respectively, with low electrification costs and suitability for promotion. Moreover, school buses will have a substantial time and space distribution of their work attributes and will be concentrated near campus activities. The attributes of daily working hours and weekends are apparent (Figure 3), and there is a trend of electrification. Liimatainen et al. [31] found that electrified vehicles are feasible for road transport tasks in a relatively small country such as Switzerland, because the distances transported are mostly shorter.
Today’s passenger buses mainly travel to fixed-area stations, which are similar to the functional attributes of public transport, but do not have frequent bus starts and stops. Under the influence of the high-speed development of railway transportation, people using long-distance transportation have gradually abandoned taking passenger buses. They prefer fast and cheap railways, aviation, and other means of transportation. This study also verifies that the single-day mileage of passenger vehicles in Beijing is about 116.2 km, which is suitable for the promotion of electrification. At the same time, passenger buses accounted for 67.9% of all the HDDVs in all industries in terms of their NOX emissions, accelerating the process of the electrification of passenger vehicles and rapidly reducing NOX emissions. The daily mileage of public transporters is about 108.7 km, and many public diesel transporters have been replaced by public electric transporters in Beijing. “By the end of November 2020, 82.8% of Beijing’s buses switched to public electric transporters” [32].

3.3. Electrification Emission Reduction Potential

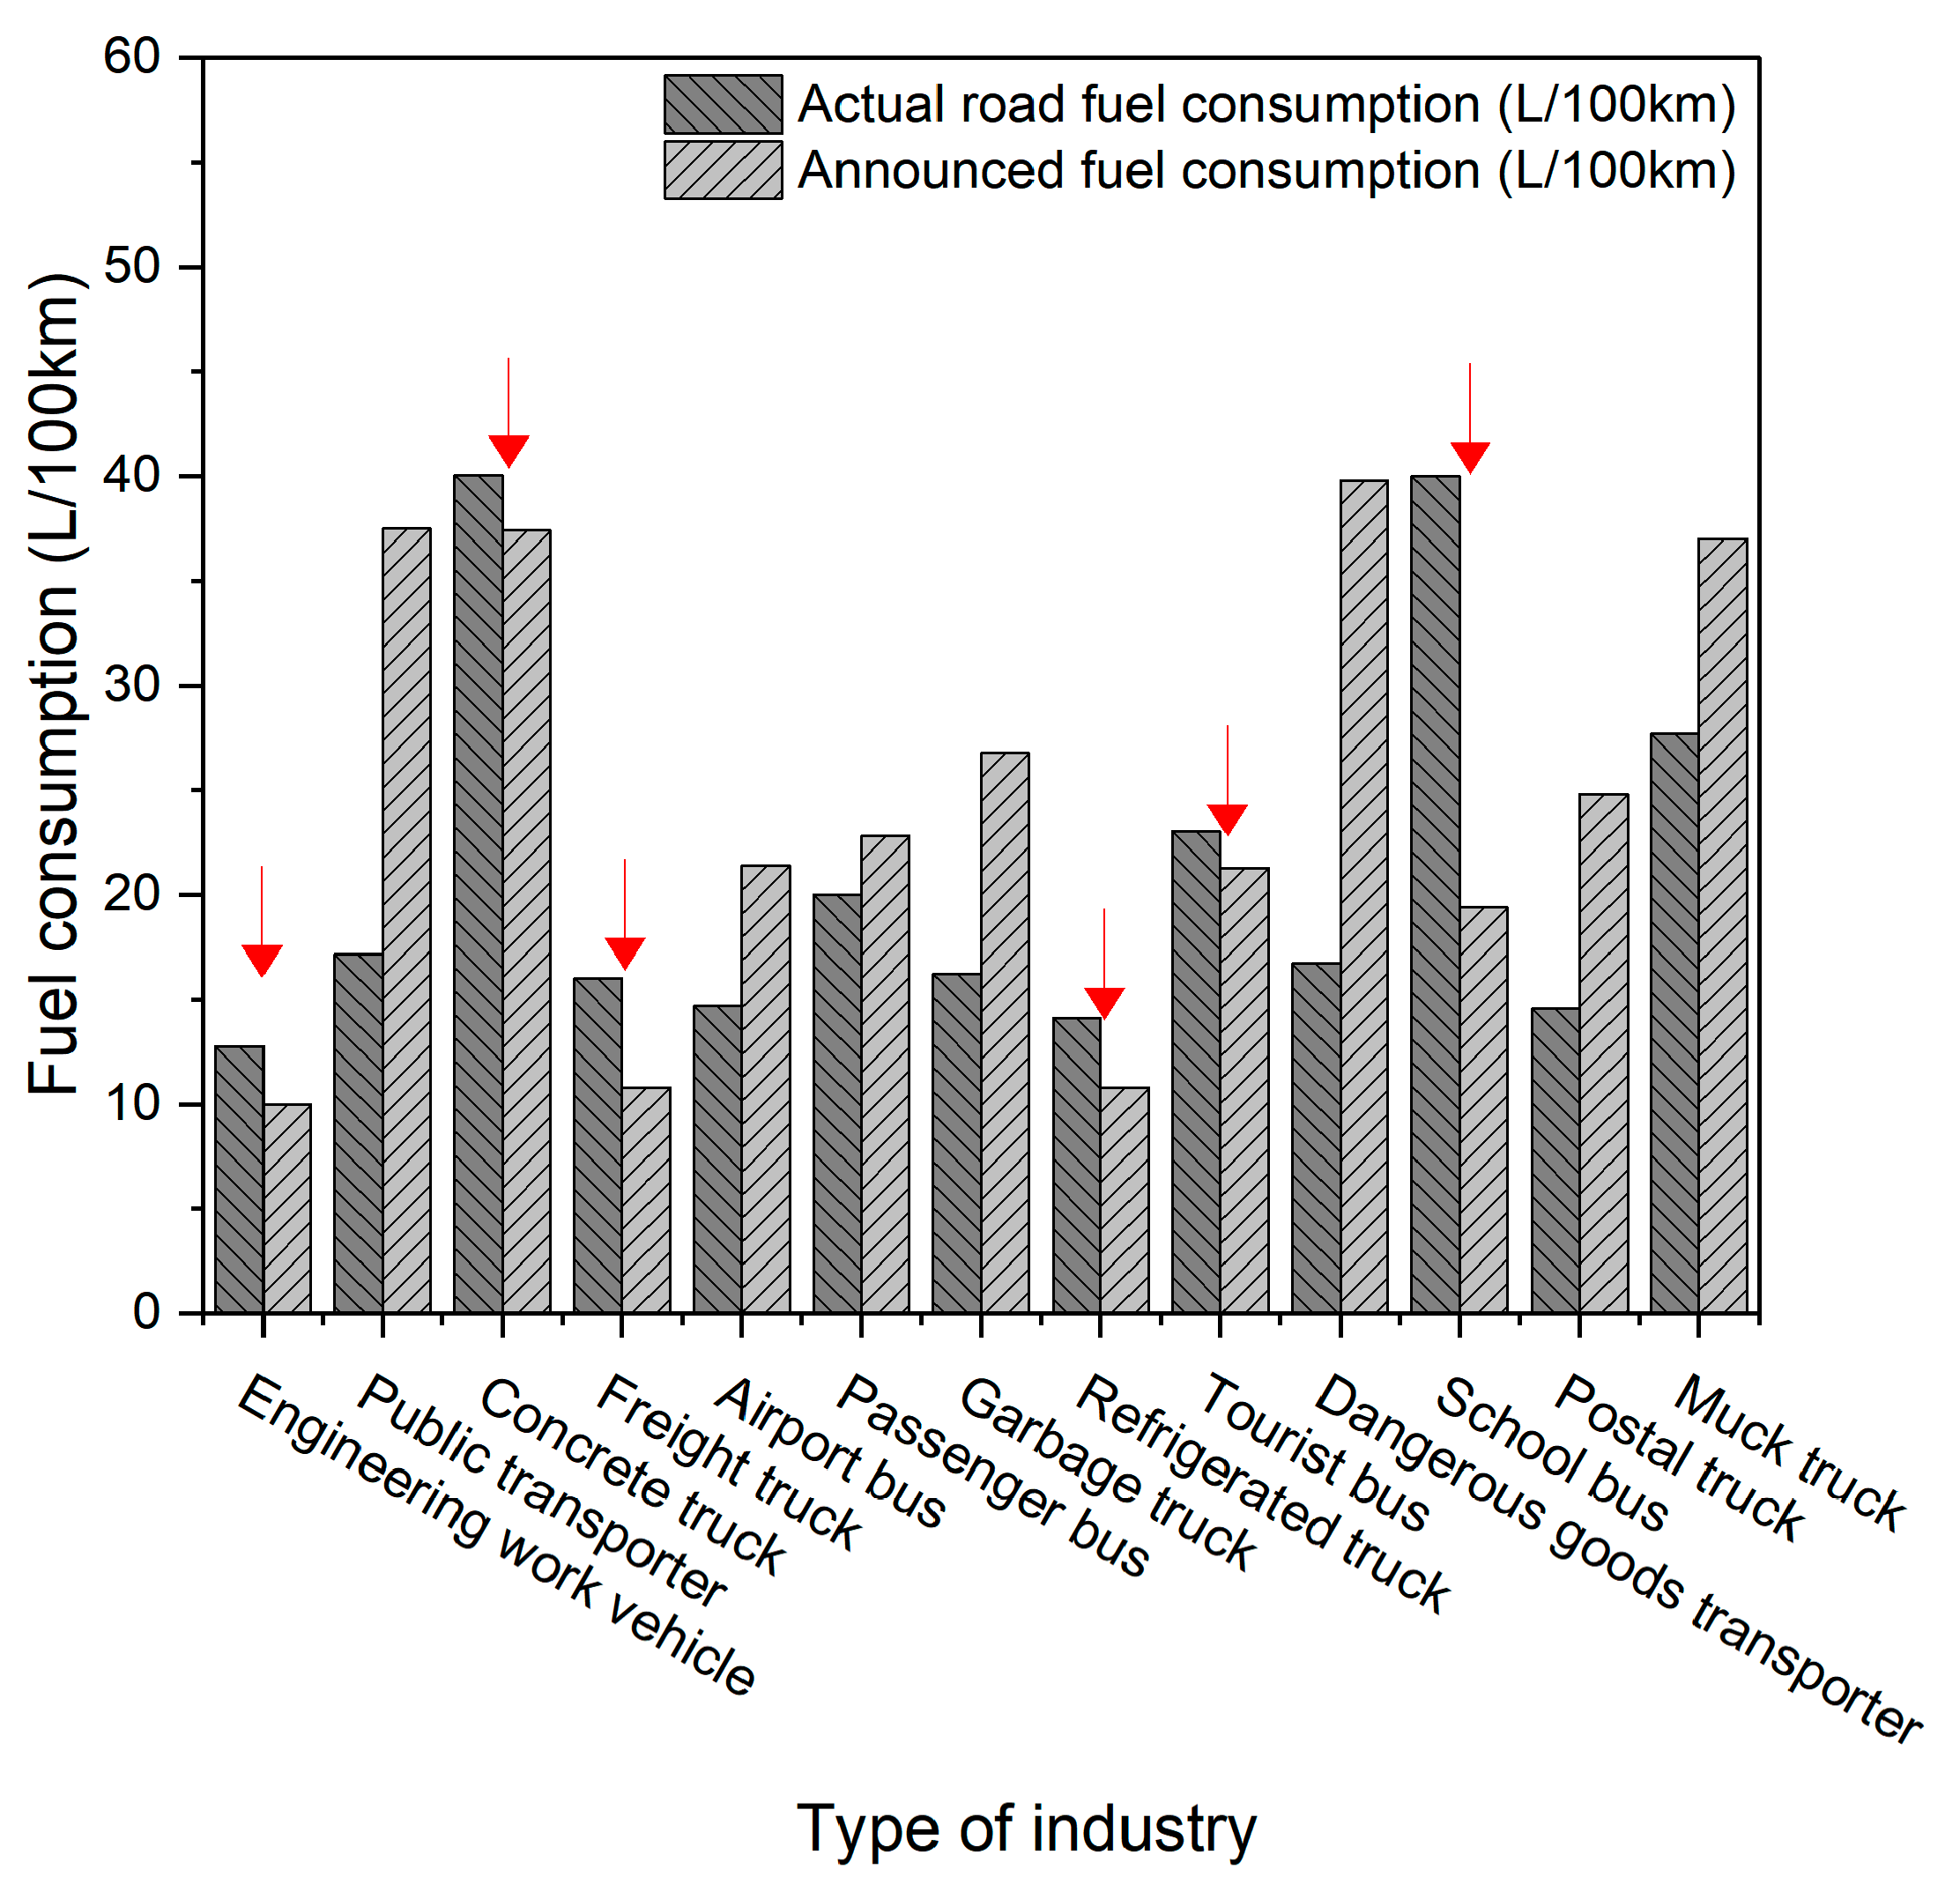
3.3.1. Actual Fuel Consumption vs. Announced Fuel Consumption

There is a difference between a vehicle’s announced fuel consumption and its actual fuel consumption (Figure 4). The average road fuel consumption of engineering work vehicles, concrete trucks, freight trucks, refrigerated trucks, tourist buses, and school buses were 17.7%, 4.9%, 25.4%, 17.2%, 5.9%, and 40.2% higher than their announced fuel consumption, respectively. Domestic authoritative research trends have shown that the results of vehicle energy consumption certification are inconsistent with the actual driving performances of vehicles, and this difference is increasing. The difference in fuel consumption was 28% in the naturally aspirated model and 32% in the supercharged model [33]. It is easy to imagine that the pollution emissions will be higher under the current calculation method. Electrification completely avoids excessive fuel consumption during use.

3.3.2. Battery Capacities

The required battery capacities are calculated from the fuel consumption and power of the HDDVs of various industry types, and the results are shown in Figure 5. However, considering the test and actual discount, only 70% of the battery life can be exerted in general use. In this study, the energy requirements of batteries in various industries were 11.9–152.9 kWh.
Link and Plötz’s [34] study found that the battery capacity requirement of 18-ton trucks with an average daily mileage of less than 300 km was 100–200 kWh, and the battery capacity requirement of 26-ton trucks was 100–250 kWh. The battery capacity requirement of an 18-ton truck with an average daily driving distance was 100–400 kWh, and the battery capacity requirement of a 26-ton truck was 200–650 kWh. In total, 80% of trucks require 200–350 kWh (18 tons) and 200–450 kWh (26 tons).
Currently, the mainstream battery capacity of domestic pure electric heavy trucks is 282 kWh, which can meet the power demand for the electrification of the different vehicle-weight HDDVs tested in this study. The electrification process mainly takes into account the power demand and charging issues. Patil et al. [35] found that the charging behavior of electric vehicles and infrastructure have complex interactions, because this charging behavior affects infrastructure planning and vice versa. As can be seen from Figure 2, the utilization rate of HDDVs in Beijing is not high, and the charging time caused by electrification can be increased by increasing the utilization rate of vehicles and charging in shifts.

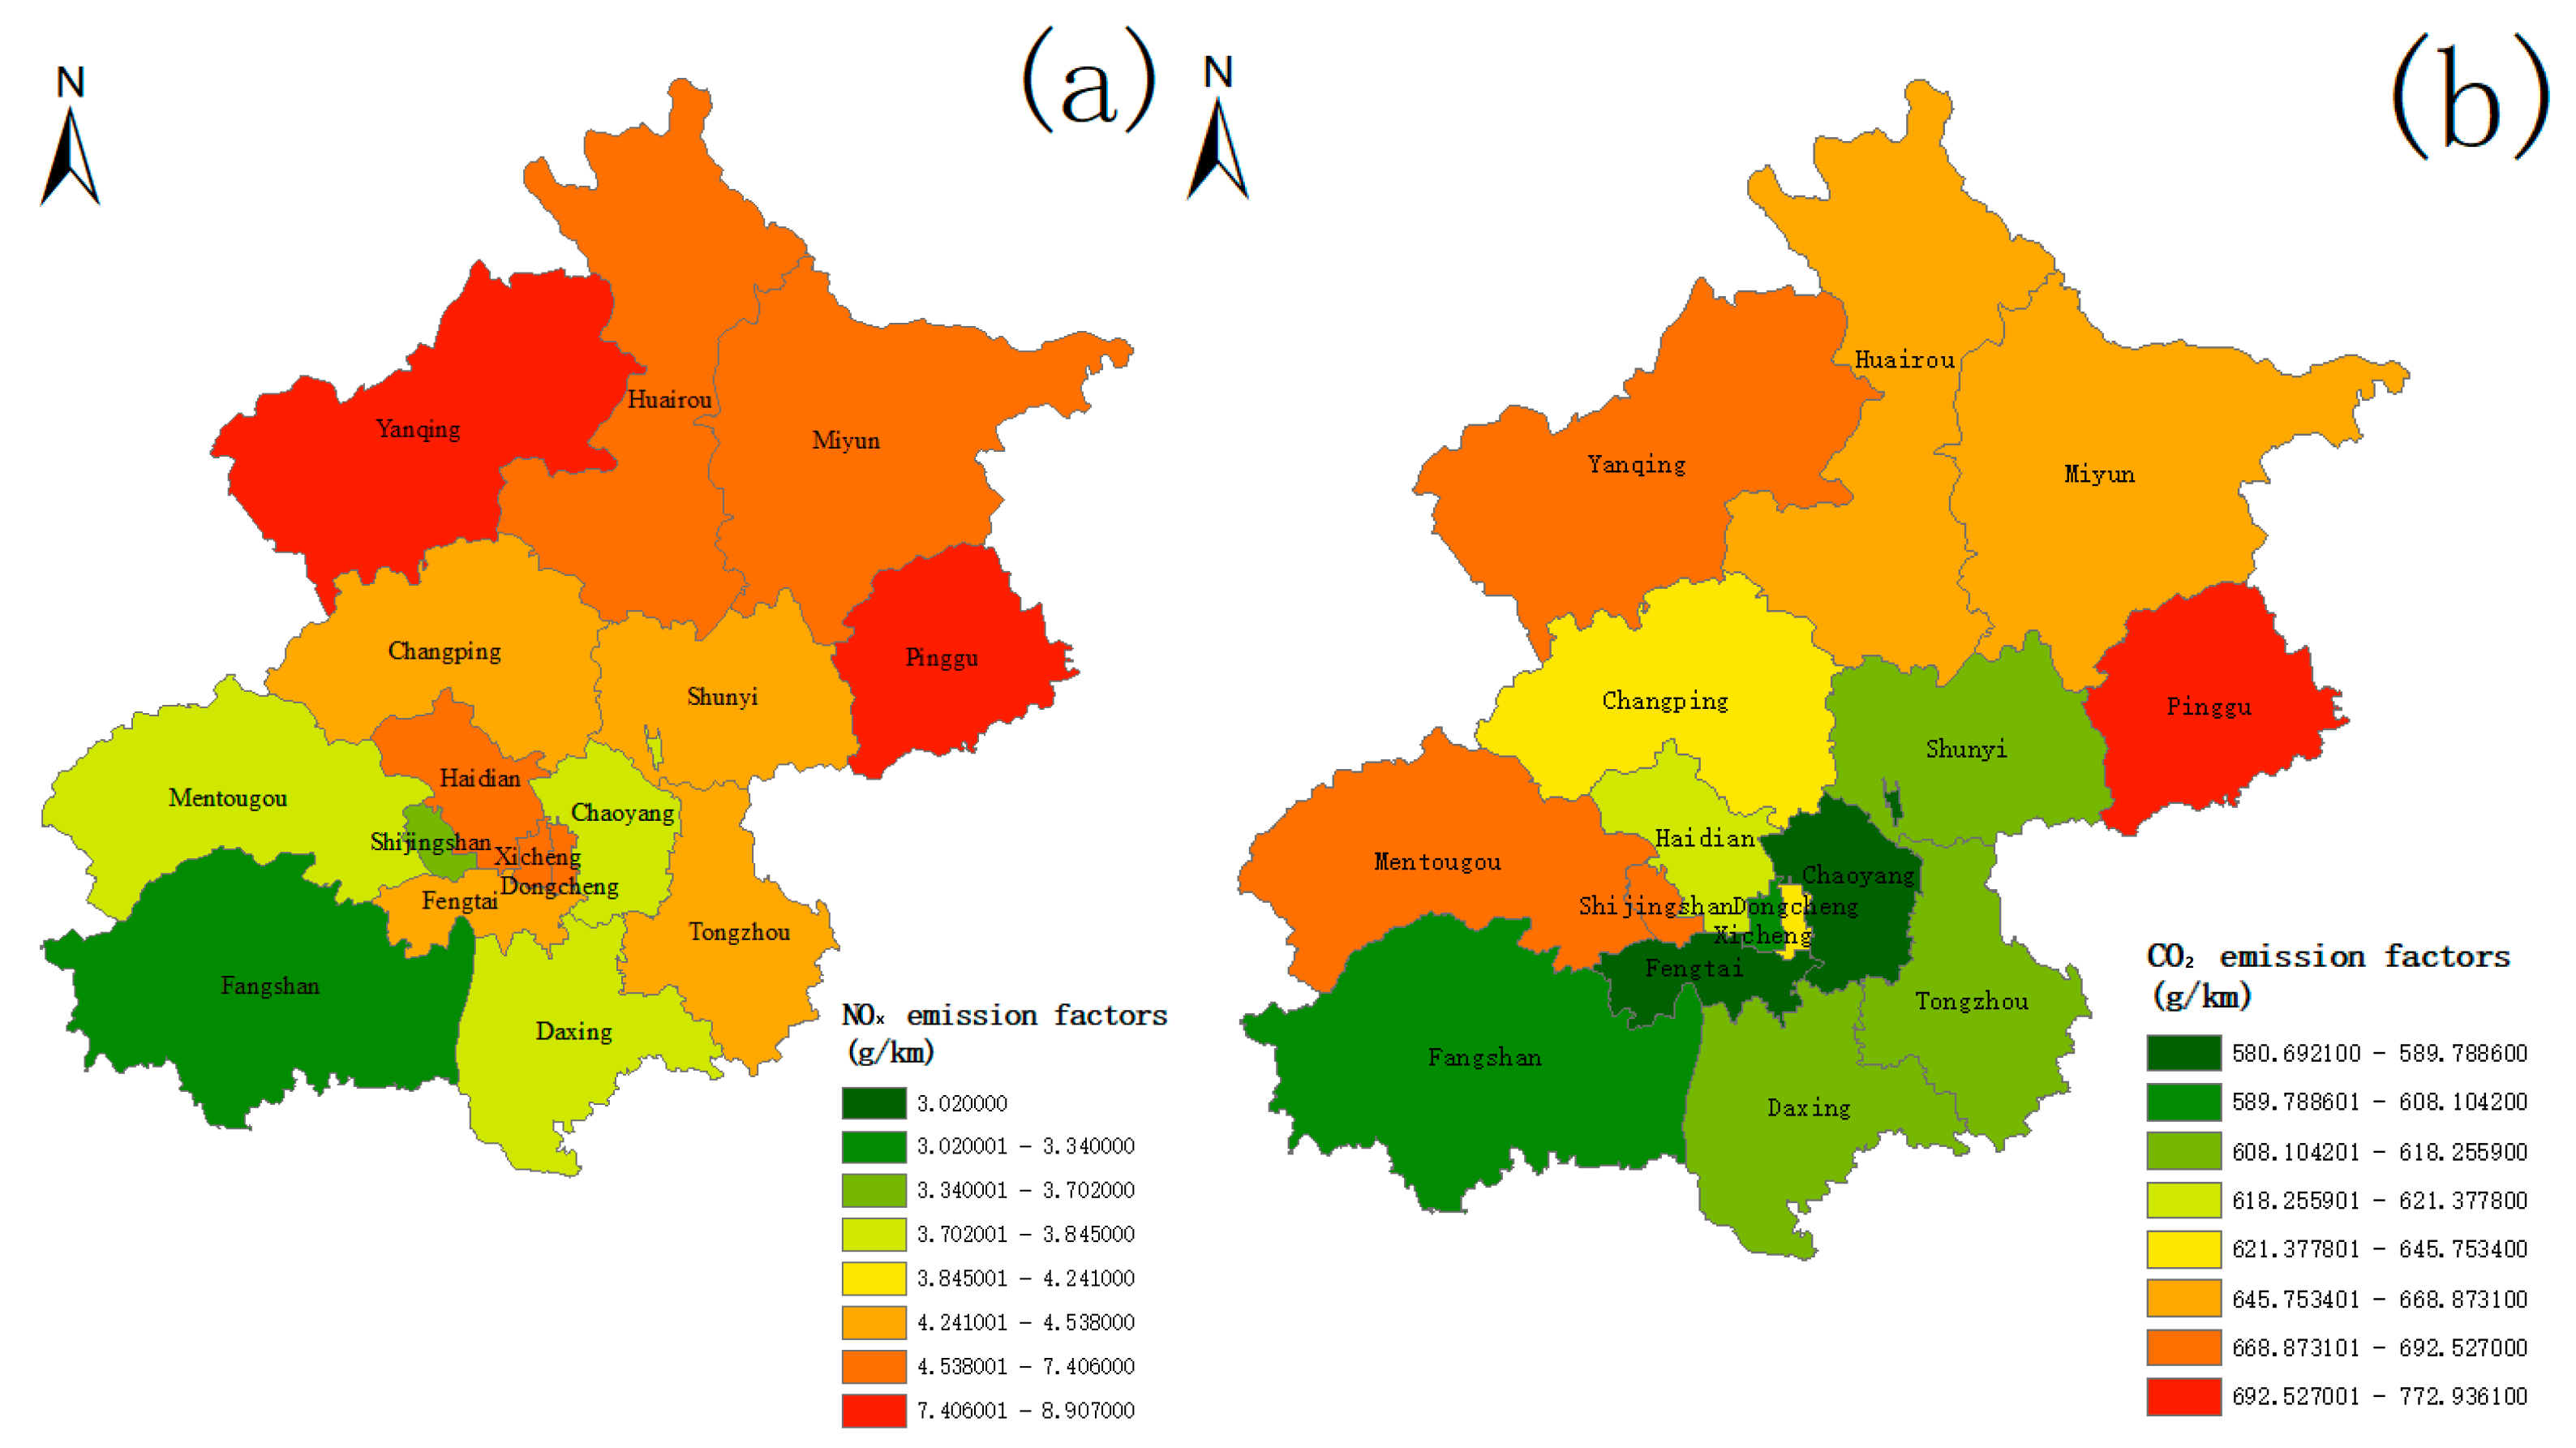
3.3.3. Regional Emission Reductions

The NOx emission factors of each district contributed by the 13 industry types in Beijing were 3.0–8.9 g/km, and the CO2 emission factors were 606.6–772.9 g/km (Figure 6). The top three districts with high NOX emission factors were Pinggu (8.9 g/km), Yanqing (7.4 g/km), and Huairou (7.4 g/km), while the top three districts with low NOX emissions were Fangshan (3.0 g/km), Mentougou (3.3 g/km), and Shijingshan (3.3 g/km). The top three districts with high CO2 emission factors were Pinggu (772.9 g/km), Mentougou (692.5 g/km), and Yanqing (687.2 g/km), while the top three districts with low CO2 emission factors were Fengtai (580.7 g/km), Chaoyang (589.8 g/km), and Fangshan (606.6 g/km). Regional emissions are mainly related to the contribution of industrial vehicles. For example, the highest contributor of NOX emissions was concrete trucks (Table 3), accounting for 27.1% of the entire range of industry type vehicles. Concrete truck electrification can significantly reduce diesel vehicles’ NOx emissions in Pinggu and other districts and realize regional emission reduction management. The CO2 emission factor of passenger buses in Pinggu was significantly higher than that of other districts (Table 4), which was 1212.4 g/km, and the electrification of passenger buses had significantly reduced CO2 emissions in the Pinggu district. In order to respond to the high-standard emission reduction needs of urban areas, Zhou et al. [36] suggested the short-distance transit of EVs. However, this method is unsuitable for buses and will produce excessive emissions.

4. Conclusions

This study analyzed the annual emissions of HDDVs and the feasibility of electrification in Beijing based on the OBD of remote monitoring data from more than 9000 HDDVs.
The annual NOX emissions of 13 industry types were 44,980.9 tons in 2022. In this study, NOx emissions from 13 industry types were expected to account for about 0.5% of the total diesel vehicle emissions in China in 2022. The annual CO2 emissions were 6,658,722.6 tons, accounting for 0.06% of the country’s total CO2 emissions. The NOx emission factors of each district contributed by the 13 industry types in Beijing were 3.2–7.6 g/km, and the CO2 emission factors were 591.1–787.2 g/km. Concrete trucks were the highest contributor to these NOx and CO2 emissions, accounting for 27.1% and 17.0% of the 13 industry-type vehicles. The CO2 emission factor of passenger buses in the Pinggu district was significantly higher than that of other districts, which was 1212.4 g/km. The electrification of passenger buses significantly reduced the CO2 emissions in the Pinggu district.
New energy vehicles are more likely to take the lead in public service and official car fields. Promoting the electrification of diesel vehicles is essential to promoting energy conservation and emission reductions in diesel and accelerating the construction of a green transportation system. The pollutants included in this study were only NOx and CO2, and subsequent studies can investigate more pollutants. This study investigated HDDVs in Beijing, which can provide a scientific basis for future industry electrification management, and also provide a regional reference for the electrification trend of HDDVs in various countries around the world.

Author Contributions

Conceptualization, M.F.; methodology, M.F. and Y.Y.; formal analysis, M.F.; investigation, M.F. and Y.L.; writing—original draft preparation, M.F.; validation, Y.Y.; resources, Y.Y.; data curation, Y.L.; project administration, H.W. and F.Y.; writing—review and editing, J.L. All authors have read and agreed to the published version of the manuscript.

Funding

This research was funded by [Tianjin Science and Technology plan project] grant number [S22YS3013] and The APC was funded by [CATARC Automotive Test Center (Tianjin) Co., Ltd.].

Data Availability Statement

The data presented in this study are available on request from the corresponding author.

Conflicts of Interest

The authors declare no conflict of interest.

References

  1. Ministry of Ecology and Environment of the People’s Republic of China (MEE). China Mobile Source Environmental Management Annual Report. 2021. Available online: https://www.mee.gov.cn/hjzl/sthjzk/ydyhjgl/202109/W020210910400449015882 (accessed on 10 September 2021).
  2. Féral, J. IPCC, 2014: Climate Change 2014: Synthesis Report. Contribution of Working Groups I, II, and III to the Fifth Assessment Report of the Intergovernmental Panel on Climate Change. Environmental Science. 2015, 151. Available online: http://www.mendeley.com/research/climate-change-2014-synthesis-report-contribution-working-groups-i-ii-iii-fifth-assessment-report-in-20 (accessed on 20 March 2015).
  3. Degraeuwe, B.; Thunis, P.; Clappier, A.; Weiss, M.; Lefebvre, W.; Janssen, S.; Vranckx, S. Impact of passenger car NOx emissions and NO2 fractions on urban NO2 pollution—Scenario analysis for the city of Antwerp, Belgium. Atmos. Environ. 2015, 126, 218–224. [Google Scholar] [CrossRef]
  4. Tong, Z.; Chen, Y.; Malkawi, A.; Adamkiewicz, G.; Spengler, J. Quantifying the impact of traffic-related air pollution on the indoor air quality of a naturally ventilated building. Environ. Int. 2016, 89, 138–146. [Google Scholar] [CrossRef] [PubMed]
  5. Yuan, C.; Wu, D.; Liu, H. Using Grey Relational Analysis to Evaluate Energy Consumption, CO2 Emissions and Growth Patterns in China’s Provincial Transportation Sectors. Int. J. Environ. Res. Public Health 2017, 14, 1536. [Google Scholar] [CrossRef] [PubMed] [Green Version]
  6. Kazancoglu, Y.; Ozbiltekin-Pala, M.; Ozkan-Ozen, Y. Prediction and evaluation of greenhouse gas emissions for sustainable road transport within Europe. Sustain. Cities Soc. 2021, 70, 102924. [Google Scholar] [CrossRef]
  7. Huang, X.; Zhang, H.; Zhang, X. Decarbonising electricity systems in major cities through renewable cooperation—A case study of Beijing and Zhangjiakou. Energy 2020, 190, 116444. [Google Scholar] [CrossRef]
  8. Ai, Y.; Ge, Y.; Ran, Z.; Li, X.; Xu, Z.; Chen, Y.; Miao, X.; Xu, X.; Mao, H.; Shi, Z.; et al. Quantifying Air Pollutant Emission from Agricultural Machinery Using Surveys—A Case Study in Anhui, China. Atmosphere 2021, 12, 440. [Google Scholar] [CrossRef]
  9. Li, X.; Yang, L.; Liu, Y.; Zhang, C.; Xu, X.; Mao, H.; Jin, T. Emissions of air pollutants from non-road construction machinery in Beijing from 2015 to 2019. Environ. Pollut. 2023, 317, 120729. [Google Scholar] [CrossRef]
  10. Han, B.; Wang, L.; Deng, Z.; Shi, Y.; Yu, J. Source emission and attribution of a large airport in Central China. Sci. Total Environ. 2022, 829, 154519. [Google Scholar] [CrossRef]
  11. Wu, Y.; Zhang, S.; Li, M.; Ge, Y.; Shu, J.; Zhou, Y.; Xu, Y.; Hu, J.; Liu, H.; Fu, L.; et al. The challenge to NOx emission control for heavy-duty diesel vehicles in China. Atmos. Chem. Phys. 2012, 12, 9365–9379. [Google Scholar] [CrossRef] [Green Version]
  12. Sato, S.; Jiang, Y.; Russell, R.; Miller, J.; Karavalakis, G.; Durbin, T.; Johnson, K. Experimental driving performance evaluation of battery-powered medium and heavy duty all-electric vehicles. Int. J. Electr. Power Energy Syst. 2022, 141, 108100. [Google Scholar] [CrossRef]
  13. International Council on Clean Transportation (ICCT). Europe’s New Heavy-Duty CO2 Standards, Explained. 2023. Available online: https://theicct.org/eu-co2-hdv-standards-explained-feb23/ (accessed on 14 February 2023).
  14. Yang, Z.; Tate, J.; Morganti, E.; Philips, L.; Shepherd, S. How accelerating the electrification of the van sector in Great Britain can deliver faster CO2 and NOx reductions. Sustain. Cities Soc. 2023, 88, 104300. [Google Scholar] [CrossRef]
  15. California Environmental Protection Agency (CEPA). Governor Newsom’s Zero-Emission by 2035 Executive Order (N-79-20). 2021. Available online: https://ww2.arb.ca.gov/resources/fact-sheets/governor-newsoms-zero-emission-2035-executive-order-n-79-20 (accessed on 19 January 2021).
  16. Zhang, L.; Leng, K.; Li, S.; Wang, J. Comparative analysis of comprehensive benefits of Beijing?s taxi electrification paths. Transp. Res. Part D-Transp. Environ. 2023, 115, 103612. [Google Scholar] [CrossRef]
  17. Gao, Z.; LaClair, T.; Ou, S.; Huff, S.; Wu, G.; Hao, P.; Boriboonsomsin, K.; Barth, M. Evaluation of Electric Vehicle Component Performance over Eco-driving Cycles. Energy 2019, 172, 823–839. [Google Scholar] [CrossRef]
  18. Bucher, J.; Bradley, T.; Lohse-Busch, H.; Rask, E. Analyzing the Energy Consumption Variation during Chassis Dynamometer Testing of Conventional, Hybrid Electric, and Battery Electric Vehicles. SAE Int. J. Alt. Power. 2014, 3, 36–43. [Google Scholar] [CrossRef]
  19. Ma, X.; Miao, R.; Wu, X.; Liu, X. Examining influential factors on the energy consumption of electric and diesel buses: A data-driven analysis of large-scale public transit network in Beijing. Energy 2021, 216, 119196. [Google Scholar] [CrossRef]
  20. Xu, X.; Lv, X.; Han, L. Carbon Asset of Electrification: Valuing the Transition from Fossil Fuel-Powered Buses to Battery Electric Buses in Beijing. Sustainability 2019, 11, 2749. [Google Scholar] [CrossRef] [Green Version]
  21. Gunawan, T.; Monaghan, R. Techno-econo-environmental comparisons of zero- and low-emission heavy-duty trucks. Appl. Energy 2022, 308, 118327. [Google Scholar] [CrossRef]
  22. Liu, F.; Mauzerall, D.; Zhao, F.; Hao, H. Deployment of fuel cell vehicles in China: Greenhouse gas emission reductions from converting the heavy-duty truck fleet from diesel and natural gas to hydrogen. Int. J. Hydrog. Energy 2021, 46, 17982–17997. [Google Scholar] [CrossRef]
  23. Ministry of Ecology and Environment of the People’s Republic of China (MEE). DB11/1475-2017 Limits and Measurement Method of Emissions from Heavy-Duty Vehicle (OBD Method Phase IV and V). 2017. Available online: https://dbba.sacinfo.org.cn/stdDetail/497c753d2357ff8429a2fbec5b7a6381acf28d61e10593f816dad9feeefed5f2 (accessed on 1 December 2017).
  24. Durbin, T.; Jiang, Y.; Carlock, M.; Ventura, L.; Clark, N.; Mckain, D. Heavy-duty On-road Vehicle Inspection and Maintenance Program (Final Report). California Air Resources Board 2019, vi–vii. Available online: https://www.cert.ucr.edu/media/1251/download?attachment (accessed on 21 January 2019).
  25. Feng, Q.; Liu, B.; Yang, Y.; Zhang, S.; Shen, X.; Lu, Y.; Wang, P.; Wu, Y. Characteristics of actual road NOX and CO2 emissions from diesel vehicles in Beijing based on remote monitoring. China Environ. Sci. 2023. (In Chinese) [Google Scholar] [CrossRef]
  26. Huang, J.; Opoku, P.; Li, J.; Norgbey, E.; Brown, E. Two-Staged Dielectric Barrier Discharge-Urea Configuration for the Removal of NO of NOx in a Simulated Coal-Combustion Flue Gas. Water Air Soil Pollut 2019, 230, 120. [Google Scholar]
  27. Ministry of Ecology and Environment of the People’s Republic of China (MEE). Technical Guidance for the Preparation of Road Motor Vehicle Emission Inventories. 2014. Available online: https://www.mee.gov.cn/gkml/hbb/bgth/201407/W020140708387895271474 (accessed on 8 July 2014).
  28. Ministry of Ecology and Environment of the People’s Republic of China (MEE). China Mobile Source Environmental Management Annual Report. 2022. Available online: https://www.mee.gov.cn/hjzl/sthjzk/ydyhjgl/202212/W020221207387013521948 (accessed on 7 December 2022).
  29. International Energy Agency (IEA). CO2 Emissions in 2022. 2023. Available online: https://www.iea.org/reports/co2-emissions-in-2022 (accessed on 3 March 2023).
  30. Teixeira, A.; Sodré, J. Impacts of replacement of engine powered vehicles by electric vehicles on energy consumption and CO2 emissions. Transp. Res. Part D Transp. Environ. 2018, 59, 375–384. [Google Scholar] [CrossRef]
  31. Liimatainen, H.; Vliet, O.; Aplyn, D. The potential of electric trucks—An international commodity-level analysis. Appl. Energy 2019, 236, 804–814. [Google Scholar] [CrossRef]
  32. Zhang, X.; Nie, S.; He, M.; Wang, J. Charging system analysis, energy consumption, and carbon dioxide emissions of battery electric buses in Beijing. Case Stud. Therm. Eng. 2021, 26, 101197. [Google Scholar] [CrossRef]
  33. China EV100 Forum. CATARC Li Mengliang: The Cause, Research Process and Results of “China’s Working Conditions”. 2018. Available online: http://pba.cbea.com/zt1/201801/651029.html (accessed on 21 January 2018).
  34. Link, S.; Plötz, P. Technical Feasibility of Heavy-Duty Battery-Electric Trucks for Urban and Regional Delivery in Germany—A Real-World Case Study. World Electr. Veh. J. 2022, 13, 161. [Google Scholar]
  35. Patil, P.; Kazemzadeh, K.; Bansal, P. Integration of charging behavior into infrastructure planning and management of electric vehicles: A systematic review and framework. Sustain. Cities Soc. 2023, 88, 104265. [Google Scholar] [CrossRef]
  36. Zhou, Y.; Yu, Y.; Wang, Y.; He, B.; Yang, L. Mode substitution and carbon emission impacts of electric bike sharing systems. Sustain. Cities Soc. 2023, 89, 104312. [Google Scholar] [CrossRef]
Figure 1. The total annual NOx (a), and CO2 (b) emissions of HDDVs in Beijing in 2022.
Sustainability 15 11019 g001
Figure 2. Daily mileage of HDDVs by industry types.
Sustainability 15 11019 g002
Figure 3. Daily uptime rate of HDDVs of industry types.
Sustainability 15 11019 g003
Figure 4. Actual fuel consumption of HDDVs in different industries (the red arrow highlights that the actual fuel consumption is higher than the announced fuel consumption).
Sustainability 15 11019 g004
Figure 5. Energy requirements of HDDVs batteries in different industry types.
Sustainability 15 11019 g005
Figure 6. NOx (a), and CO2 (b) emission factors of HDDVs in different regions.
Sustainability 15 11019 g006
Table 1. Data collected by vehicle-mounted terminals.
ParameterUnitData Frequency (Hz)Accuracy (%)
Air intakekg/h1- 2
Fuel flowL/h1±5
SCR 1 downstream NOx transmitter output valueppm1±5
Engine net output torque%1±3
Frictional torque%1±3
Engine speedrpm1±1
Mileage accrualkm1-
Longitude°11
Latitude°11
1 SCR: Selective Catalytic Reduction. 2: Data is not available.
Table 2. Major information on test vehicles for different industry types.
Type of IndustryNumber of Test VehiclesAverage Daily Fuel Consumption Factor (g/kWh)Annual Mileage (km)NOx Emission Factor (g/km)CO2 Emission Factor (g/km)Population
National-VNational-VI
Engineering work vehicle4930335222,313.63.5420.97986
Public transporter37512928139,144.07.3686.716,642
Concrete truck12919128533,721.216.81463.17530
Freight truck1501365822757,736.63.1549.5114,266
Airport bus1512267170.43.3578.4216
Passenger bus2537422641,814.62.9616.36096
Garbage truck2316025329,320.83.9675.94113
Refrigerated truck19175222285,205.24.1515.420,854
Tourist bus271422615,111.22.3750.2567
Dangerous goods transporter364122473,179.96.2685.11846
School bus2222817703.70.9533.3331
Postal truck293321953,300.55.0553.81641
Muck truck43974330037,658.43.1812.526,488
Table 3. NOX emissions by 13 industry types of HDDVs in different regions (g/km).
Type of IndustryChangpingChaoyangDaxingDongchengFangshanFengtaiHaidianHuairouMentougouMiyunPingguShijingshanShunyiTongzhouXichengYanqing
Engineering work vehicle4.74.12.44.61.83.63.82.32.34.73.73.33.84.04.02.0
Public transporter6.67.97.47.55.78.57.17.57.85.89.48.59.27.26.34.3
Concrete truck19.514.011.418.511.223.520.216.915.49.525.810.413.115.222.423.4
Freight truck3.42.72.42.52.42.72.73.62.64.04.32.63.72.72.73.9
Airport bus2.22.92.15.13.03.12.5---4.9-4.55.23.0-
Passenger bus1.71.82.13.52.33.62.74.42.11.911.61.83.02.22.25.5
Garbage truck3.93.53.95.72.26.53.92.45.12.12.82.32.37.32.75.2
Refrigerated truck3.93.23.06.42.64.73.72.72.12.46.13.53.63.96.48.6
Tourist bus2.71.92.21.72.02.22.22.81.93.93.32.01.62.12.15.6
Dangerous goods transporter6.45.94.83.55.06.18.34.45.612.38.64.65.44.56.511.8
School bus1.40.71.10.90.80.61.1-0.9--0.60.51.11.1-
Postal truck3.53.23.86.11.14.28.80.32.11.02.20.813.09.37.37.2
Muck truck2.82.23.43.53.62.82.03.32.64.94.12.73.52.52.53.5
-: No data were detected in this area.
Table 4. CO2 emissions by 13 industry types of HDDVs in different regions (g/km).
Type of IndustryChangpingChaoyangDaxingDongchengFangshanFengtaiHaidianHuairouMentougouMiyunPingguShijingshanShunyiTongzhouXichengYanqing
Engineering work vehicle411.6385.0403.8343.2389.8353.5402.0538.2432.4507.5532.2387.4441.5380.4369.8470.2
Public transporter660.3667.4624.4748.2644.1687.9643.5667.2665.51211.71204.8593.2738.9641.8687.2689.4
Concrete truck1494.41394.71420.71615.41517.81397.51489.21506.11610.71292.01431.81467.61382.11400.21379.51608.6
Freight truck555.1550.6528.8515.7534.7529.5526.2581.9590.6553.2565.9539.6561.1544.9530.4582.8
Airport bus707.6651.7479.3637.6464.4493.6492.4-----734.9762.9626.4-
Passenger bus605.0538.1572.9571.9604.8555.5575.0695.2699.5630.81212.4616.4685.1579.0609.0582.2
Garbage truck812.0710.5836.7574.0568.8554.9544.3752.0888.8490.2582.5667.9668.4814.0598.7597.6
Refrigerated truck497.6496.1504.4535.1504.6498.0481.9537.6512.3537.2554.3459.4509.4524.2499.9644.3
Tourist bus781.6726.4771.7687.1707.1702.7701.5804.5661.3943.8867.5717.5768.5819.0746.9783.8
Dangerous goods transporter678.5676.7611.5727.1643.3645.5643.9624.7661.7843.11099.0606.9702.0679.9600.0637.6
School bus541.8540.0490.2559.8525.8534.1578.6-473.2--481.5633.6523.5488.2-
Postal truck540.8494.1489.4555.1532.4472.3660.1420.8424.9583.0680.8388.4854.6609.1613.5957.7
Muck truck917.5747.1879.9745.5866.2841.0842.0807.9782.5943.4726.5806.0777.9799.5732.0739.7
-: No data were detected in this area.
Disclaimer/Publisher’s Note: The statements, opinions and data contained in all publications are solely those of the individual author(s) and contributor(s) and not of MDPI and/or the editor(s). MDPI and/or the editor(s) disclaim responsibility for any injury to people or property resulting from any ideas, methods, instructions or products referred to in the content.

