Article

Grain Size Characteristics of Surface Sediments and Their Migration Trends in the Nearshore Waters of East Guangdong

1
Haikou Marine Geological Survey Center, China Geological Survey, Haikou 571127, China
2
College of Marine Science and Technology, China University of Geosciences, Wuhan 430074, China
3
Hainan Zhongchang Construction Engineering Co., Ltd., Haikou 570100, China
4
College of Computer Science and Software Engineering, Shenzhen University, Shenzhen 518060, China
*
Authors to whom correspondence should be addressed.
Sustainability 2023, 15(14), 11069; https://doi.org/10.3390/su151411069
Submission received: 8 June 2023 / Revised: 7 July 2023 / Accepted: 12 July 2023 / Published: 15 July 2023
(This article belongs to the Special Issue Nutrient and Carbon Export under Global Warming and Land Use Change)

Abstract

:
By collecting surface sediment samples from 158 stations in the near-shore waters of eastern Guangdong, grain size analysis and grain size parameter calculations were performed to explore the characteristics and migration trends of surface sediments in the area. The analysis of the grain size results showed that the surface sediments in the nearshore waters of east Guangdong could be classified into nine sediment types, mainly including seven types of gravel sand ((g)S), gravel muddy sand ((g)mS), gravelly mud ((g)M), sand (S), silty sand (zS), sandy silt (sZ) and silt (Z). The relative percentages of gravel, sand, silt and mud were 0.7%, 40.56%, 46.7% and 12.04%, respectively. The average grain size varied from −2φ to 8φ, with an average of 4.94φ. The selection coefficient ranged from 0.44 to 3.78, with an average value of 1.8. The skewness distribution ranged from −0.34 to 0.67, with an average value of 0.07. By extracting and analyzing the spatial distribution information of grain size in the study area, using the Gao–Collins migration trend analysis method and incorporating dynamic factors such as tidal currents and waves, the transport direction and trend of surface sediments in the study area could be analyzed and inferred. The results show that the surface sediment migration trend was significant, migration on the north side of Nan’ao Island was in an east-to-west direction, and the sediment of Yifeng River was mainly deposited to the sand spout at the mouth of Lianyang River. After southward transport from the Houjiang waterway, the migration was mainly southeastward and the trend was quite significant until the 20 m isobath, where the trend gradually decreased. The sediments of the Rongjiang River were mainly deposited outside the mouth of Niutian Yang and Rongjiang River, and the surface sediments of Guang’ao Bay and Haimen Bay migrated in the northwest–southeast direction. After the 30 m isobath, the southeast corner of the study area migrated in the southeast–south direction. This sediment transport pattern revealed by the grain size migration trend is in good agreement with the physical and hydrodynamic conditions of the study area and provides an important reference for decisions regarding port dredging and waterway management in the area.

1. Introduction

Grain size is one of the basic properties of sediment, and grain size characterization is a classical sedimentological research method. The grain size distribution of sediment is mainly controlled by the transport medium, transport method and depositional environment. Therefore, the study of sediment grain size distribution can provide an understanding of the depositional environment in which the sediment is located [1,2,3] and is also a common tool for inferring sediment transport and dispersal trends [4,5,6]. Studying the variation in sediment grain size distribution characteristics in a region can reflect the characteristics of hydrodynamic conditions in the region, and the changes in sediment migration trends and sediment supply conditions [7,8,9,10]. The study of the transport and provenance tracing of marine sediments can also be explored through clay minerals [11], heavy minerals [12] and trace elements [13]. Clay mineral tracing is generally used for deep-sea environments, while heavy mineral tracing is more applicable to rivers and nearshore areas. Trace elements have a wider applicability, and the main factor controlling the content of major and trace elements is particle size. In addition, laboratory tracing experiments are valuable tools for understanding and identifying flow and transport processes [14]. The most commonly used tracing experimental devices include soil columns and sand tanks, which are used to study the transport and hydraulic characteristics of solutes (conservative and reactive) [15], thereby gaining a deeper understanding of the trends in material transport in aquatic systems.
Previous studies in the eastern part of Guangdong mainly focused on the periphery of Nan’ao Island and the rivers of Hanjiang and Rongjiang, considering sediment, shore evolution, hydrodynamic simulation, and siltation in Shantou Harbor. Li Pingri et al. [16] investigated the Hanjiang delta, and the results show that the decrease in the amount of sediment entering the sea due to the construction of dams in Hanjiang and Rongjiang, together with artificial land reclamation and other actions, reduced the tidal capacity in Rongjiang and accelerated siltation in Rongjiang. The sediment deposition outside the mouth gate of Niu Tian Yang and Rong River is faster, which has a serious impact on Shantou Port. Wang Zhongbo et al. [17]. analyzed the evolution of the sand spit and the barrier island deposition system in the mouth of the Lianyang River and concluded that the estuarine barrier sedimentary landforms have typical wind-formed sedimentary characteristics. Yan Xinxing et al. [18] analyzed the sediment transport in the near-shore area of the northern sea of Nan’ao, and the results show that the incoming sand and lateral sand transport in the near-shore area were weak and showed slow siltation. Wu Tiansheng et al. [19] conducted a simulation study on the flow field and sediment movement in the Han River estuary area and proposed that after the construction of a sand barrage at the mouth of Rongjiang River, the length of the estuary was extended and the coastal sand transport capacity and tidal dynamics under the wave action were weakened, but the incoming sand outside the mouth of Rongjiang River could be blocked. Chen Han et al. [20] analyzed the characteristics and migration trends of near-shore sediments in the Nan’ao sea area of Shantou, and the results show that the sediments in the area over a range of 10 m in water depth showed the obvious northeastward transport characteristics of the littoral line.
The study area is mainly composed of two rivers, the Han River and the Rong River. The Han River is the largest river in the region, with a total length of 470 km. According to the statistical data from the Chao’an station on the river, the annual water discharge into the sea is 25.095 billion cubic meters, with an annual sediment discharge of 4.9939 million tons. The multi-year average runoff is 774.54 m3/s, and the multi-year average sediment concentration is 24.79 kg/m3. The Rong River is the second largest river in Shantou City, with a length of 185 km. According to the statistical data from the Dongqiaoyuan station on the river, the annual water discharge into the sea is 2.821 billion cubic meters, with an annual sediment discharge of 473.1 thousand tons. The multi-year average runoff is 87.08 m3/s, and the multi-year average sediment concentration is 40.91 kg/m3. The Han River and the Rong River have six tributaries, namely the Yifengxi River, Lianyang River, Xinjin River, Waisha River, Meixi River, and Haojiang River. The Han River has a higher sediment content compared to the Dong River by 97%, the Qiantang River by 47%, and the Min River by 1.21 times. Although the drainage area of the Dong River is 10% larger than that of the Han River, its sediment transport is only 65.5% of the Han River. The drainage area of the Min River is twice as large as that of the Han River, but its annual sediment transport is only 98% of the Han River. This indicates that the Han River has a higher sediment transport, which has a significant impact on the sedimentary environment in the estuary area, especially on river channels, port terminals and marine aquaculture, all of which are related to sediment transport and deposition. There is extensive research on the dynamic sedimentation processes in tidal-controlled estuaries, such as the Yangtze River Delta, Red River Delta [21] and Fly River Delta [22]. These studies have revealed the role of tidal asymmetry and estuarine circulation in the formation of maximum turbidity zones and sediment trapping [23]. However, there is relatively limited research that combines the dynamic sedimentation processes with sediment characteristics, particularly in terms of utilizing sediment characteristics to infer the dynamics of sedimentation. The eastern region of Guangdong, as an underdeveloped economic zone, is influenced by various factors including cargo transportation, industrial structure, port throughput and marine utilization. Prior to this study, comprehensive geological environmental data of public and fundamental nature were not available for the entire region. Investigations were only conducted in specific or localized areas, and the analysis and transport trends of surface sediments had not been explored. Therefore, investigating the sedimentary environment in the study area is of vital importance for providing basic geological data to support the economic development of the region. As an underdeveloped economic region, the economic development of eastern Guangdong is influenced by various factors such as cargo transportation, industrial structure, port throughput and marine utilization. Prior to this, public and fundamental geological environmental data were not collected throughout the entire region, only in specific or localized areas. Analysis of surface sedimentation and transport trends has not been carried out. Therefore, investigating and studying the sedimentary environment in the research area is crucial for providing basic geological data to support the economic development of this region. In this paper, based on previous studies, we investigated the near-shore sea area of Shantou and some sea areas of Chaozhou and Jieyang, covering a wide range and a deeper depth, with an overall depth around the 30 m water depth line. The overall study of sediment type, grain size distribution characteristics and sediment transport direction in east Guangdong will not only help to understand the future development trend of the sedimentary environment in the area but also has important reference significance for the management of waterways, port construction, port siltation, resource development and environmental protection in the area.

2. Materials and Methods

The coastal waters of Eastern Guangdong are located in the northeast of Guangdong Province, at the border between Fujian and Guangdong. The study area mainly includes the coastal waters of Shantou City and parts of the coastal waters of Chaozhou City and Jieyang City, as well as areas with a water depth of less than 30 m. The geographic coordinates range from 22°45′00″ N to 23°40′00″ N and from 116°20′00″ E to 117°15′00″ E. It is an important node in the “Greater Bay Area” and the “Pan-Pearl River Delta” economic circle, as well as a crucial area for the “Maritime Silk Road”. The study area is located in the southeastern coastal magmatic arc of the Wuyi Mountain orogenic belt, facing the South China Sea to the south and the Taiwan Strait to the east. The geological formations belong to the eastern coastal region of Guangdong in the South China Stratigraphic Zone. In the Quaternary period, there have been inland fluvial deposits, sporadic coastal clastic deposits and beach rocks. The landforms are mainly delta plains, followed by hills and mountains, with fewer plateaus. The terrain slopes from northwest to southeast, with a sequence of hills–plains–sand ridges–islands. The coastal waters of the study area face the vast South China Sea, and the coastline on land extends in a northeast–southwest direction. Based on the characteristics of the sea area, the coastal waters are divided into two parts: the northern waters from Guang’ao Bay to Nan’ao Sea, and the southern waters from Guang’ao Bay to Haimen Bay. The tidal currents around Nan’ao Island are regular semidiurnal tidal currents, while the tidal currents near Haimen Bay are irregular semidiurnal tidal currents, with an average flood velocity of 0.48 m/s and an average ebb velocity of 0.42 m/s. In the summer, the average tidal range in the eastern Guangdong sea area is approximately 1.50 m, and the distribution characteristics of the average tidal range are generally consistent with historical data [24].
In 2020–2021, the Haikou Marine Geological Center conducted surface sediment sampling in the nearshore waters of eastern Guangdong. The sampling stations were set up uniformly according to the specifications (Figure 1). The surface sediment samples were collected using a clamshell sampler and sealed on-site for transportation to the laboratory. Surface samples of 0–1 cm were taken for grain size analysis. For samples with particle size < 2000 μm, a laser particle size analyzer (such as Malvern Mastersizer) was directly used for testing. The sample was uniformly mixed and approximately 2 g of dry sample was taken, diluted with water and 20 mL of sodium hexametaphosphate solution with a concentration of 0.5 mol/L was added. After 24 h of settling for full dispersion, the sample was tested using the analyzer. Testing was performed at 1/4φ intervals. To ensure accuracy, each sample was tested three times, and the average of the three results was taken. For samples with particle size > 2000 μm, they were first weighed, and then wet sieving was conducted using a sieve with a 1 mm aperture. The fine particles were analyzed using a laser particle size analyzer, while the coarse particles were analyzed using the traditional sieving method. The data from both parts were combined using a simulation program of the grain size analyzer to obtain the complete grain size distribution. The grain size classification followed the phi (φ) scale developed by Udden–Wentworth. The grain size parameters were calculated using the Folk–Ward equation [25]. Finally, the sediment was classified according to the Folk triangle graphic method specified in the “Specifications for Oceanographic Surveys” (GB/T12763-2007) [26].
The grain size parameters and sediment formation environments are well correlated [27,28]. To obtain grain size parameters using the graphic method, the commonly used particle size parameters include mean particle diameter (Mz), sorting coefficient (σi) and skewness (Ski). McLaren et al. [29] suggested that sediment migration trends must be correlated with the mean size, sorting coefficient and skewness of sediments and then McLaren and Bowles [30] proposed a model to explain the variation in sediment size parameters along the direction of transport. Gao and Collins et al. [31,32] improved McLaren’s method by extending it from one-dimensional to two-dimensional; this extended method is called the Gao–Collins method. This method has been successfully applied in several marine areas [33,34,35,36,37]. It has also been widely used in different marine environments such as estuaries, coasts, continental shelves, and submarine canyons [38,39,40,41,42]. The results are consistent with flow field observations, manual tracer experiments and geomorphological analysis. The analysis of sediment migration trends can be used to infer the transport of terrestrial material and its distribution and final deposition in the marine environment. In this paper, we used the Gao–Collins migration trend analysis method to analyze the transport direction of surface sediments in the study area by combining tidal waves and other dynamic factors [43]. The Gao–Collins method is a two-dimensional sediment grain size trend analysis model. By using the GSTA model, inputting grain size parameter data can yield vector data.

3. Results

3.1. Main Sediment Types and Distribution Characteristics

At present, the mainstream sediment classification methods are mainly the Sheppard sediment classification [44] and the Fock classification [45]. The advantage of the Sheppard classification is that it is descriptive and concise, with a classification triple-end meta-equivalence based on sand, silt and clay, but it does not consider the kinetic properties of sediments and lacks the interpretation of dynamic environmental significance. The aim of the Fokker classification is to classify sediment types by using the component ratio of sediment, which can reflect the changes in the sediment dynamics during the deposition process, emphasizing the significance of sediment transport and deposition mode in the classification. Sand generally consists of pushing and leaping components, whereas clay and silt mainly consist of suspended components, and the sand-to-mud ratio reflects two different component quantity ratios. Therefore, the Fokker classification is more meaningful for sediment dynamics interpretation. In this paper, the Fokker classification method is used to classify the sediments.
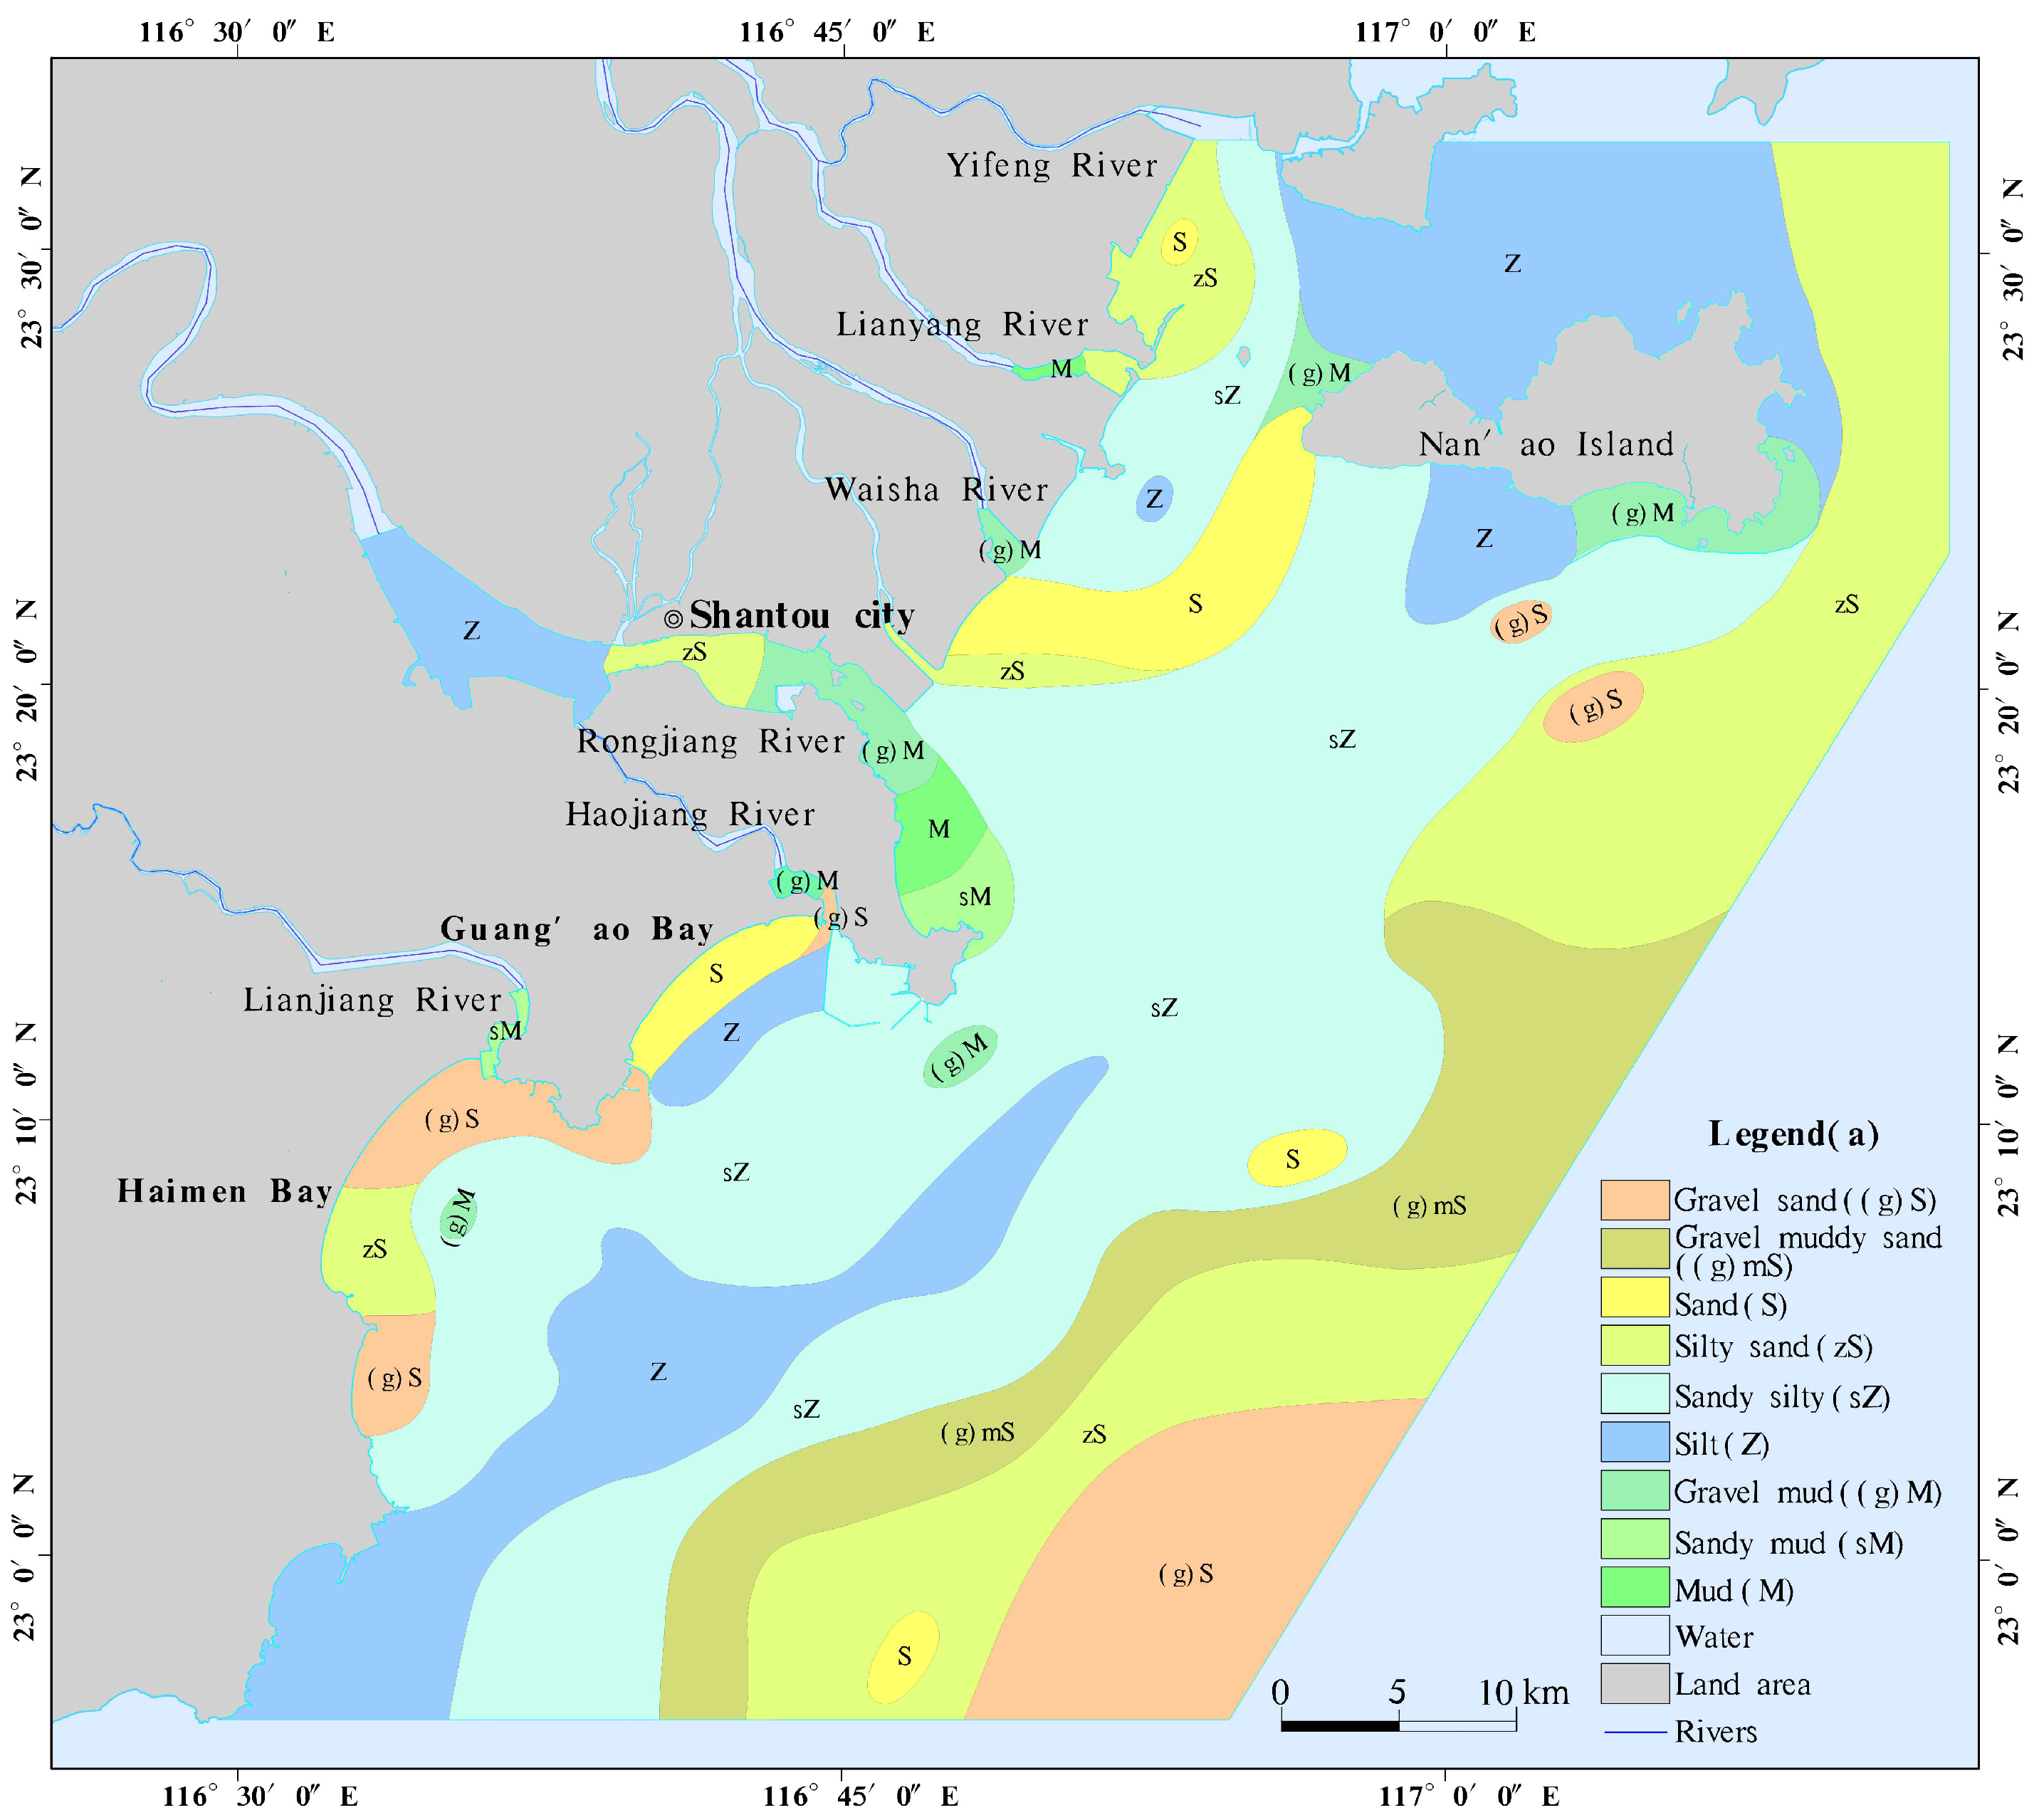
The sediment types in the study area mainly include gravel sand ((g)S), gravel muddy sand ((g)mS), gravelly mud ((g)M), sand (S), silty sand (zS), sandy silt (sZ) and silt (Z), and a small amount of sandy mud (sM) and mud (M). The grain size characteristics of each sediment type are shown in Table 1, and the distribution of sediment types is shown in Figure 2. The pebbled sand is mainly distributed in Haimen Bay and the southeast corner of the study area, indicating a strong hydrodynamic force in this area, with an average gravel content of 11.06% and an average sand content of 84.45%. The gravel muddy sand is mainly distributed in the area of 20–25 m water depth in the southeast corner of the study area, mainly composed of sand, with an average content of 64.48%. The sand is mainly distributed in the Houjiang waterway’s outer sand estuary, Guang’ao Bay, and sporadically in Liuhewei and part of the southeast corner. All of them belong to an area with strong hydrodynamic force and more frequent wave scouring. The main component is sand with an average content of 98.90%, and the overall sorting is good. The silty sand is mainly distributed in the E-SE side of Nan’ao Island, the estuary of the Lianyang River, the estuary of Xinjin Creek, the middle section of the Rongjiang River, and part of the southeast corner of the study area. It is distributed in a banded NE direction, and its hydrodynamic force is weaker than that of sand. Its main component is sand, with an average content of 66.05%. The sandy silt and silt account for the largest proportion of 54.42%, mainly distributed in most of the near-shore sea areas on the northern side of Nan’ao Island, the seashore of the mouth of the Rongjiang River, and Jinghai Bay. They are distributed in continuous sheets in the direction of NE–SW and are basically within 20 km from the shoreline with weak hydrodynamic force. These areas are also where a large amount of river sediment is deposited, the main component of which is silt, with an average content of 66.95%. The gravelly mud is mainly distributed at the mouth of Rong River, Outer Sand River and Hao River, and the southeast side of Nan’ao Island and Guang’ao Bay, indicating that the hydrodynamic force in this area is weak, and the main component is powder sand, with an average content of 57.77%. The sandy mud and mud are mainly distributed at the estuary of Lianjiang River, the estuary of Lianyang River and the area near the sand barrage at the outlet of Rongjiang River. The main component is silt with an average content of 52.53%, which indicates that the hydrodynamic force in these areas is weak, especially at the outlet of Rongjiang River. Because of the action of the sand bar, the wave and tide action are weakened, and the fine sediment of the river accumulates here.

3.2. Grain Size Component Characteristics

The surface sediment particles in the nearshore area of Guangdong are mainly divided into three grain size components, sand (−1φ~4φ, 2~0.063 mm), silt (4φ~8φ, 0.063~0.004 mm) and clay (>8φ, ≤0.004 mm), with relative percentages of 40.56%, 46.7% and 12.04%, respectively. In addition, there is a small amount of gravel, accounting for 0.7%. In the sand grades, very fine sand (3φ~4φ), fine sand (2φ~3φ) and medium sand (1φ~2φ) are mainly present, accounting for 10.21%, 15.09% and 9.82%, respectively, while coarse sand and very coarse sand are less abundant, accounting for 3.65% and 1.79%, respectively. In terms of the grade of silt, the content of fine silt (6φ~7φ) is the highest, at 25.14%, and the content of very fine silt, medium silt and coarse silt is comparable, at 7.85%, 5.09% and 8.62%, respectively.

3.2.1. Gravel Grain Level Component

The grain size interval of the gravel grain level component is <−1φ (>2 mm). According to the content of gravel fraction components, 89.2% of the samples have a gravel content of less than 1%, 7.6% of the samples have a gravel content between 1% and 5%, and only five samples have a gravel content of more than 5%. According to the distribution characteristics of the gravel content contour (Figure 3a), the overall gravel content in the area is very low, with an average value of 0.7%, and the relatively high values are mainly distributed at the promontory of Haimen Bay, the outlet of Lianjiang River, the outlet of Haojiang River, the vicinity of Pengdao on the south side of Nan’ao Island and the Houjiang Waterway. This indicates that these areas are in an erosion state. In particular, the headland of Haimen Bay, the waterway of Houjiang River and the vicinity of Pengdao Island are in a moderate erosion state, while the vicinity of the outlet of Lianjiang River and Haojiang River and the 30 m isobath are in a slight erosion state.

3.2.2. Sand Grain Level Component

The grain size range of the sand grain level component is −1φ~4φ (2~0.063 mm). According to the content of sand fraction components, there is 53 sand (sand content > 50%) sediment samples, accounting for 33.5%, and 81 samples of sand content < 30%, accounting for 51.2%. The sand content in the area is relatively high, with an average of 39.57%.
According to the distribution characteristics of the sand content contour (Figure 3b), the sand content in the area varies greatly. The high-value area is mainly distributed in Houjiang waterway (outer sand estuary), Guang’ao Bay, Haimen Bay and the area above 20 km from the shoreline, with a gradually increasing trend from northwest to southeast. The low-value area is mainly striped from Nan’ao Island—the mouth of Rongjiang River—to Jinghai Bay, with sand content basically less than 20%. The area above 20 km from the shoreline is mainly sandy because river sediment cannot reach here. The low-value area is mostly distributed in the estuary outlet and near-shore area, indicating that river sediment is mainly deposited in this area.

3.2.3. Silt Grain Level Component

The grain size range of the silt grain level component is 4φ~8φ (0.063~0.004 mm). According to the content of silt fraction components, there are 113 samples with silt content >35%, accounting for 71.5%, while there are 18 samples with silt content <1%, accounting for 11.4%. From the whole area, the average content of silt is the highest, accounting for 46.69%.
According to the distribution characteristics of the silt grain level content contour (Figure 3c), it can be seen that the high-value areas are mainly distributed near Nan’ao Island, the outlet of Rongjiang River, Guang’ao Bay, Haimen Bay, Laiwu Island and the outlet of Yifeng Creek. The overall distribution characteristics are related to hydrodynamic factors. The high-value content area of the silt grain level is NE-SW, which is consistent with the wave and isobath direction, indicating that the deposition of the silt grain level is mainly due to wave and tidal action. The content of all river estuary sections and seaside sections outside the mouth is approximately 30~50%, indicating that the deposition of silt grain level is only a small amount at the estuary.

3.2.4. Clay Grain Level Component

The grain size range of the clay grain level component is greater than 8φ (<0.004 mm). According to the content of clay fraction components, the average clay content is 12.03%, and the number of samples with clay content <5% is 48, accounting for 30.4%. Among them, the number of samples with no content is 28, accounting for 17.7%. The content of most samples is between approximately 5% and 25%, and the number of samples is up to 92, accounting for 58.2%.
According to the distribution characteristics of clay content contour (Figure 3d), the high clay content area in the region is mainly in the Lianyang River–Laiwu Island, the estuary section of rivers, the north side of Nan’ao Island and the sand barrage at the mouth of Rongjiang River, and the clay content gradually decreases from the northwest to the southeast. Above 20 km from the shoreline, the clay content is close to 5% and gradually decreases to 0. From the Houjiang waterway to the outer sand estuary is a low-value area, the clay content is basically 0. This indicates that the hydrodynamic force is strong in this area, and the fine-grained sediments cannot be deposited here.

3.3. Grain Size Parameter Characteristics

Grain size parameters are quantitative representations of the grain size characteristics of the clastic material in terms of certain values. The individual grain size parameters and their combined characteristics can be used as the basis for discriminating the depositional hydrodynamic conditions and depositional environment. The commonly used parameters are mean particle diameter (Mz), sorting coefficient (σi) and skewness (Ski).

3.3.1. Mean Grain Size Distribution Characteristics

The mean grain size represents the concentrated trend of sediment grain size distribution; that is, the grain size of the debris material generally tends to be distributed around an average value, which can be used to reflect the average kinetic energy of the deposition medium. In the process of transporting the debris particles, as the transporting capacity decreases, the coarse-grained material settles first, and the fine-grained material migrates to the hydrostatic and low-energy environment to be deposited. The high-value area (>7φ) represents the hydrostatic and low-energy equivalence deposition environment. The low-value area of the average grain size (<5φ) represents the turbulent and high-energy hydrodynamic environment. Additionally, the intermediate value area (5φ~7φ) in between represents the transition area.
According to the average particle size frequency distribution, the average particle size is 4.94φ. The number of samples with a mean grain size of <5φ is 67, accounting for 42.4%; the number of samples with a mean grain size between 5φ and 7φ is 81, accounting for 51.3%; the number of samples with a mean grain size of >7φ is 10, accounting for 6.3%. This indicates that nearly half of the area belongs to the transition area, more areas belong to the turbulent high-energy hydrodynamic environment, and very few areas belong to the hydrostatic low-energy environment. According to the average particle size of the sample, the average particle size contour map of the surface sediments in the sea area was created (Figure 3e), which shows that the high-value areas (low-energy environments >7φ) are mainly distributed in the northern part of Nan’ao Island, the estuary section of Lianyang River and the outlet of Yifeng Creek, and their distribution is consistent with the range of areas with a high percentage content of clay grain level components. The relative high-energy environment (<5φ) in the study area is mainly distributed to the Houjiang waterway (outer sand estuary), Guang’ao Bay, Haimen Bay, and the sea area above 20 km from the shoreline, which corresponds to the high-value of sand grain content. All tidal waterways exhibit the characteristics of changing from a coarse to fine grain size from the mouth to the open water.

3.3.2. Distribution Characteristics of Sorting Coefficient

The sorting coefficient reflects the uniformity of sediment grain size and is often used as an environmental indicator, which can better distinguish various depositional environments and is closely related to hydrodynamic conditions. The sorting coefficients of the samples in the region range from 0.44 to 3.78. According to the classification criteria of the sorting coefficients by Focke–Ward (Table 2), the number of samples distributed between 0.35 and 0.71 is 18, accounting for 11.39%; the number of samples with sorting coefficients between 0.71 and 1 is 11, accounting for 6.96%; the number of samples with sorting coefficients between 1 and 4 is 129, accounting for 81.6%. This indicates that most of the samples were poorly sorted, and a few were well sorted.
According to the distribution map of equivalent contour lines for the selectivity coefficient (Figure 3f), it can be observed that the areas with moderate and good selectivity include Guang’ao Bay, Haimen Bay, Jinghai Bay, the sand dam outside Rongjiang estuary and the estuary of Waisha River. Among them, the bay area shows better selectivity due to its strong hydrodynamic conditions and high sediment reformation capacity, resulting in better sand selectivity. On the other hand, the sand dam outside the Rongjiang estuary, the estuary of Waisha River and the outlet of the Outer Shahe River show better selectivity due to weak hydrodynamic conditions, leading to a significant deposition of suspended sediment, which contributes to better selectivity. Other areas are characterized by poor selectivity, with complex hydrodynamic conditions and sediment deposition at various particle sizes, resulting in lower selectivity.

3.3.3. Skewness Distribution Characteristics

The skewness can be used to identify the symmetry of the particle size distribution, which essentially reflects the degree of asymmetry of the particle size distribution and indicates the relative position of the mean and median particle sizes and is one of the common particle size parameters used in the analysis of depositional environments. The frequency curve can be divided into three categories according to the symmetry of the frequency curve. Positive state: the percentage content of the coarse and fine grain sizes on both sides of the peak decreases in line with each other, forming a symmetry curve with the peak state as the symmetry axis, which indicates good sediment sorting. Positive skew state: the curve form is asymmetric, the peak is skewed to the coarse size side and there is a low tail on the fine grain side, which means that the sediment contains mainly coarse components and the sorting is poor. Negative skew state: the curve form is asymmetric, the peak is skewed to the fine size side and there is a low tail on the coarse grain side, which means that the sediment contains mainly fine components and the sorting is poor, which reflects the energy variation in the deposition process. The study of skewness is useful for understanding the genesis of sediments, and the distribution of skewness in the study area ranges from −0.34 to 0.67. According to the skewness grading (Table 3), the number of near-symmetric samples is 79, accounting for 50%; the number of positively skewed samples is 47, accounting for 29.7%; the number of negatively skewed samples is 32, accounting for 20.2%.
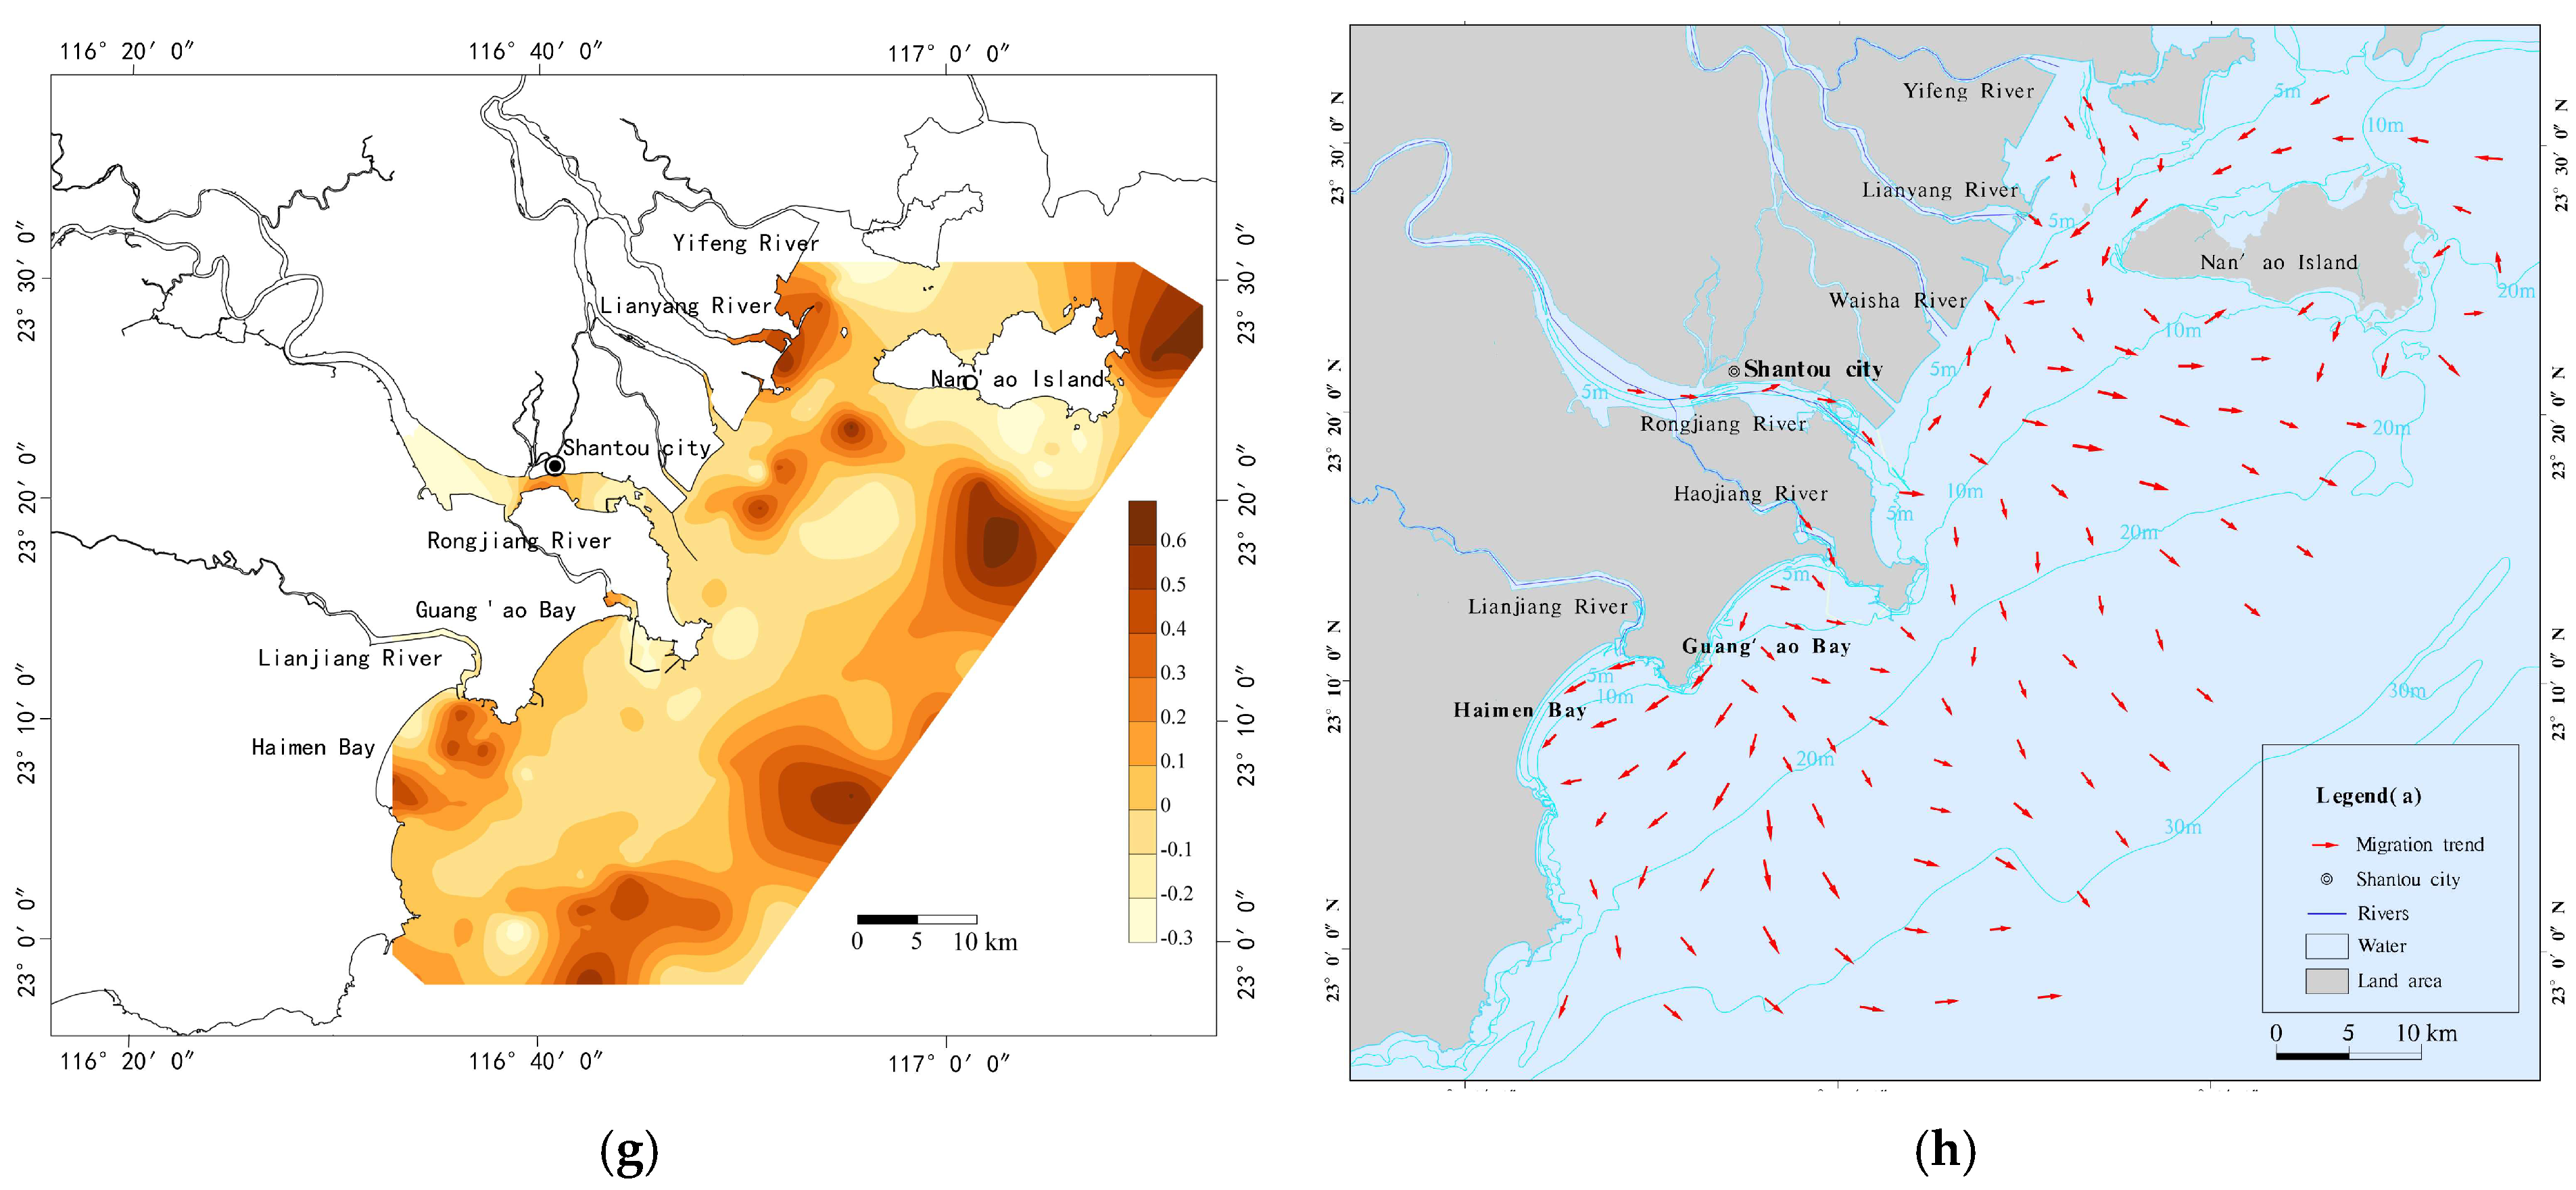
According to the distribution map of equivalent contour lines for skewness (Figure 3g), it can be observed that the nearly symmetrical areas include the north side of Nan’ao Island–Yifeng River Estuary, the south side of Nan’ao Island and the coastal area of Rongjiang Estuary–Guang’ao Bay–Haimen Bay, which belongs to hydrodynamically complex but relatively calm regions. The highly positively skewed areas are found in the coastal area of Lianyang River Estuary, the southeast side of Nan’ao Island, Haimen Bay, Houjiang Waterway and the sea areas beyond 20 km from the shoreline, showing a trend of low nearshore elevation and high offshore elevation, corresponding to the deposition of sand-sized sediments. The highly negatively skewed areas are located at the mouth and outlet of Rongjiang River, the outlet of Haojiang River and the south side of Nan’ao Island. These areas are characterized by weak hydrodynamic forces and generally correspond to the deposition of clay-sized sediments.

3.4. Analysis of Surface Sediment Migration Trends

This study shows that the incoming sand from the Han River has been the main source of slow siltation in eastern Guangdong for a long time, due to the influences of the secondary fronts of the Han River estuary flushing freshwater and sand transport by the coastal current of the South China Sea. After entering the sea, the sediment of the Hanjiang River is deposited in the near-shore sea area due to the NE-SW tidal and wave action. The NE-SW coastal current carries the sediment to be deposited in the north of Nan’ao Island and the near-shore sea area of Haimen Bay and Guang’ao Bay, gradually forming the trend of the sediment gradually becoming coarser from shore to land. The pattern of sediment center is shifted SE due to the influence of the coastal current.
Sediment grain size parameters often change along the sediment transport process due to physicochemical effects, so the net sediment migration trend can be inverted by extracting and analyzing the information on the spatial distribution of grain size in the study area. McLaren et al. [30] proposed that due to selective initiation, transport and accumulation along the sediment transport direction, the average grain size will become finer, better sorted and more skewed. The average grain size will become coarser, better sorted and more negatively skewed, satisfying the two scenarios in Table 4.
σ, μ and Sk are abbreviations for sorting coefficient (σi), mean grain diameter (Mz), and skewness (Ski). Gao Shu (2009) [32] proposed a two-dimensional analysis method based on these parameters, called the Gao–Collins two-dimensional sediment grain size trend analysis model. In this method, the average grain diameter, sorting coefficient and skewness of sediment at adjacent sampling points are compared. Type 1 represents sediment with improved sorting, finer grain size and more negative skewness in the transport direction (σA < σB, μA < μB, SkA > SkB), while Type 2 represents sediment with improved sorting, coarser grain size and more positive skewness in the transport direction (σA < σB, μA > μB, SkA < SkB). If either of these two conditions are met, a sediment transport vector from position A to position B can be defined. Using this method, sediment transport trend vectors (dimensionless unit vectors) between any sampling point and its neighboring points can be obtained. The characteristic distance Dcr is used to determine if two sampling points are adjacent. If the distance between two sampling points is smaller than Dcr, they are considered adjacent; otherwise, they are not (Dcr is usually set as the maximum sampling interval). The sediment transport vectors at the point are then summed to obtain the total sediment transport vector at that point. The obtained grain size trend vector is averaged with the grain size trend vectors of neighboring points to eliminate noise and derive the sediment transport trend in the study area. This method has been applied in bays, intertidal zones, straits, flood plains, coastlines, and other continental shelf areas. The results are in good agreement with flow field observations, tracer experiments and geomorphological features indicative of sediment transport patterns.
The sampling depth of the sediments in this study was mainly within 10 cm of the surface layer, and the minimum long-term deposition rate (1–6 cm/a) of the Hanjiang Estuary and adjacent sea areas was calculated. The sediments in the study area mainly represented a time scale of less than 10 years. When using the grain size trend analysis method, the calculation results are mainly influenced by the size of the characteristic distance (Dcr) when the location and number of sampling points are given. In the specific calculation process, several possible comparison distances are often used one by one, and the clearest one is selected as the final calculation result by comparing each result. After repeatedly comparing the calculation results at different distances, it was determined that the number of disordered vectors in the results was the lowest at the characteristic distance of 6 km, which can reflect the net sediment transport characteristics more clearly (Figure 3h). The vector arrows in the figure indicate the direction of net sediment transport, and the vector length only indicates the significance of the sediment migration trend, but not the magnitude of the transport rate. Although the detailed characteristics of sediment transport cannot be shown due to the large spacing of sampling points in the study area, it does not affect the overall sediment migration trend. It can be seen from the figure that the surface sediment has a significant migration trend and migrates from east to west on the north side of Nan’ao Island. The sediment migrates southward from the Houjiang waterway after integrating the sediment of the Lianyang River and Yifeng River. Some sediment migrates to the south side of Nan’ao Island through the coastal flow, and most of it migrates SE after crossing the Houjiang waterway. The transport trend is quite significant until the 20 m isobath and another part of the sediment is migrated to the Laiwu Island–Rongjiang River crossing. The sediment is accelerated by the dual influence of Laiwu Island and the sand barrage of the Rongjiang River, and the overall transport trend is from northwest to southeast. After passing through the sand barrage, the sediments of Rongjiang River mainly migrated to the east, partly to the south and a little to the north, until the 30 m isobath migration trend gradually decreased.
The direction of sediment transport in Haojiang River in Guang’ao Bay is from river to sea and to the southeast at the mouth of the port. This is related to the construction of the Guangao Wharf, which changes the hydrodynamic force of the wharf. The river flows into the sea along the tidal dike of the wharf, and the seawater on the west side carries sediment from west to east under the traction of the river, resulting in a change in the migration direction of the sediment. The direction of sediment migration in Haimen Bay is consistent, and the overall direction is NE-SW. When sediment migrates to the southwest headland, it begins to migrate to the south. The sediment migrating from the two bays basically migrates in the SE direction when it reaches the 20 m isobath, and there is no major change in the direction of the 20–30 m isobath. After the 30 m isobath, the surface sediment migrates from SE to E. At this time, the influence of coastal currents and rivers on sediment is less, being more strongly influenced by tidal currents and wind waves. In the open sea, the tidal currents and wind waves are basically SE-NW, so the sediment migration direction will change at the 30 m isobath.

4. Discussion

The main factors affecting the characteristics and migration trend of surface sediments in the coastal waters of eastern Guangdong are climate, ocean dynamics, river dynamics, geomorphological conditions and geological conditions. The specific influence of each factor is as follows.

4.1. Climatic Factors

Eastern Guangdong is located in the monsoon south subtropical region, with the Tropic of Cancer passing through the central part of Shantou City. The annual average temperature in the study area is 23.1 °C, the annual high temperature allows frost-free snow, the temperature difference between day and night is small, the extreme temperature amplitude is not large and the rainfall is abundant. The average annual rainfall is 1528 mm. Precipitation is mainly concentrated in summer, and the rain is hot in the same period. According to seasonal statistics, the precipitation from January to March accounts for 10% of the whole year, from April to June accounts for 42%, from July to September accounts for 41% and from October to December accounts for 7%. The seasonal distribution of precipitation is basically consistent with the distribution of runoff and sediment. Such climatic conditions are conducive to the chemical weathering of rocks, forming a deep weathering crust. The products of weathering enter the river and sea, increasing the content of sediment in the water and accelerating the change in surface sediments.
The predominant influence on the Shalong area in the coastal waters is mainly the effect of wind. The normal NEE wind is consistent with the direction of coastal Shalong in the study area, so it can play a more effective role in modifying and prolonging the influence on Shalong. The maximum wind direction in each month in the area is mainly NE wind, and the frequency of easterly wind (including NNE-SSE) is 56%. The coast of the study area exhibits a NE-SW trend. The normal NEE wind in winter and summer is generally parallel to the coast, which promotes the WS-trending coastal current to transport the sediment from the Beixi River, Waisha River and Xinjin River to the SW direction. The SE-trending normal wind in summer meets the high sediment concentration flood from NS to SE in flood season. Therefore, the wind waves from SE tend to block the sediment output from the river near the entrance, and the diversion of waves makes the sediment migrate along the coast. Therefore, the underwater sand dams in the study area are developed in the NE-SW direction, and the distribution direction of sediments in the coastal waters is also the same.
The transportation of sediment in the nearshore area of the study area is directly influenced by the Asian monsoon season [46]. According to the average monthly wind speed and direction records from the Shantou station (see Table 5), the dominant wind direction in the study area is NEN for most months, with a frequency of 18% throughout the year. From October to April of the following year, the frequency remains above 20% [12]. The frequency of easterly winds (including NNE–SSE) reaches 56%, with an average wind speed of 2.7 m/s. The coastal region of the study area extends in an NE–SW direction. In winter and spring, the prevailing NEE winds parallel to the coast contribute to the transportation of sediment from the Beixi, Waisha River and Xinjinxi outlets towards the southwest direction. This is consistent with the trend analysis model of sediment transport. A portion of the sediment is transported to the mouth of Shantou Bay by tidal currents (which are strongest during winter and spring tides), leading to enhanced deposition within the bay. In summer, the prevailing SE winds coincide with the flood period, when highly sediment-laden floods flow downstream from north to south. As a result, the winds coming from the southeast often obstruct the sediment discharged by rivers near the estuary. The wave action redirects the sediment along the coastline, resulting in the development of underwater sand bars in the NE–SW direction in the study area. The distribution directions of different sediment types also follow this pattern.

4.2. Ocean Dynamical Factors

Sediments are transported, accumulated and dispersed by tides, currents and waves, such that the sediments change with these aspects. The tidal range in the study area is small. The average annual tidal range of Mayu Station is 1.02 m, and the average tidal range of Nan‘ao Island is 1.22 m. The annual average tidal range of each month exhibits few differences, and the seasonal change is not significant, so the tidal effect is not significant. The average flood tide duration in Mayu Island is 7 h 6 min, and the ebb tide duration is 5 h 24 min. According to previous data [12], the flood tide duration in the study area is significantly greater than the ebb tide duration. The bottom flood tide duration is longer than the surface flood tide duration. The bottom flood tide duration in Shantou Bay is up to 17 h, and the obvious difference between the surface and bottom flood tide durations causes the bottom to be dominated by water inflow and the surface to be dominated by water outflow. The coastal current in the study area can be divided into two types: coastal current and tidal current. The coastal current in the study area flows from SW to NE in June and July, and flows from NE to SW in the remaining 10 months, indicating that the coastal density current basically flows to SW. The flow direction of the surface coastal current is basically consistent with the prevailing wind direction in the sea area, and the study area is adjacent to the Taiwan Strait, which is deeply affected by the beam tube effect of the strait airflow. The NE wind is relatively strong, especially in winter. The velocity of the coastal current is 0.5~0.8 SI in winter and 0.3~0.4 SI in spring. The velocity of the NE-trending coastal current in summer is approximately 0.3~0.4 SI, and the velocity of the SW-trending coastal current in autumn is 0.4~0.6 SI. Due to the longest duration of the southwest-trending coastal current, it has the greatest impact on the coastal sediment transport in the study area. The tidal current has the nature of rotational flow, and the changes in velocity and flow direction are different due to different seasons and landforms. In summer, the flood current is biased towards NE and the ebb current is biased towards SW. The flood current is biased towards NW in winter, and the ebb current is generally biased towards SE. In general, the ebb current does not have an obvious advantage, indicating that the influence of runoff at the sea outlet is weak, and the ocean dynamics such as tidal current, coastal current and wave are the main forces shaping the characteristics of surface sediments. In winter, the wave direction is mainly east and NE, while in summer, the wave direction is mainly southeast. These wave directions just obliquely intersect with the 2 m and 5 m isobaths of the coastline, and the wave energy along the coast points to SW, resulting in the development of coastal sand banks in the offshore area along the NE-SW direction; the current direction of coastal sediment transport is also the same.

4.3. River Dynamic Factors

The characteristics of sediment content in the study area are rich river runoff, rapid water collection, serious soil erosion, high sediment content, uneven time distribution and an uneven distribution of runoff in the middle and lower reaches. The proportion of river branches in the Hanjiang River is 48.78% in the Xixi River (Meixi River, Xinjin River, and Waisha River), 43.51% in the Dongxi River (Waisha River) and 7.71% in the Beixi River (Yifengxi River). The average annual runoff of the Hanjiang River is 800.3 m3/s, and the average annual sediment concentration is 0.35 kg/m3. The average annual runoff of Rongjiang is 92.57 m3/s, and the average annual sediment concentration is 0.31 kg/m3. The characteristics of sediment transport in the study area are mainly the large sediment content of rivers, most of which have been deposited in the estuary and nearshore. The sediment content in the nearshore area is low, and the sediment content has no obvious seasonal variation. The sediment content in the bottom layer is often higher than that in the surface layer, and the sediment transport in the flood tide is also higher than that in the ebb tide. Combined with tides and currents, sediment is easy to deposit at the estuary.

4.4. Geomorphological Factors

One of the boundary conditions that affect the characteristics of sediments is geomorphological factors, which play a restrictive role and are mainly affected by the fourth row of islands, underwater topography and artificial landform.
The influence of the fourth archipelago: The fourth archipelago is located between the NE-trending Nan‘ao fault zone and the Shantou–Raoping fault, which is located on the outer edge of the delta. It is mainly composed of islands, such as Haishan Island, Fengyu Island, Dalaiwu, Xiaolaiwu, Mayu and other islands, which play a certain role in providing a barrier against the external effects of sea, wind and waves. In Zhelin Bay–Fengyu Island, Nan‘ao Island and Haishan Island sheltered the east and northeast from wind and waves, deposited relatively fine-grained material and developed branch rivers. These islands not only blocked the wind and waves in the South China Sea, but also had a great impact on the coastal current. The coastal current in eastern Guangdong is SW-trending except for June–August. The barrier of the island to the coastal current makes the Beixi River and Zhelin Bay more likely to deposit sediment. The Guang‘ao Peninsula has a certain blocking effect on the long-term wind waves (SEE) in summer, and has a significant effect on the NE-trending coastal current in summer, making the surface sediments of the Guang‘ao Bay coarser.
The influence of underwater topography: There is an underwater deep trough (Nan‘ao Trough) with a depth of approximately 13 m between Nan‘ao Island and Laiwu Island. The slope of the northwest slope of the deep trough is 4.2 × 10⁻³, which is approximately 10 times the slope of the shoal. The slope of southeast slope is very steep due to the influence of the cliff of Nan‘ao Island, reaching 8.4 × 10⁻³, which is twice as large as the north slope. The deep trough belongs to the coastal current scouring trough, which restricts the development of the shoal at Yifeng River. Due to the reclamation, the channel at the deep trough becomes narrower, the flow velocity increases, the overall scouring becomes stronger and the surface sediment particles are coarser.
The influence of artificial landforms: Through the artificial river embankment, the current river is constrained and the riverbed expands. The riverbed of the Hanjiang River is higher than the plains on both sides and has become the ground river. At the same time, it forces a large amount of sediment to the entrance and the seashore outside the entrance, which is conducive to the deposition of underwater shoals, but not conducive to the construction and maintenance of ports and waterways. Reclamation mainly occurs in the form of river beach and branch reclamation, which has had a significant impact on the development of modern rivers. Reclamation plays a role in artificially promoting siltation, destroying the balance of erosion and siltation and accelerating the siltation in the river. The reclamation of the river beach makes the river channel close and changes the balance of erosion and deposition, which is conducive to water and sand attack, maintaining the straight and smooth flow of the river channel and brush of the downstream river channel.

4.5. Geological Factors

Mainly owing to tectonic movement, due to the variable intensity of tectonic activity, the number of river bifurcations is different. The number of East River bifurcations is greater, and the number of West River bifurcations is smaller; due to the strong degree of river bifurcation and erosion, the North River near the shore does not easily form a coastal region in Shalong. The Nan‘ao deep trough is mainly related to the Nan’ao fault zone, and it also limits the future development of the Beixi and Dongxi deltas. Active modern tectonic activities can aggravate soil erosion, increase sediment transport and increase sediment input into the ocean.

5. Conclusions

(1)
The sediment types in the study area are mainly gravel sand ((g)S), gravel muddy sand ((g)mS), gravelly mud ((g)M), sand (S), silty sand (zS), sandy silt (sZ) and silt (Z), and a small amount of sandy mud (sM) and mud (M). The relative percentages of gravel, sand, silt and mud were 0.7%, 40.56%, 46.7% and 12.04%, respectively. The average grain size varied between approximately −2φ and 8φ, with a mean value of 4.94φ. The selection coefficient varied between 0.44~3.78, with a mean value of 1.8. The skew distribution ranged from −0.34 to 0.67, with a mean value of 0.07.
(2)
There are two main factors influencing the distribution of sediment in the research area. On one hand, there are external driving forces that play a dominant, active and influential role, including climate factors (temperature, precipitation and wind), ocean dynamics (tides, currents, and waves) and river dynamics. On the other hand, there are internal driving forces, including geomorphic and geological factors, which exert constraining effects as relatively static and indirect factors.
(3)
The trend of surface sediment transport is significant, and the north side of Nan’ao Island is oriented from east to west. The sediment of the Yifeng River is mainly deposited in the sand spout at the mouth of the Lianyang River. After being transported southward from Houjiang Waterway, it mainly migrates to the southeast, and the trend is quite significant until the trend gradually decreases at the 20 m isobath. The sediment of the Rong River is mainly deposited outside the mouth of Niutian Yang and Rong River, and the surface sediment of Guang’ao Bay and Haimen Bay is oriented from northwest to southeast. After the 30 m isobath, the southeast corner of the study area migrates in a southeast–south direction.
(4)
The sediment transport pattern expressed by the grain size migration trend is in good agreement with the hydrodynamic conditions of the study area, which confirms the previous studies on sediment transport and sources in the area. It can provide a basis and reference for decisions regarding channel dredging, wharf site selection, port construction and mariculture in the area. For example, in terms of channel dredging, it is necessary to clean not only the navigational channel but also the heavily silted areas around the channel (such as the northeast side of the Rongjiang estuary and both sides of the sand barrier). When selecting a location for a dock, areas of sediment accumulation should be avoided, such as the cape on the north side of Haimen Bay; the northeast and southeast sides of Nan’ao Island would be better options.

Author Contributions

Conceptualization, L.X.; Methodology, H.W.; Software, Y.W.; Validation, Y.W.; Investigation, X.W.; Resources, X.W.; Data curation, S.W.; Writing—original draft, H.W.; Writing—review and editing, L.X. and S.W. All authors have read and agreed to the published version of the manuscript.

Funding

This research was funded by the Comprehensive Survey of Natural Resources in Haichengwen Coastal Zone: DD20230414, and Chaoshan Coastal Zone Comprehensive Geological Survey Project, China, grant number DD20208013.

Institutional Review Board Statement

Not applicable.

Informed Consent Statement

Not applicable.

Data Availability Statement

The data are unavailable due to privacy.

Conflicts of Interest

The authors declare no conflict of interest.

References

  1. Jiang, M. Grain size analysis and geological application. J. Oil Gas Technol. 2009, 31, 161–163. [Google Scholar]
  2. Xiao, C.; Li, Z. The research summary of grain size analysis and its application in the sedimentation. J. Xinjiang Norm. Univ. Nat. Ed. 2006, 3, 118–123. [Google Scholar]
  3. Shi, X. Basic parameters and research process of marine sedimentary environment. Mar. Sci. 1992, 6, 30–33. [Google Scholar]
  4. Rodriguez, A.B.; Rodriguez, P.L.; Fegley, S.R. One-year along-beach variation in the maximum depth of erosion resulting from irregular shoreline morphology. Marine Geol. 2012, 291–294, 12–23. [Google Scholar] [CrossRef]
  5. Warrick, J.A.; George, D.A.; Gelfenbaum, G.; Ruggiero, P.; Kaminsky, G.M.; Beirne, M. Beach morphology and change along the mixed grain-size delta of the dammed Elwha River, Washington. Geomorphology 2009, 111, 136–148. [Google Scholar] [CrossRef]
  6. Vousdoukas, M.; Velegrakis, A.; Karambas, T. Morphology and sedimentology of a microtidal beach with beachrocks: Vatera, Lesbos, NE Mediterranean. Cont. Shelf Res. 2009, 29, 1937–1947. [Google Scholar] [CrossRef]
  7. Yuan, P.; Bi, N.; Wu, X.; Zhang, Y.; Wang, H. Spatial distribution characteristics of modern Yellow River Delta surface sediments. Marine Geol. Quatern. Geol. 2016, 36, 49–57. [Google Scholar]
  8. Liu, J.; Li, A.; Xu, Z. Grain size characteristics of sediments in Bohai Bay since the Holocene. Mar. Sci. 2006, 30, 60–65. [Google Scholar]
  9. Yang, X.; Feng, X.; Chu, Z.; Fan, D.; Dong, A. Grain size characteristics of surface sediments and their depositional environment on the eastern shelf of China. J. Ocean Univ. China Nat. Sci. Ed. 2012, 42, 126–134. [Google Scholar]
  10. Liu, Q.; Xiang, L.; Zhang, G.; Ouyang, K. Characteristics of surface sediment distribution and its controlling factors in the abandoned Yellow River estuary in northern Jiangsu Province. Mar. Geol. Quat. Geol. 2018, 38, 118–126. [Google Scholar]
  11. Feng, L.; Feng, X.; Song, S.; Xiao, X.; Tian, D. Analysis of particle size and distribution characteristics of surface sediments and the transport trend in Laizhou Bay. Mar. Sci. 2018, 42, 1–9. [Google Scholar]
  12. Li, P.; Huang, Z.; Zong, Y.; Zhang, Z. Hanjiang Delta; Ocean Publishing House: Beijing, China, 1987. [Google Scholar]
  13. Ge, Q.; Xue, Z.G.; Ye, L.; Xu, D.; Yao, Z.; Chu, F. Distribution Patterns of Major and Trace Elements and Provenance of Surface Sediments on the Continental Shelf off Western Guangdong Province and Northeastern Hainan Island. J. Ocean Univ. China 2019, 18, 849–858. [Google Scholar] [CrossRef]
  14. Hou, Y.S.; Wu, J.C.; Jiang, J.G. Time Behavior of Anomalous Solute Transport in Three-Dimensional Cemented Porous Media. Soil Sci. Soc. Am. J. 2019, 83, 1012–1023. [Google Scholar] [CrossRef]
  15. Ma, Z.; Dai, Z.; Zhang, X.; Zhan, C.; Gong, H.; Zhu, L.; Wallace, C.D.; Soltanian, M.R. Dispersivity variations of solute transport in heterogeneous sediments: Numerical and experimental study. Stoch. Environ. Res. Risk Assess. 2021, 36, 661–677. [Google Scholar] [CrossRef]
  16. Li, P.; Huang, Z.; Zong, Y. The Han River Delta; Ocean Press: Beijing, China, 1987. [Google Scholar]
  17. Wang, H.; Wang, Y.; Wang, H.; Luo, X.; Mai, Y.; Huang, X.; Wang, Z. Progress of research on barrier sedimentation system and prospects of barrier island research in China. J. Shantou Univ. Nat. Sci. Ed. 2022, 37, 3–12+2. [Google Scholar]
  18. Yan, X.; Liu, G.; Cai, J. Characterization of coastal dynamic geomorphology of coal port project of Chaozhou Three Hundred Gate Power Plant. Waterw. Port 2004, 25, 38–44. [Google Scholar]
  19. Wu, T.; Chen, R.; Wu, X.; Dong, Z. Experimental study on the tidal sediment model of Han River estuary management planning scheme. People’s Pearl River 2007, 28, 35–38. [Google Scholar]
  20. Chen, H.; Chen, Z.; Yan, W.; Li, L.; Liu, J.; Huang, W.; Li, G. Grain size characteristics of surface sediments and their migration trends in Shantou nearshore waters. J. Sedimentol. 2014, 32, 314–324. [Google Scholar]
  21. Do Minh Duc, M.T.N.; Van Ngoi, C.; Nghi, T.; Tien, D.M.; van Weering, T.C.; van den Bergh, G.D. Sediment distribution and transport at the nearshore zone of the Red River delta, Northern Vietnam. J. Asian Earth Sci. 2007, 29, 558–565. [Google Scholar]
  22. Ogston, A.S.; Sternberg, R.W.; Nittrouer, C.A.; Martin, D.P.; Goñi, M.A.; Crockett, J.S. Sediment delivery from the Fly River tidally dominated delta to the nearshore marine environment and the impact of El Niño. J. Geophys. Res. Atmos. 2008, 113, F01S11. [Google Scholar] [CrossRef] [Green Version]
  23. Burchard, H.; Schuttelaars, H.M.; Ralston, D.K. Sediment trapping in estuaries. Annu. Rev. Mar. Sci. 2018, 10, 371–395. [Google Scholar] [CrossRef] [PubMed]
  24. Huang, L.; Shen, P.; Liu, C.; Tan, Y. General Report on the Comprehensive Survey and Evaluation of the Offshore Ocean of Guangdong Province; Ocean Press: Beijing, China, 2017. [Google Scholar]
  25. Folk, R.L.; Ward, W.C. Brazos River bar: A study in the significance of grain size parameters. J. Sediment. Petrol. 1957, 27, 3–26. [Google Scholar] [CrossRef]
  26. GB/T 12763.8-2007; Marine Survey Specification Part 8: Marine Geological Geophysical Survey. General Administration of Quality Supervision, Inspection and Quarantine of the People’s Republic of China: Beijing, China, 2007; pp. 1–79.
  27. Yang, S. Statistic features for grain-size parameters of the Yangze River Estuary and their hydrodynamic explanation. J. Sediment Res. 1994, 3, 23–31. [Google Scholar]
  28. Wu, A. The characteristics of grain-size parameters of till and their relation to sedimentary environments. J. Glaciol. Geocryol. 1983, 5, 47–53. [Google Scholar]
  29. McLaren, P. An Interpretation of Trends in Grain Size Measures. J. Sediment. Res. 1981, 51, 611–624. [Google Scholar]
  30. McLaren, P.; Bowles, D. The effects of sediment transport on grain-size distributions. J. Sediment. Res. 1985, 55, 457–470. [Google Scholar]
  31. Shu, G.; Collins, M. The use of grain size trends in marine sediment dynamics: A review. Chin. J. Oceanol. Limnol. 2001, 19, 265–271. [Google Scholar] [CrossRef]
  32. Gao, S. Grainsize trend analysis: Principle and applicability. ACTA Sedimentol. Sin. 2009, 5, 826–836. [Google Scholar]
  33. Chen, Z. Characteristics of modern sedimentary environment and sediment transport patterns in Shuidongbay, western Guangdong. Tropic Oceanol. 1996, 15, 6–13. [Google Scholar]
  34. Ren, J.; Liu, P.; Dai, Z. Characteristics of bottom sediment and sediment transport patterns in Hailing bay, western Guangdong. J. Oceanogr. Taiwan Strait 2001, 20, 96–100. [Google Scholar]
  35. Cheng, P.; Gao, S. Net sediment transport patterns over the northwestern Yellow Sea, based upon grain size trend analysis. Oceanol. Limnol. Sin. 2000, 31, 604–615. [Google Scholar]
  36. Liu, Z.; Yang, Y.; Chen, J.; Wang, A.J.; Li, D.Y.; Wang, Y.P. Sediment distribution and deposition rate in the Xiamen Bay and adjoining waters. Mar. Sci. 2012, 36, 1–8. [Google Scholar]
  37. Jia, Y.; Ke, X.; Xu, Y.; Wang, Y. Sedimentary transport trends of within a sand Bar/Lagoon system in the Bohaisea. Mar. Sci. 1999, 3, 56–59. [Google Scholar]
  38. Cheng, P.; Gao, S.; Bokuniewicz, H. Net sediment transport patterns over the Bohai Strait based on grain size trend analysis. Estuar. Coast. Shelf Sci. 2004, 60, 203–212. [Google Scholar] [CrossRef]
  39. Balsinha, M.; Fernandes, C.; Oliveira, A.; Rodrigues, A.; Taborda, R. Sediment transport patterns on the Estremadura Spur continental shelf: Enlightenment of particle size trend analysis. J. Sea Res. 2014, 93, 28–32. [Google Scholar] [CrossRef]
  40. Liang, J.; Liu, J.; Xu, G.; Chen, B. Grain-size characteristics and net transport patterns of surface sediments in the Zhejiang nearshore area, East China Sea. Oceanologia 2020, 62, 12–22. [Google Scholar] [CrossRef]
  41. Wang, C.; Chen, M.; Qi, H.; Intasen, W.; Kanchanapant, A. Grain-Size Distribution of Surface Sediments in the Chanthaburi Coast, Thailand and Implications for the Sedimentary Dynamic Environment. J. Mar. Sci. Eng. 2020, 8, 242. [Google Scholar] [CrossRef] [Green Version]
  42. Liu, J.T.; Liu, K.J.; Huang, J.C. The effect of a submarine canyon on the river sediment dispersal, and inner shelf sediment movements in southern Taiwan. Mar. Geol. 2002, 181, 357–386. [Google Scholar] [CrossRef]
  43. Gao, S.; Collins, M. Sediment grain size trends and marine sediment dynamics. China Sci. Found. 1998, 4, 1. [Google Scholar]
  44. Shepard, F.P. Nomenclature Based on Sand-silt-clay Ratios. J. Sediment. Res. 1954, 24, 151–158. [Google Scholar]
  45. Folk, R.L.; Andrews, P.B.; Lewis, D.W. Detrital sedimentary rock classification and nomenclature for use in New Zealand. N. Z. J. Geol. Geophys. 1970, 13, 937–968. [Google Scholar] [CrossRef] [Green Version]
  46. Liu, Z. Clay minerals in sediment of the South China Sea: Indications of East Asian monsoon evolution history? Acta Sedimentol. Sin. 2010, 28, 1012–1019. [Google Scholar]
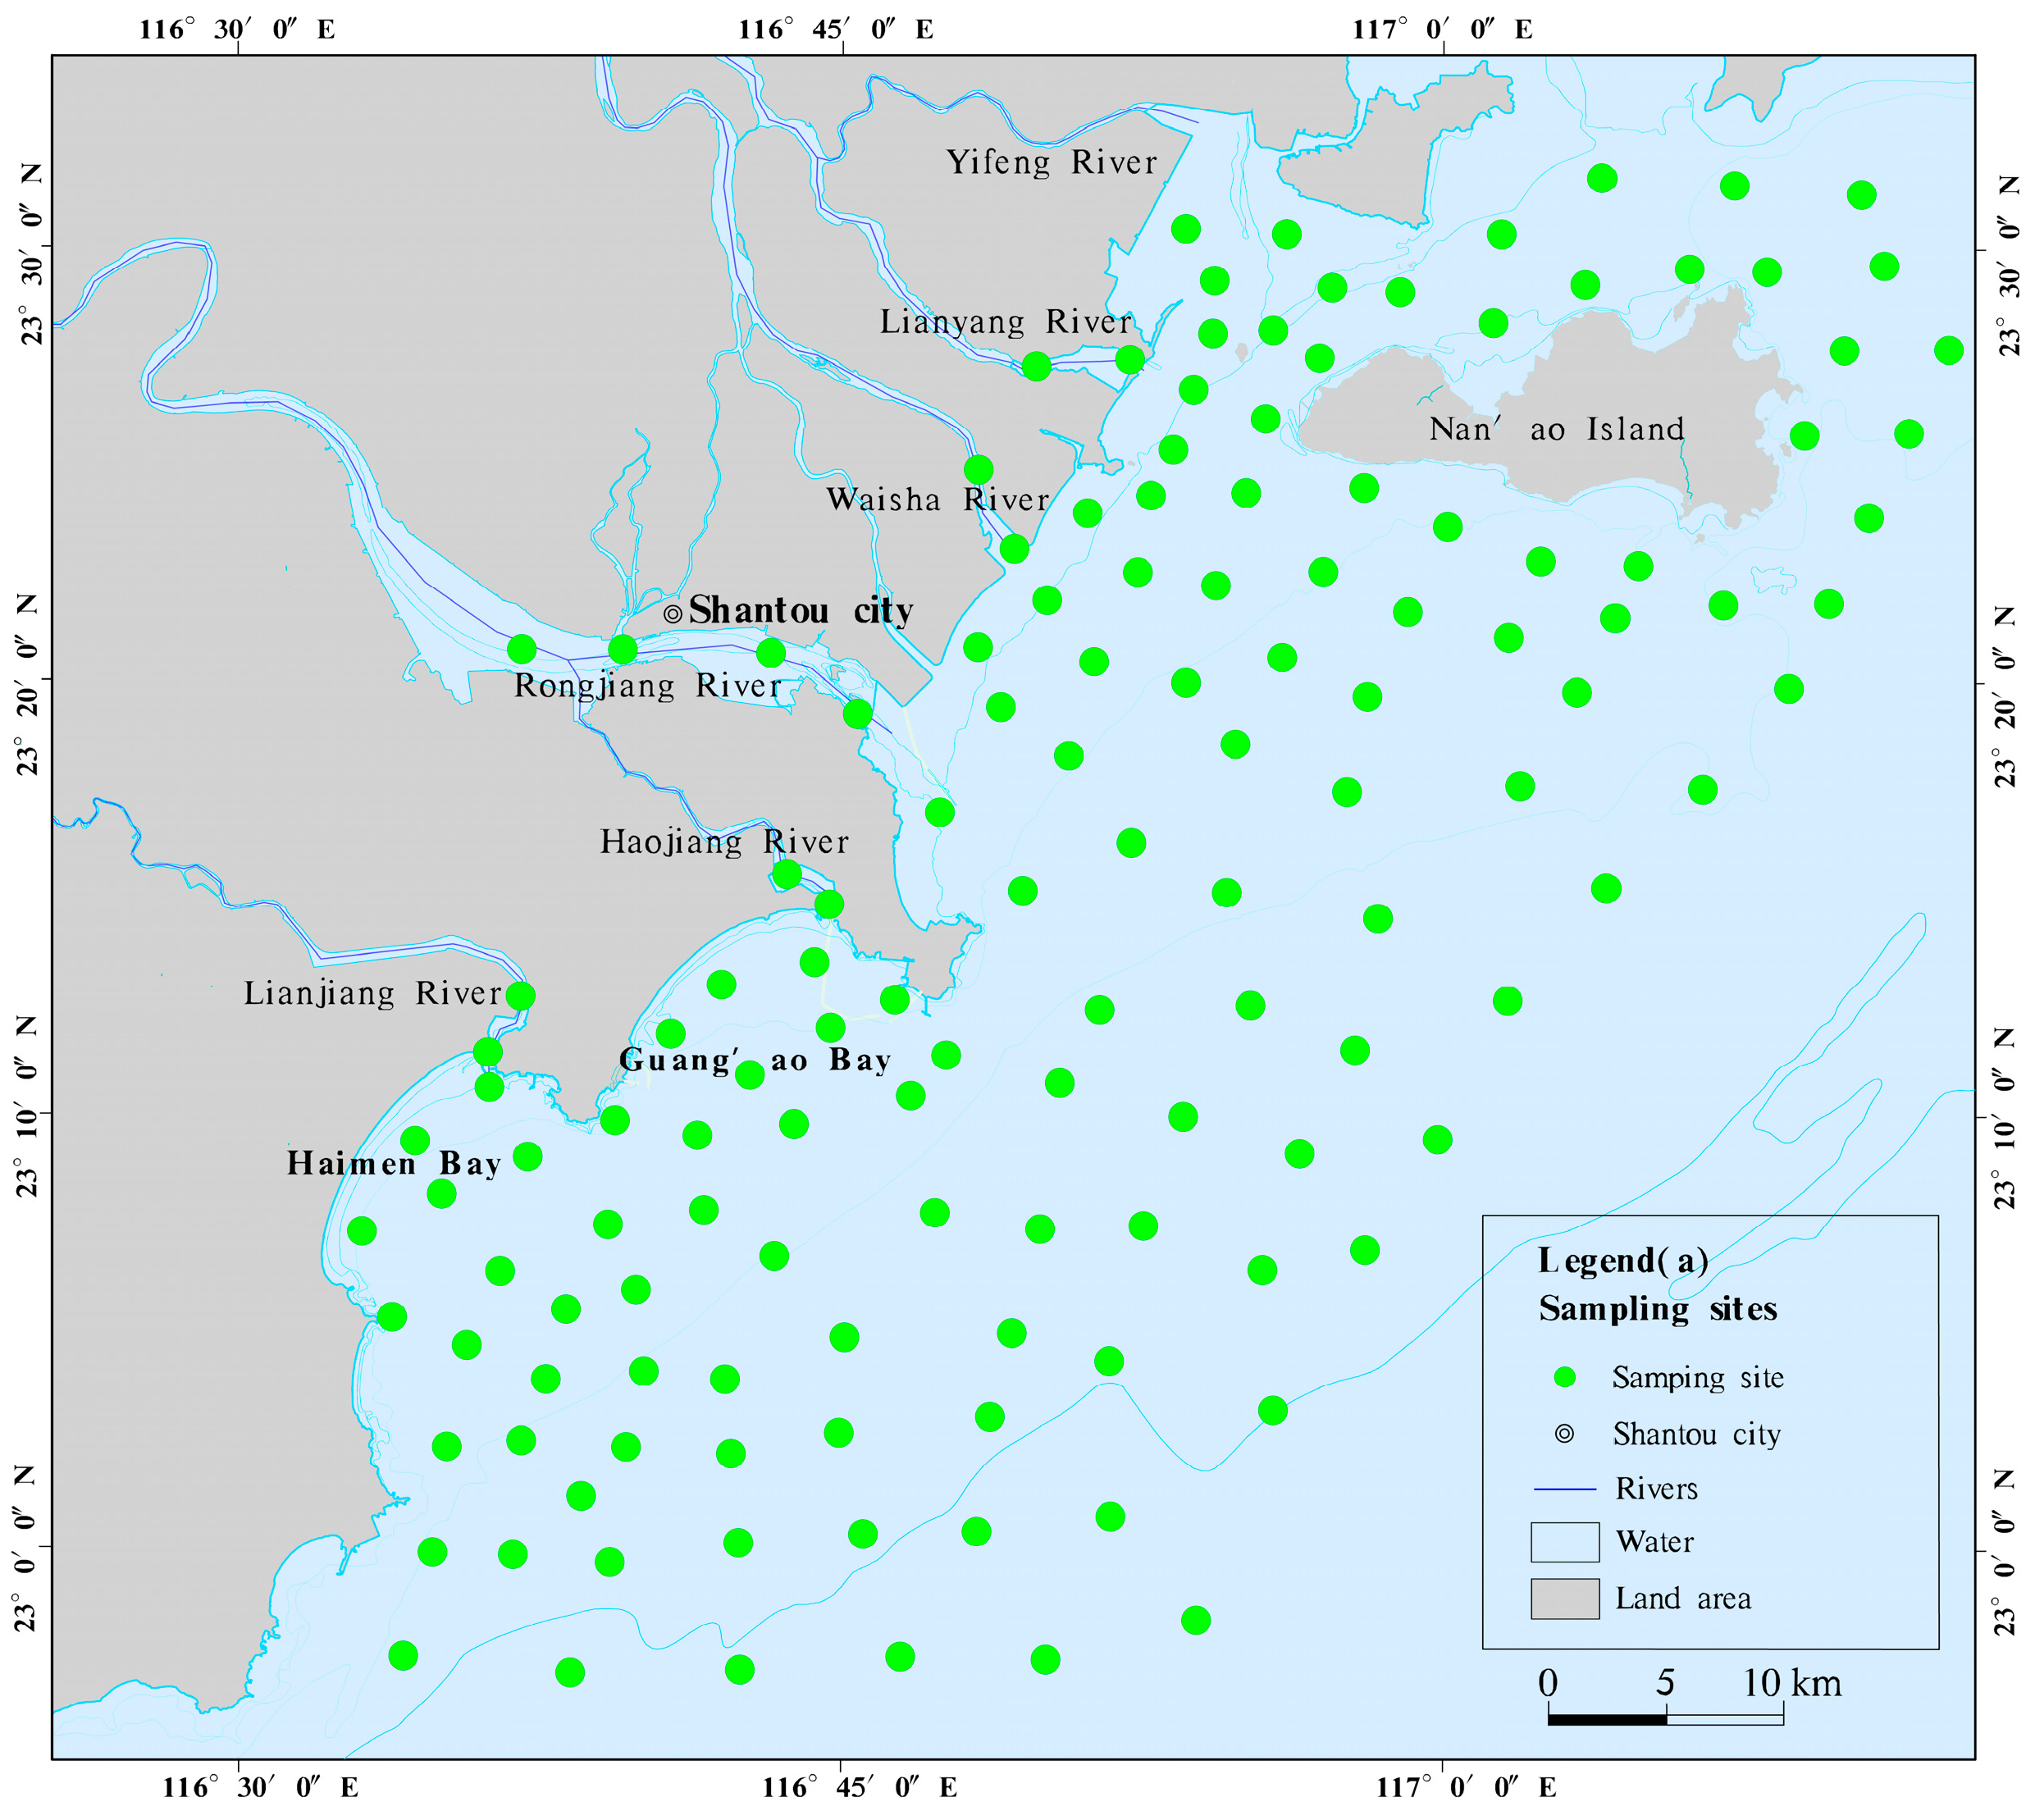
Figure 1. Location of the study area and station distribution.
Sustainability 15 11069 g001
Figure 2. Distribution of sediment types.
Sustainability 15 11069 g002
Figure 3. (a) Distribution of gravel grain level percentage content; (b) distribution of sand grain level percentage content; (c) distribution of percent content of silt grade; (d) percentage content distribution of clay grain size; (e) contour map of mean grain size (φ); (f) contour plot of sorting coefficient; (g) skewness contour map; (h) long-term migration trend of surface sediments in the study area.
Sustainability 15 11069 g003aSustainability 15 11069 g003b
Table 1. Surface sediment type grain size characteristics.
Sediment TypeCharacteristic ValueGrain Size Composition%Grain Size Parameter
GravelSand Powder SandClayMean Particle Diameter
(Mz)
Sorting Coefficient
(σi)
Skewness
(Ski)
Gravel sandMin0.1499.860.000.001.140.80−0.01
Max4.2295.780.000.001.091.01−0.23
Average1.4993.245.230.021.821.470.00
Gravel muddy sandMin0.2669.0326.943.773.592.690.61
Max1.9949.9843.824.224.491.130.04
Average1.0464.4830.803.653.431.970.38
Gravelly mudMin0.0528.0039.1032.856.530.86−0.16
Max0.1310.7874.5514.546.601.55−0.34
Average0.8322.7957.7718.606.022.140.09
SandMin0.0091.257.441.312.281.150.35
Max0.00100.000.000.001.960.470.03
Average0.0098.900.920.102.030.620.02
Silty sandMin0.0051.9142.675.424.202.370.36
Max0.0089.7510.250.002.560.450.27
Average0.0066.0528.565.423.662.030.48
Sandy siltMin0.0010.0063.3426.656.761.93−0.128
Max0.0048.0446.085.864.462.390.11
Average0.0025.8460.1813.945.682.000.01
SiltMin0.002.0174.7823.217.041.40−0.008
Max0.009.9864.9525.076.682.180.04
Average0.006.1273.7220.156.731.590.00
Sandy mudMin0.0012.3456.9030.766.922.480.06
Max0.0030.4638.5830.966.403.22−0.08
Average0.0020.6948.4730.826.652.820.07
MudMin0.003.9751.0844.957.300.44−0.04
Max0.004.8762.0833.057.512.170.12
Average0.004.4256.5839.007.401.300.04
Table 2. Sorting level table.
Sorting GradeSorting Coefficient (φi)
Sorting excellent<0.35
Sorting good0.35~0.71
Sorting medium0.71~1.00
Sorting poor1.00~4.00
Sorting very poor>4.00
Table 3. Skewness grading table.
Skewness GradingSkewness (Ski)
Extremely negative bias−1~−0.3
Negative skew−0.3~−0.1
Nearly symmetric−0.1~+0.1
Positive skew+0.1~+0.3
Extremely positive bias+0.3~+1
Table 4. Grain size trend types using the 3 parameters of average grain size, sorting coefficient and skewness.
Grain Size Trend TypeDefinition
1σA < σBμA < μBSkA > SkB
2σA < σBμA > μBSkA < SkB
Table 5. The average wind speed (m/s) and wind direction for each month at Shantou Station.
MonthJanuaryFebruaryMarchAprilMayJuneJulyAugustSeptemberOctoberNovemberDecemberYear
Average wind speed2.93.13.02.62.52.52.62.32.62.82.92.82.7
Predominant wind direction for each monthENEENEENEENEENESSWSSWESEENEENEENEENEENE
Frequency20262621171110101424232118
Disclaimer/Publisher’s Note: The statements, opinions and data contained in all publications are solely those of the individual author(s) and contributor(s) and not of MDPI and/or the editor(s). MDPI and/or the editor(s) disclaim responsibility for any injury to people or property resulting from any ideas, methods, instructions or products referred to in the content.