Article

Optimizing Human Performance to Enhance Safety: A Case Study in an Automotive Plant

by
Maria Chiara Leva
1,*,
Micaela Demichela
2,
Carlos Albarrán Morillo
2,
Franco Modaffari
3 and
Lorenzo Comberti
2
1
School of Environmental Health, Technological University Dublin, D07ADY7 Dublin, Ireland
2
SAfeR—Centro Studi su Sicurezza, Affidabilitàe Rischi, Dipartimento Scienza Applicata e Tecnologia, Politecnico di Torino, 10129 Torino, Italy
3
IVECO Group, Via Puglia, 35, 10156 Torino, Italy
*
Author to whom correspondence should be addressed.
Sustainability 2023, 15(14), 11097; https://doi.org/10.3390/su151411097
Submission received: 2 March 2023 / Revised: 30 May 2023 / Accepted: 13 June 2023 / Published: 16 July 2023
(This article belongs to the Special Issue Human and Organizational Factors in Complex Systems)

Abstract

:
Human factors play a relevant role in the dynamic work environments of the manufacturing sector in terms of production efficiency, safety, and sustainable performance. This is particularly relevant in assembly lines where humans are widely employed alongside automated and robotic agents. In this situation, operators’ ability to adapt to different levels of task complexity and variability in each workstation has a strong impact on the safety, reliability, and efficiency of the overall production process. This paper presents an application of a theoretical and empirical method used to assess the matching of different workers to various workstations based on a quantified comparison between the workload associated with the tasks and the human capability of the workers that can rotate among them. The approach allowed for the development of an algorithm designed to operationalise indicators for workload and task complexity requirements, considering the skills and capabilities of individual operators. This led to the creation of human performance (HP) indices. The HP indices were utilized to ensure a good match between requirements and capabilities, aiming to minimise the probability of human error and injuries. The developed and customised model demonstrated encouraging results in the specific case studies where it was applied but also offers a generalizable approach that can extend to other contexts and situations where job rotations can benefit from effectively matching operators to suitable task requirements.

1. Introduction

Emerging technologies in the manufacturing domain, such as robotics, the Internet of things (IoT), and big data, are already reshaping workloads, workstations, and work organisations.
One of the most expected effects of this revolution is represented by a dramatic change in the labour market. Several authors have foreseen a strong reduction in the number of workers employed in traditional jobs with low skill requirements [1]. This loss is partially balanced by increasing requests for new skillsets and professions related to the design, implementation, and maintenance of these new tools [2]. This revolution is evolving at varying speeds across different sectors, and there are also notable examples of new applications in nonmanufacturing and unconventional areas, such as advanced surgery [3]. On the other hand, the application of industrial robots in manufacturing has become well established [4]. The automotive industry, for example, is a sector where robotics has been utilized since the 1980s and coexists with assembly lines that still require various degrees of manual tasks performed by workers [5]. The interaction between workers and semiautomated workstations therefore has a relevant influence on production efficiency, error rates, and safety performance. Human and organizational factors are crucial elements for ensuring reliability and safety in applications areas where humans and automation work in close collaboration. It is therefore necessary to monitor and assess this interaction to avoid and mitigate any possible unwanted events [6]. Quality experts often need to consider human factors (HFs) in connection with the key causes of deviations from procedures where errors have been detected [7], and HF methods can be deployed in workflow analyses, the design of a safe system of work [8] to reduce occupational health and safety issues, and for productivity improvements [9]. The assembly lines used in automotive manufacturing are often organised as a series of workstations, in which a shell is moved from one station to the next in an automated way according to a throughput rate that is called “takt time”. In all workstations a task is performed on the shell according to a detailed process devised to optimize time and costs [10]. An operator would need to allocate varying amounts of mental and physical resources to tasks such as analysing information, recalling items from memory, making decisions, and executing manual tasks on the shell, depending on the specific task.
In this configuration, the matching of workers, considering their individual skills and resources, to specific workspaces, characterized by different levels of complexity and variability, can lead to significant variance in terms of production effectiveness and safety performance [11].
In fact, when a worker and task are poorly matched, it means that an operator may lack the necessary skillsets or sufficient mental and physical resources to perform well according to the requirements of the task. This can result in an increased likelihood of human errors and higher levels of fatigue experienced by a worker, which in turn can also potentially manifest itself in unsafe actions [12], injuries, and/or work-related illness.
Generally, assembly line work is often perceived as requiring relatively low skill profiles, and the workers are often allocated to different workstations based on shift demands and the personal judgment of an assembly line supervisor [13]; however, the paradigmatic changes in manufacturing may change this situation as well. In this sense there is an emerging need to provide transparent and clear guidance or an approach for a good match between operators and workstations. The present study decided to adapt a recently developed human performance model (HPm), called the TERM (task execution reliability model) [14]. TERM is a framework that has been adopted to assess human error in assembly tasks, utilizing an adapted version of the Rasch model, which is widely used for human performance and human factor assessment in many areas [15]. In a 2013 study, Osman et al. [16] used a Rasch model to characterize students’ ability during industrial training to provide an assessment of their performance. A Rasch model allows researchers to convert categorical scale results from observations into a logit scale, thereby obtaining an assessment of ability for each attribute on a linear interval scale. In 2019, Jacob et al. [17] used a Rasch model to classify the difficulty of each test and the corresponding level performance of nursing trainees. Thus, a Rasch model provides a reliable and repeatable measurement instrument for competency assessment implementation in training areas [15]. In this work, the model was adapted to assess and compare, along a linear interval scale, the skills and/or mental/physical difficulties posed by the task of an assembly line and the skills and capacities demonstrated by each operator assigned to it. This process was applied to explore the possible combinations of workers and workstations, providing a more objective approach to support human resource allocation [18]. The focus of this paper is to provide a detailed description of how the TERM was applied in a case study conducted at a medium-vehicle-size assembly plant. The idea was prompted by the fact that the plant reported issues in relation to their safety performance despite the adoption of a safety management system [19] and the promotion of a corporate safety target. The rate of injuries, medical treatment, and absenteeism related to the working activity became a serious problem that had a substantial impact in terms of efficiency and cost. A collaborative project with plant managers, shift supervisors, and the operators was then initiated with the aim of improving safety performance through the optimization of HR with the support of the TERM.
The results have been used by plant managers to rearrange the distribution of workers. A positive impact on safety performance has been obtained. The following sections of the paper will discuss how the TERM was adapted to the case study, what interim results were attained, what the limits are of the approach, and the opportunities for future development.

2. Materials and Methods

The TERM was based on the fundamental hypothesis that the result of the contest between a specific task and skills can be included in the concept of human performance (HP), which is directly dependent on two macrofactors [20]: workload (WL), which is the macrofactor summarising all of the variables contributing to the physical and mental demands required to perform a given task (it should also consider aspects related to work environments, such as temperature, noise, lighting conditions, etc.), and human capability (HC), which is a factor that summarises the cognitive and physical skills a worker needs in order to perform his/her task [21].
The TERM can be broken down into the five following steps. Figure 1 summarises the steps of the developed research framework:
  • Conceptual model design;
  • Operational model design;
  • Data field collection;
  • HP assessment;
  • Application.
Figure 1 reports the main steps of the underpinning conceptual model that were followed in this study.
The first step, the “Conceptual Model” design, aimed to identify the factors that influence human capabilities and workload. To identify the relevant variables to be included in the model, the authors conducted a literature review, which was supported by an evaluation of the working conditions at the various workstations. Additionally, a task analysis [18] of the operational activities in each of the assembly lines of the studied workstations was performed.
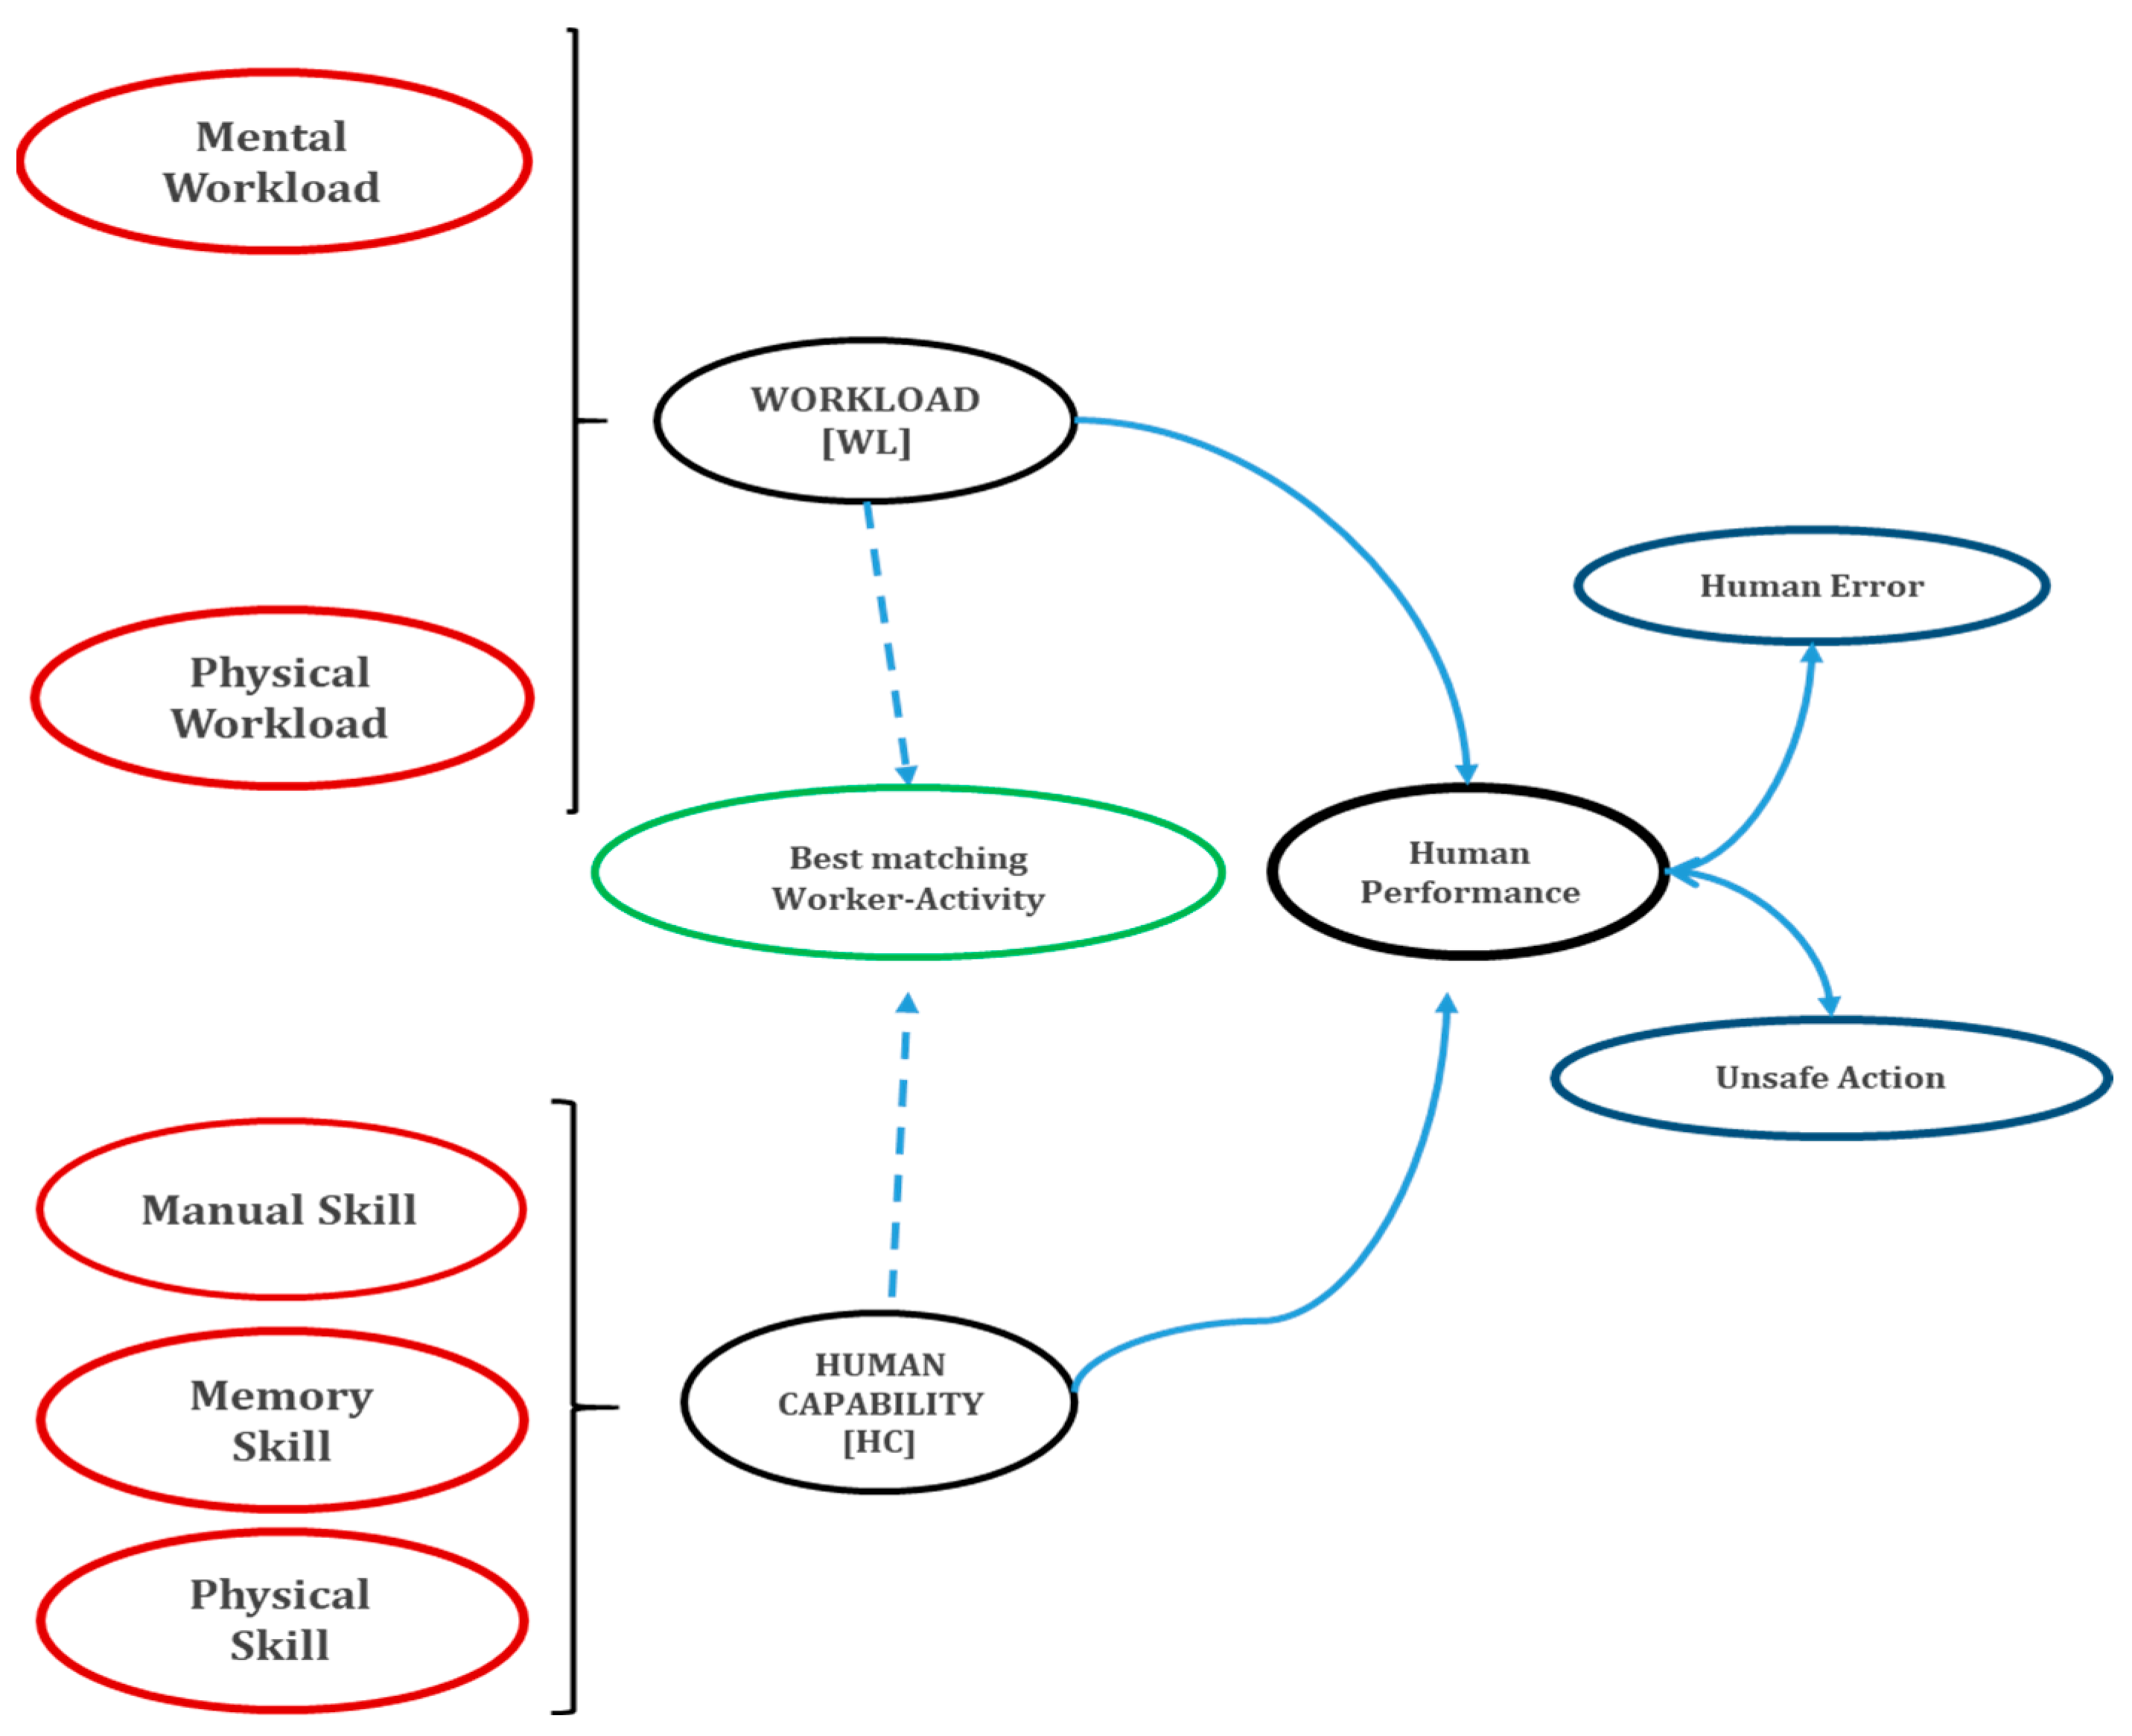
With reference to the conceptual model in Figure 2, the element called human capability represents the resources a worker can offer to complete a task under a set of environmental conditions. Based on the project’s objectives and the operational requirements of the case study, the literature indicates that a wide range of human skills are linked to the performance of manual tasks; however, for the purpose of summarizing the workload (WL) requirements associated with each specific task, three primary areas have been identified.
First and foremost, manual skills, such as precision, manual handling, and coordination, are consistently required in assembly tasks. Secondly, memory plays a crucial role, encompassing the ability to accurately recall and execute sequential steps, as well as identify various parts of different assembly tasks. Lastly, physical skills are of the utmost importance, involving the ability to sustain consistent performance throughout a shift and effectively cope with the pace of operations.
In the conceptual model for Human Performance assessment the concept of Workload (WL) consists of two main contributors: “Mental Workload” (MW) and “Physical Workload” (PW). PW can be related to the physical efforts required to perform a task. Workstations with weak ergonomic features, demanding uncomfortable postures, or heavy loads have been found to decrease performance over time [23]. Static activities and repetitive actions have been identified as precursors to lower performance and potential occupational accidents [24,25]. While MW is associated with the cognitive efforts required by the task due to its complexity or any intellectual or memory demand. The following variables have been identified as characterising WL:
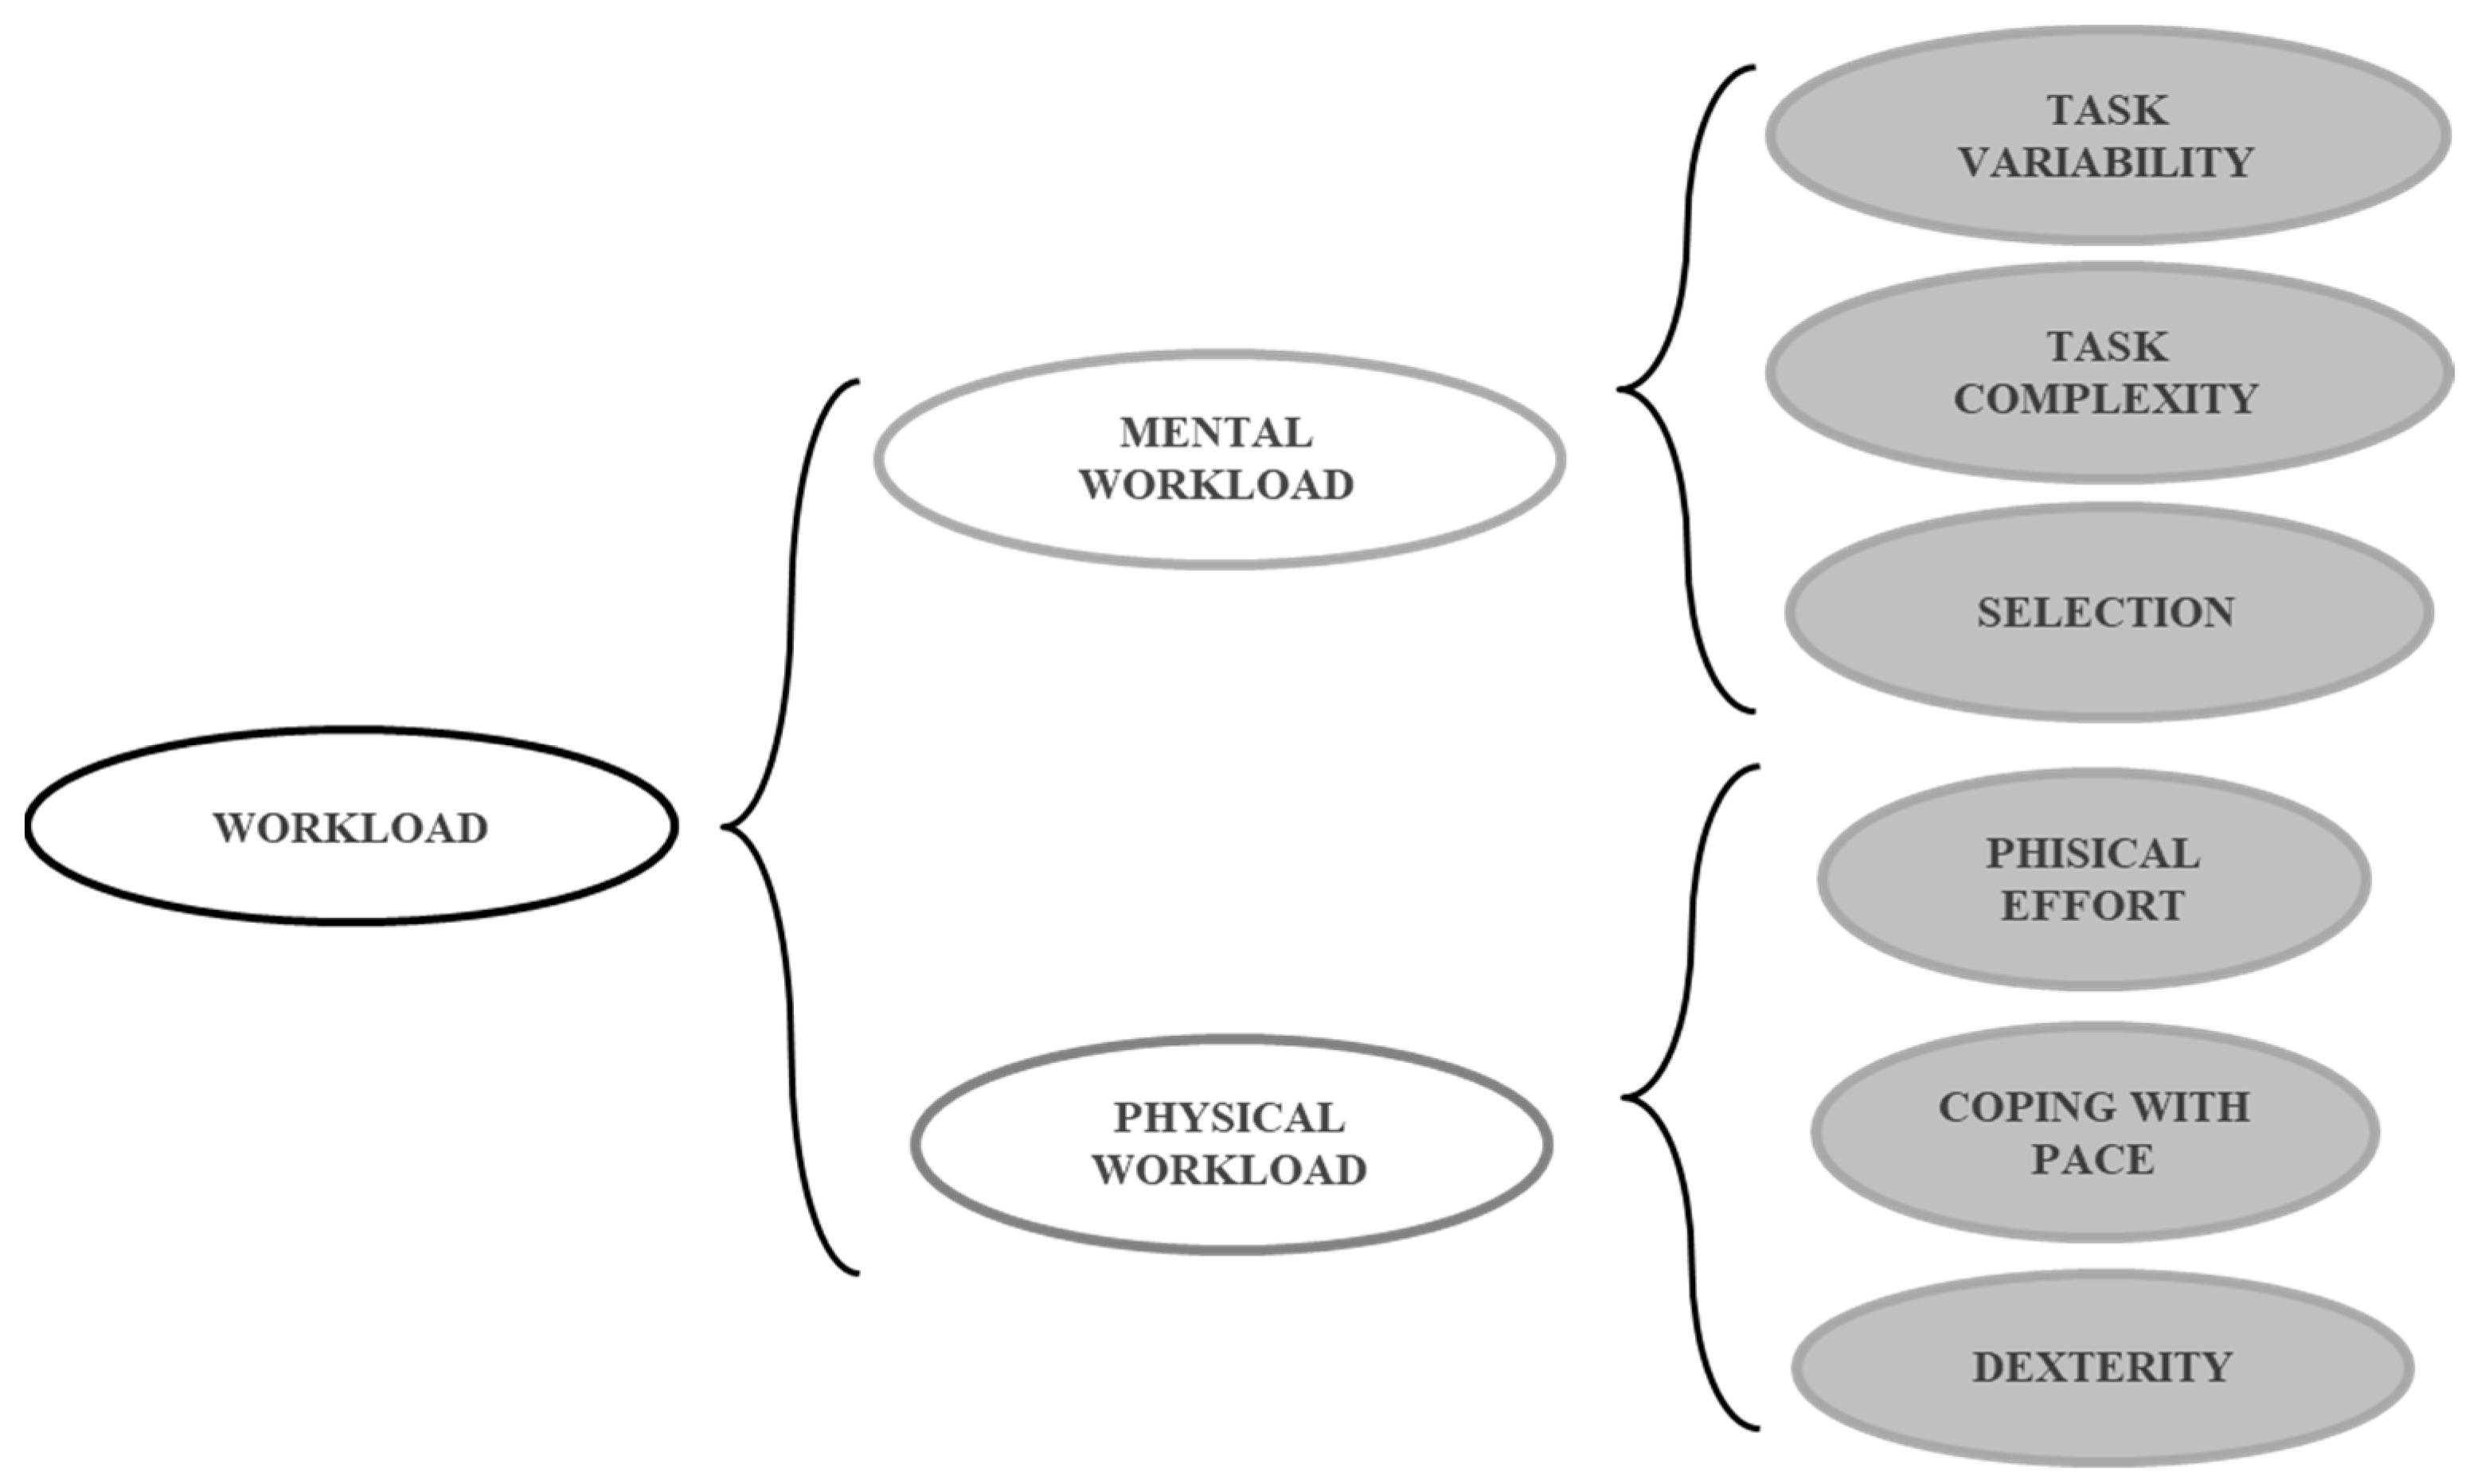
  • Task complexity: Assessed as a proxy of the number of steps and sequences involved in a task and the related difficulty for an operator to remember how to perform them;
  • Task variability: Assessed as the need to identify and estimate the operational differences in each workstation, this variable reflects the impacts of parts and product variability;
  • Requirements for selection: This reflects the decision-making phase in choosing specific parts or how to perform an activity when the steps of the procedures are not highly repetitive, which affects the mental workload;
  • Physical effort: Reflects the physical and postural exertion required to perform relevant tasks;
  • Coping with pace: Tasks may also differ in the percentage of saturation of “takt-time”, which is the time allocated to perform a task and is assessed as the time required at a minimum to perform said task divided by the time allocated for it. The higher the saturation recorded in a task, the less time available to complete it;
  • Dexterity: Describes the manual precision required by task characteristics.
Figure 3 summarizes all the variables selected to model WL.
The conceptual model represented in Figure 2 and Figure 3 has already been tested and applied in the automotive domain [22], but it is also a general model that could be adapted to different applications [14,26]. The underpinning requirements are to characterise the variables in a way that can be operationalized for a given environment, as explained in the next paragraph.

2.1. The Operational Model

The operational model is derived from the earlier conceptual model. It focuses on measuring and evaluating the compatibility between operators and tasks. To accomplish this, we must consider the following: all variables from the conceptual model should be assessed using observable and measurable quantities or proxies, and the comparison between operator skills and task requirements may involve quantities of different types. Therefore, it is advisable to use a unified categorical scale for all quantities and establish a set of rules for the evaluation process.
The operational model has two macroareas: one aims at assessing human capability (HC) and one aims at assessing the required workload (WL).
The conceptual model defining HC was based on three variables: manual skills, memory retention capacity, and physical skill. These variables have been related to the results of 4 empirical test performed by the operators.
Tests have been designed to simulate frequents operations close to the ones performed in the assembly line but also suitable to cover human skill tests that operators can perform during the working day. This was possible thanks to the direct involvement of the plant work analyst and the line supervisor in this action research initiative [27]. The four tests are defined as follows:
  • A so-called “Precision test”, which consists of moving an iron stick along a not-linear contour without touching the borders. This test is related to the manual precision required in many tasks where workers have to assemble components, avoiding impact. During this test, the time to complete the path and the number of errors committed were recorded.
  • A test aimed at evaluating manual skills called the “Both Hands” test. This test measures the ability of a worker to perform simple actions when explicitly asked to use both hands. The time and precision of coordinate movements in completing the task were recorded.
  • A “Methodology test”. During this test a worker must decide how to and complete a set of simple assembly steps with small parts when provided with some instructions. The performance criteria recorded for this test are the time used to complete the task and the errors committed.
  • A “Memory test”: sequences of geometric schemes are shown to a worker for a few seconds. The worker is then asked to replicate them on a desktop. During this test, the time to complete the task and the accuracy are recorded.
The results obtained from the tests were combined and used to build a set of 3 indicators to quantitatively describe the specific human capability features assessed for each worker. Figure 3 reports the connection between the conceptual model variables and the operational model quantities, leading into the 3 indicators derived.
The indicators identified in the HC operational model (Figure 4) are as follows:
  • Physical index (PI): Expressed in a range from 1 to 10, represents consistency in good work performance (1 is the lowest, 10 the maximum consistency). It was calculated considering the variance in performance on the 3 manual tests. The more consistent the performance was the better the indicator value associated with an operator. This index was considered as representative of physical skill.
  • Memory index (MI): Expressed with a 1–10 Likert scale and directly associated with a linearization of the results for the memory test. The memory index was considered as representative of memory skills.
  • Dexterity index (DI): Associated with the combination of results of the “Precision” and “Methodology” tests combined with the test called “Both Hands”. They collectively characterise a measure of dexterity. Therefore, a linearized average of these results was used as a dexterity index.
Each worker in the assembly line considered for this study has been characterized in terms of HC features, using a set of 3 indicators (PI, MI, and DI) all reported with a 1–10 scale.
For the workload (WL) conceptual model, we needed to characterise six variables related to mental workload and physical load.
The WL operational model was defined through a task analysis [14] performed on each workstation in the assembly line supported by an observation protocol. A participatory approach [27] involved both academic and industry professionals operating in various management areas: safety, work analysis, quality, and work organization.
This process allowed the identification of a set of observable quantities able to describe the WL related to each working station.
Each quantity had a different unit of measurement and therefore, to adopt a common scale, the indicators were translated according to calibrated Likert scales from 1 to 10. The set of quantities defined to assess the conceptual variables included 4 aspects, and can be described as follows.
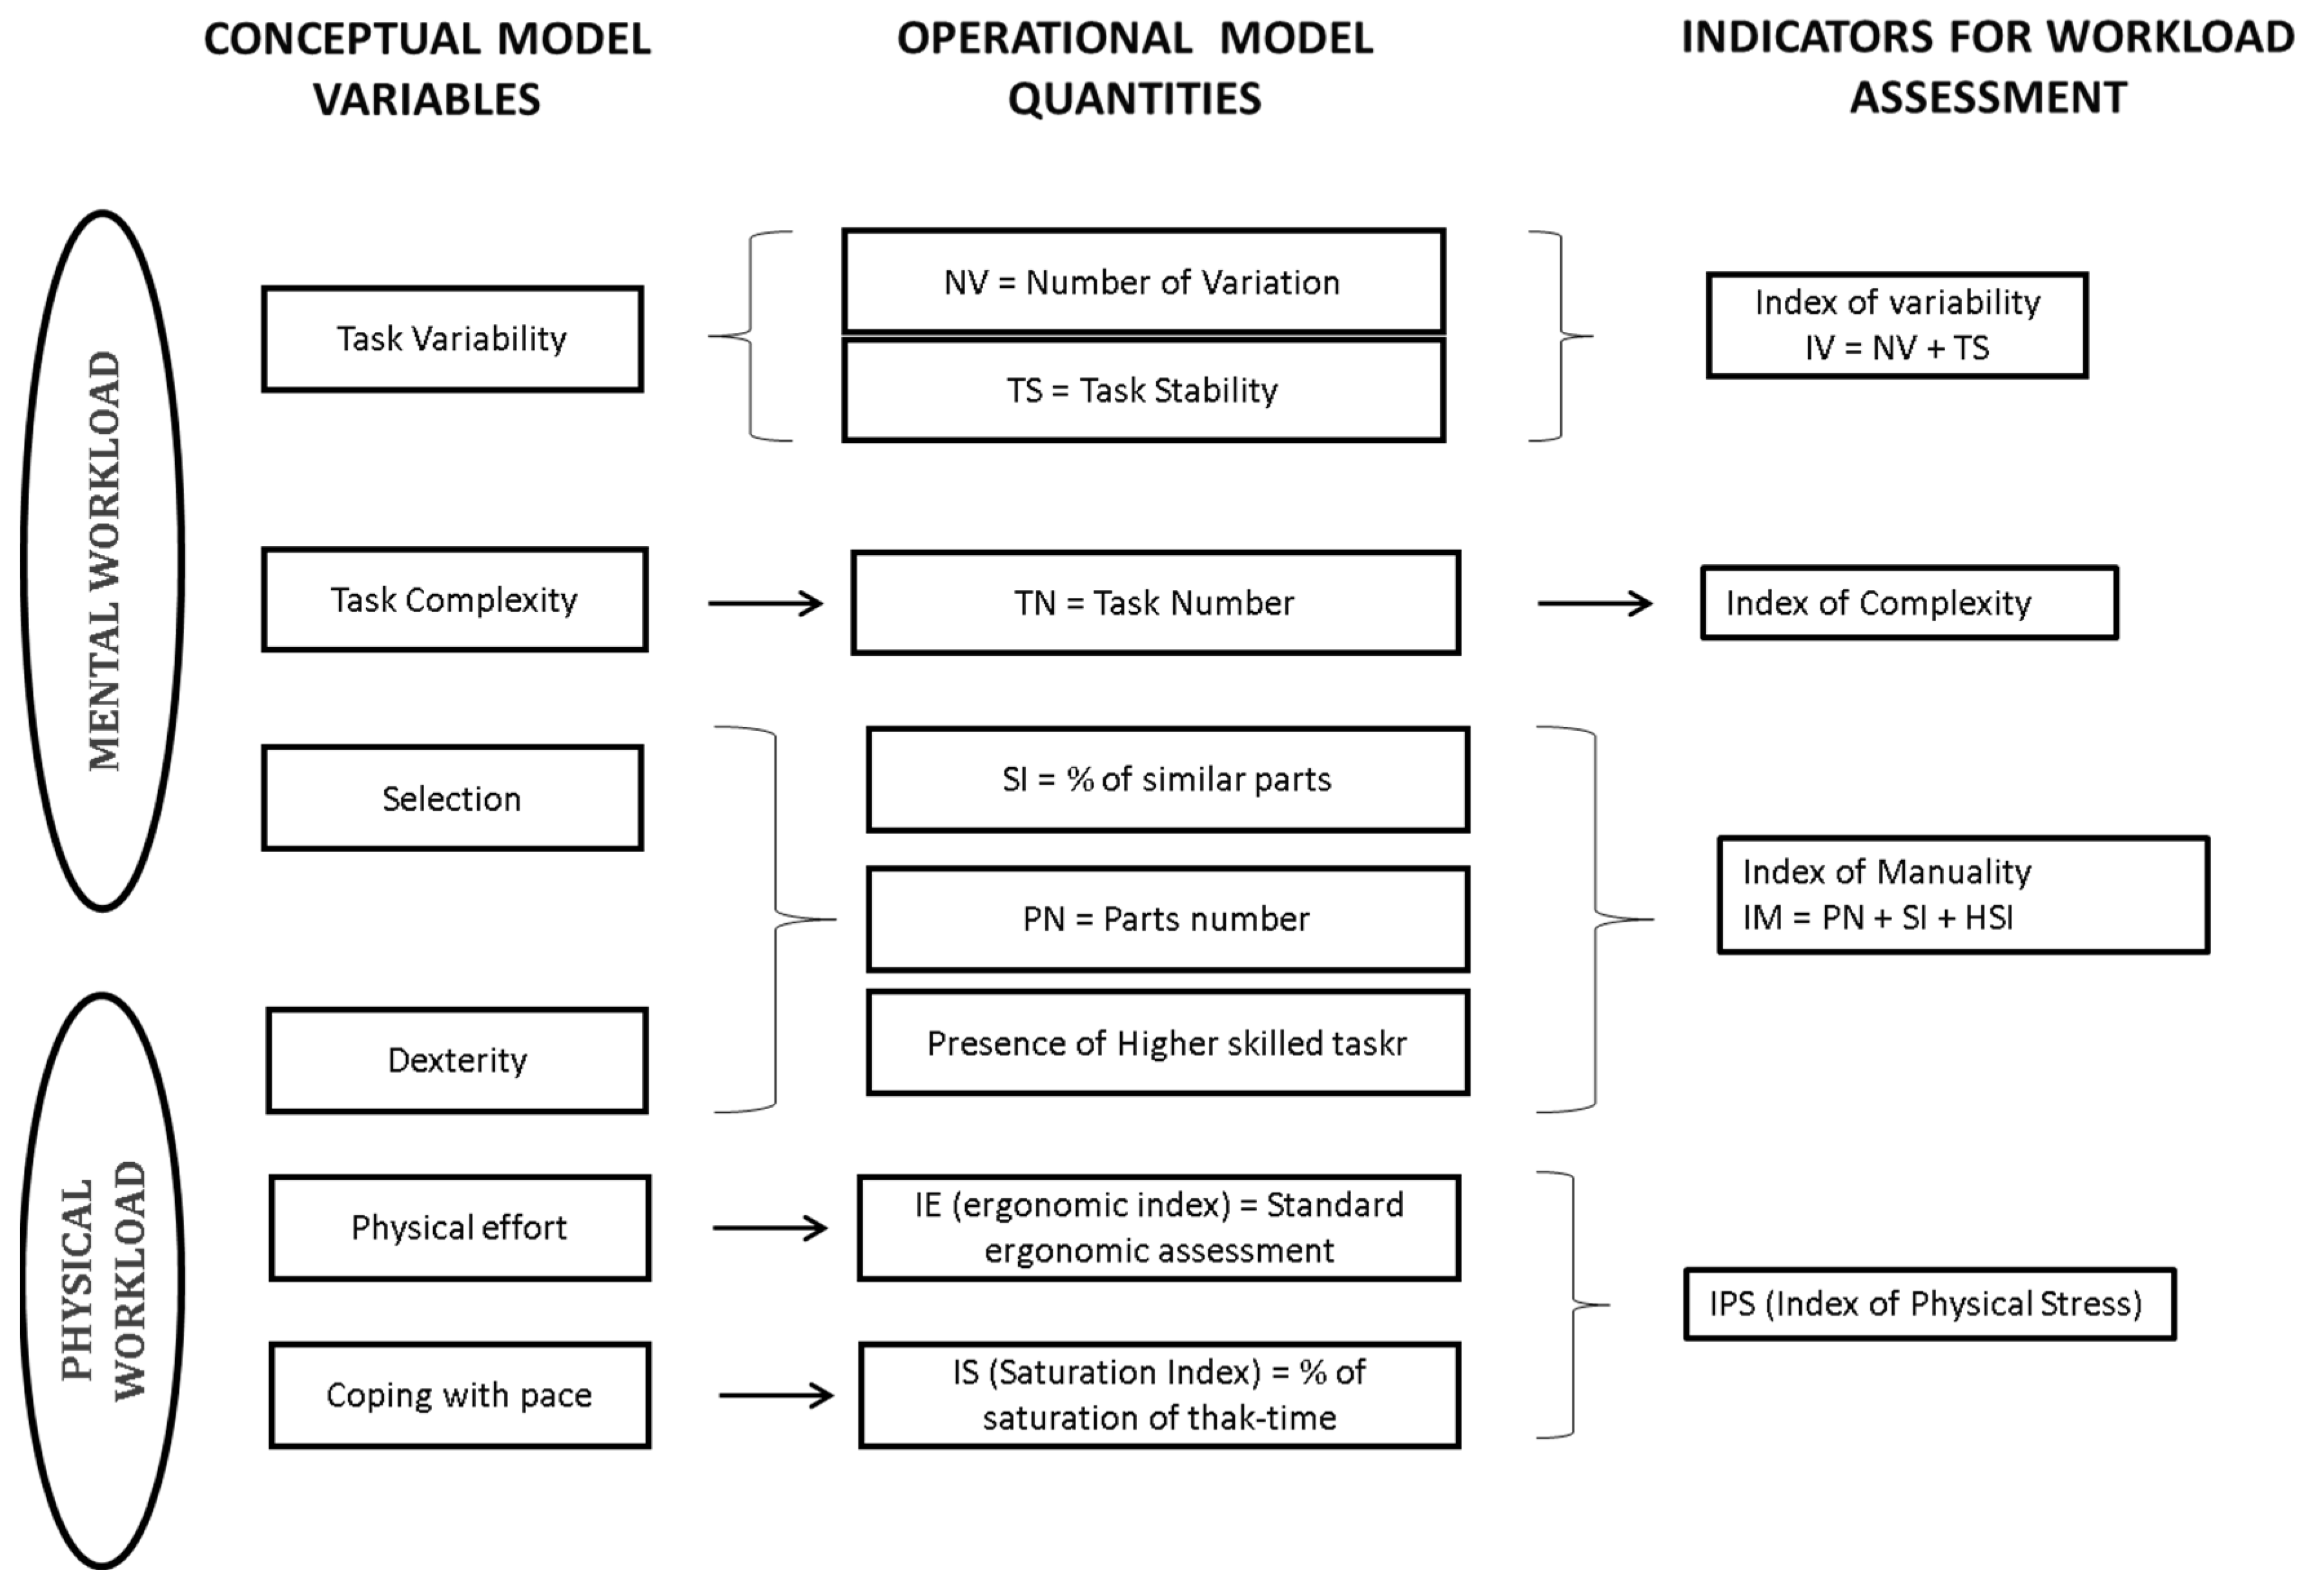
The index of variability (IV): Represents the amount of WL related to the variability in a task. This changes depending on the task and depends on two factors: the number of possible variations in the kind of product being assembled (NV) and the percentage of variations observed in each workstation (TS), which represents the task stability. The bigger the number of possible shell types with changes in tasks, the bigger the memory required to remember each possible task variation. Therefore, we decided to mathematically define the index of variability (IV) as expressed by the following equation:
IV = NV + TS
where NV is the number of task variation associated with different shell types in each workstation (e.g., NV can assume values between 1 and 6, 1 is when the task associated with a shell type does not vary and 6 is when there are more than 10 possible task differences following shell type variations). The other factor is MV (task stability). MV can vary between 0 and 4. It is 0 when there are no variations and 4 when the most frequent task for shell type in that workstation provides only about 50% of the total amount of tasks performed there during an average shift.
The index of complexity (IC): Measures the complexity of a task due to the number of substeps necessary to perform it. The larger the number of substeps required, the bigger the memory demand on the operator that must perform them. The “IC” has a range of variation from 1 (when the basic substeps are less than 10) to 10 (when the basic substeps are more than 50).
The index of manual ability (IM): Measures the manual ability required to perform the task. This index is composed of 3 subindices:
PN (part number) is an indicator associated with the quantity of small parts managed during the task. PN can vary between 1 and 6. It is 1 when the small parts are less than 5, and 6 when the parts managed during a task can be more than 50.
The SI (similarity index) measures the WL due to the requirement of distinguishing the right part among similar components required for assembly on different types of models (as an example, 2 kinds of screws may differ by 0.5 mm in length). The SI was set between values of 0 (there are no parts similar to each other) and 2 (the percentage of similar parts is more than 20% of the total parts managed during the task).
HSI (high-skilled index): Considers the presence in a task of any suboperation that requires a specific ability not measurable with the PN and SI. This was assessed based on a judgment expressed by the assembly line supervisor and internal work analyst specialist. The value of this index ranges from 0 to 2.
The formula defined among those indices is expressed by the following equation:
IM = PN + SI + HSI
The index of physical stress (IPS): Measures the total physical workload of a task combining two conceptual variables: coping with pace and physical effort. An index of saturation (IS) was introduced to consider the coping with pace variable and an ergonomic index (IE) was used to measure the physical effort due to the postural and ergonomic characteristics of the task. Both range between 1 and 5 depending on the ergonomic assessment of the workstations though the OCRA methodology [28]
Because of this, the IPS was defined as expressed by Equation (3):
IPS = IS + IE
In summary, Figure 5 shows the whole process that started from the conceptual model variables, developed into the operational model quantities, and ended with the 4 indicators.
Because of the operational model developed, the workload (WL) of each working station of an assembly line can be characterized using a set of 4 indicators (IV, IC, IM, and IPS). The indicators can assume integer values in a scale ranging from 1 to 10, summarising the key WL features considered [29].

2.2. Data Field Collection

The features of the operational model defined in the previous section guided the field data collection campaign.
The HC data collection campaign directly involved the operators of the line. To minimize the disturbance to plant activity, a training area was set nearby the assembly line. Four test cubicles were set up in the training area. The test campaign was introduced with a single training session during which an operator could freely try the four tests. Operators were invited during their shift to perform the four tests twice. While they were busy performing the tests, they were temporary replaced by a substitute on the line.
The results obtained have been used to calculate, for each operator, the 3 HC indicators shown in Figure 3.
For the workload part of the model, the data have been collected with two systems: a systematic examination of the work analysis report that precisely describes any task composing the assembly line, and a visual observation of the task with the support of an internal work analyst specialist. The data collected allowed the assessment of the four indicators summarised in Figure 4. All results collected have been reported in the Section 3.

2.3. Human Performance Assessment

HP assessment is the core of the methodological framework. Figure 6 illustrates the matching algorithm between workplace workload requirements and human capability indicators acquired for each worker.
As proposed in Figure 6, the memory index (MI) was compared with two indices of WL related to requirements for memory capacity (IC and IV). The physical index (PI) of the workers was compared with the corresponding Index of Physical Stress (IPS) associated to the workstation. Lastly the dexterity index (DI) of each operator was compared with the index of manual skills (IM) requirements associated to the working place.
The comparison of the HC index with those of WL is simply a verification of the difference between the index required by the workstation and the value of the associated index in relation to the corresponding human capability (HC) indices for each operator. In summary, it leads to 4 values.
For example, with reference to what was represented in Figure 6, the comparison between a generic worker, named AB, and working station 3 generates two negative values due to the difference between MI-IC and PI-IPS. These represent a negative worker–workstation match. The complexity (IC) and manual index (IM) required by the task are, in fact, are not well balanced with the memory and dexterity indices associated with the specific worker.
The other two values are positive, and they represent a favourable match between the operator and the working station.
These matching values can be summarized using two assessment indices:
  • HPminus: Given by the sum of all negatives matching indices.
  • HPplus: Obtained by summing all positive values of matching indices.

2.4. Application

The HP assessed in the abovementioned example should be repeated for any possible operator–working place match.
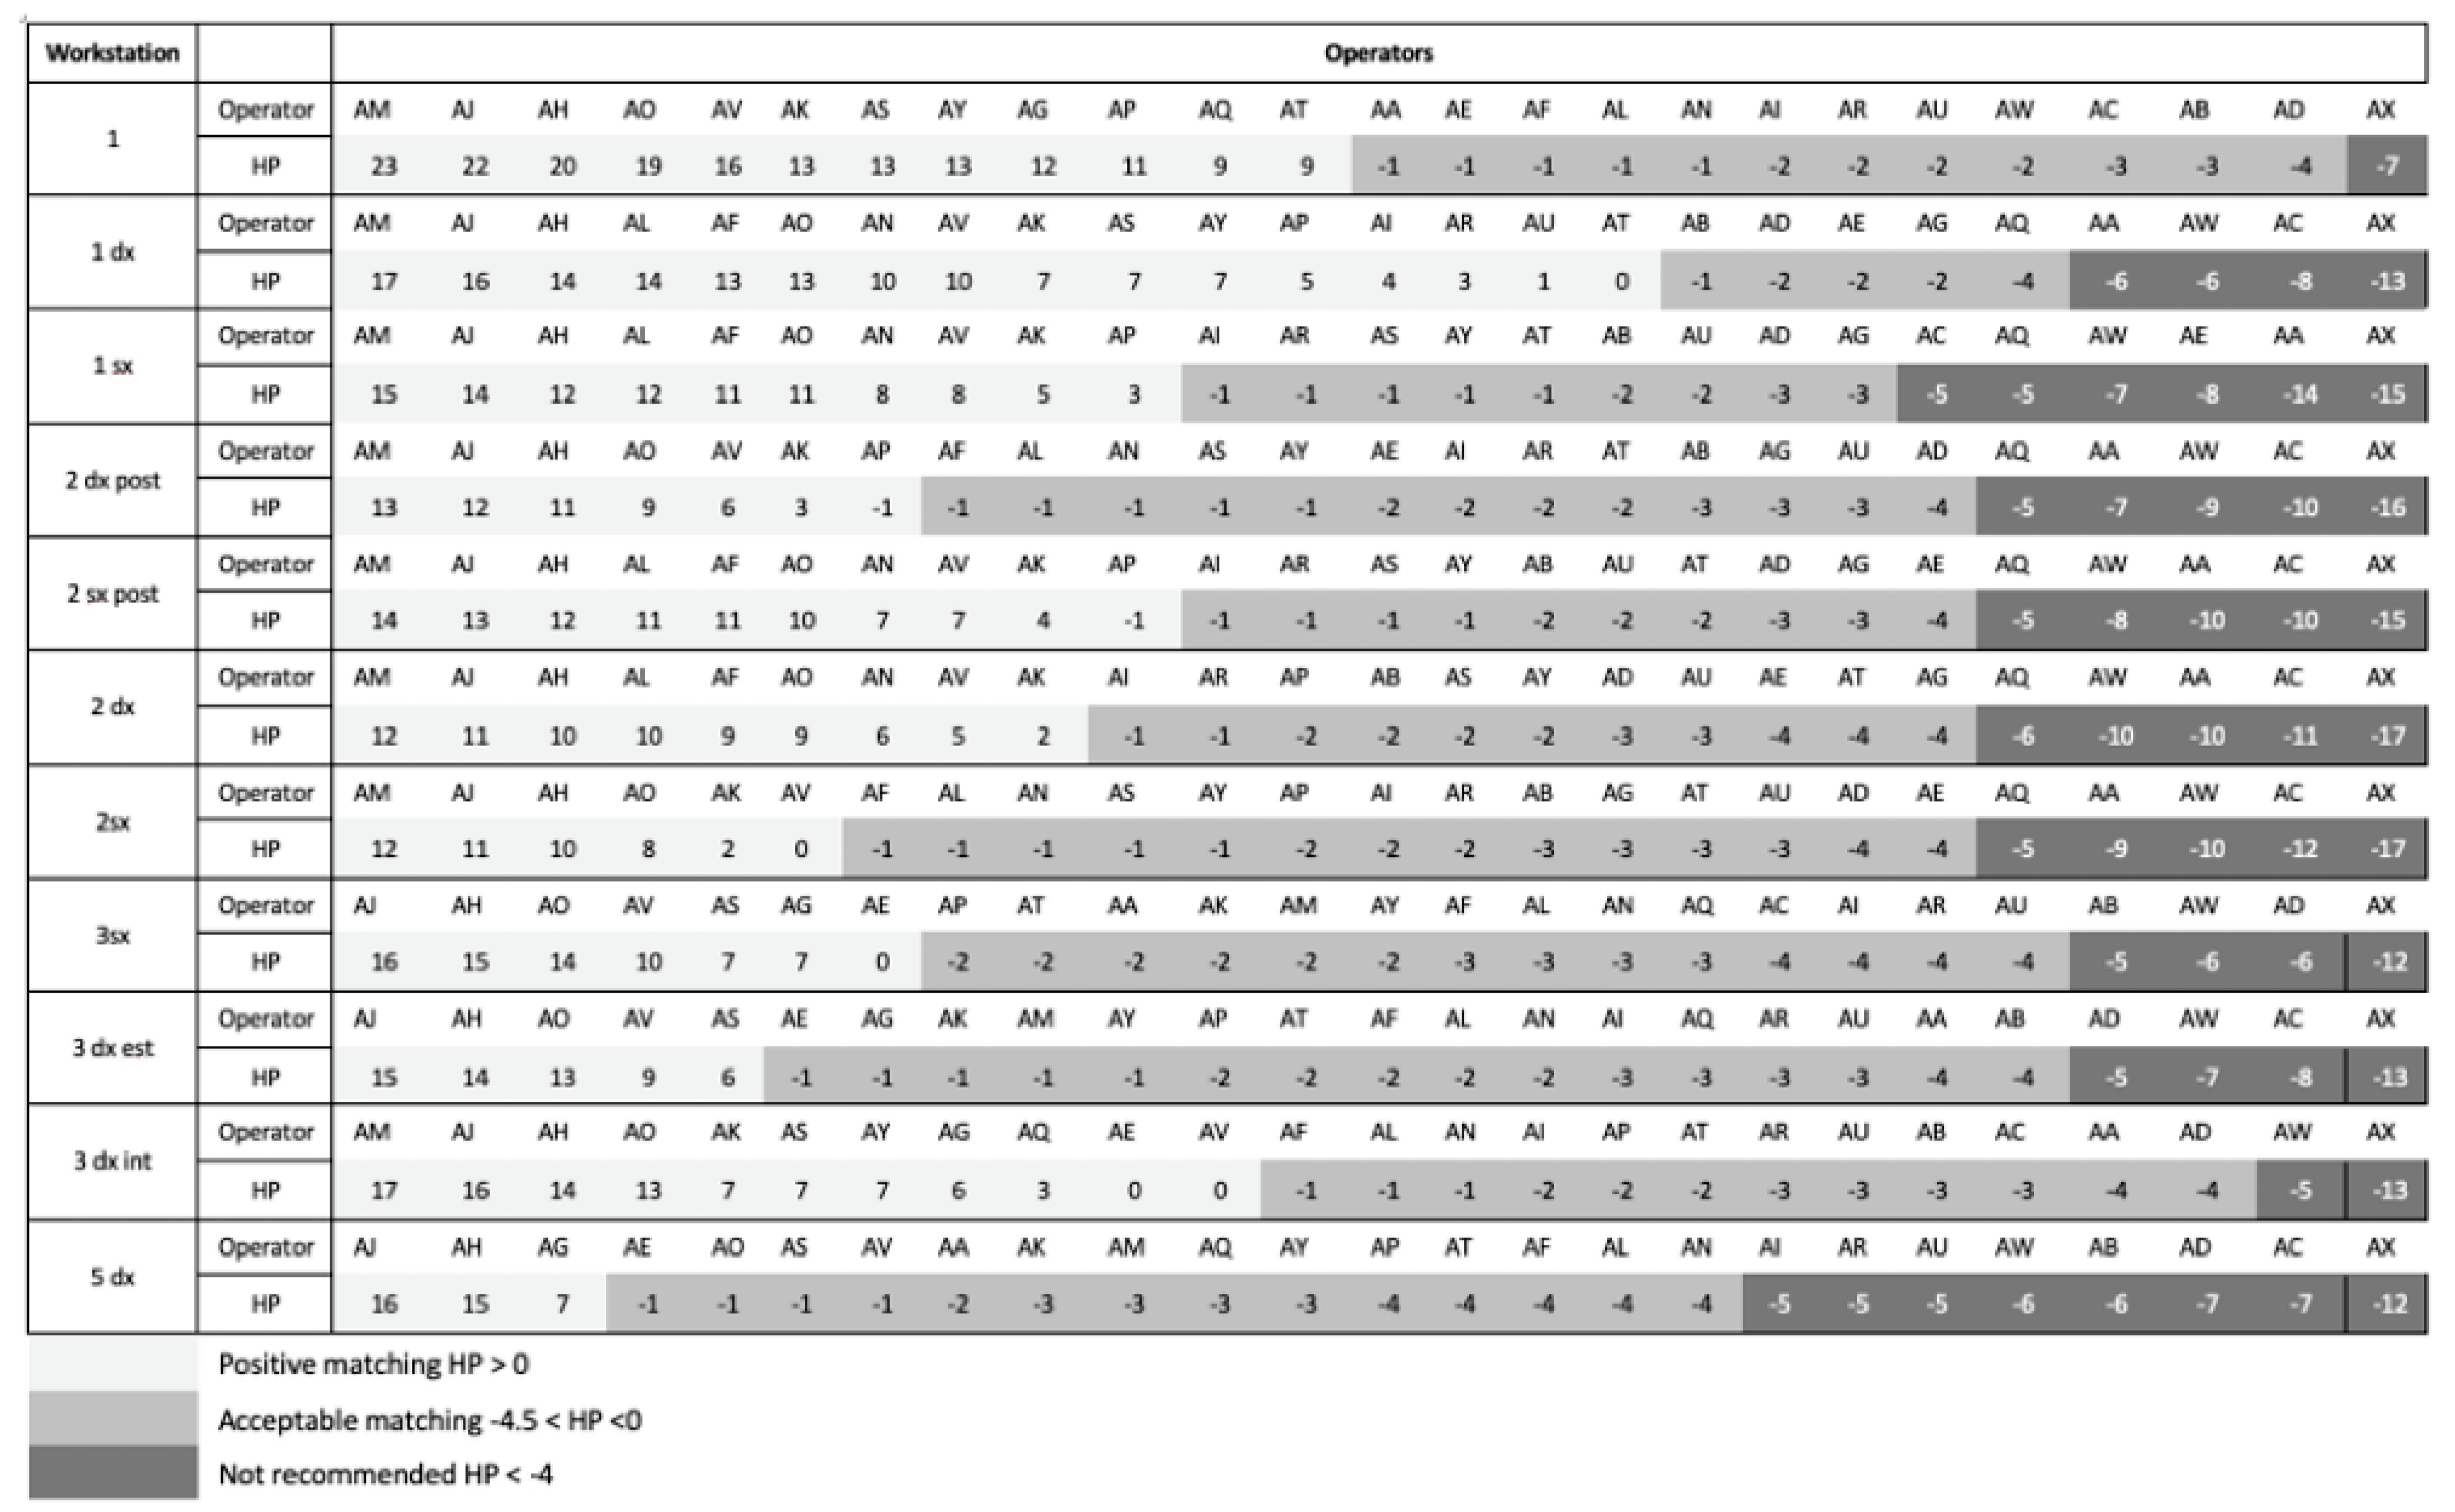
The assessment of HPminus and HPplus, considering all possible combinations of workers and workstations, can be collated in a matching matrix (MM).
An MM is collated and reports for each workstation the score of all the workers assigned to it, considering HPminus (if present) or HPplus (if there were not negative matching indices).
Figure 6 reports a sample of this matrix for the combinations obtained for 3 workstations and 15 workers. The scores of the workers are reported in a decreasing order; therefore, a grey scale can be set: black/dark grey colours are associated with matches that are not recommended (HP assessment indices < −4), lighter shades of grey are used for acceptable matches (HP assessment indices from −4 to −1), and white is for suitable matches.
Figure 7 reports (highlighted) the status of the operator labelled “AM”.
The HC indices of the operator “AM”, calculated with the operational model after the tests are performed, present a strongly favourable match for workstation 1, an acceptable match for workstation 2, and a bad match for workstation 3. This being the case, job rotation is recommended within workstation 1 and 2 and not with workstation 3. This is just an example that can be replicated for all operators and all workstations to obtain a recommendation for any possible matching based on HP indices. This evaluation could be repeated periodically to provide the basis of a solvable optimization problem where, through the optimization of HP indices, it would be possible to ensure the good matching of requirements and capabilities, while at the same time minimizing the probability of human error and injuries [29].

3. Results

A data field collection campaign was performed based on the operational model and the variable identified. Two assembly lines of a medium-vehicle-size plant were selected as a case study. These lines were composed of 61 different WLs, calculated according to the indicators described in Figure 4, and 140 HCs were assessed according to indicators reported in Figure 3.

3.1. HC Assessment

The HC assessment, performed using the four empirical tests previously described, was judged to be quite representative of the types of tasks performed during the working activity.
The “Precision”, “Both Hands”, and “Methodology” test results are determined based on two quantities: the number of errors and the amount of time recorded while an operator performed a given task.
Time and errors observed in the tests were linearly combined in an index called “Modified Time” (MT) according to the following equation:
MT = Time [s] + Errors × X [s]
where the following was the case:
  • “Time” was the time recorded to complete the test.
  • “Errors” was the number of errors observed.
  • “X” represented a numerical factor with the following values: 3 for the Precision test, 5 for the “Both Hands” test, and 10 for the Methodology test.
The memory test measured two quantities: a numerical score directly proportional to the accuracy achieved by the operator and the time used to complete the task. The results of the memory test were provided as a score divided by time.
The following four figures show the results recorded for all of the tests performed. The data collected for each worker have been anonymized by using a code formed by a letter (A for assembly line 1 and B for assembly line 2) and a progressive number.
Figure 8 highlights the capacity of the Precision test to discriminate between different skill levels among workers. In fact, the Modified Time (MT) index shows a wide range of performance variation, from a minimum of 22 s (worker “A22”) to a maximum of 82 s (worker “A21”).
The average value was 44 s, and this, compared to the difference between the best and the worst result, shows how relevant the difference could be in terms of performance from operator to operator.
During the Methodology test, workers were asked to assemble a set of small components (screws, nuts, and washers) into several configurations following written instructions.
Workers were free to adopt their own methods to assemble all parts in six different configurations.
Errors were represented by configurations that did not correspond to those described in the instructions.
The results are reported in Figure 9.
Figure 9 highlights a wide range of performance, from a minimum of 49 s marked by worker “B17” to a maximum of more than 233 s of worker “B3”. The average value was 98 s, and this, combined with the range of results reported, highlighted the fact that the Methodology test can discriminate between different skill levels among the participants.
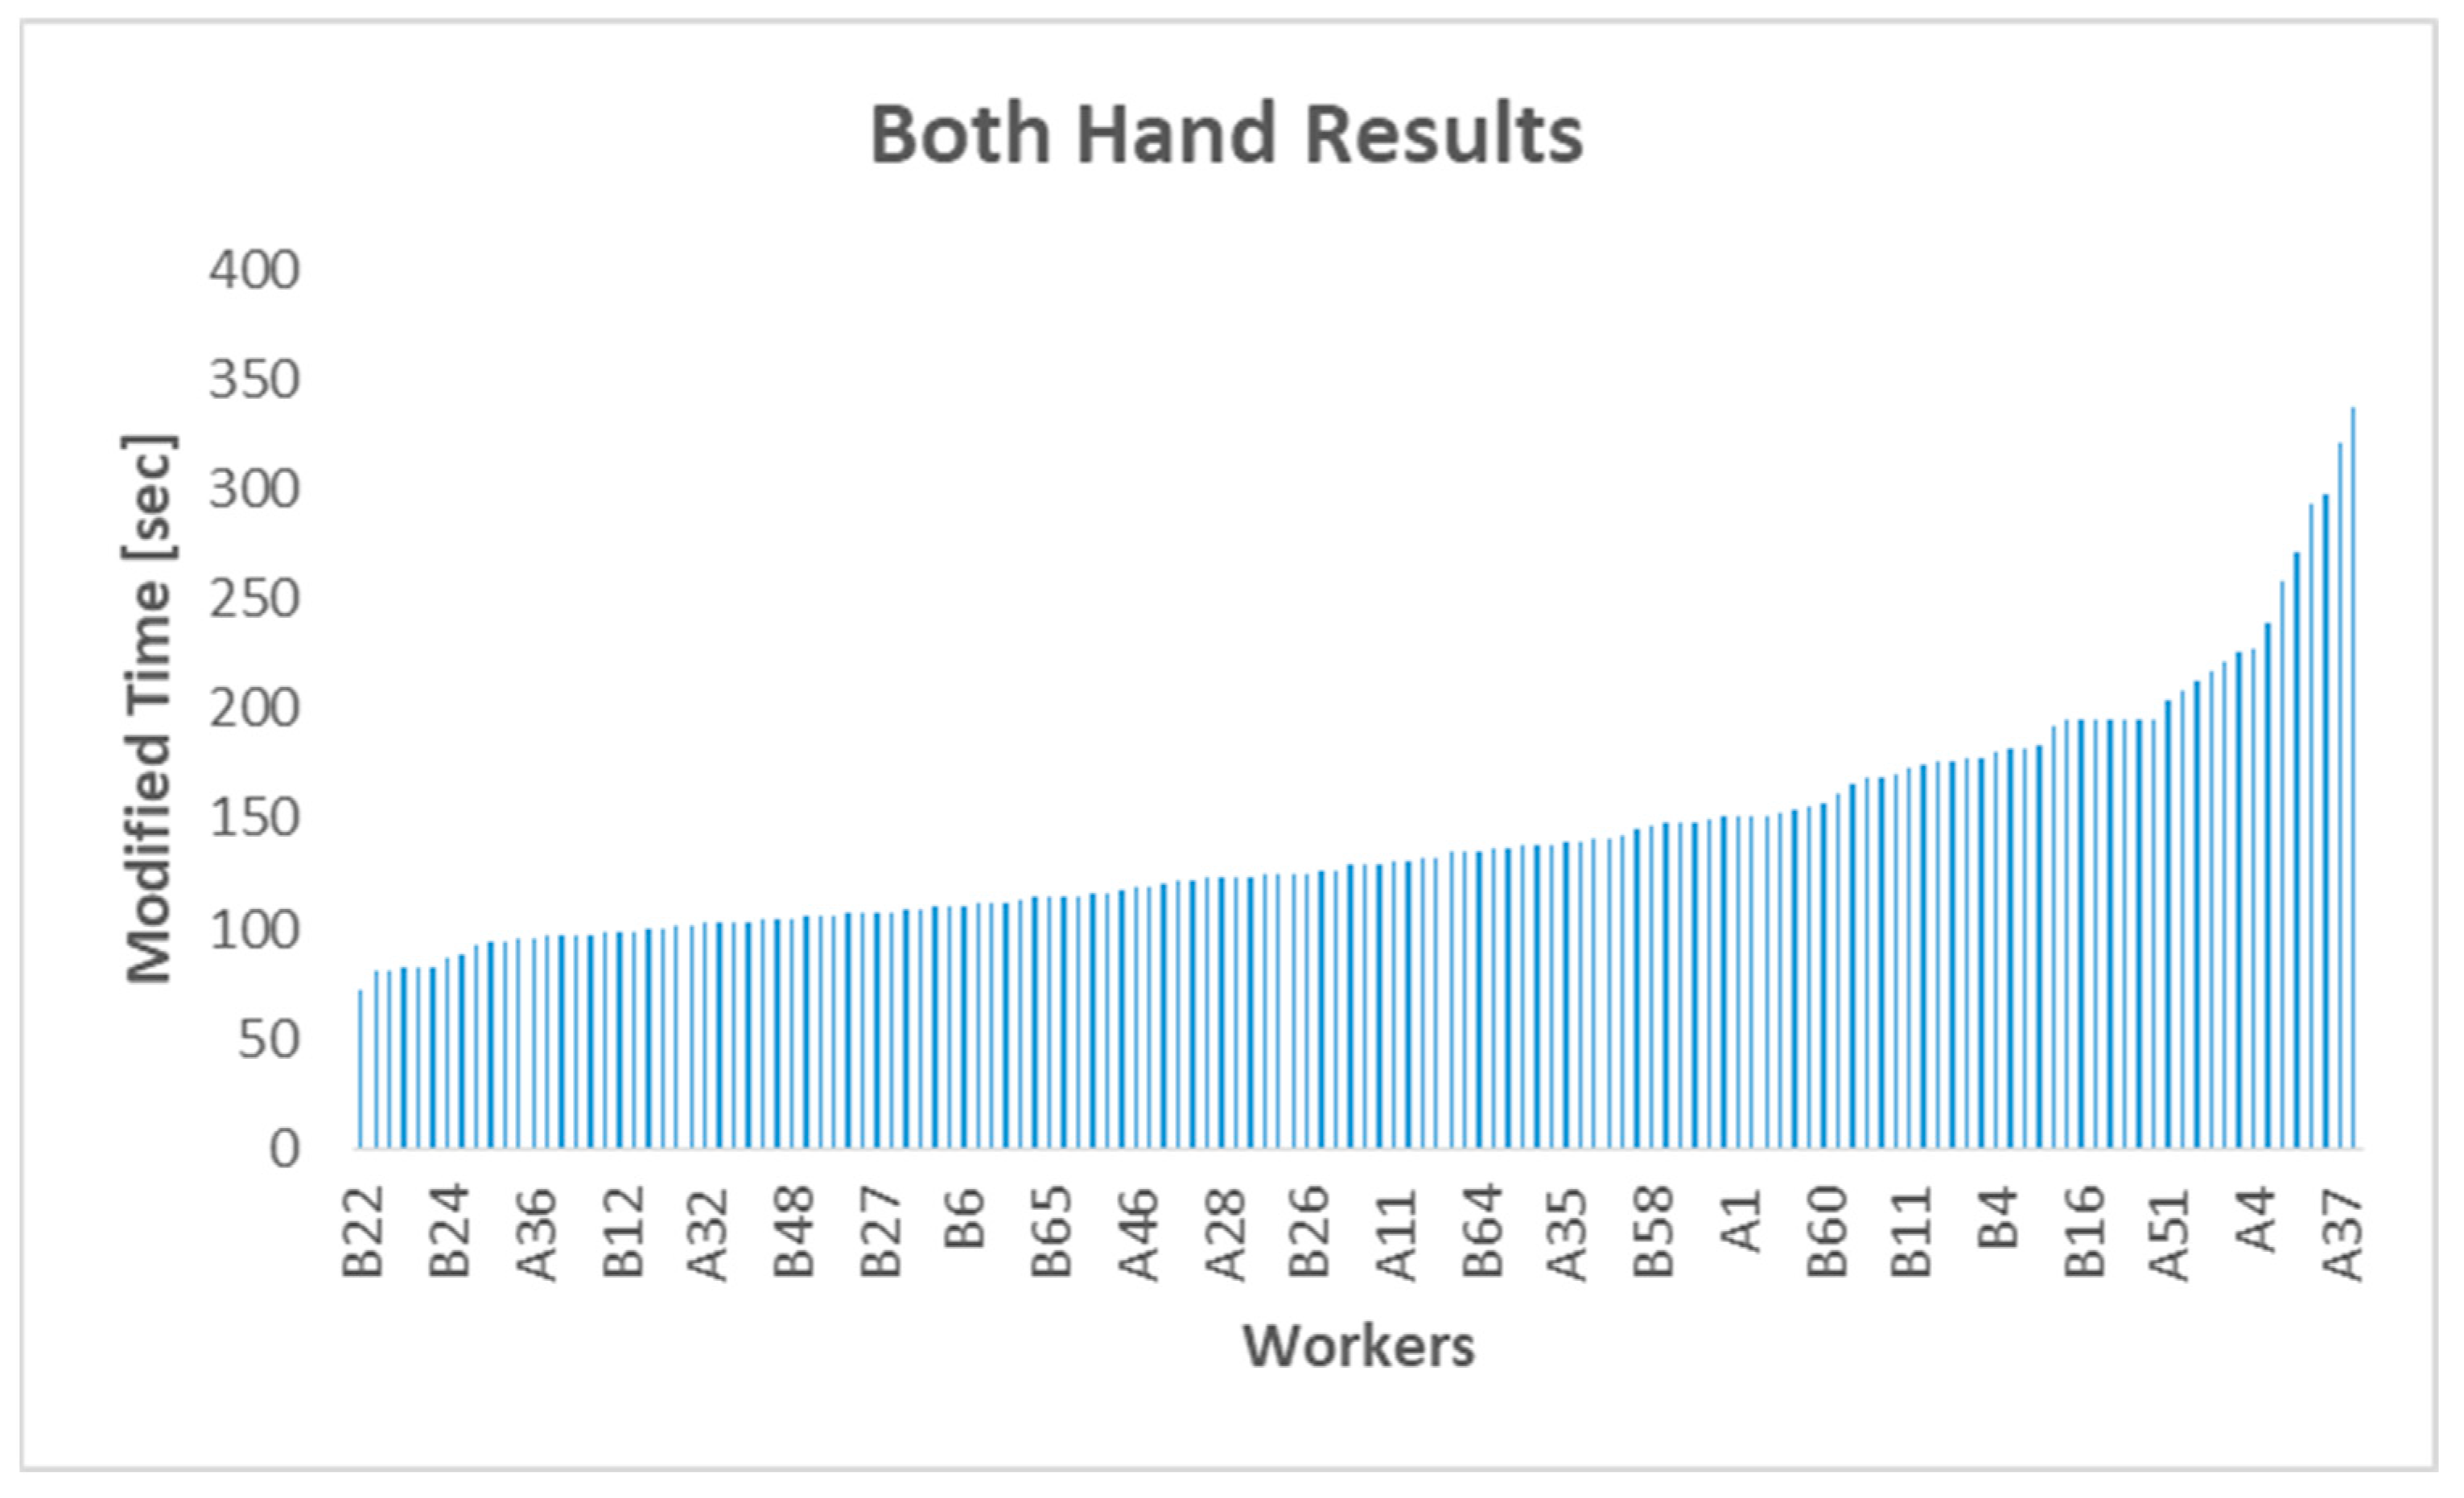
The “Both Hands” test consisted of a sequence of basic operations to be performed using both hands at the same time. Figure 10 reports the results of the “Both Hands” test.
Figure 10 illustrates that the “Both Hands” test can also discriminate well between different skill levels among workers. In fact, the Modified Time (MT) parameter exposed a wide range of performance variation, from a minimum of 72 s, marked by worker “B22”, to a maximum of 345 s, marked by worker “B53”. The average value was 135 s, and this highlights, in comparison to the minimum and maximum values, how relevant the difference in terms of performance from operator to operator could be.
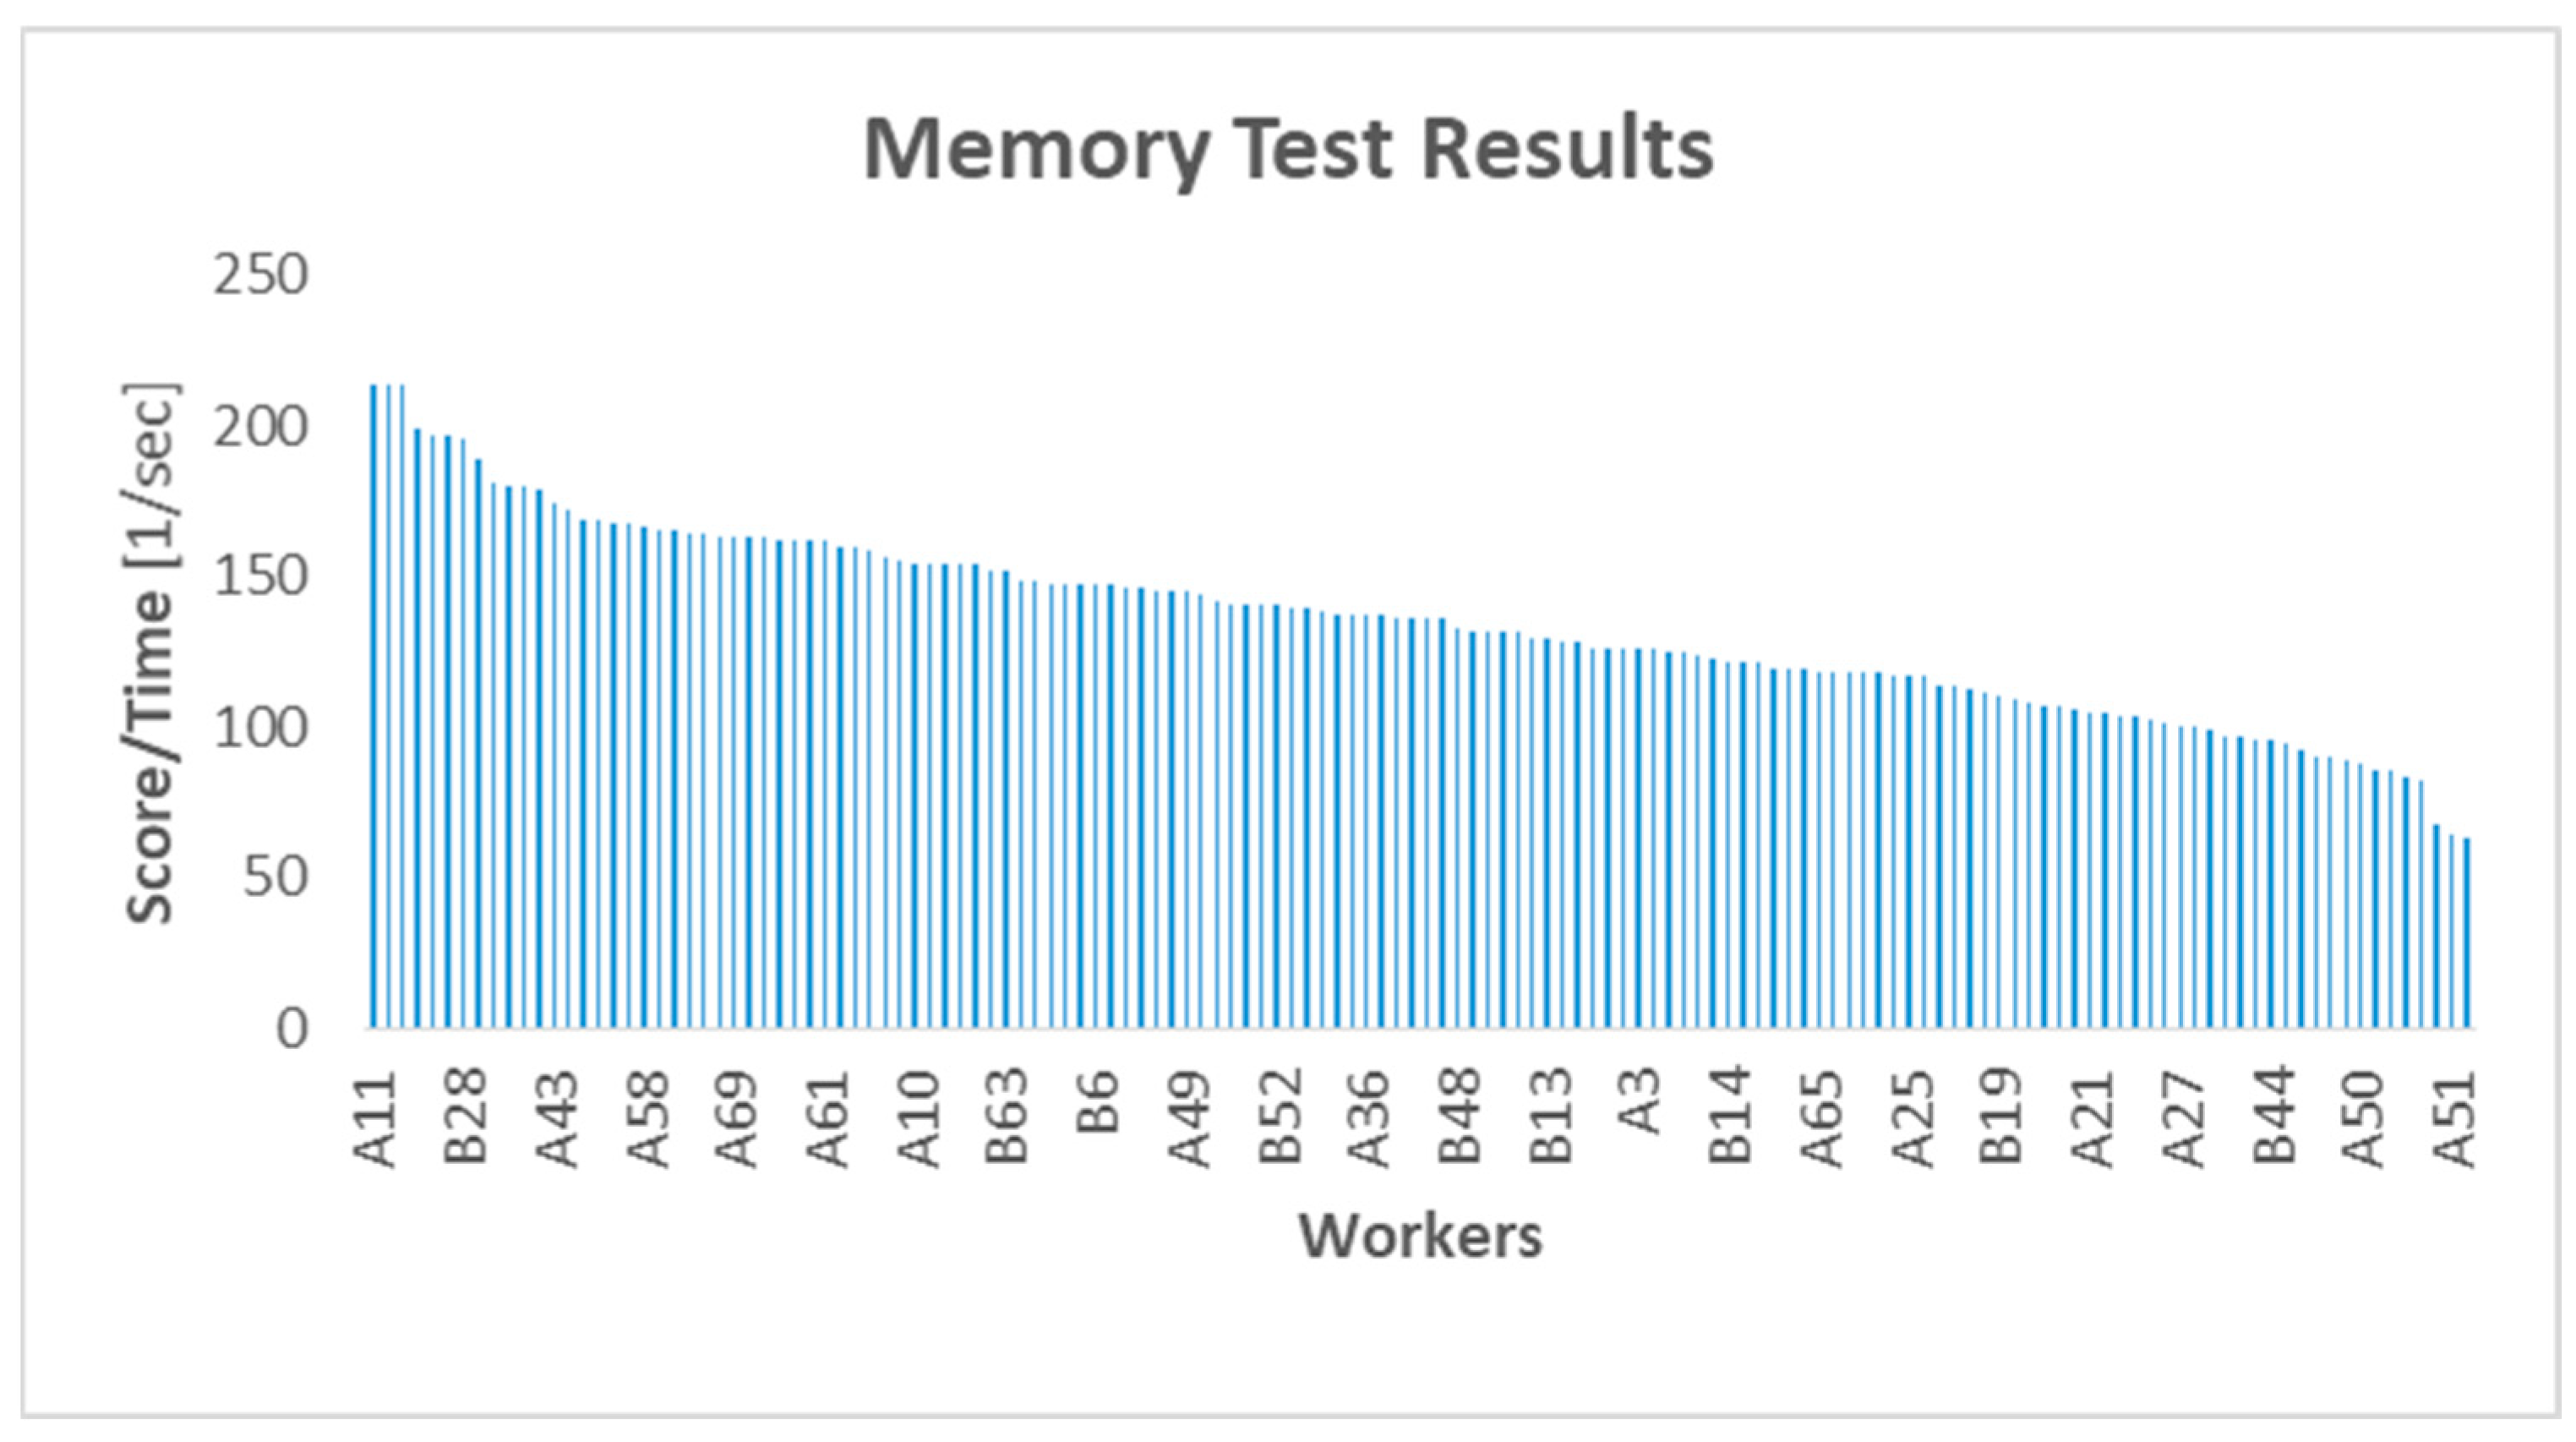
The memory test was designed to assess the memory capacity required during working activity, such as the capacity to recall a sequence of steps and parts to be assembled that can differ considerably for different shell types and associated tasks. Figure 11 summarises the test results.
In this case, the values recorded were the time and score that were proportional to the percentage of the configurations correctly recalled, and consequently the best result was the one with the highest value of score/time because it represented a larger number of frames correctly recalled per second.
As reported in Figure 11, the best result was achieved by worker “A11”, who scored more than 200, and the worst performance was associated with operator “A51”, around 70 points per second. The tests also displayed that different operators may score differently according to the skills being tested.
The transition from the test results to the HC indices is reported in Table 1. In Table 1, for each test the range of correspondence between the results and numerical scales is provided.
Based on Table 1, all of the test results have been translated into a 1–10 Likert scale, and this allowed the calculation of the HC indices. As a result of this step, all workers have been ranked by the 3 indices (DI, MI, and PI) as defined in the HC operational model.
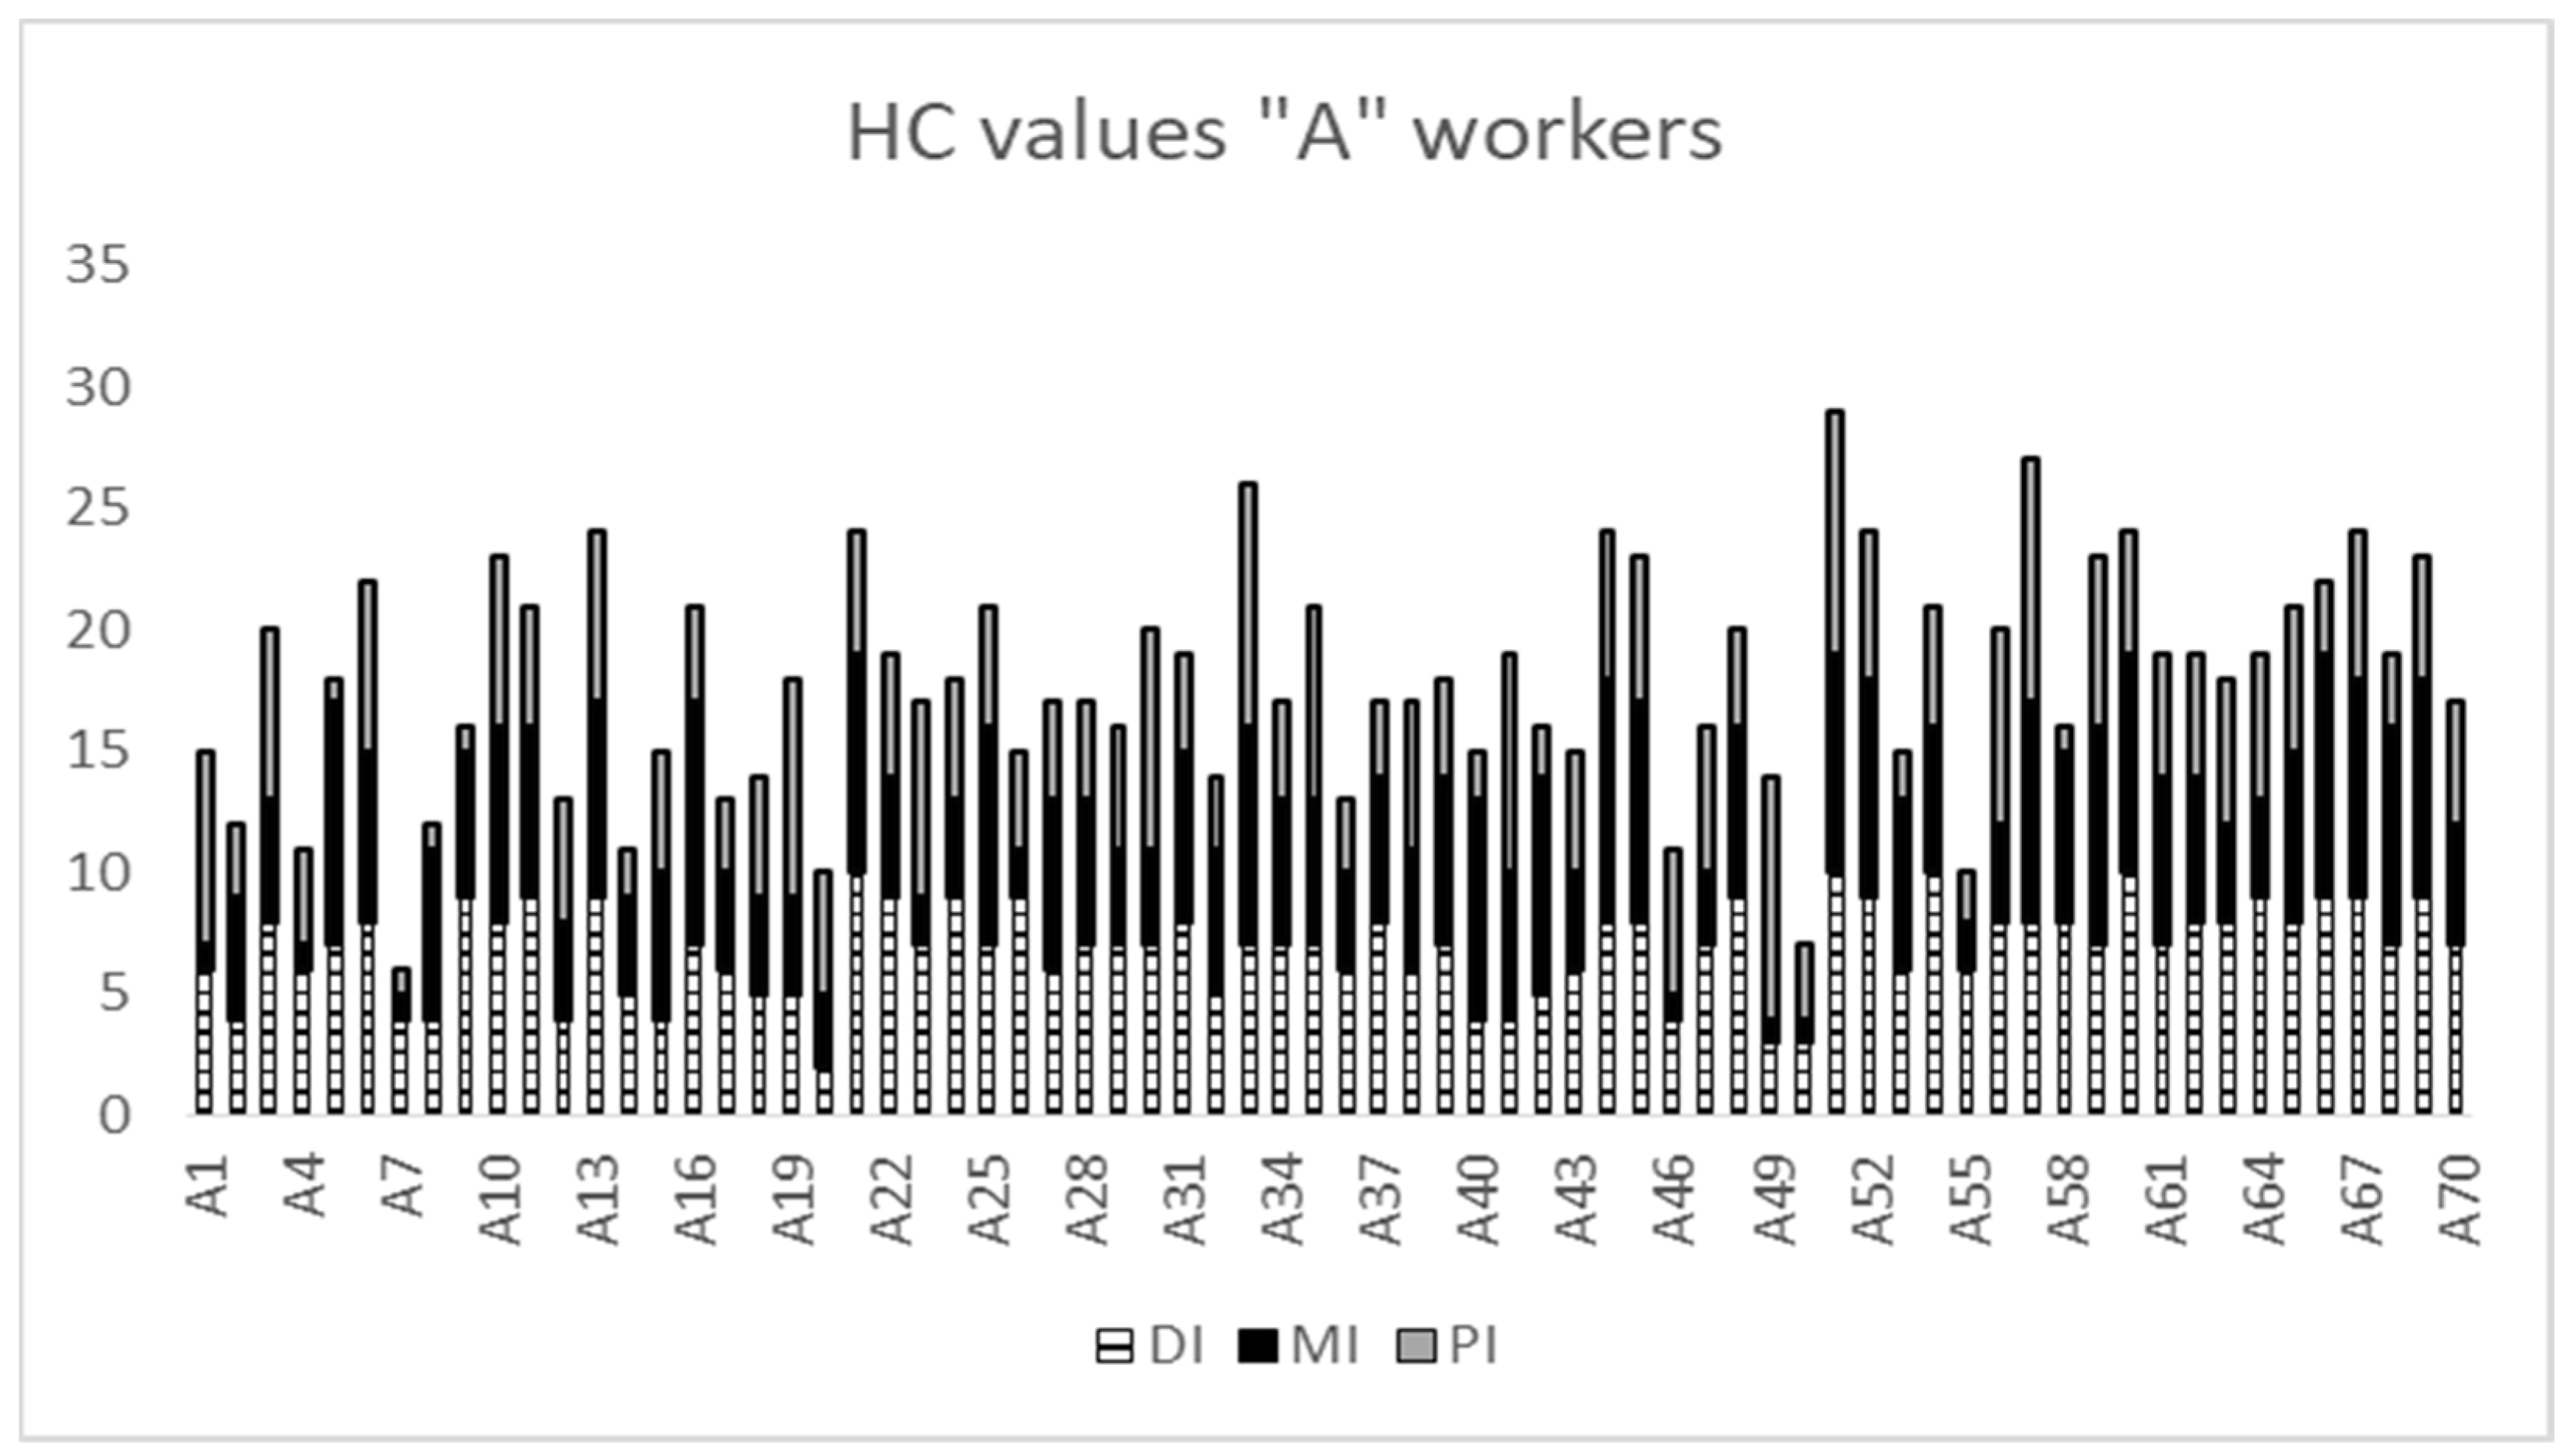
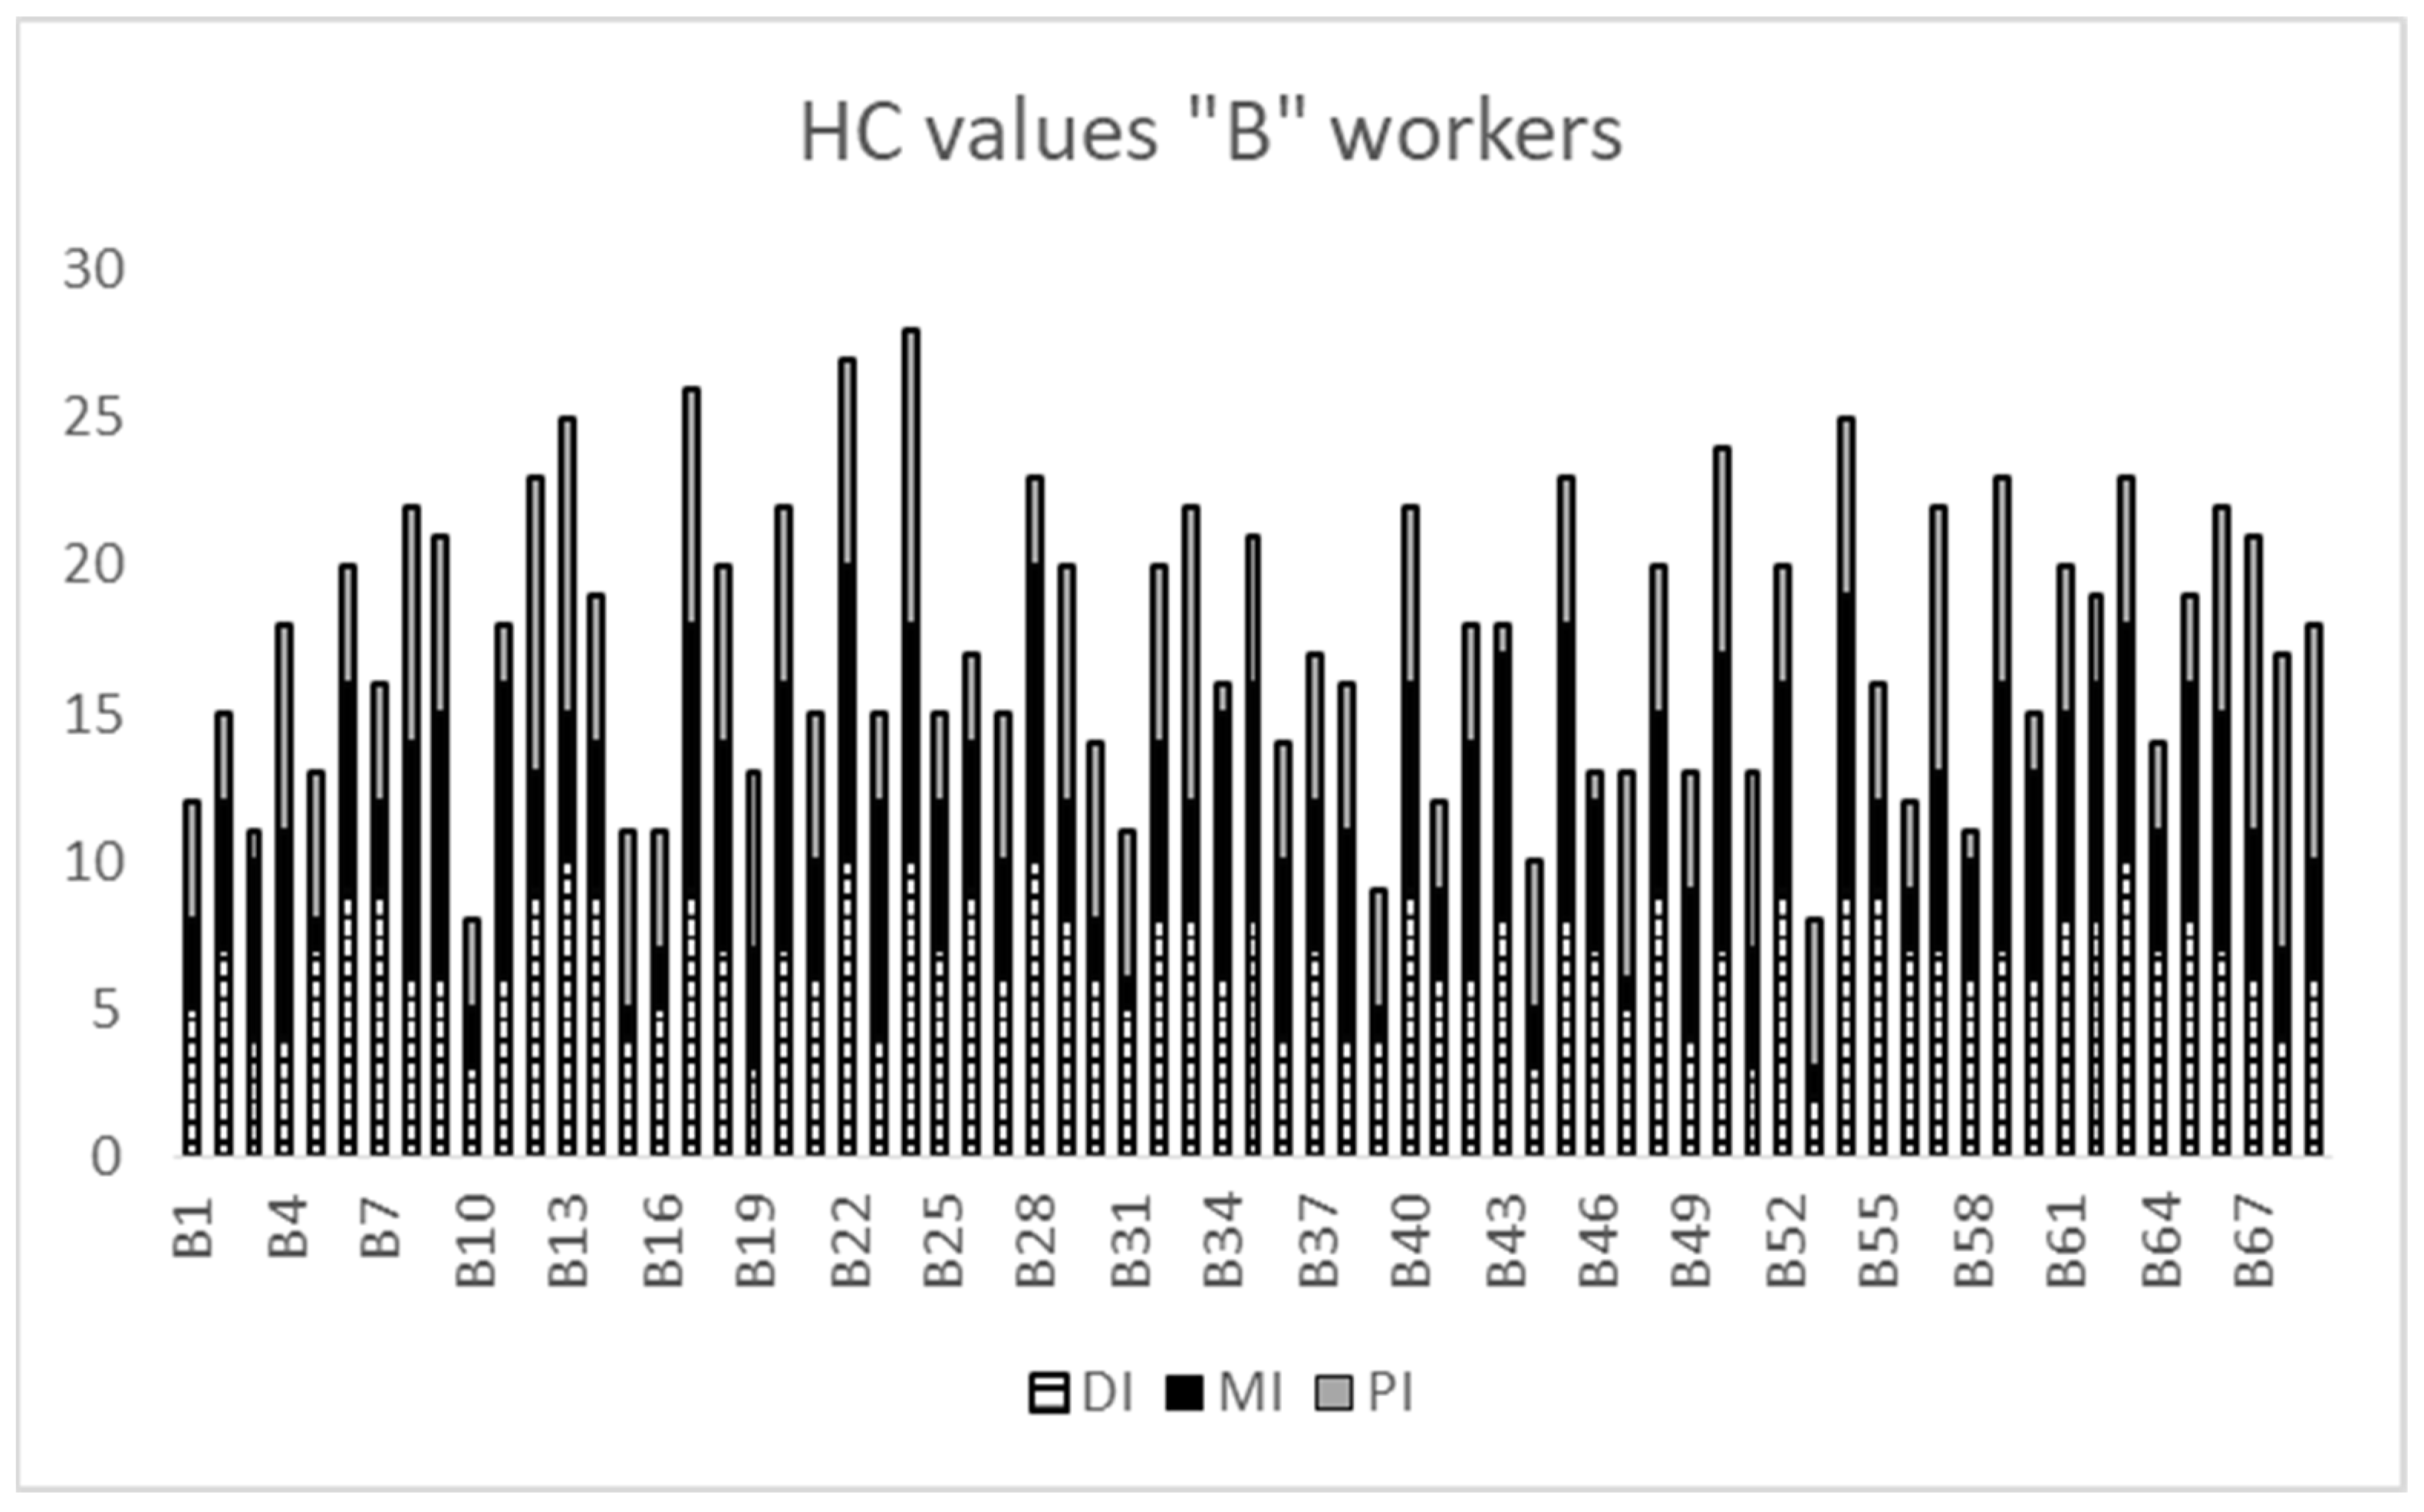
Figure 12 and Figure 13 summarized the HC distribution for the two groups of workers assessed.
As is shown in Figure 12 and Figure 13, the HC indices present strong variation from worker to worker.
It is possible to consider the overall HC score for each worker or the score of each test associated with a specific skill set. For example, worker B10 reported the lowest global score of HC with a value of 8, and worker B24 reported an overall score of 27. This range included the performance of all other workers of the line. Not only does the overall score changes from worker to worker, but even its composition presented a relevant degree of variation.
Let us consider, for example, the comparison between workers A8 and A46 (Figure 11). Both reported a similar overall score, with a value of 12 for A8 and 13 for A46.
Even if the overall score was similar, its composition was deeply different: A8 achieved 3 for the DI, 7 for the MI, and 1 for the PI, while A46 achieved 3 for the DI, 1 for the MI, and 6 for the PI. This information can suggest that worker A8 may be better allocated to a workstation that entails more memory skills than those of dexterity, while worker A46, because of the HC indices, could be a good match for a workstation that requires physical skills but presents lower levels of complexity and variability in the steps. The set of three HC indicators allowed the quantified profiling of workers based on their individual characteristics.

3.2. WL Assessment

The operational model for the WL assessment, as was described in Section 2.2. and summarized by Figure 5, was based on the combination of three activities: a task analysis, a visual inspection of workstations, and on the work analysis reports. All quantitative data were collected by these activities, and based on them the four WL indicators (IC, IV, IM, and IPS) were assessed for each workstation. The quantitative data collected (saturation, number of suboperations composing the task, number of small parts, etc.) were considered sensitive by the company and they will not be shown in this paper.
The following Figures summarize the WL distributions on the two assembly lines, calculated according to the indicators reported in Figure 5.
As reported in Figure 14, the global value of WL ranges from a minimum value of 9 for workstation “WL1–4” to a maximum value of 24 for the workstations “WL16”, “WL2”, “WL25”, and “WL-28”.
Figure 15 reports for Line 2 a minimum value of 10, marked by “WL2–30”, and a maximum value of 28 for “WL2–28”.
HC global provides an indication of the total amount of requirements that any workstation poses for workers.
The high degree of variation observed, in both lines, highlights the importance of considering it in the matching of operator–workstation, because an operator with lower skills compared to the WL required would be more exposed to injuries, errors, and long-term fatigue effects.
Even the WL composition presented a strong degree of diversification across workstations. As an example, let us consider the comparison between “WL2–10” and “WL2–21”: both have a very similar WL global value, but their WL compositions differ strongly. In fact, “WL2–10” reported a small value for IM and a large value for IPS, while “WL2–21” reported a higher value for IM and a smaller value for IPS. The analysis of WL composition suggests that WL2–10 require the highest value of physical indices and a lower value of IM, while workstations WL2–21 require operators with a high value of memory skills and low value of the physical index.

3.3. HP Assessment and Results Application

The final step of the TERM, as applied to this use case, was the definition of two matching matrices, one for each line, with structure and content defined as in the example of Figure 6.
In relation to the specific dataset collected for the case study, the two resulting matrices will have 30 rows and 67 columns for Line 1 and 31 rows and 70 columns for Line 2, with the number of rows corresponding to the number of working stations and the number of columns corresponding to the number of operators.
As an example, Figure 16 reports a sample of a matching matrix defined for a smaller case of 21 working stations and 25 workers.
Based on the matching matrix, it is possible to define a whole set of recommended matches for operators and workstations, minimizing the negative human performance index (HPminus) and consequently achieving a better distribution of workers to workstations based on the spectrum of human capability indices and workload indices, alongside the need to ensure a certain flexibility for job rotation.
In this case study, the matching matrices were used to identify the best human resource allocations for the two production lines considered. This operation implied a replacement of 68% of operators compared to the ordinary distribution defined by the line supervisor. According to the plant managers, a period of 7 months was chosen to monitor the results of the new configuration, where the first moth was free of monitoring to minimise hawthorn effects and let workers familiarise themselves with the new tasks. Following this period, monitoring was carried out with four observable indicators, three for safety performance [30] and one for quality performance:
  • SMT (soft medical treatment), which represented the number of soft medical treatments required by workers during working activity for light injuries (small cuts, falls, etc.) This absence is temporary, and the workers came back to working activity during the day.
  • HMT (heavy medical treatment), which represented the number of absences from work due to an accident that occurred during working activity. In this category are included all occupational accidents.
  • AB (absenteeism), which represented the number of absences due to any illness relatable to working activity. This parameter was intended to measure the fatigue effects on workers with reference to MSD (muscle–skeleton disease).
  • The QI (quality index) was used to measure the percentage of product with no defects produced at the end of each line. This index was measured in a quality gate according to an internal procedure.
The comparison of safety indicators and quality data before and after the reconfiguration would be used to monitor the effectiveness of the methodology in terms of capability to improve workplace performance.
Managers reported positive results after two months, with a reduction of 13% in terms of the SMT indicator and 7% for the QI.
HMT and AB data have been collected, but they represented a long-term measurement effect. With regard to the HMT index, occupational accidents are rare events in this company compared to the daily frequency of soft medical treatments. Therefore, the monitoring of this parameter required a longer time of observation. Absenteeism is related to disease correlated with the accumulative effects of activity carried out by a worker performing his own task. Consequently, a change in task, passing from a bad to a good match, requires a long term (6–12 months) to show the expected benefits on the health of the worker involved.

4. Possibility to Adopt a Weighted Algorithm

The authors considered adopting an HP index using a weighted algorithm in the future that promotes a more detailed analysis of the importance of each single skill set requirement for each workstation, making the model more accurate. The weighted method identifies which skills of operators (memory, dexterity, etc.) are more challenging and/or in less demand in each workstation.
Below is a formal description of the method [31]:
i is the number of operators ( i = 1 I ) .
j is the number of workstations ( j = 1 J ) .
l is the index of the human capability assessment:
( l = 1 L ) { MI MI DI PEI }
All indices of the human capability assessment of each operator are described together in a logical set, L = ( M I , M I , D I , P E I ) .
l is the index of the task complexity assessment:
( l = 1 L ) { V I C I D R I P W }
All indices of the task complexity assessment of each workstation are described together in a logical set, L = ( V I , C I , D R I , P W ) .
C i l = qualification of operator i in index l :
C i l [ 1 , 10 ] L
S j l = qualification in index l to perform a job in a workstation,   j :
S j l [ 1 , 10 ] L
W j l = weighting of index l in a workstation,   j :
W j l = S j l S - j   l L j J
where:
S - j = l L S j l L   j J
is the average of the task complexity index for each workstation.
The HP calculation is carried out for all of the possible worker–task matches, and the results of this have been organized into a matrix index reporting the HP value for each worker/task combination:
H P i j = l L , l L ( C i l W j l S j l )   i I j J
and substituting the weighting:
H P i j = l L , l L S j l ( C i l S - j 1 )   i I j J
An example of HP indices for one operator and three workstations using the weighted model and the previous one is reported in Table 2.
In the example, the individual operator’s human capability indices considered were MI = 10, DI = 6, and PEI = 4.
The operator has an indicator of MI = 10; this variable suggests that the operator is better allocated to a workstation where memory is a crucial requirement. With the previous model, the HP values were the same in the three workstations; however, when the weighted model was recalculated, the results changed and highlighted a difference between the allocation to the three workstations. The best allocation is in workstation 2, with a high complexity index (CI) and variability index (VI), therefore requiring larger demands on memory capabilities.

5. Conclusions, Limitations and Future Challenges

The TERM, as applied in this use case, was based on the hypothesis that there is a correlation between safety performance, human error frequency, and the characteristic of the operator–task performed match. The results imply that optimizing worker–task matching would have positive effects in terms of human error reduction and safety performance improvement. The testing performed on a case study composed of 137 operators and 2 assembly lines of 61 workstations provided the following insights.
The test performed to assess human capability (HC) highlighted a large range of variability in the results, confirming its effectiveness in discriminating between different level of individual personal skills.
The HC value and composition significantly change from worker to worker; some operators reported good performance in some tests and bad performance in others. As an example, a couple of workers had very good results in the memory test and middling results in the Precision and “Both Hands” tests. This means that tests are independent from each other; they measure different skills, and they did not provide redundant information on HC. In relation to the assessment of workload (WL) requirements, the observed WL, resulting in indices and their variability, both as global values and or as compositions, highlighted the following points.
WL composition had a strong degree of variation across workstations; in fact, all four indices (IM, IC, IV, and IPS) were varying along the assembly lines, even if all workstations were characterized by the same tack-time.
Workstations in the same assembly line can require different type of skills and capabilities for their tasks to be performed correctly; even when they present the same overall workload indices, the scores among the various indices used to characterise them were often significantly different from each other.
The combination of WL and HC according to the HP rules reported in Figure 5 allowed the definition of a matching process to assign operators to workstations where they can perform better. Based on the project results, a reconfiguration of the operators’ distribution was carried out. This step involved 68% of the worker population for the two lines. A set of four indicators was proposed to monitor, in the medium and long terms, the reconfiguration impact on safety and productivity.
Preliminary results reported positive impacts in terms of a minor frequency of soft medical treatments required by workers during the working day.
More information on the TERM results will be collected going forward.
The application of the TERM for this case study was based on the identification of a set of operational variables able to characterise workload (WL) and human capability (HC) [16]. The model may be developed further considering other variables, such as “situational awareness” [32,33], which could be introduced into the HC part of the model to assess human performance for tasks that are more cognitive-demanding, but also social and interactional aspects, when relevant.
Furthermore, as has been previously presented, it is possible to adopt a weighted algorithm that promotes a more detailed analysis of the importance of each single skill set requirement for each workstation, making the model more accurate. The framework was adapted in an operational model able to provide test results applicable to local conditions, but the approach is transferrable when considering data in other manufacturing contexts, as demonstrated in another study [14]. The underpinning theoretical assumption is still based on the idea of obtaining comparable assessments for workload/task complexity and corresponding human capabilities as the main predictors of human performance and moving towards a more robust data-driven method for managing human-reliability-related issues [34].
Future applications will need to operationalise variables that can potentially characterise more advanced automated contexts, such as ones related to human–robotic collaborative environments [35,36,37]. Furthermore, transferability studies on other industrial domains were already explored in an electronic device production plant; however, due to the data available with which to characterise the task and its features, a different set of results was effectively obtained, as reported in another paper [14].
It is important to note that the model does not intend to provide any basis for possible operators’ stigmatization but rather to offer a more transparent framework for task allocation and capability assessment, alongside a thorough examination of workload demands associated with each workstation. Furthermore, our applied research experience suggests that the best way to approach issues related to human performance improvement and the enhancement of safety indicators in the workplace is by adopting a participatory approach [38,39] able to consider the points of view of the different stakeholders and have them involved in the journey from the very beginning.

Author Contributions

Conceptualization, L.C., M.D. and M.C.L.; methodology, L.C., C.A.M. and M.C.L.; validation, L.C. and F.M.; investigation, L.C.; resources, F.M.; data curation, L.C.; writing—original draft preparation, all authors; writing—review and editing, M.C.L., M.D., F.M. and L.C.; visualization, M.C.L., L.C. and C.A.M.; supervision, M.D., M.C.L. and L.C. All authors have read and agreed to the published version of the manuscript.

Funding

This research benefited from the CISC project that has received funding from the European Union’s Horizon 2020 Research and Innovation Programme under the Marie Skłodowska-Curie grant agreement no. 955901.

Institutional Review Board Statement

The study was conducted in accordance with the Declaration of Helsinki, and was approved by the Institutional Review Board (or Ethics Committee) of Technological University Dublin (protocol code REC-20-52, first issued on 24/10/2020).

Informed Consent Statement

Informed consent was obtained from all subjects involved in the study, and an informative meeting was also held with the trade unions of the workers involved.

Data Availability Statement

The data used in this study were not released publicly due to restrictions imposed by the company involved.

Conflicts of Interest

The authors declare no conflict of interest.

References

  1. Acemoglu, D.; Restrepo, P. Concluding remarks. In Robots and Jobs: Evidence from US Labor Maekets, 2nd ed.; NBER Working Paper Series, Working Paper 23285; National Bureau of Economic Research: Cambridge, MA, USA, 2017; pp. 1–37. [Google Scholar]
  2. Kovacs, O. The dark corners of industry 4.0—Grounding economic governance 2.0. Technol. Soc. 2018, 55, 140–145. [Google Scholar] [CrossRef]
  3. Finnerty, B.M.; Afaneh, C.; Aronova, A. General surgery training and robotics: Are residents improving their skills? Surg. Endosc. 2016, 30, 567–573. [Google Scholar] [CrossRef]
  4. Dzedzickis, A.; Subačiūtė-Žemaitienė, J.; Šutinys, E.; Samukaitė-Bubnienė, U.; Bučinskas, V. Advanced applications of industrial robotics: New trends and possibilities. Appl. Sci. 2021, 12, 135. [Google Scholar] [CrossRef]
  5. Baines, T.S.; Asch, R.; Hadfield, L.; Mason, J.P.; Fletcher, S.; Kay, J.M. Towards a theoretical framework for human performance modelling within manufacturing systems design. Simul. Model. Pract. Theory 2005, 13, 451–524. [Google Scholar] [CrossRef] [Green Version]
  6. Baldissone, G.; Comberti, L.; Bosca, S.; Murè, S. The analysis and management of unsafe acts and unsafe conditions. Data collection and analysis. Saf. Sci. 2019, 119, 240–251. [Google Scholar] [CrossRef]
  7. Kolus, A.; Wells, R.; Neumann, P. Production quality and human factors engineering: A systematic review and theoretical framework. Appl. Ergon. 2018, 73, 55–89. [Google Scholar] [CrossRef]
  8. Rodriguez-Perez, J.P. Human Error Reduction in Manufacturing; Quality Press: Milwaukee, WI, USA, 2023. [Google Scholar]
  9. Ghodrati, N.; Yiu, T.W.; Wilkinson, S.; Poshdar, M.; Talebi, S.; Elghaish, F.; Sepasgozar, S.M.E. Unintended Consequences of Productivity Improvement Strategies on Safety Behaviour of Construction Labourers; A Step toward the Integration of Safety and Productivity. Buildings 2022, 12, 317. [Google Scholar] [CrossRef]
  10. Jeanson, L.; Bastien, J.C.; Morais, A.; Barcenilla, J. Reducing kitting errors in automotive industry through the reorganization of workstations layout: A mental workload approach. In Proceedings of the H-Workload 2019: 3rd International Symposium on Human Mental Workload: Models and Applications, Rome, Italy, 14–15 November 2019; p. 85. [Google Scholar] [CrossRef]
  11. Falck, A.C.; Örtengren, R.; Rosenqvist, M. Assembly Failures and Action Cost in Relation to Complexity Level and Assembly Ergonomics in Manual Assembly (Part 2). Int. J. Ind. Ergon. 2014, 44, 455–459. [Google Scholar] [CrossRef]
  12. Groth, K.M.; Mosleh, A. A data-informed PIF hierarchy for model—Based Human Reliability Analysis. Reliab. Eng. Syst. Saf. 2012, 108, 154–174. [Google Scholar] [CrossRef]
  13. Battaglia, M.; Frey, M.; Passetti, E. Accidents at work and costs analysis: A field study in a large italian company. Ind. Health 2014, 52, 354–366. [Google Scholar] [CrossRef] [Green Version]
  14. Leva, M.C.; Demichela, M.; Comberti, L.; Caimo, A. Human performance in manufacturing tasks: Optimization and assessment of required workload and capabilities. Saf. Sci. 2022, 154, 105838. [Google Scholar] [CrossRef]
  15. Rani, N.A.; Aziz, F.A.; Hemdi, A.R.; Hamid, A.; Khusaini, N.S. Human Machine Interaction: Application of Rasch Model in Measures Learning Ability of Handling CNC Milling Machine. Hasniza Nordin Izwan Nizal Mohd Shaharanee Wan Hussain Wan Ishak Fadhilah Mat Yamin. In Proceedings of the Inspirational Scholar Symposium (ISS), Hatyai, Thailand, 12–13 December 2019; Volume 492. [Google Scholar]
  16. Osman, S.A.; Naam, S.I.; Omar, M.Z.; Jamaluddin, N.; Kofli, N.T.; Ayob, A.; Johar, S. Employer Perceptions of Student Ability during Industrial Training as Assessed by the Rasch Model. Procedia Soc. Behav. Sci. 2013, 102, 134–140. [Google Scholar] [CrossRef]
  17. Jacob, E.R.; Duffield, C.; Jacob, A.M. Validation of data using RASCH analysis in a tool measuring changes in critical thinking in nursing students. Nurse Educ. Today 2019, 76, 196–199. [Google Scholar] [CrossRef]
  18. Wickens, C.D. Mental workload: Assessment, prediction, and consequences. In International Symposium on Human Mental Workload: Models and Applications; Springer: Cham, Switzerland, 2017; pp. 18–29. [Google Scholar]
  19. Aneziris, O.; Nivolianitou, Z.; Konstantinidou, M.; Plot, E.; Mavridis, G. Knowledge management in total safety for major hazards plants. In Total Safety and the Productivity Challenge; Routledge, Taylor and Francis Group: Abingdon-on-Thames, UK, 2019; p. 161. [Google Scholar]
  20. Leva, M.C.; Caimo, A.; Duane, R.; Comberti, L.; Demichela, M. Task complexity, and operators’ capabilities as predictor of human error: Modelling framework and an example of application. In Proceedings of the European Safety and Reliability Conference, ESREL 2018, Trondheim, Norway, 17–21 June 2018. [Google Scholar]
  21. Longo, L.; Leva, M.C. (Eds.) Human Mental Workload: Models and Applications: First International Symposium, H-WORKLOAD 2017, Dublin, Ireland, 28–30 June 2017, Revised Selected Papers; Springer: Berlin/Heidelberg, Germany, 2017; Volume 726. [Google Scholar]
  22. Comberti, L.; Leva, M.C.; Demichela, M.; Desideri, S.; Baldissone, G.; Modaffari, F. An Empirical Approach to Workload and Human Capability Assessment in a Manufacturing Plant. In International Symposium on Human Mental Workload: Models and Applications; Springer: Cham, Switzerland, 2019; pp. 180–201. [Google Scholar]
  23. Baine, T.S.; Benedettini, O. Modelling human performance within manufacturing systems design: From a theoretical towards a practical framework. J. Simul. 2007, 1, 121–1306. [Google Scholar] [CrossRef] [Green Version]
  24. Erdinç, O.; Yeow, P.H. Proving External Validity of Ergonomics and Quality Relationship through Review of Real-World Case Studies. Int. J. Prod. Res. 2011, 49, 949–962. [Google Scholar] [CrossRef]
  25. Punnett, L.; Fine, L.J.; Keyserling, W.M.; Herrin, G.D.; Chaffin, D.B. Shoulder Disorders and Postural Stress in Automobile Assembly Work. Scandinavian Journal of Work. Environ. Health 2001, 26, 283–291. [Google Scholar]
  26. Leva, M.C.; Builes, Y. The benefits of task and cognitive workload support for operators in ground handling. In International Symposium on Human Mental Workload: Models and Applications; Springer: Cham, Switzerland, 2017; pp. 225–238. [Google Scholar]
  27. Greenwood, D.J.; Levin, M. Introduction to Action Research: Social Research for Social Change, 2nd ed.; SAGE Publications: London, UK, 2007; ISBN 1-4129-2597-5. [Google Scholar]
  28. Colombini, D.; Occhipinti, E.; Alvarez-Casado, E. The Revised OCRA Checklist Method; Humans Factor Editorial: Barcelona, Spain, 2013; ISBN 978-84-616-2965-7. [Google Scholar]
  29. Mijović, P.; Milovanović, M.; Ković, V.; Gligorijević, I.; Mijović, B.; Mačužić, I. Neuroergonomics method for measuring the influence of Mental Workload Modulation on cognitive state of manual assembly worker. In International Symposium on Human Mental Workload: Models and Applications; Springer: Cham, Switzerland, 2017; pp. 213–224. [Google Scholar]
  30. Cagno, E.; Micheli, G.J.; Jacinto, C.; Masi, D. An interpretive model of occupational safety performance for Small-and Medium-sized Enterprises. Int. J. Ind. Ergon. 2014, 44, 60–74. [Google Scholar] [CrossRef]
  31. Fiasché, M.; Pinzone, M.; Fantini, P.; Alexandru, A.; Taisch, M. Human-centric factories 4.0: A mathematical model for job allocation. In Proceedings of the 2016 IEEE 2nd International Forum on Research and Technologies for Society and Industry Leveraging a better tomorrow (RTSI), Bologna, Italy, 7–9 September 2016; pp. 1–4. [Google Scholar] [CrossRef]
  32. Munir, A.; Aved, A.; Blasch, E. Situational awareness: Techniques, challenges, and prospects. AI 2022, 3, 55–77. [Google Scholar] [CrossRef]
  33. Endsley, M.R. Toward a Theory of Situation Awareness in Dynamic Systems. Hum. Factors J. Hum. Factors Ergon. Soc. 1995, 37, 32–64. [Google Scholar] [CrossRef]
  34. Morais, C.; Estrada-Lugo, H.D.; Tolo, S.; Jacques, T.; Moura, R.; Beer, M.; Patelli, E. Robust data-driven human reliability analysis using credal networks. Reliab. Eng. Syst. Saf. 2022, 218, 107990. [Google Scholar] [CrossRef]
  35. Villani, V.; Sabattini, L.; Czerniak, J.N.; Mertens, A.; Fantuzzi, C. MATE robots simplifying my work: The benefits and socioethical implications. IEEE Robot. Autom. Mag. 2018, 25, 37–45. [Google Scholar] [CrossRef] [Green Version]
  36. Savković, M.; Caiazzo, C.; Djapan, M.; Vukićević, A.M.; Pušica, M.; Mačužić, I. Development of modular and adaptive laboratory set-up for neuroergonomic and human-robot interaction research. Front. Neurorobotics 2022, 16, 863637. [Google Scholar] [CrossRef] [PubMed]
  37. Martinetti, A.; Chemweno, P.K.; Nizamis, K.; Fosch-Villaronga, E. Redefining safety in light of human-robot interaction: A critical review of current standards and regulations. Front. Chem. Eng. 2021, 3, 32. [Google Scholar] [CrossRef]
  38. Wilson, J.R. Fundamentals of systems ergonomics/human factors. Appl. Ergon. 2014, 45, 5–13. [Google Scholar] [CrossRef]
  39. Bjärntoft, S.; Hallman, D.M.; Zetterberg, C.; Larsson, J.; Edvinsson, J.; Jahncke, H. A Participatory Approach to Identify Key Areas for Sustainable Work Environment and Health in Employees with Flexible Work Arrangements. Sustainability 2021, 13, 13593. [Google Scholar] [CrossRef]
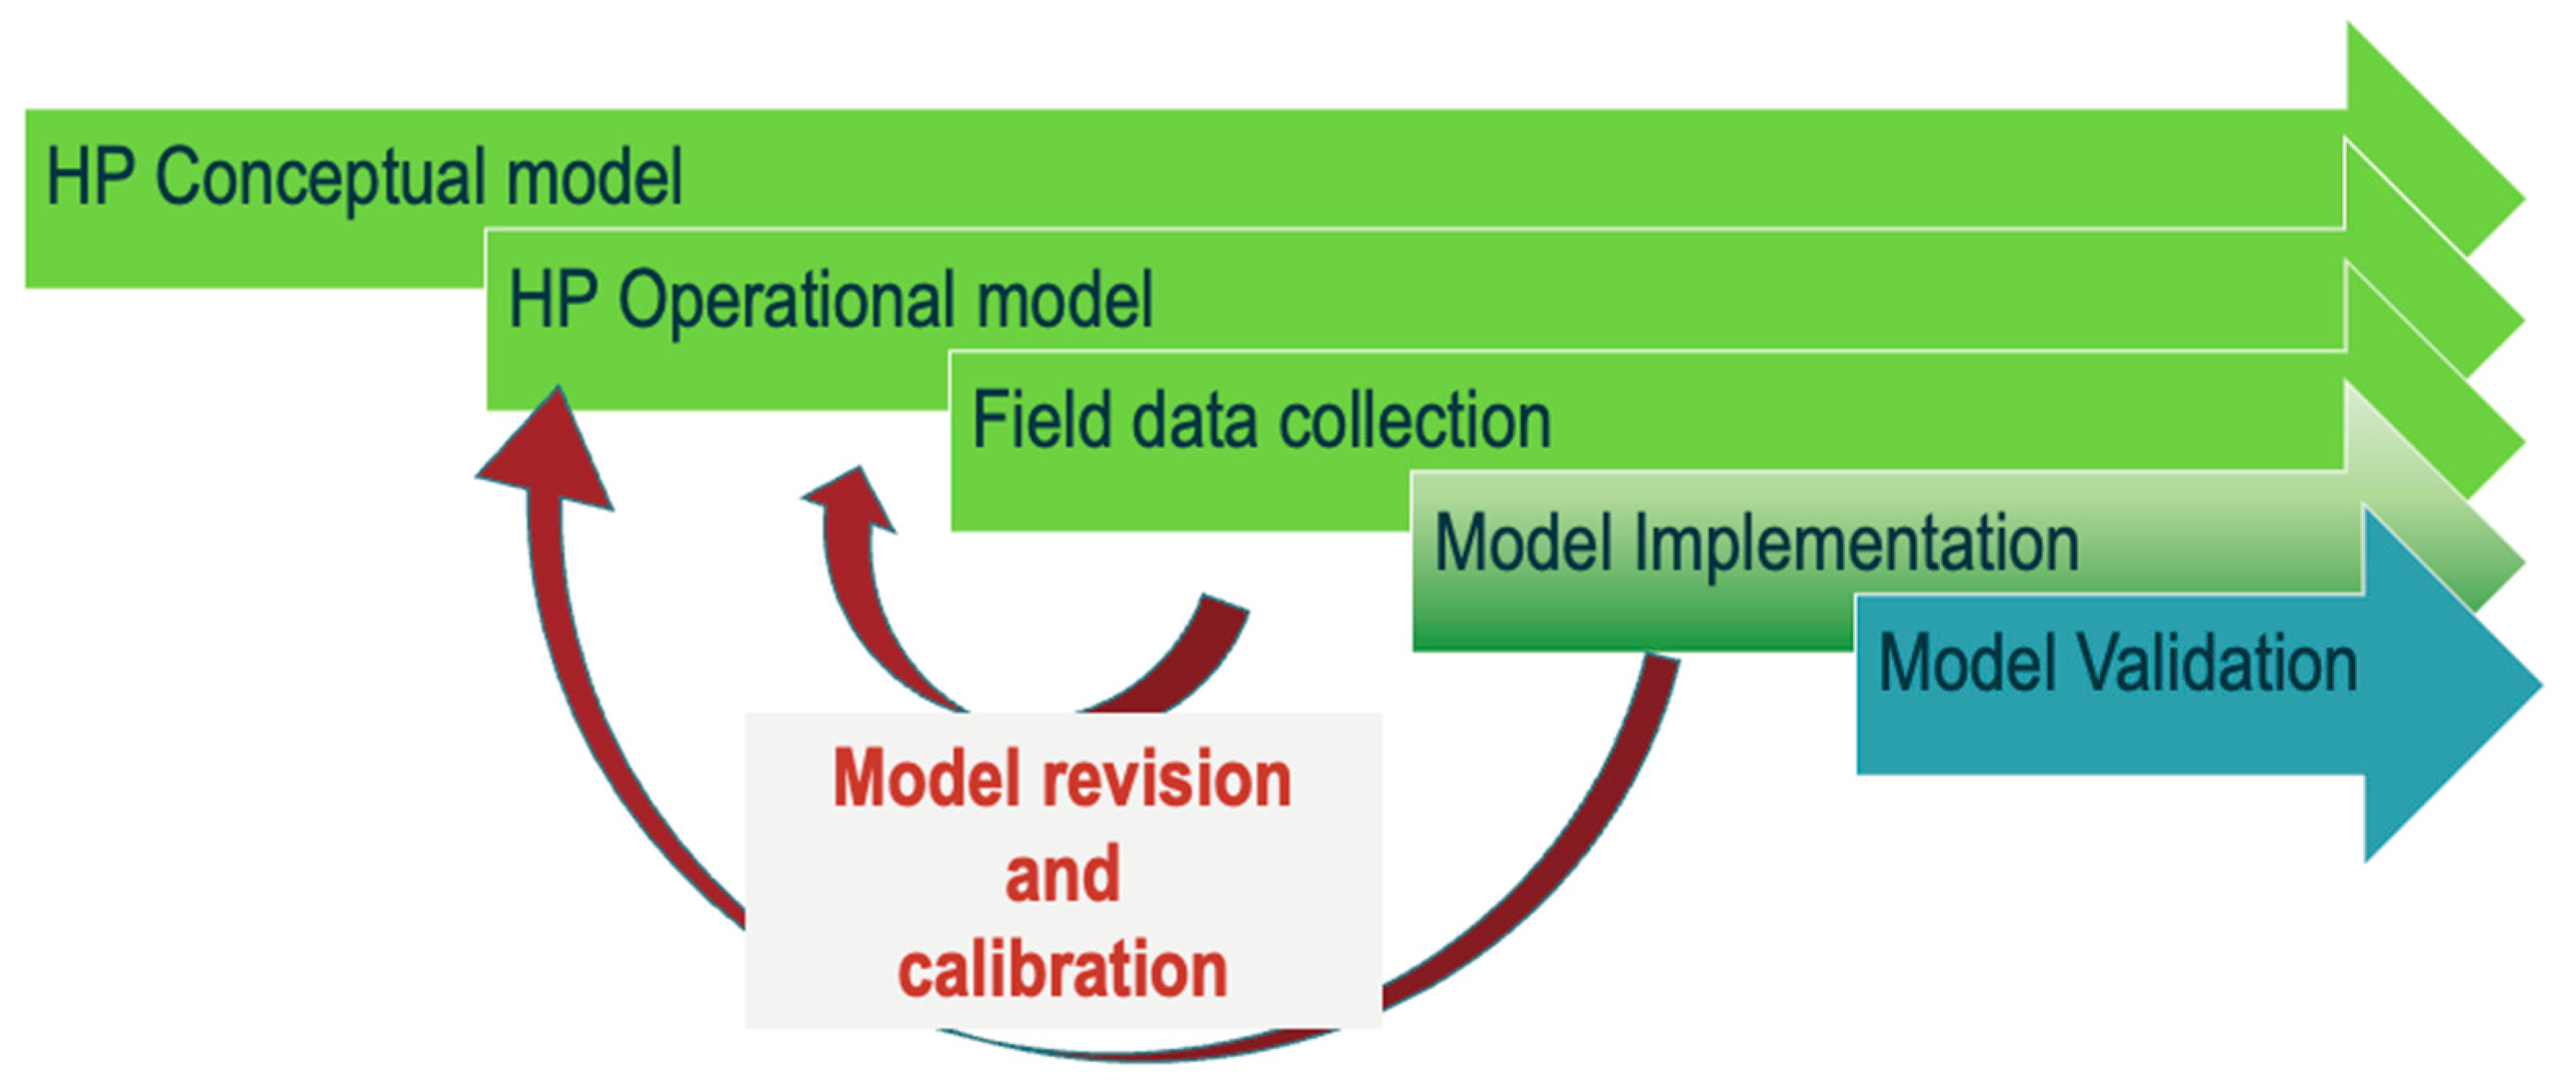
Figure 1. Overview of the main steps followed in the overall approach.
Sustainability 15 11097 g001
Figure 2. Human performance (HP) assessment conceptual model general scheme [22].
Sustainability 15 11097 g002
Figure 3. WL conceptual model scheme.
Sustainability 15 11097 g003
Figure 4. HC genesis process.
Sustainability 15 11097 g004
Figure 5. WL genesis process.
Sustainability 15 11097 g005
Figure 6. HP rules of calculation.
Sustainability 15 11097 g006
Figure 7. Sample of matching matrix (the table’s background colour becomes darker as the score becomes more negative, indicating nonsuitable matching between operators and workstations).
Sustainability 15 11097 g007
Figure 8. Precision test results.
Sustainability 15 11097 g008
Figure 9. Methodology test results.
Sustainability 15 11097 g009
Figure 10. Both Hands test results.
Sustainability 15 11097 g010
Figure 11. Memory test results.
Sustainability 15 11097 g011
Figure 12. HC distribution for workers of Line 1.
Sustainability 15 11097 g012
Figure 13. HC distribution for workers of Line 2.
Sustainability 15 11097 g013
Figure 14. WL assessment of Line 1.
Sustainability 15 11097 g014
Figure 15. WL assessment of Line 2.
Sustainability 15 11097 g015
Figure 16. Matching matrix.
Sustainability 15 11097 g016
Table 1. Table of transition from test results to HC indices.
Precision TestMethod TestBoth Hands TestMemory Test
ResultLikert ValueResultLikert ValueResultLikert ValueResultLikert Value
<2410<6710<8510<791
25–29968–76986–95980–892
30–34877–86896–105890–993
35–39787–967106–1157100–1094
40–44697–1066116–1256110–1195
45–495107–1165126–1405120–1296
50–544117–1264141–1554130–1397
55–593127–1363156–1703140–1498
60–642137–1462171–1992150–1599
>651>1471>2001>16010
Table 2. Table of HP indices with and without the weighted method.
WorkstationTCHPmWeighted HPm
C I V I D R I P W
1646410 10.4
288221016
3317910 3.6
Disclaimer/Publisher’s Note: The statements, opinions and data contained in all publications are solely those of the individual author(s) and contributor(s) and not of MDPI and/or the editor(s). MDPI and/or the editor(s) disclaim responsibility for any injury to people or property resulting from any ideas, methods, instructions or products referred to in the content.