Article

The Coordinated Development of Ecosystem Services and Farming Household Livelihood Security: A Case Study of the Dongting Lake Area in China

1
School of Furniture and Art Design, Central South University of Forestry and Technology, Changsha 410004, China
2
School of Business, Central South University of Forestry and Technology, Changsha 410004, China
*
Author to whom correspondence should be addressed.
Sustainability 2023, 15(14), 11121; https://doi.org/10.3390/su151411121
Submission received: 2 June 2023 / Revised: 8 July 2023 / Accepted: 14 July 2023 / Published: 17 July 2023
(This article belongs to the Section Development Goals towards Sustainability)

Abstract

:
Ecosystem services (ESs) are an important basis for maintaining farming household livelihood security and achieving the synergistic and efficient development of ecosystem services, and farming household livelihood security is important for maintaining sustainable development in the region. However, it is difficult to quantify the level of the coordinated development of ESs and farming household livelihood security in a region and their dynamic evolution. This study systematically analyzes the spatio-temporal evolution of the production-living-ecological space, ecosystem service values, and farming household livelihood security in the Dongting Lake from 2000 to 2020 based on land use data, as well as the level of coordinated development of ESs and livelihood security of farmers. The results indicate that more than 80% of the Dongting Lake area has a low level of coordinated development of ESs and farming household livelihood security at or below the level of imminent disorder, but it is on the rise, increasing by 6.32% in the past twenty years. This study can provide a reference for decision-making on the coordinated development of ecological environment and farmers’ livelihoods in the Dongting Lake area.

1. Introduction

Production-living-ecological space (PLES) is a concept that reflects the different functions and demands of land resources for human activities. It consists of three types of spaces: production space, living space, and ecological space [1,2]. Production space refers to the space for agricultural or industrial production activities; living space is that required for living, consumption, leisure and entertainment functions; and ecological space is that for regulating, maintaining, and protecting ecological security functions [3,4]. PLES is the basic site of all human activities and the coordinated development of these three spaces is prerequisite to achieving sustainable development goals [5]. However, with rapid urbanization and economic growth, PLES has faced many challenges in China [6,7]. On the one hand, the expansion of production and living spaces has encroached on ecological space, resulting in the degradation and loss of ecosystem services (ESs) and ecological security [8,9]. On the other hand, the imbalance and mismatch of PLES has affected the efficiency and quality of production and living activities, leading to low rates of land utilization, increased resource consumption, and environmental pollution [10].
ESs refer to the benefits that humans obtain from ecosystems, including tangible material products as well as intangible services provided by natural ecosystems to meet and sustain human needs [11,12]. ESs are critical to sustaining human well-being and development, especially for rural communities that are directly dependent on natural resources [13,14]. However, with rapid environmental, social, and economic changes, many rural communities are facing ES degradation and decline, and the resulting livelihood insecurity and vulnerability [15]. Therefore, how to promote the livelihood resilience of farming households and improve their ability to cope with and resist changes in ESs is an important goal of sustainable development.
Farming household livelihood is a key aspect of human well-being and social development, especially in rural areas where people depend heavily on natural resources and ecosystems [16,17]. Farming household livelihood security is an important dimension of farming household livelihood, referring to the ability of farming households to meet their basic survival and development needs, to cope with external risks and shocks, and to participate in socio-economic development opportunities [18,19]. Farming household livelihood security not only reflects the current situation of farming household livelihood, but also affects its sustainability [20,21]. Farming household livelihood security is influenced by various factors, such as the natural environment, social economy, policy system, etc. [22,23,24,25]. Among them, ESs play an important role in providing material income, risk mitigation, cultural identity, and other aspects of support for farming household livelihood [26,27].
Farming households are also the main actors and decision-makers in rural areas, whose livelihood strategies and activities determine the ways and intensity of their intervention on the local ecological environment [28,29]. Livelihood strategies refer to the activities or choices and their combinations that people adopt to achieve their livelihood goals, which are based on asset access, opportunity perception and actor preferences [30,31]. Livelihood strategies are dynamic and changeable, as farming households tend to transform their livelihood strategies to adapt to the new human-environment relationship when the environmental background, livelihood-related assets, and policy system change dramatically [32,33]. The transformation of livelihood strategies can affect the supply and demand of ESs by changing the land use structure and intensity at different spatial scales [34,35].
There is a complex and dynamic interaction and feedback system between land use transition, ESs, and farming household livelihood security (Figure 1). PLES is a carrier of ESs and farmer livelihood security; ESs provide various ecosystem service functions for farming household livelihood security, while farming household livelihood security utilizes, disrupts, promotes or relies on ESs. However, the existing studies lack a systematic and in-depth discussion on the relationship between PLES, ESs, and farming household livelihood security, especially from the perspective of coordinated development. Coordinated development refers to the degree of matching and synergy between two or more elements in terms of quantity, quality, structure, and function [36]. Most of the existing studies focus on ESs value assessment, ES supply demand balance, and farming household livelihood security assessment. For example, Sannigrahi et al. assessed the value of ESs in a natural reserve area to strengthen protection and conservation [37]. Jiang et al. studied the supply demand balance of ESs in an ecological restoration hotspot in Southwest China and identified its spatial determinants [38]. Thao et al. evaluated the impact of drought on livelihood vulnerability in Dak Nong Province, Vietnam [39]. While few studies have conducted discussions on the synergistic development of ESs and farming household livelihood security, it is even rarer to conduct research on this issue from the perspective of PLES. Dongting Lake is the second largest freshwater lake in China and is located in the middle reaches of the Yangtze River. The Dongting Lake area is rich in natural resources and biodiversity, which are important for water security, flood regulation, national food security and ecological safety. The Dongting Lake area is also a typical agricultural region where agricultural activities are the main source of income and livelihood for local farming households. However, in recent years, due to human activities and climate change, the Dongting Lake area is facing multiple pressures such as ecological degradation, water environment degradation, and land use changes, which not only threaten the ecological functions and services of the Dongting Lake area, but also affect the production and livelihood security of local farmers. Therefore, this study quantified the values of ecosystem services and farming household livelihood security in the Dongting Lake area from 2000 to 2020; furthermore, it studied the levels of their coordinated development and their spatial and temporal heterogeneity with a view to filling the gaps in existing studies and providing references for decision-making on the sustainable development of ecological environment and farmers’ livelihoods in the Dongting Lake area.

2. Materials and Methods

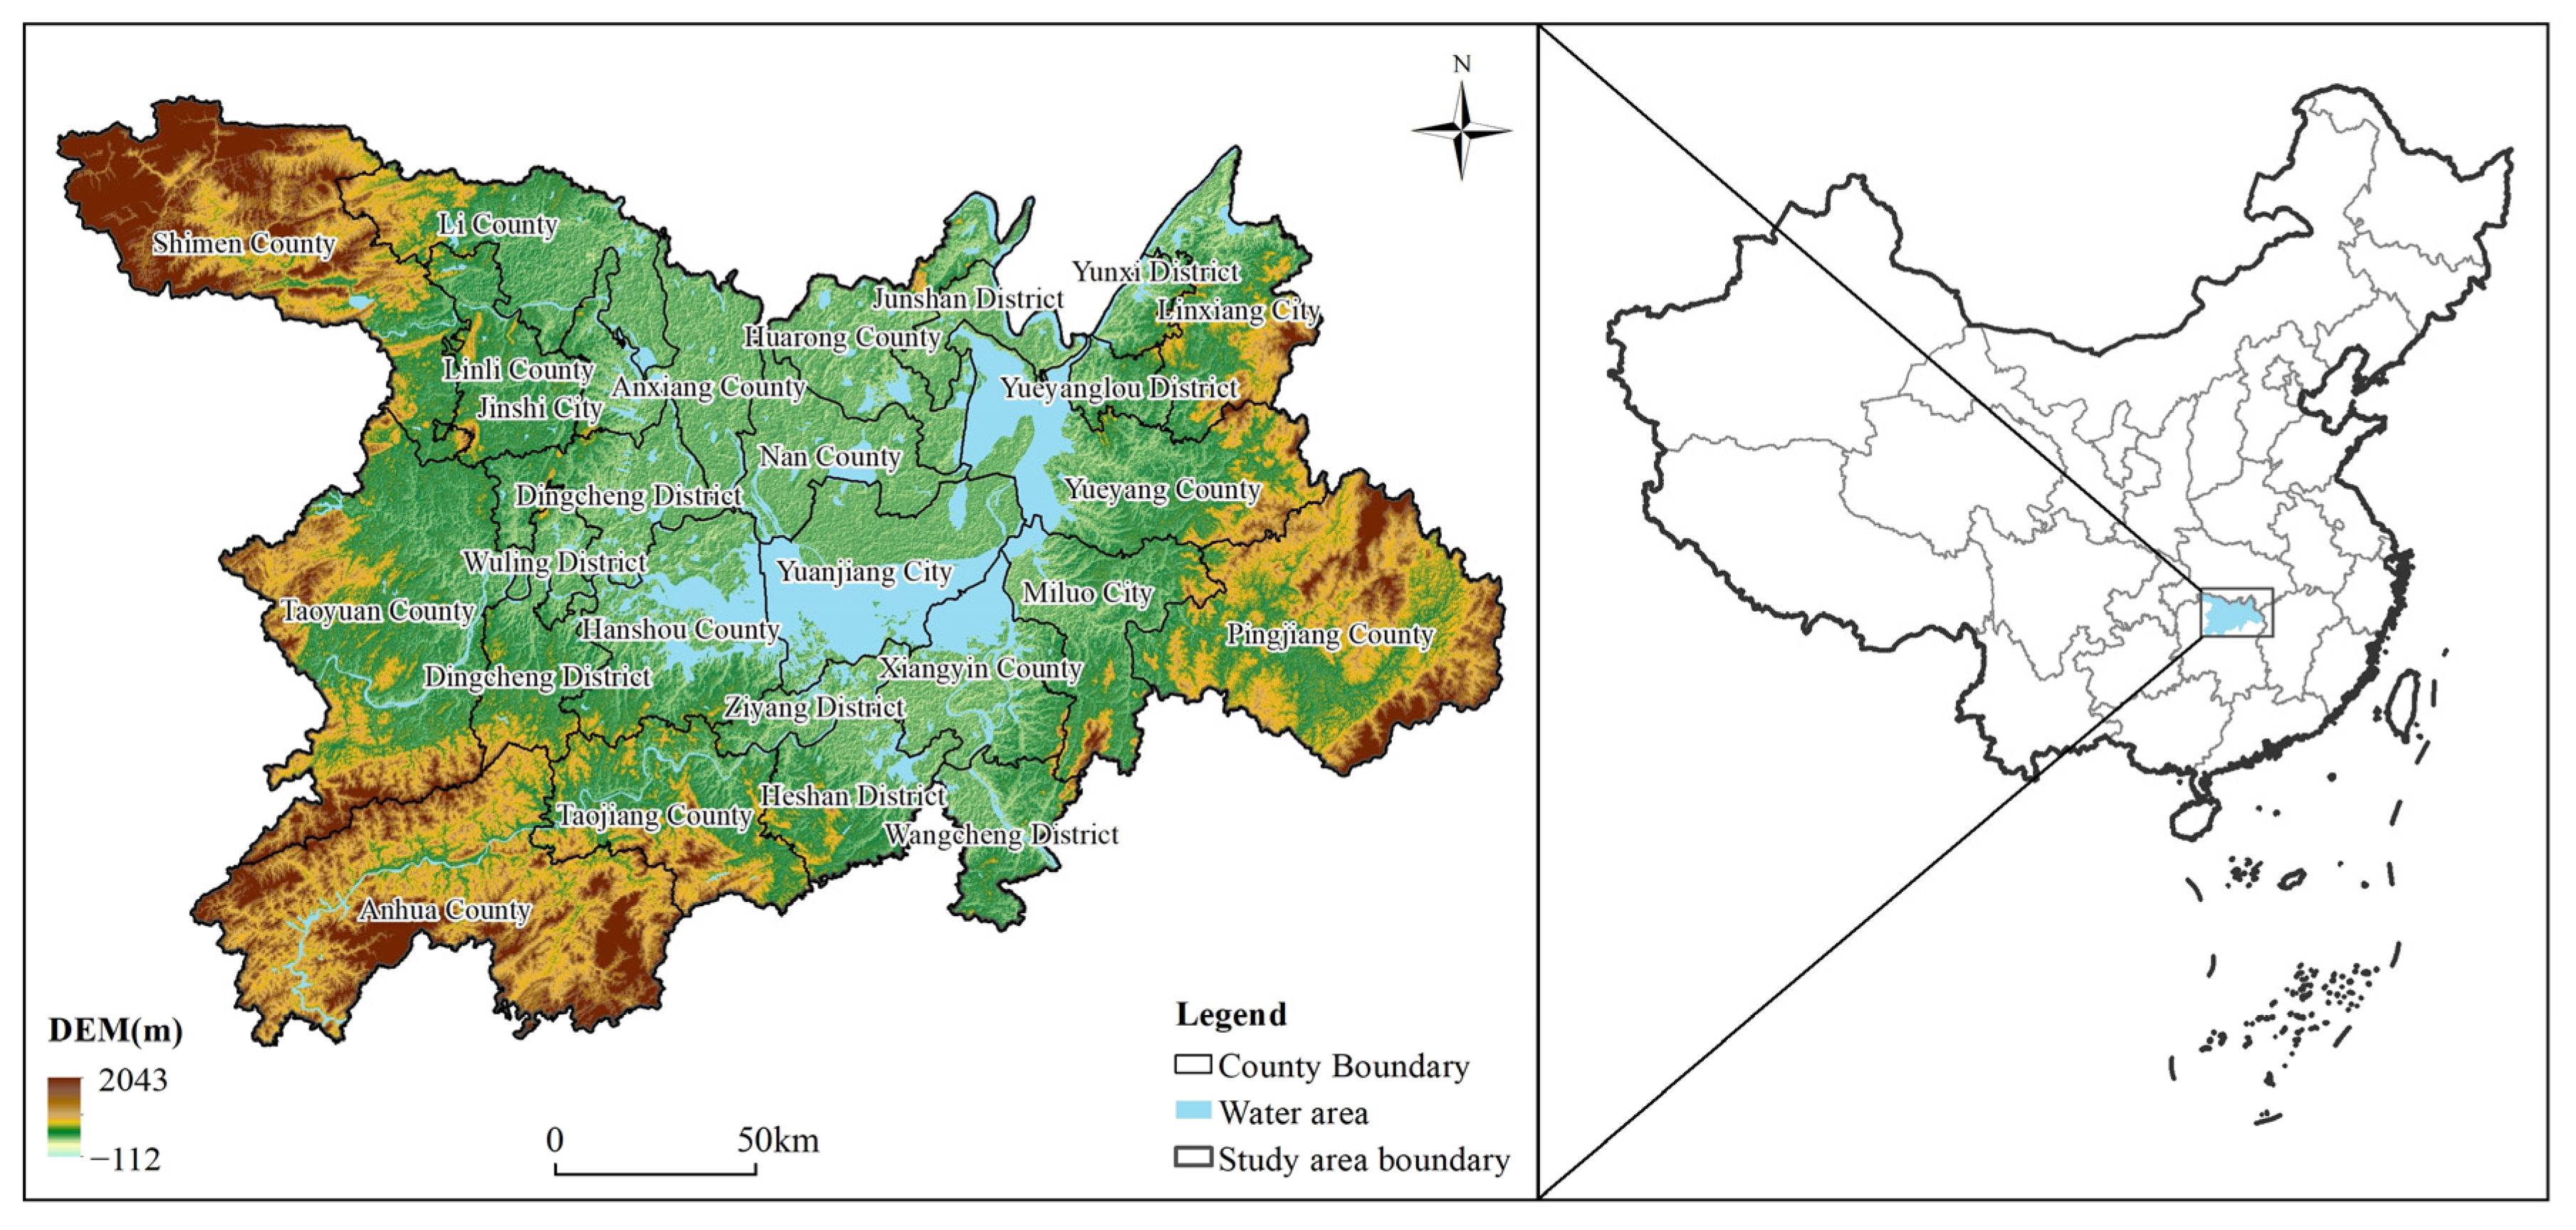
2.1. Overview of the Dongting Lake Area

The Dongting Lake Eco-Economic Zone approved by the State Council of China in 2014 covers three cities and one district in Hunan Province (Yueyang City, Changde City, Yiyang City, Wangcheng District) and Jingzhou City in Hubei Province, with more than 85% of the area located in Hunan Province, and the three cities and one district in the Dongting Lake Eco-Economic Zone located in Hunan Province are selected as the area of interest herein (hereafter referred to as the Dongting Lake area). The Dongting Lake area (110°34′ to 114°10′ E, 27°58′ to 30°08′ N) is located on the south bank of the middle reaches of the Yangtze River and in the north of Hunan Province, with a total area of 46,300 km2 (Figure 2). It has a typical subtropical monsoonal humid climate with simultaneous rain and heat and four distinct seasons. The Dongting Lake area is surrounded by mountains in the southeast and west, with an opening in the north. The central lake area is low and flat, with 72.86% of the area below 200 m above sea level, rich in arable land, forest land, and water resources, and is an important commodity food base in China [40]. As of 2020, the resident population of the Dongting Lake area is about 15,149,300, accounting for 22.77% of the population of Hunan Province, including 6,438,000 rural people, and the gross regional product is about 1.05 trillion yuan, accounting for 28.87% of the GRP of Hunan Province. The Dongting Lake area has remarkable advantages in agricultural resources and contains one of the important granaries of China. The Dongting Lake area is also rich in natural resources and biodiversity, providing local farmers with diverse ESs, such as agriculture, fisheries, forestry, water resources, and tourism. However, the Dongting Lake area also faces serious environmental challenges, such as climate change, water pollution, land degradation, and ecosystem destruction [41]. These challenges not only affect the supply and quality of ES, but also threaten the livelihood security and sustainability of farmers. In addition, policies such as the 10-year fishing ban on the Yangtze River, the return of fields to lakes, the return of farmland to forests and wetlands, and the Dongting Lake Ecological and Economic Zone Plan have exerted a profound influence on the livelihood security and ESs of farmers in the region in recent years.

2.2. Data

The data used in the present work can be divided into three categories: administrative boundary vector data of China and the Dongting Lake area, land use, normalized vegetation index, rainfall, net primary productivity (NPP) raster data and socio-economic data pertaining to the Dongting Lake area. The administrative boundary vector data and rainfall raster data were obtained from the National Earth System Science Data Center of China (http://www.geodata.cn/, accessed on 15 November 2022), and the land use and normalized vegetation index raster data were obtained from the Resource and Environment Science Data Center of the Chinese Academy of Sciences (https://www.resdc.cn/, accessed on 15 November 2022). The data relating to socio-economic indicators used to evaluate the level of farming household livelihood security were obtained from the China Statistical Yearbook of Urban Construction, Hunan Statistical Yearbook, and the Population Census Sub-County Information. The NPP data used to adjust the value of ESs were obtained from the MOD17A3 dataset (MODIS product data).
In addition, according to the needs of the present study and with reference to the existing research results [42], the land use data were reclassified (Table 1), and the normalized vegetation index and rainfall raster data used to evaluate the livelihood security level of farmers were counted to the county by the average value, and the national average value of NPP of each secondary PLES was also counted to meet the need to adjust the value of ESs.

2.3. Methods

2.3.1. Land Use Transformation Chart

The land use information chart is a composite research method for studying “spatial patterns” and “time processes” [43]. This article uses the “raster calculator” tool of ArcGIS to construct land use information charts for two time periods: 2000–2010 and 2010–2020.
C = 10 × A + B
where, A and B, respectively represent the land use type codes at the beginning and end of the period; C is the newly generated chart code, which represents a change in the land-use type from A to B.

2.3.2. Valuing Ecosystem Services

The equivalent factor method was used to assess the value of ESs in the Dongting Lake area for each period [44]. Firstly, the value of one standard equivalent factor in the Dongting Lake area was calculated for each year:
D = 1 7 × j = 1 3 a j × p j × q j A
where D is the value of one standard equivalent factor (yuan/ha); a j , p j and q j are the sown area, average price, and unit area yield of the three food crops with the largest planting area in the Dongting Lake area, respectively, and A is the total planted area of the three food crops with the largest coverage in the area.
The level of agricultural production technology, the price level of crops and the inflation rate vary in different periods, which will have a significant impact on the calculation of standard equivalent factors and weaken the comparability of ecosystem service values in different years. Therefore, it is necessary to revise the standard equivalent factors for different years. Taking 2020 as the base year, the fixed-base food consumer price index (FCPI) of Hunan Province from 2000 to 2020 was used to revise the standard equivalent factors for 2000 and 2010:
D k = c × D k
c = F C P I n / 100 F C P I k / 100
where D k is the revised standard equivalence factor for year k; c represents the correction factor; D k is the standard equivalence factor before correction; and F C P I n and F C P I k are the fixed base FCPI for year n and year k, respectively.
Then, the ecosystem service equivalence table of PLES in the Dongting Lake area was calculated by referring to the existing studies [45,46] and combining the area of different land types (Table 2).
Finally, the values of various ESs were adjusted and summed using NPP [47]:
E S V = i = 1 6 j = 1 11 A i × e i j × D × P i
P i = B i B i ¯
where E S V is the ecosystem service value; A i denotes the distribution area (ha) of the secondary PLES of category i ; e i j is the equivalent of column j of row i in Table 2; D is the standard equivalence factor; P i represents the NPP adjustment factor of the secondary PLES of category i ; B i and B i ¯ refer to the NPP value of the secondary PLES of category i and the national average value, respectively.

2.3.3. Farming Household Livelihood Security Evaluation

Based on the pressure–state–response model, considering the actual situation and data availability of the research area comprehensively, a farming household livelihood security evaluation system (Table 3) was constructed from four perspectives: pressure, state, response, and impact, referring to existing research [48]. To avoid the interference of subjective factors, the entropy method was used to calculate the weights of each indicator of farming household livelihood security evaluation system.

2.3.4. Coupling Coordination Degree Model

The concept of coupling originates from physics, which refers to the phenomenon of two or more systems interacting and influencing each other through some means [49]. Degree of coordination of coupling comprehensively characterizes the coupling situation and level of development of two or more systems. The degree of coordination of coupling was used to evaluate the level of coordination of development of ESs and farming household livelihood security in the Dongting Lake area.
C = 2 U 1 × U 2 / ( U 1 + U 2 )
T = i = 1 n α i × U i , i = 1 n α i = 1
D = C × T
where C is the degree of coupling of ESs and farming household livelihood security; U 1 and U 2 are the evaluation values of ESs and farming household livelihood security, respectively; the closer the values of U 1 and U 2 are, the greater the value of C ; T is the comprehensive evaluation index of ESs and farming household livelihood security; α i denotes the weight of the i-th system, which is taken as 0.5 here, assuming that ESs and farming household livelihood security have equal importance; D represents the degree of coordination of coupling of ESs and farming household livelihood security. When the evaluation values of ESs and farming household livelihood security in a region are both high and close, their coupling coordination degree will be higher, which indicates that the ESs and farm house livelihood security in this area are both excellent. Based on the existing research results and the actual situation of the study area [50], the degree of coordination of coupling is divided into five levels (Table 4).

3. Results

3.1. Characteristics of the Evolution of PLES

3.1.1. The Spatio-Temporal Distribution of PLES

From a comprehensive perspective, the distribution of PLES in the Dongting Lake area changes little (Figure 3), with the ecological space being the most widely distributed, accounting for about 60%, followed by the production space, accounting for about 39%, and the living space being the least distributed, accounting for about 1%. From the trend in the temporal evolution, the distributed area of production space continues to decline, from 39.1% in 2000 to 38.3% in 2020, and the distributed area of ecological space shows an increasing trend, from 59.7% in 2000 to 60.4% in 2020, which is mainly due to the extensive promotion of ecological projects such as returning fields to lakes and returning farmland to forests [51]. The distribution area of living space has been relatively stable for two decades. From the spatial distribution characteristics, the production space is mainly distributed in the low terrain around the Dongting Lake at 20–100 m above sea level, the living space is scattered in the more dense production space, and the ecological space is mainly distributed in the waters of the Dongting Lake and the high-altitude areas in the south-east and west of the Dongting Lake area.

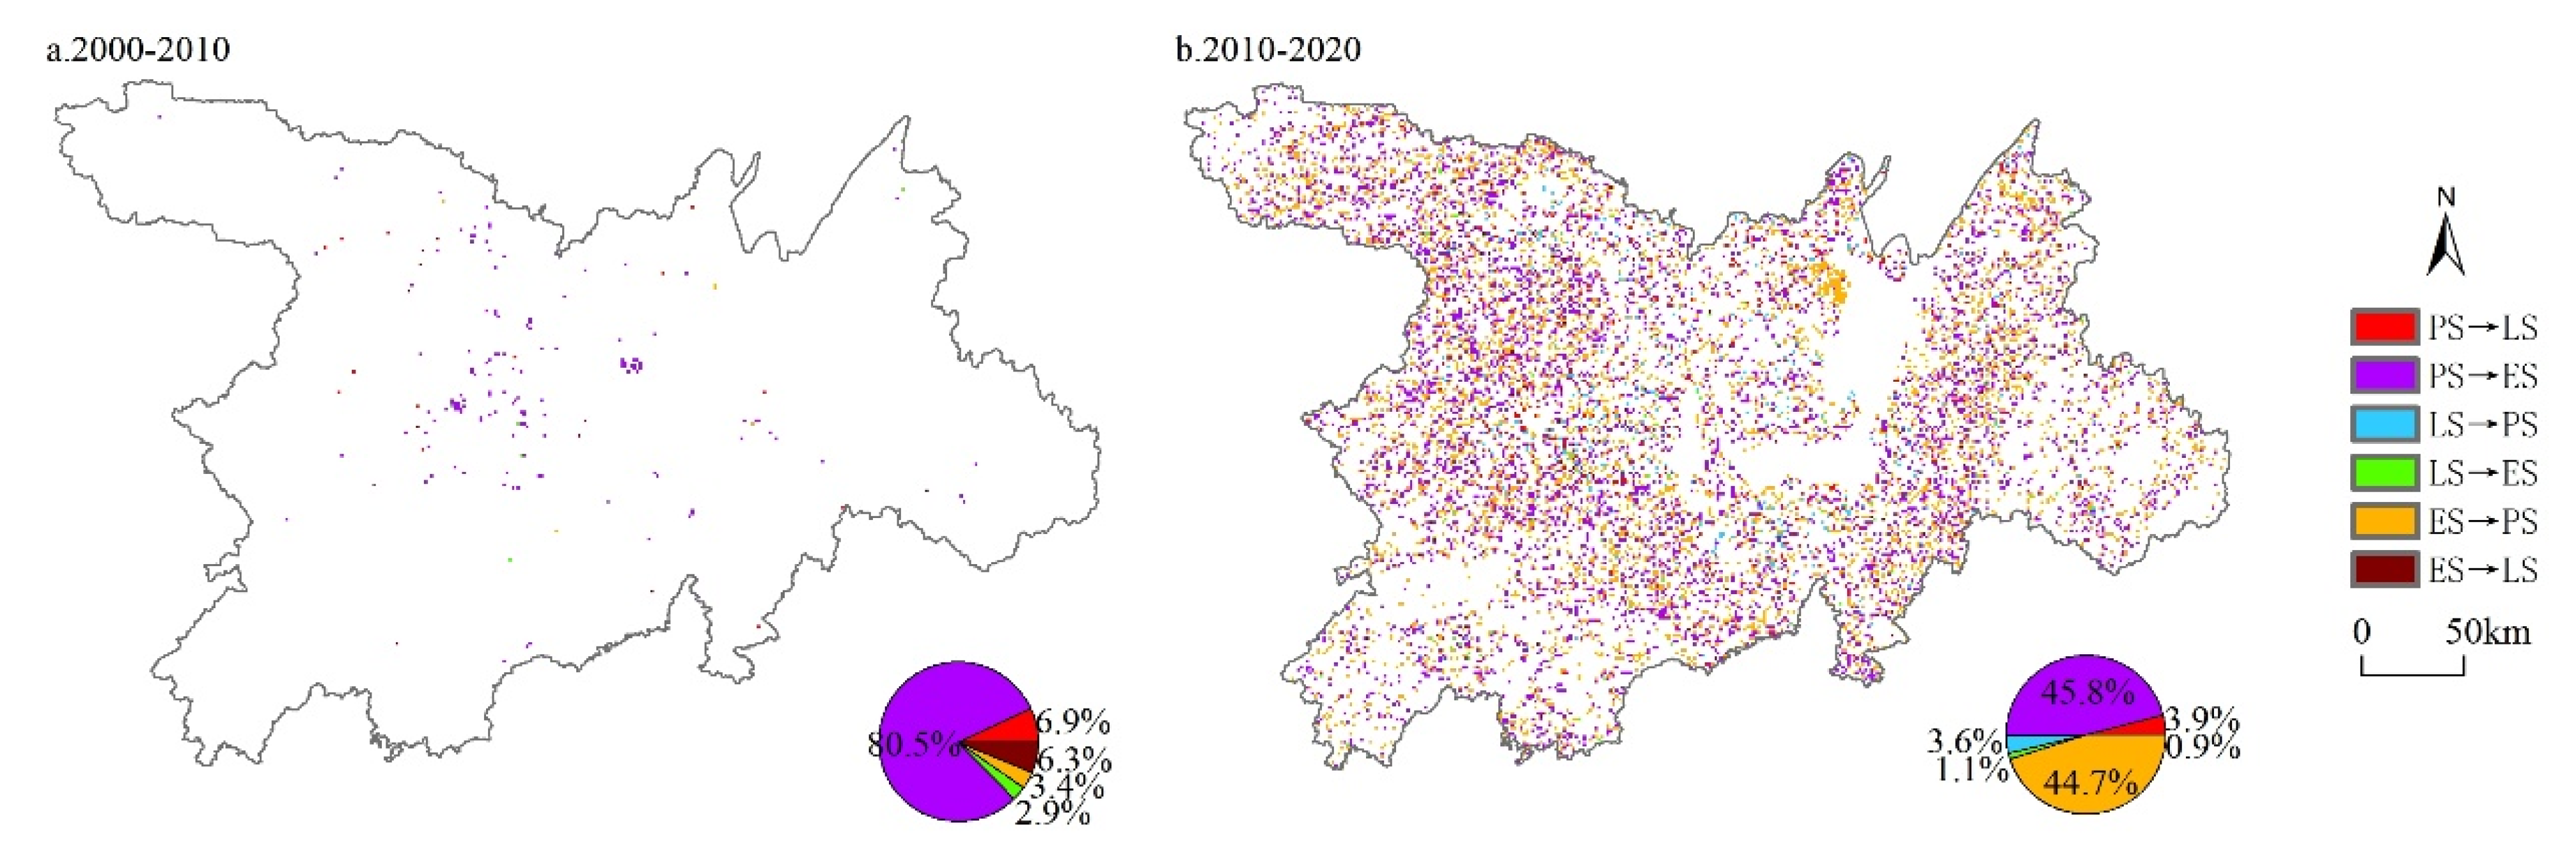
3.1.2. Transformational Characteristics of PLES

From 2000 to 2010, the land use of PLES in the Dongting Lake area changed little (Figure 4, Table 5), with a total land use transformation area of 17,400 ha, accounting for 0.38% of the total area of interest, mainly in Hanshou County, Dingcheng District and Wuling District of Changde City. Production space is the main space transferred out, with a total of 15,200 ha transferred out in ten years, accounting for 87.36% of the total area of land use transformation in the Dongting Lake area in that period; ecological space is the main space in which this transfer occurs, with a total of 14,000 ha transformed in ten years, accounting for 80.46% of the total area of land-use transformation in the Dongting Lake area in that period. The transformation area from production space to ecological space accounts for 80.5% of the total land-use transformation area, which is the most significant feature of land-use transformation in the Dongting Lake area during this period.
From 2010 to 2020, the transformation of land-use in PLES of the Dongting Lake area was more drastic, with a transformation area of 1.057 million ha, accounting for 22.81% of the total area of interest, an increase of nearly 60 times compared with that between 2000 and 2010, and this was widely distributed in areas other than the waters of the Dongting Lake, among which Li County, Linli County, Dingcheng District, Taojiang County, Miluo City, Junshan District, Jin City, and Anxiang County are more densely distributed. The mutual transformation of production space and ecological space is the most characteristic of land use transformation in this period, and the area of mutual transformation of the two amounts to 956,700 ha, accounting for 90.5% of the total area of land-use transformation in the Dongting Lake area in this period, with the most intensive distribution in Linli, Miluo, Dingcheng, and Jinshi counties; a similar phenomenon was found by Chao Liu et al. [52] in their study of land-use change in Zhangjiakou City. Production space is the most dominant space of transition out and in, with a total of 525,700 ha shifted out and 510,700 ha shifted in during the decade, accounting for 31.05% and 30.17% of the total area of production space, respectively; living space is the space with the most drastic land-use transition, with a total of 49,000 ha shifted out and 51,000 ha shifted in during the decade, accounting for 89.58% and 93.78% of the total area of the living space; the ecological space is the space with the most moderate land use transformation, with 482,000 ha transferred out and 495,000 ha transferred in during the decade, accounting for 18.52% and 19.01% of the total area of the ecological space, respectively.

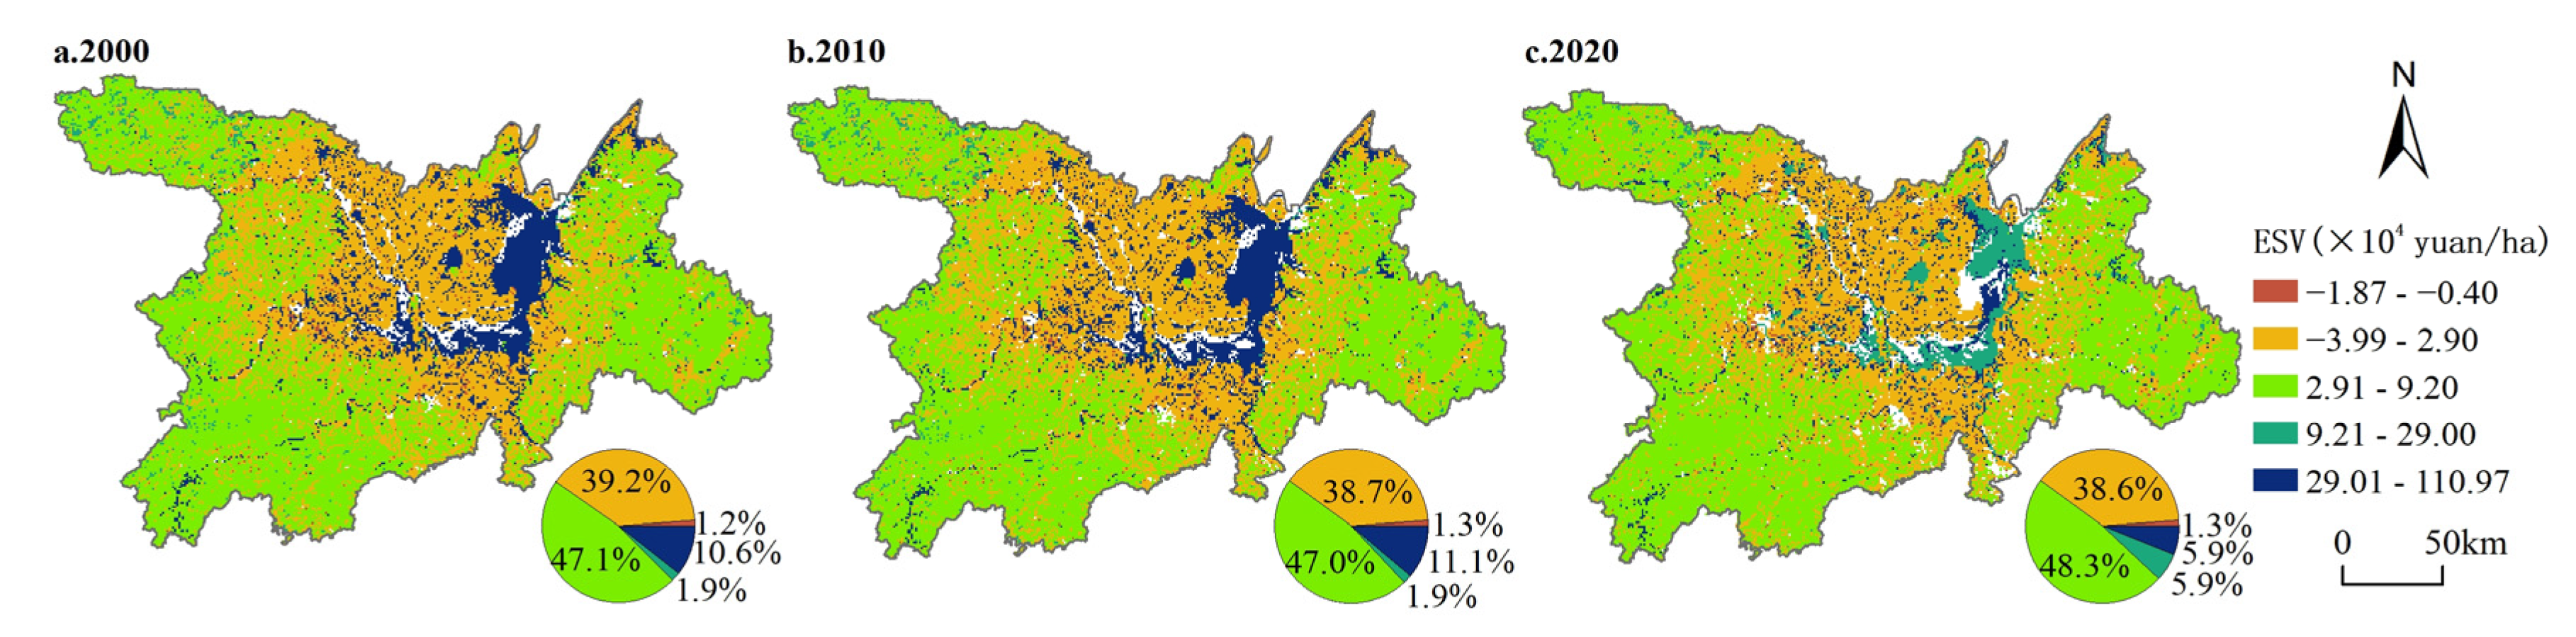
3.2. Spatio-Temporal Evolution of ESV

The ecosystem service value of the Dongting Lake area was calculated in 2000, 2010, and 2020 from the perspective of a 1 km2 scale. According to the ecosystem service value per unit area from low to high, it is divided into five levels of low value, sub-low value, medium value, sub-high value, and high value (Figure 5, Table 6). Overall, the ecosystem service value of the Dongting Lake area presents a high-low-high spatial distribution characteristic from the Dongting Lake water area to the surrounding areas. The ecosystem service value of most areas is between −3.99 to 9.20 × 10⁴ yuan/ha.
In 2000, the value of ESs in the Dongting Lake area was 345.35 billion yuan, with an average land value of 76.5 thousand yuan per ha, of which 10.6% were high-value areas, mainly in the water part of the Dongting Lake area; 1.9% were sub-high-value areas, mainly in the east–west border of the Dongting Lake area and the Yangtze River channel; 47.1% were medium-value areas, widely distributed in the south-east and west of the Dongting Lake area; 39.2% were secondary sub-low value areas, densely distributed in the production space of the low elevation area around the Dongting Lake waters; 1.2% were low-value areas, mainly in the production space of the low-elevation area. In 2010, ESV in the Dongting Lake area increased by 24.13% to 428.67 billion yuan compared with 2000, and the average land value increased by 24.62% to 95,400 yuan/ha, with an increase of 0.5% in the area of high-value area, distributed in the water part of the Dongting Lake area, and a decrease of 0.5% in the area of sub-low value area, mainly distributed in the PS around the Dongting Lake, mainly due to the implementation of ecological projects such as returning fields to the lake, resulting in the conversion of part of the production space to water ecological space. Compared with 2010, the ESV of the Dongting Lake area in 2020 decreased by 32.56% to 289.11 billion yuan, the area of medium value area increased by 1.3%, distributed in the southeast and west of the Dongting Lake area, mainly due to the growth of the FES caused by the ecological projects such as returning farmland to forest and wetland; the sub-high-value area increased by 4%, and the high-value area decreased by 5.2%, mainly distributed in the Dongting Lake waters, mainly due to the decrease in the ESV of some waters of the Dongting Lake and the transformation of some waters into marshlands.

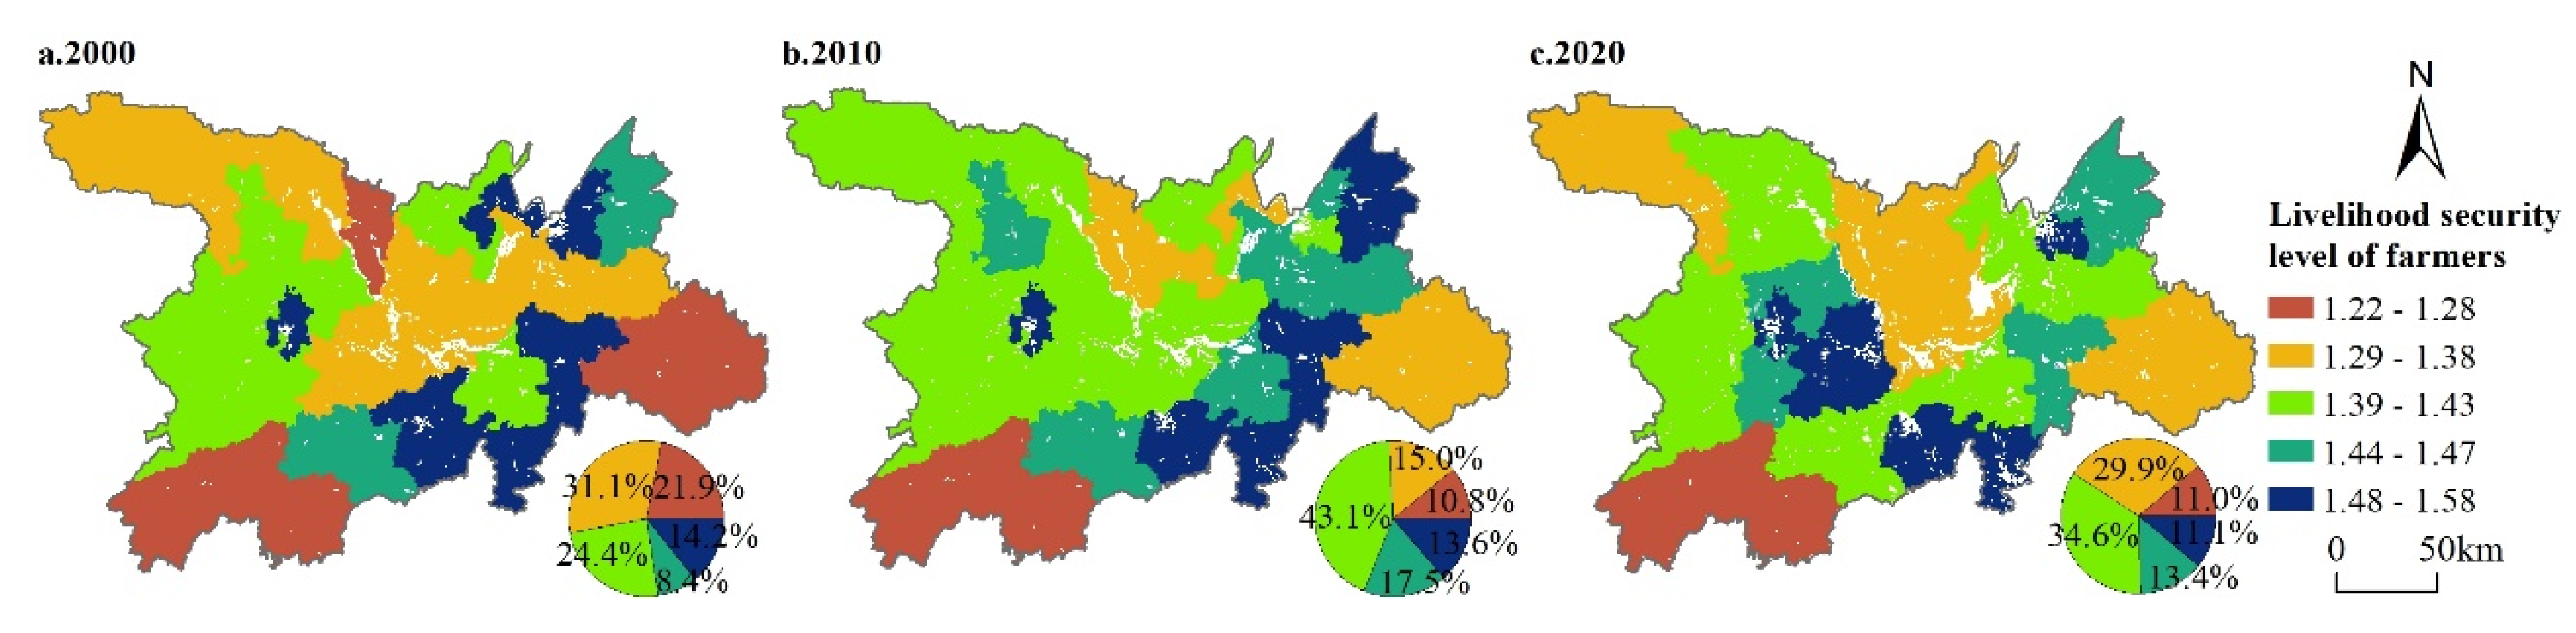
3.3. Spatio-Temporal Evolutionary Characteristics of Farming Household Livelihood Security

Based on the data set of farming household livelihood security evaluation indicators, the entropy value method was used to calculate the weight of each indicator and further find the livelihood security level of farmers in each county. The livelihood security level of farmers was classified into five levels: low, sub-low, medium, sub-high, and high values (Figure 6). In general, farming household livelihood security is closely related to the regional economic level, with the high value areas mainly in the municipal districts of Wuling, Heshan and Wangcheng, and the low value areas mainly in the less developed counties of Shimen, Pingjiang, Anhua, Nanxian, etc. The livelihood security level of farmers in the Dongting Lake area is rising, with an increase of 1.53% over two decades (Table 7).
In 2000, the mean value of the livelihood security level of farmers in the Dongting Lake area was 1.376. The high-value area accounted for 14.2% of the total area and was mainly distributed in Wuling District, Junshan District, Yunxi District, Yueyanglou District, Heshan District, Ziyang District, Wangcheng District, and Miluo City. The sub-high value area accounted for the least 8.4% of the total area and was mainly distributed in Taojiang County and Linxiang City. The median area accounted for 24.4% of the total area and was mainly distributed in Taoyuan County, Dingcheng District, Linli County, Huarong County, and Xiangyin County. The sub-low value area accounted for the most 31.1% of the total area and was mainly distributed in Shimen County, Li County, Jinshi City, Hanshou County, Yuanjiang City, Nan County, and Yueyang County. The low-value area accounted for 21.9% of the total area and was mainly distributed in Pingjiang County, Anhua County, and Anxiang County. Compared with 2000, the mean value of the livelihood security level of farmers in the Dongting Lake area increased by 1.342% to 1.394. The areas with high values, sub-low values and low values were decreased by 0.9%, 16.1%, and 11.1%, respectively. The areas with sub-high values and median values were increased by 9.1% and 18.7%, respectively. Junshan District fell from a high-value area to a sub-low value area; Yueyanglou District and Ziyang District fell from a high-value area to a median-value area; Yunxi District fell from a high-value area to a sub-high value area; Xiangyin County and other 10 counties improved their livelihood security by one level; Yueyang County rose from a sub-low value area to a sub-high value area; among them, the fastest decline in the livelihood security level of farmers in Yueyanglou District was −9.33%, and the fastest increase in Hanshou County was 9.36%. Compared with 2010, the average level of farming household livelihood security in the Dongting Lake area was increased by 0.186% to 1.397 compared with 2010, showing a good trend of steady improvement in the livelihood security level of farmers in the Dongting Lake area. The areas with low values and sub-low values were increased by 0.2% and 14.9%, respectively; the areas with median values, sub-high values and high values decreased by −8.5%, −4.1% and −2.5%, respectively; Hanshou County and Yueyanglou District rose from median-value areas to high-value areas; Junshan District increased from a sub-low value area to a median value area; Dingcheng District rose from a median value area to a sub-high value area; Miluo City and other nine counties fell by one level in terms of livelihood security level of farmers; Miluo City had the fastest decline in livelihood security for farming households at −5.25%; Yueyang Tower District showed the fastest increase at 8.06%.

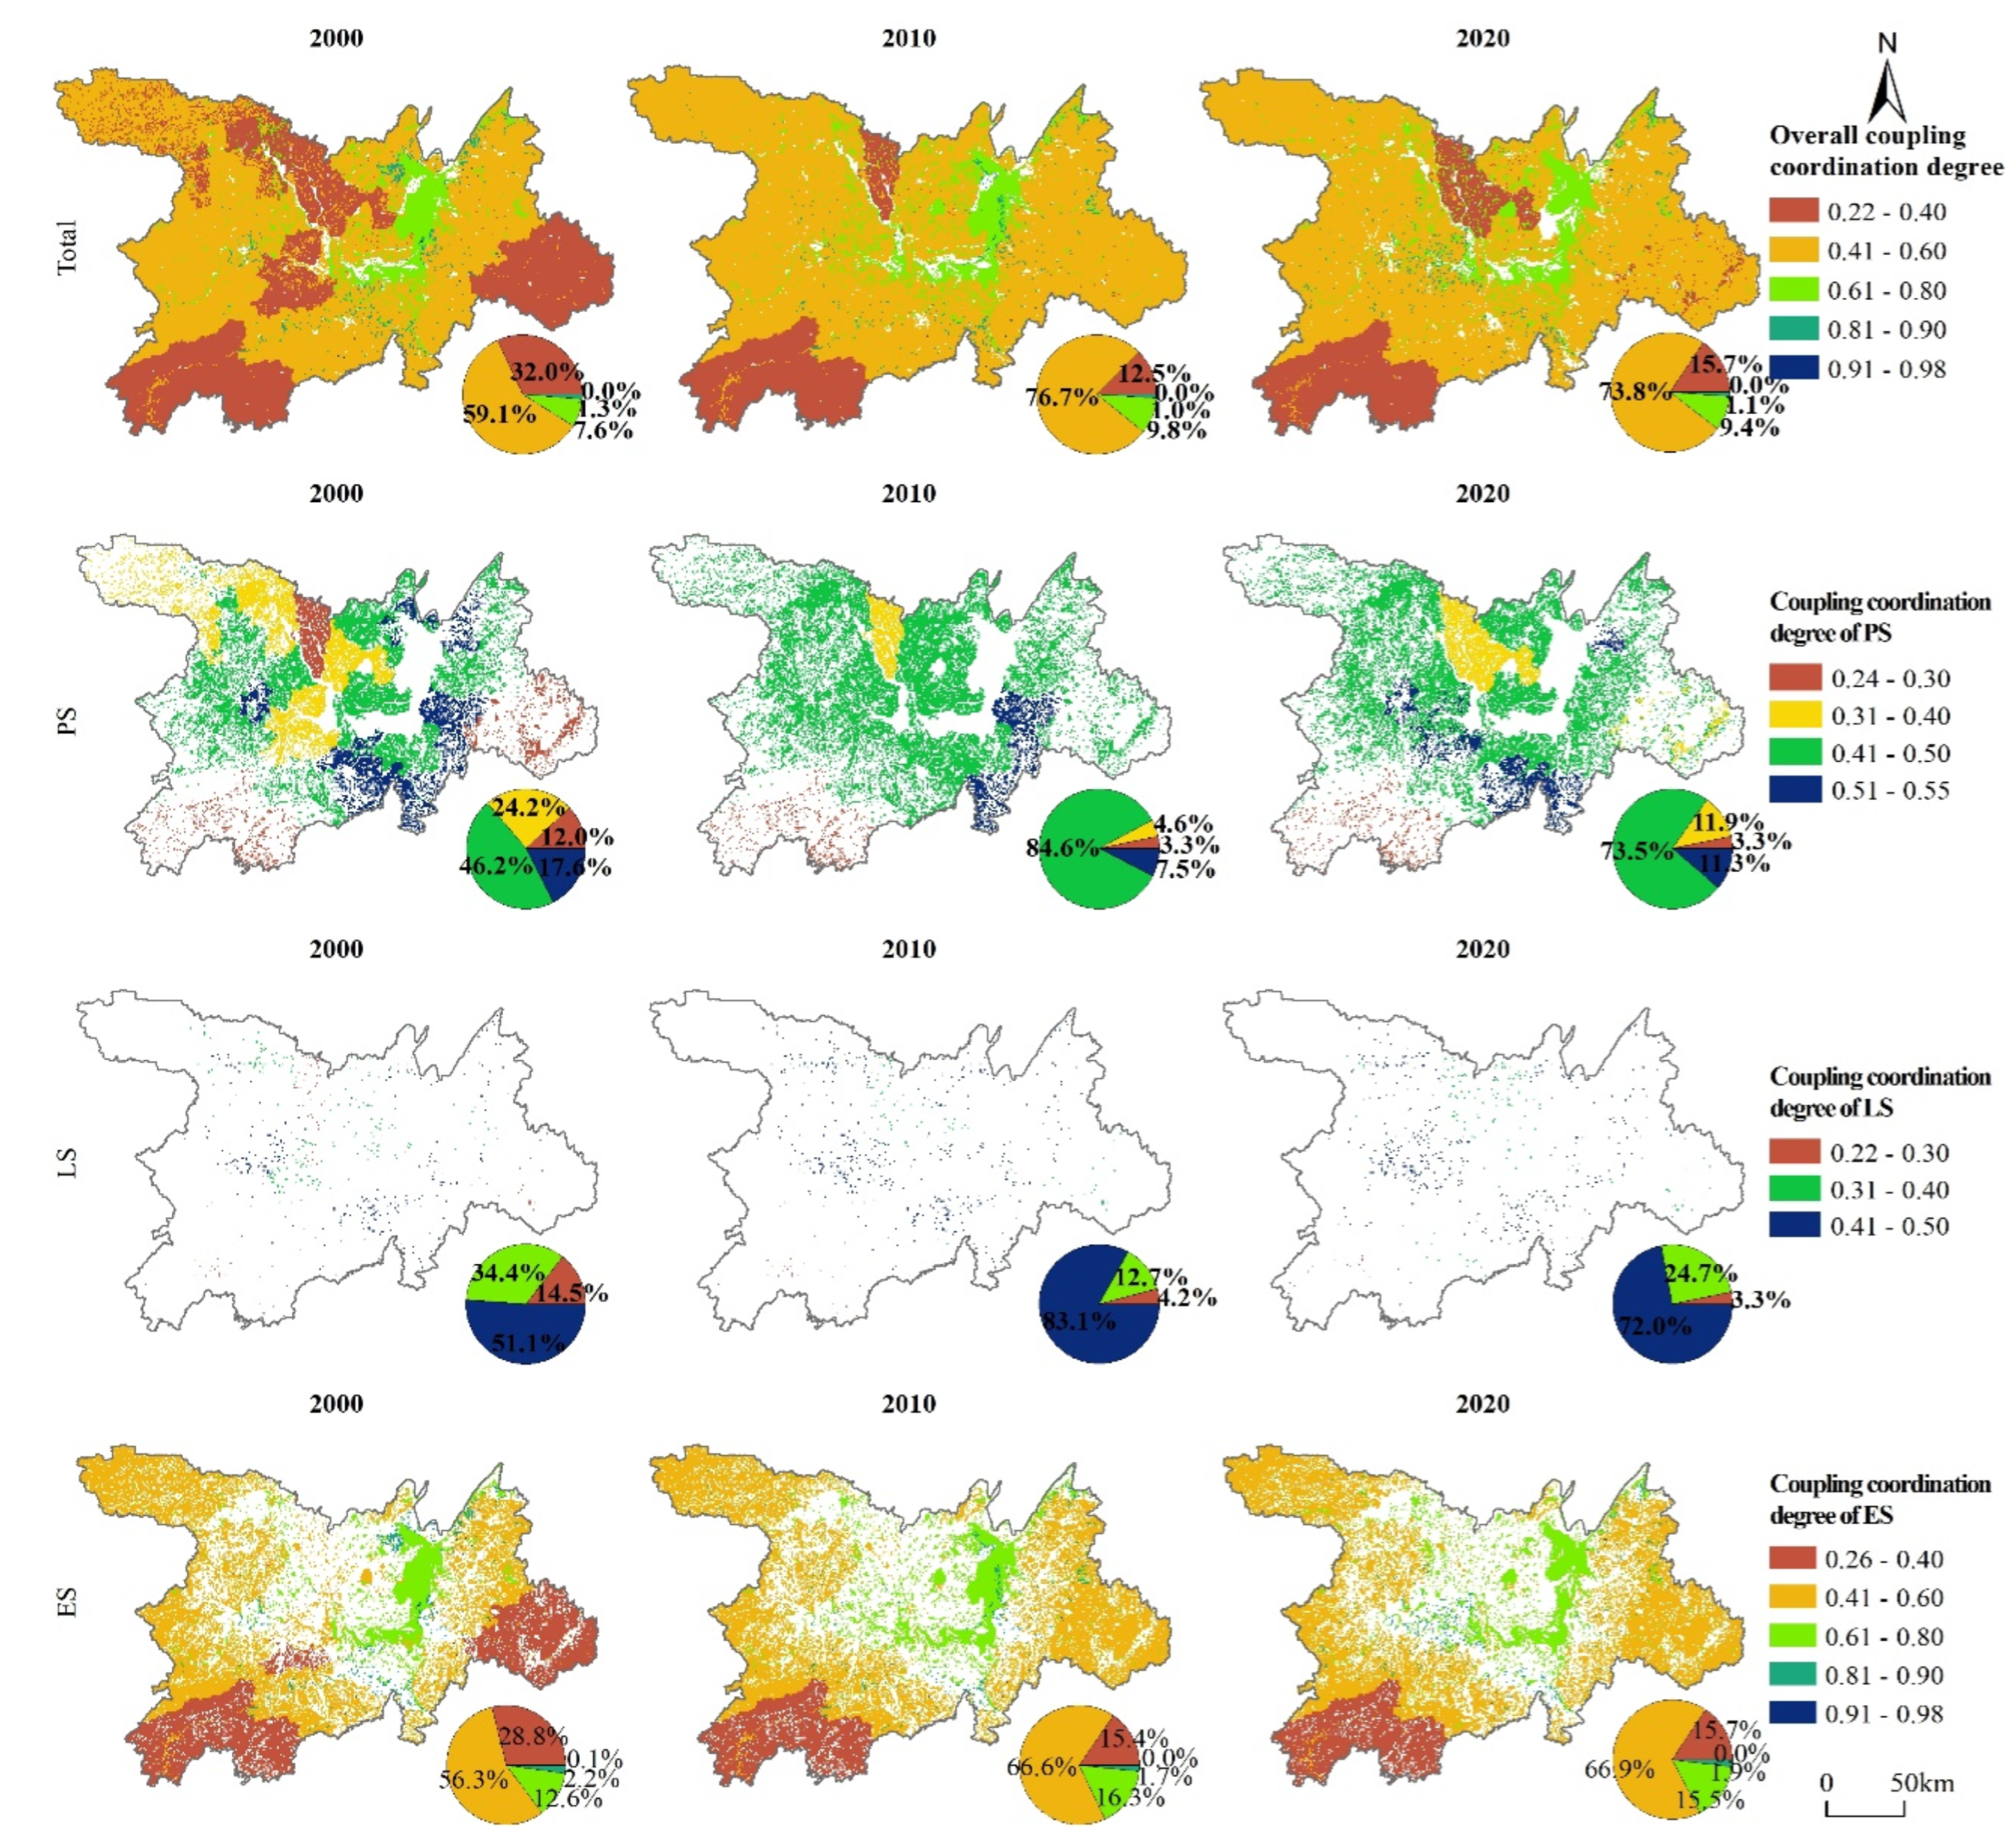
3.4. Spatio-Temporal Variations in the Coupled Coordination of ESV and Farming Household Livelihood Security

Overall, the degree of coordination of coupling between ESV and the livelihood security level of farmers in most areas of the Dongting Lake area is barely balanced with local development (Figure 7). The areas with a higher degree of coordination of coupling are mainly distributed in Wuling District, Junshan District, Yunxi District, Ziyang District, Junshan District, Wangcheng District, and Miluo City, which are highly consistent with the areas with higher livelihood security level of farmers. The areas with lower degree of coordination of coupling are mainly distributed in Anhua County and Anxiang County. In 2000, the average degree of coordination of coupling in the Dongting Lake area was 0.45 (Table 8), which was at a low level. Among them, the average degree of coordination of coupling of ecological space was the highest at 0.47, followed by production space with an average degree of coordination of coupling of 0.42, and the average degree of coordination of coupling of living space was the lowest at 0.38. The area with an average degree of coordination of coupling of barely balanced development accounted for the most at 59.1%, followed by seriously unbalanced development areas accounting for 32.0%, and areas with a degree of coordination of coupling of favorably balanced development or above accounted for only 9.9%. The areas with lower degree of coordination of couplings were mainly distributed in counties such as Anhua, Pingjiang, Hanshou, Nan County, Anxiang, and Li County; the areas with higher degree of coordination of couplings were mainly distributed in the Dongting Lake water area and surrounding areas. Compared with 2000, in 2010, the average degree of coordination of coupling between ESV and livelihood security level of farmers in the Dongting Lake area increased by 8.15% to 0.49. Among them, the rate of growth of the degree of coordination of coupling of ecological space was the fastest at 8.75%, followed by living space with a growth rate of 8.19%, and living space had the slowest growth rate at 7.00%. The proportion of seriously unbalanced development areas decreased by 19.5% to 12.5%, and the proportion of areas barely balanced development increased significantly to 76.7%. The proportion of areas with a degree of coordination of coupling of favorably balanced development or above increased slightly to 10.8%, showing a good trend of rapid increase in the degree of coordination of coupling in the Dongting Lake area. Among them, Pingjiang, Hanshou, Nan County, Li County, and Jinshi had faster increases in the degree of coordination of couplings. Compared with 2010, in 2020, the average degree of coordination of coupling in the Dongting Lake area decreased slightly by 1.70% to 0.48; most areas in Nan County and some areas in Pingjiang County decreased from being barely balanced development to seriously unbalanced development.
From the perspective of production space, its degree of coordination of coupling is barely balanced developmentally or worse, at a low level, mainly due to the relatively low ESV in production space. In 2000, the average degree of coordination of coupling between ESV and livelihood security level of farmers in the production space of the Dongting Lake area was 0.42. The areas with a lower degree of coordination of coupling were mainly Anxiang, Anhua, and Pingjiang counties; the areas with a higher degree of coordination of coupling were mainly Wuling, Ziyang, Heshan, Wangcheng, Miluo, Yueyanglou, Yunxi, and Junshan counties. Compared with 2000, in 2010, the average degree of coordination of coupling between ESV and livelihood security level of farmers in the production space of the Dongting Lake area increased by 7.00% to 0.45. Most areas in Shimen, Hanshou, Li County, Nan County, Jinshi, and Pingjiang counties had significant improvements in the degree of coordination of coupling; most areas in Wuling, Ziyang, Heshan, Junshan, and Yunxi counties had significant declines in the degree of coordination of coupling. Compared with 2010, in 2020, the average degree of coordination of coupling between ESV and livelihood security level of farmers in the production space of the Dongting Lake area decreased slightly by 1.00% to 0.44. The degree of coordination of coupling of Nan County, Miluo and Pingjiang counties decreased significantly; Wuling, Hanshou, Heshan, and Yueyanglou counties had different degrees of increase in the degree of coordination of coupling.
From the perspective of living space, its overall degree of coordination of coupling is also low. In 2000, the average degree of coordination of coupling between ESV and livelihood security level of farmers in the living space of the Dongting Lake area was 0.38. The areas with lower degrees of coordination of couplings were mainly Anxiang, Anhua and Pingjiang counties; the areas with higher degrees of coordination of couplings were mainly Dingcheng, Junshan, Linxiang, Ziyang, Heshan, Xiangyin, Miluo, and Wangcheng counties. From 2000 to 2020, the degree of coordination of coupling between ESV and farming household livelihood security in the living space of the Dongting Lake area showed an upward trend. From 2000 to 2010, it increased significantly by 8.19% to 0.42; from 2010 to 2020, it increased slightly by 1.38%. Pingjiang, Hanshou, Yueyang, Li County, Anxiang, and Li County showed faster increases in the degree of coordination of couplings.
From the perspective of ecological space, there is a large internal difference in its degree of coordination of coupling. The areas with a coupling coordination level of barely balanced development or above are mainly distributed in the Dongting Lake water area and thereabouts. The areas with a coupling coordination level of slightly unbalanced development (or below) are widely distributed in the south-east and west of the Dongting Lake area. Among them, most areas in Anhua County have a coupling coordination level indicative of seriously unbalanced development. In 2000, the average degree of coordination of coupling between ESV and livelihood security level of farmers in the ecological space of the Dongting Lake area was 0.47. The areas with coupling coordination level of seriously unbalanced development were mainly Anhua County, Pingjiang County, and the southern part of Hanshou County; the areas with favorably balanced development or above were mainly distributed in Junshan District, Wuling District and some areas in Yunxi District, Miluo City, Wangcheng District, and Heshan District. In 2010, the average degree of coordination of coupling between ESV and livelihood security level of farmers in the ecological space of the Dongting Lake area was 0.51, an increase of 8.75% compared to 2000. Pingjiang, Yueyang, Hanshou, and Xiangyin counties had faster increases in the degree of coordination of couplings. In 2020, the average degree of coordination of coupling between ESV and livelihood security level of farmers in the ecological space of the Dongting Lake area was 0.50, a decrease of 2.21% compared to 2010. The main reason was that the degree of coordination of coupling of some water areas in the Dongting Lake decreased.

4. Discussion

The Dongting Lake area is an important ecological barrier in the middle and lower reaches of the Yangtze River and an important area for agricultural production in China. The coordinated development of ecological environment and farmers’ livelihood in the Dongting Lake area is of great significance for ensuring China’s food security and improving the level of sustainable development of the Dongting Lake area. Since 2000, the Dongting Lake area has achieved great success in economic development, with per capita GDP rising from 5084.17 yuan in 2000 to 69,276.24 yuan in 2020. However, our research found that most areas in the Dongting Lake area are in a state of uncoordinated and low-level development between ESs and farming household livelihood security. From 2000 to 2020, more than 80% of the areas in the Dongting Lake area had a degree of coordination of coupling between ESV and farming household livelihood security below 0.6, which was at a low level. However, in time, this bad situation is being improved, indicating that the ecological environment and farming household livelihood in the Dongting Lake area are moving towards a balanced, high-quality state.
The value of ESV in the Dongting Lake area is closely related to farming household livelihood security. farming household livelihood security is affected by the ESV. Therefore, it is necessary to pay attention to ecological environment protection and ecological restoration to maintain the stability and sustainability of ESs. The Dongting Lake area should strengthen land use planning and management, protect, and restore ecosystem service functions, improve farmers’ livelihood adaptability and resistance ability, and achieve coordinated development between ESs and farming household livelihood security. At the same time, there are differences in the coupling coordination relationship between ESV and farming household livelihood security in different regions. Attention should be paid to areas where ESs are vulnerable and ecological environment is deteriorating. Targeted measures should be taken to strengthen environmental protection and ecological restoration.
Our study has some innovations and contributions compared with existing research on ES evaluation [53,54,55], PLES evaluation [56,57,58], or their coordination development evaluation [59,60,61]. First, we adopted a comprehensive evaluation method that combines qualitative analysis with quantitative analysis, comprehensive evaluation with coupling coordination degree model, to measure both ESV and farming household livelihood security, as well as their spatio-temporal evolution and coordination development. Second, existing research into the evaluation of farmers’ livelihoods mostly starts from the perspective of livelihood assets [62,63]. Based on the pressure–state–response model, a system allowing the evaluation of farming household livelihood security from the aspects of vulnerability background, livelihood assets, livelihood strategies, and livelihood outcomes was established to evaluate the current situation and sustainability of farmers’ livelihoods. Third, we applied our evaluation method to a typical case study area, the Dongting Lake area, which is an important ecological region and agricultural region in China. The Dongting Lake area has rich natural resources and biodiversity, as well as diverse and complex livelihood systems. The Dongting Lake area also faces multiple challenges and pressures from land use change, water resource shortage, environmental pollution, market competition, etc. Therefore, the Dongting Lake area is a representative and meaningful case to explore the spatio-temporal evolution and coordination development of ESs and farming household livelihood security, as well as to provide policy implications for the sustainable development of the region. In addition, our research provides a new perspective for evaluating the level of coordination of development of the ecological environment and residents’ livelihoods. The research results can provide scientific basis for formulating reasonable and effective resource management and livelihood improvement policies in the Dongting Lake area. At the same time, the limitations of our study are mainly reflected in the fact that only the coordinated development between ESV and farming household livelihood security has been considered, and not between PLES.

5. Conclusions and Policy Implications

The proportion of ecological space in the Dongting Lake area is the highest and shows an upward trend, followed by production space with a decreasing proportion, and the proportion of living space is the lowest. Land use transformation was more intense from 2010 to 2020, with a total transformation area of 1.057 million ha, accounting for 22.81% of the total area of the Dongting Lake area, mainly manifested as the transformation of ecological space into production space and living space. Overall, the spatial distribution of ESV in the area shows a high-low-high pattern from the Dongting Lake water area to its surroundings. Ecological space contributes about 95% of ESV, while the ESV of living space is negative. The livelihood security level of farmers is related to regional economic level. High-value areas are mainly urban areas such as Wuling, Heshan, and Wangcheng; low-value areas are mainly underdeveloped counties such as Shimen, Pingjiang, Anhua, and Nan County. Over time, the livelihood security level of farmers in the Dongting Lake area is increasing.
Overall, the degree of coordination of coupling between ESV and farming household livelihood security in most areas of the Dongting Lake area is low, but it is on an upward trend. More than 80% of the areas have a coupling coordination level of barely balanced development or below. In the past 20 years, the average degree of coordination of coupling between ESV and farming household livelihood security in the Dongting Lake area has increased by 6.32%. The areas with higher degrees of coordination of couplings are mainly distributed in Wuling District, Junshan District, Yunxi District, Ziyang District, Junshan District, Wangcheng District, and Miluo City; the areas with lower degrees of coordination of couplings are mainly distributed in Anhua County and Anxiang County.
Our study results indicated new knowledge of policy significance for the Dongting Lake area and other ecologically sensitive lake basins, especially in developing countries or regions that are the focus of national policy attention, and experience industrialization and urbanization. The results could also provide scientific guidance to promote the coordinated development of ESs and farming household livelihood security in these basins and achieve sustainable development.
To improve the supply capacity and stability of ecosystem services, reduce the negative impacts of ecosystem degradation and loss on farming household livelihoods, encourage farmers to participate in ecological conservation and restoration, and increase farmers’ income sources and welfare levels through ecological compensation; we also propose the strengthening of the assessment and monitoring of ecosystem services and establish an ecological compensation mechanism to incentivize farmers to protect and restore ecosystems; improve farmers’ understanding of the services and enhance their sense of environmental responsibility and participation; support farmers to develop diversified livelihood strategies, improve their income levels and adaptive capacity, and reduce their livelihood vulnerability; strengthen cross-sectoral and cross-regional coordination and cooperation, develop scientific and reasonable land use planning and ecological conservation policies, and balance the development needs of production, living and ecological spaces.

Author Contributions

Conceptualization, W.C. and R.W.; methodology, R.W.; software, W.C.; validation, J.W.; formal analysis, R.W.; data curation, W.C.; writing—original draft preparation, R.W.; writing—review and editing, R.W.; visualization, R.W.; supervision, W.C.; funding acquisition, J.W. and R.W. All authors have read and agreed to the published version of the manuscript.

Funding

This research was funded by General projects of the National Social Science Foundation (grant number 22BGL169), General Project of Humanities and Social Sciences Research of the Ministry of Education (grant number 19YJC630166), Hunan philosophy and Social Science Foundation Project (grant number 20YBA261), Hunan Provincial Natural Science Foundation General Project (grant number 2023JJ31016) and Key Scientific Research Project of Hunan Provincial Department of Education (grant number 22A0174).

Institutional Review Board Statement

Not applicable.

Informed Consent Statement

Not applicable.

Data Availability Statement

Data will be made available on request.

Conflicts of Interest

The authors declare no conflict of interest. The funders had no role in the design of the study; in the collection, analyses, or interpretation of data; in the writing of the manuscript; or in the decision to publish the results.

References

  1. Li, C.; Wu, J. Land use transformation and eco-environmental effects based on production-living-ecological spatial synergy: Evidence from Shaanxi Province, China. Environ. Sci. Pollut. Res. 2022, 29, 41492–41504. [Google Scholar] [CrossRef] [PubMed]
  2. Zhang, Z.; Li, J. Spatial suitability and multi-scenarios for land use: Simulation and policy insights from the production-living-ecological perspective. Land Use Policy 2022, 119, 106219. [Google Scholar] [CrossRef]
  3. Deng, Y.; Yang, R. Influence mechanism of production-living-ecological space changes in the urbanization process of Guangdong province, China. Land 2021, 10, 1357. [Google Scholar] [CrossRef]
  4. Yang, X.; Wang, J.; Qiao, N.; Bai, Z. Spatiotemporal variation pattern of production-living-ecological space and land use ecological risk and their relationship analysis: A case study of Changzhi City, China. Environ. Sci. Pollut. Res. 2023, 30, 66978–66993. [Google Scholar] [CrossRef]
  5. Wang, M.; Qin, K.; Jia, Y.; Yuan, X.; Yang, S. Land use transition and eco-environmental effects in Karst Mountain area based on production-living-ecological space: A case study of Longlin Multinational Autonomous County, Southwest China. Int. J. Environ. Res. Public Health 2022, 19, 7587. [Google Scholar] [CrossRef]
  6. Liao, T.; Li, D.; Wan, Q. Tradeoff of Exploitation-protection and Suitability Evaluation of Low-slope hilly from the perspective of “production-living-ecological” optimization. Phys. Chem. Earth. 2020, 120, 102943. [Google Scholar] [CrossRef]
  7. Li, H.; Fang, C.; Xia, Y.; Liu, Z.; Wang, W. Multi-Scenario Simulation of Production-Living-Ecological Space in the Poyang Lake Area Based on Remote Sensing and RF-Markov-FLUS Model. Remote Sens. 2022, 14, 2830. [Google Scholar] [CrossRef]
  8. Wu, J.; Zhang, D.; Wang, H.; Li, X. What is the future for production-living-ecological spaces in the Greater Bay Area? A multi-scenario perspective based on DEE. Ecol. Indic. 2021, 131, 108171. [Google Scholar]
  9. Wang, A.; Liao, X.; Tong, Z.; Du, W.; Zhang, J.; Liu, X.; Liu, M. Spatial-temporal dynamic evaluation of the ecosystem service value from the perspective of “production-living-ecological” spaces: A case study in Dongliao River Basin, China. J. Clean. Prod. 2022, 333, 130218. [Google Scholar] [CrossRef]
  10. Jiang, X.; Zhai, S.; Liu, H.; Chen, J.; Zhu, Y.; Wang, Z. Multi-scenario simulation of production-living-ecological space and ecological effects based on shared socioeconomic pathways in Zhengzhou, China. Ecol. Indic. 2022, 137, 108750. [Google Scholar] [CrossRef]
  11. Costanza, R.; d’Arge, R.; De Groot, R.; Farber, S.; Grasso, M.; Hannon, B.; Limburg, K.; Naeem, S.; O’neill, R.V.; Paruelo, J. The value of the world’s ecosystem services and natural capital. Nature 1997, 387, 253–260. [Google Scholar] [CrossRef]
  12. Postel, S.; Bawa, K.; Kaufman, L.; Peterson, C.H.; Carpenter, S.; Tillman, D.; Dayton, P.; Alexander, S.; Lagerquist, K.; Goulder, L. Nature’s Services: Societal Dependence on Natural Ecosystems; Island Press: Washington, DC, USA, 2012. [Google Scholar]
  13. Bennett, E.M.; Cramer, W.; Begossi, A.; Cundill, G.; Díaz, S.; Egoh, B.N.; Geijzendorffer, I.R.; Krug, C.B.; Lavorel, S.; Lazos, E. Linking biodiversity, ecosystem services, and human well-being: Three challenges for designing research for sustainability. Curr. Opin. Environ. Sustain. 2015, 14, 76–85. [Google Scholar] [CrossRef]
  14. Wang, B.; Zhang, Q.; Cui, F. Scientific research on ecosystem services and human well-being: A bibliometric analysis. Ecol. Indic. 2021, 125, 107449. [Google Scholar] [CrossRef]
  15. King, E.G.; Nelson, D.R.; McGreevy, J.R. Advancing the integration of ecosystem services and livelihood adaptation. Environ. Res. Lett. 2019, 14, 124057. [Google Scholar] [CrossRef]
  16. Ado, A.M.; Savadogo, P.; Abdoul-Azize, H.T. Livelihood strategies and household resilience to food insecurity: Insight from a farming community in Aguie district of Niger. In Rethinking Food System Transformation; Springer: Berlin/Heidelberg, Germany, 2022; pp. 97–111. [Google Scholar]
  17. Wang, X.; Peng, L.; Xu, D.; Wang, X. Sensitivity of rural households’ livelihood strategies to livelihood capital in poor mountainous areas: An empirical analysis in the upper reaches of the min river, China. Sustainability 2019, 11, 2193. [Google Scholar] [CrossRef] [Green Version]
  18. Chambers, R.; Conway, G. Sustainable Rural Livelihoods: Practical Concepts for the 21st Century; IDS Discussion Paper No. 296; Institute of Development Studies: Brighton, UK, 1992. [Google Scholar]
  19. Scoones, I. Sustainable Rural Livelihoods: A Framework for Analysis; Institute of Development Studies: Brighton, UK, 1998; pp. 1–16. [Google Scholar]
  20. Keovilignavong, O.; Suhardiman, D. Linking land tenure security with food security: Unpacking farm households’ perceptions and strategies in the rural uplands of Laos. Land Use Policy 2020, 90, 104260. [Google Scholar] [CrossRef]
  21. Iqbal, M.A.; Rizwan, M.; Abbas, A.; Makhdum, M.S.A.; Kousar, R.; Nazam, M.; Samie, A.; Nadeem, N. A quest for livelihood sustainability? Patterns, motives and determinants of non-farm income diversification among agricultural households in Punjab, Pakistan. Sustainability 2021, 13, 9084. [Google Scholar] [CrossRef]
  22. Luo, X.; Zhang, C.; Song, J.; Qiu, Z.; Li, W.; Wang, W. Do Livelihood Strategies Affect the Livelihood Resilience of Farm Households in Flooded Areas? Evidence From Hubei Province, China. Front. Ecol. Evol. 2022, 10, 909172. [Google Scholar] [CrossRef]
  23. Liu, W.; Li, J.; Ren, L.; Xu, J.; Li, C.; Li, S. Exploring livelihood resilience and its impact on livelihood strategy in rural China. Soc. Indic. Res. 2020, 150, 977–998. [Google Scholar] [CrossRef]
  24. Yobe, C.L.; Mudhara, M.; Mafongoya, P. Livelihood strategies and their determinants among smallholder farming households in KwaZulu-Natal province, South Africa. Agrekon 2019, 58, 340–353. [Google Scholar] [CrossRef]
  25. Abera, A.; Yirgu, T.; Uncha, A. Determinants of rural livelihood diversification strategies among Chewaka resettlers’ communities of southwestern Ethiopia. Agric. Food Secur. 2021, 10, 30. [Google Scholar] [CrossRef]
  26. Pritchard, R.; Grundy, I.M.; van der Horst, D.; Ryan, C.M. Environmental incomes sustained as provisioning ecosystem service availability declines along a woodland resource gradient in Zimbabwe. World Dev. 2019, 122, 325–338. [Google Scholar] [CrossRef]
  27. Cuni-Sanchez, A.; Ngute, A.S.K.; Sonké, B.; Sainge, M.N.; Burgess, N.D.; Klein, J.A.; Marchant, R. The importance of livelihood strategy and ethnicity in forest ecosystem services’ perceptions by local communities in north-western Cameroon. Ecosyst. Serv. 2019, 40, 101000. [Google Scholar] [CrossRef]
  28. Su, F.; Song, N.; Ma, N.; Sultanaliev, A.; Ma, J.; Xue, B.; Fahad, S. An assessment of poverty alleviation measures and sustainable livelihood capability of farm households in rural China: A sustainable livelihood approach. Agriculture 2021, 11, 1230. [Google Scholar] [CrossRef]
  29. Le, W.; Leshan, J. How eco-compensation contribute to poverty reduction: A perspective from different income group of rural households in Guizhou, China. J. Clean. Prod. 2020, 275, 122962. [Google Scholar] [CrossRef]
  30. Manlosa, A.O.; Hanspach, J.; Schultner, J.; Dorresteijn, I.; Fischer, J. Livelihood strategies, capital assets, and food security in rural Southwest Ethiopia. Food Secur. 2019, 11, 167–181. [Google Scholar] [CrossRef]
  31. Kuang, F.; Jin, J.; He, R.; Ning, J.; Wan, X. Farmers’ livelihood risks, livelihood assets and adaptation strategies in Rugao City, China. J. Environ. Manag. 2020, 264, 110463. [Google Scholar] [CrossRef]
  32. Fahad, S.; Nguyen-Thi-Lan, H.; Nguyen-Manh, D.; Tran-Duc, H.; To-The, N. Analyzing the status of multidimensional poverty of rural households by using sustainable livelihood framework: Policy implications for economic growth. Environ. Sci. Pollut. Res. 2023, 30, 16106–16119. [Google Scholar] [CrossRef]
  33. Von Seggern, J. Understandings, practices and human-environment relationships—A meta-ethnographic analysis of local and indigenous climate change adaptation and mitigation strategies in selected pacific island states. Sustainability 2020, 13, 11. [Google Scholar] [CrossRef]
  34. Harvey, C.A.; Pritts, A.A.; Zwetsloot, M.J.; Jansen, K.; Pulleman, M.M.; Armbrecht, I.; Avelino, J.; Barrera, J.F.; Bunn, C.; García, J.H. Transformation of coffee-growing landscapes across Latin America. A review. Agron. Sustain. Dev. 2021, 41, 62. [Google Scholar] [CrossRef]
  35. Wang, Y.; Zhang, Q.; Li, Q.; Wang, J.; Sannigrahi, S.; Bilsborrow, R.; Bellingrath-Kimura, S.D.; Li, J.; Song, C. Role of social networks in building household livelihood resilience under payments for ecosystem services programs in a poor rural community in China. J. Rural Stud. 2021, 86, 208–225. [Google Scholar] [CrossRef]
  36. Xing, L.; Xue, M.; Hu, M. Dynamic simulation and assessment of the coupling coordination degree of the economy–resource–environment system: Case of Wuhan City in China. J. Environ. Manag. 2019, 230, 474–487. [Google Scholar] [CrossRef]
  37. Sannigrahi, S.; Chakraborti, S.; Joshi, P.K.; Keesstra, S.; Sen, S.; Paul, S.K.; Kreuter, U.; Sutton, P.C.; Jha, S.; Dang, K.B. Ecosystem service value assessment of a natural reserve region for strengthening protection and conservation. J. Environ. Manag. 2019, 244, 208–227. [Google Scholar] [CrossRef]
  38. Jiang, M.; Jiang, C.; Huang, W.; Chen, W.; Gong, Q.; Yang, J.; Zhao, Y.; Zhuang, C.; Wang, J.; Yang, Z. Quantifying the supply-demand balance of ecosystem services and identifying its spatial determinants: A case study of ecosystem restoration hotspot in Southwest China. Ecol. Eng. 2022, 174, 106472. [Google Scholar] [CrossRef]
  39. Thao, N.T.T.; Khoi, D.N.; Xuan, T.T.; Tychon, B. Assessment of livelihood vulnerability to drought: A case study in Dak Nong Province, Vietnam. Int. J. Disaster Risk Sci. 2019, 10, 604–615. [Google Scholar] [CrossRef] [Green Version]
  40. Tan, J.; Yu, D.; Li, Q.; Tan, X.; Zhou, W. Spatial relationship between land-use/land-cover change and land surface temperature in the Dongting Lake area, China. Sci. Rep. 2020, 10, 9245. [Google Scholar] [CrossRef]
  41. Xiong, J.; Wang, X.; Zhao, D.; Zhao, Y. Spatiotemporal pattern and driving forces of ecological carrying capacity during urbanization process in the Dongting Lake area, China. Ecol. Indic. 2022, 144, 109486. [Google Scholar] [CrossRef]
  42. Yang, Y.; Bao, W.; Li, Y.; Wang, Y.; Chen, Z. Land use transition and its eco-environmental effects in the Beijing–Tianjin–Hebei urban agglomeration: A production–living–ecological perspective. Land 2020, 9, 285. [Google Scholar] [CrossRef]
  43. Cao, Y.; Huang, X.; Liu, X.; Cao, B. Spatio-Temporal Evolution Characteristics, Development Patterns, and Ecological Effects of “Production-Living-Ecological Space” at the City Level in China. Sustainability 2023, 15, 1672. [Google Scholar] [CrossRef]
  44. Xie, G.; Zhang, C.; Zhen, L.; Zhang, L. Dynamic changes in the value of China’s ecosystem services. Ecosyst. Serv. 2017, 26, 146–154. [Google Scholar] [CrossRef]
  45. Xie, G.; Zhen, L.; Lu, C.; XIao, Y.; Li, W. Applying value transfer method for eco-service valuation in China. J. Resour. Ecol. 2010, 1, 51–59. [Google Scholar]
  46. Lu, X.; Shi, Y.; Chen, C.; Yu, M. Monitoring cropland transition and its impact on ecosystem services value in developed regions of China: A case study of Jiangsu Province. Land Use Policy 2017, 69, 25–40. [Google Scholar] [CrossRef]
  47. Liu, M.; Jia, Y.; Zhao, J.; Shen, Y.; Pei, H.; Zhang, H.; Li, Y. Revegetation projects significantly improved ecosystem service values in the agro-pastoral ecotone of northern China in recent 20 years. Sci. Total Environ. 2021, 788, 147756. [Google Scholar] [CrossRef] [PubMed]
  48. Goswami, R.; Saha, S.; Dasgupta, P. Sustainability assessment of smallholder farms in developing countries. Agroecol. Sust. Food 2017, 41, 546–569. [Google Scholar] [CrossRef]
  49. Wang, D.; Jiang, D.; Fu, J.; Lin, G.; Zhang, J. Comprehensive assessment of production–living–ecological space based on the coupling coordination degree model. Sustainability 2020, 12, 2009. [Google Scholar] [CrossRef] [Green Version]
  50. Li, J.; Fang, H.; Fang, S.; Siddika, S.E. Investigation of the relationship among university–research institute–industry innovations using a coupling coordination degree model. Sustainability 2018, 10, 1954. [Google Scholar] [CrossRef] [Green Version]
  51. Yang, Z.; Han, L.; Liu, Q.; Li, C.; Pan, Z.; Xu, K. Spatial and temporal changes in wetland in Dongting Lake Basin of China under long time series from 1990 to 2020. Sustainability 2022, 14, 3620. [Google Scholar] [CrossRef]
  52. Liu, C.; Xu, Y.; Sun, P.; Huang, A.; Zheng, W. Land use change and its driving forces toward mutual conversion in Zhangjiakou City, a farming-pastoral ecotone in Northern China. Environ. Monit. Assess. 2017, 189, 505. [Google Scholar] [CrossRef]
  53. Cheng, X.; Van Damme, S.; Li, L.; Uyttenhove, P. Evaluation of cultural ecosystem services: A review of methods. Ecosyst. Serv. 2019, 37, 100925. [Google Scholar] [CrossRef]
  54. Anaya-Romero, M.; Muñoz-Rojas, M.; Ibáñez, B.; Marañón, T. Evaluation of forest ecosystem services in Mediterranean areas. A regional case study in South Spain. Ecosyst. Serv. 2016, 20, 82–90. [Google Scholar] [CrossRef]
  55. Su, K.; Wei, D.-z.; Lin, W.-x. Evaluation of ecosystem services value and its implications for policy making in China–A case study of Fujian province. Ecol. Indic. 2020, 108, 105752. [Google Scholar] [CrossRef]
  56. Lin, G.; Jiang, D.; Fu, J.; Zhao, Y. A review on the overall optimization of production–living–ecological space: Theoretical basis and conceptual framework. Land 2022, 11, 345. [Google Scholar] [CrossRef]
  57. Wang, Q.; Wang, H. Dynamic simulation and conflict identification analysis of production–living–ecological space in Wuhan, Central China. Integr. Environ. Assess. Manag. 2022, 18, 1578–1596. [Google Scholar] [CrossRef]
  58. Zhang, X.; Xu, Z. Functional coupling degree and human activity intensity of production–living–ecological space in underdeveloped regions in China: Case study of Guizhou Province. Land 2021, 10, 56. [Google Scholar] [CrossRef]
  59. Tao, J.; Lu, Y.; Ge, D.; Dong, P.; Gong, X.; Ma, X. The spatial pattern of agricultural ecosystem services from the production-living-ecology perspective: A case study of the Huaihai Economic Zone, China. Land Use Policy 2022, 122, 106355. [Google Scholar] [CrossRef]
  60. Li, J.; Li, C.; Liu, C.; Ge, H.; Hu, Z.; Zhang, Z.; Tang, X. Analysis of the Coupling Coordination and Obstacle Factors between Sustainable Development and Ecosystem Service Value in Yunnan Province, China: A Perspective Based on the Production-Living-Ecological Functions. Sustainability 2023, 15, 9664. [Google Scholar] [CrossRef]
  61. Pan, F.; Shu, N.; Wan, Q.; Huang, Q. Land Use Function Transition and Associated Ecosystem Service Value Effects Based on Production–Living–Ecological Space: A Case Study in the Three Gorges Reservoir Area. Land 2023, 12, 391. [Google Scholar] [CrossRef]
  62. Liu, M.; Feng, X.; Wang, S.; Zhong, Y. Does poverty-alleviation-based industry development improve farmers’ livelihood capital? J. Integr. Agric. 2021, 20, 915–926. [Google Scholar] [CrossRef]
  63. Yin, S.; Yang, X.; Chen, J. Adaptive behavior of farmers’ livelihoods in the context of human-environment system changes. Habitat. Int. 2020, 100, 102185. [Google Scholar] [CrossRef]
Figure 1. Relationships among PLES, ESs and farming household livelihood security.
Sustainability 15 11121 g001
Figure 2. Overview of the Dongting Lake area.
Sustainability 15 11121 g002
Figure 3. Spatio-temporal distribution of PLES in the Dongting Lake Region, 2000–2020.
Sustainability 15 11121 g003
Figure 4. Mapping the land-use transition of the PLES in the Dongting Lake area from 2000 to 2020.
Sustainability 15 11121 g004
Figure 5. Spatio-temporal evolution of ESV in the Dongting Lake area in 2000, 2010, and 2020.
Sustainability 15 11121 g005
Figure 6. Spatio-temporal evolutionary characteristics of farming household livelihood security in the Dongting Lake area in 2000, 2010 and 2020.
Sustainability 15 11121 g006
Figure 7. The spatio-temporal differentiation characteristics of the degree of coordination of coupling between ESV and farming household livelihood security in 2000, 2010 and 2020.
Sustainability 15 11121 g007
Table 1. Land-use classification standards for agricultural PLES in the Dongting Lake area.
First-Class ClassificationSecondary ClassificationCorresponding Land Use Type
Production space (PS)Agricultural production space (APS)Paddy field, dry land
Living Space (LS)Rural living space (RLS)Rural residential area
Ecological Space (ES)Forest ecological space (FES)Forest land, shrub land, sparse forest land, other forest land
Grassland ecological space (GES)High coverage grassland, medium coverage grassland, low coverage grassland
Aquatic ecological space (AES)Rivers and canals, lakes, reservoirs and ponds, tidal flats, beaches
Other ecological spaces (OES)Bare soil, bare rock
Table 2. Ecosystem service equivalence table of PLES in the Dongting Lake area.
Ecosystems Service
Classification
Provisioning ServicesRegulating ServicesSupporting ServicesCultural Services
Food
Production
Raw
Material
Production
Water
Resources Supply
Gas
Regulation
Climate RegulationWaste TreatmentHydrological RegulationSoil
Conservation
Maintaining Nutrient CirculationBiodiversity MaintenanceProviding Aesthetic Values
PSAPS1.280.14−2.211.040.540.162.330.170.180.200.09
LSRLS0.170.08−5.081.020.51−1.690.850.680.170.170.1
ESFES0.310.710.372.357.031.993.512.860.222.61.14
GES0.380.560.311.975.211.723.822.40.182.180.96
AES0.80.238.290.772.295.55102.240.930.072.551.89
OES0000.0200.10.030.0200.020.01
Table 3. Farming household livelihood security evaluation system.
Target LayerGuideline LayerFactor LayerIndicator LayerWeights
Farming household livelihood securityVulnerability background (pressures)Development TrendsPopulation growth rate0.033
Arable land area change rate0.041
GDP growth rate0.044
Livelihood assets (state)Human CapitalProportion of population with junior high school education or above0.045
Financial CapitalGDP per capita0.042
Social CapitalUrbanization rate0.063
Natural CapitalNormalized vegetation index0.042
Average annual rainfall0.042
Arable land area per capita0.045
physical capitalHousing area per capita0.049
Number of hospital health beds per 10,000 people0.046
Reservoir density0.058
Effective irrigation rate0.035
Structure and process and livelihood strategies (responses)Development PoliciesGrowth rate of fixed asset investment0.046
Livelihood StrategiesWage income0.051
Household business income0.046
Property income0.055
Transferable income0.048
Livelihood results (impact)Economic incomePer capita net cash income0.034
Resource UtilizationChange rate of crop sown area0.036
Grain yield0.060
Standard of livingRetail sales of social consumer goods per capita0.038
Table 4. Classification of coupling coordination.
D [0, 0.4](0.4, 0.6](0.6, 0.8](0.8, 0.9](0.9, 1]
Coupling coordination levelSeriously unbalanced developmentSlightly unbalanced developmentBarely balanced developmentFavorably balanced developmentSuperiorly balanced development
Table 5. Land-use transformation in the PLES in the Dongting Lake area, 2000–2020.
YearTransformation TypeArea
(×104 hm2)
Percentage
2000–2010PS → ES1.480.5%
PS → LS0.126.9%
ES → LS0.116.3%
ES → PS0.063.4%
LS → PS0.052.9%
2010–2020PS → ES48.445.8%
ES → PS47.2744.7%
PS → LS4.173.9%
LS → PS3.83.6%
LS → ES1.11.0%
ES → LS0.960.9%
Table 6. Changes in ESV of the Dongting Lake in 2000, 2010, and 2020.
Type of PLESESV (×108 Yuan)Rate of Change (%)
2000201020202000–20102010–20202000–2020
PS200.91231.53152.6415.24−34.07−24.02
LS−5.45−6.33−4.22−16.0833.2822.56
ES3258.024061.472742.6624.66−32.47−15.82
Total3453.474286.672891.0824.13−32.56−16.28
Table 7. Changes in the livelihood security level of farmers in the Dongting Lake area from 2000 to 2020.
Type of PLESMean Value of Livelihood Security Level of FarmersRate of Change
2000201020202000–20102010–20202000–2020
PS1.3881.4091.4111.492%0.131%1.625%
LS1.3891.4111.4231.594%0.854%2.462%
ES1.3671.3841.3871.246%0.217%1.466%
Total1.3761.3941.3971.342%0.186%1.531%
Table 8. The changes in the degree of coordination of coupling between ESV and farming household livelihood security from 2000 to 2020.
Type of PLESCoupling Coordination DegreeRate of Change
2000201020202000–20102010–20202000–2020
PS0.420.450.447.00%−1.00%5.93%
LS0.380.420.428.19%1.38%9.68%
ES0.470.510.508.75%−2.21%6.35%
Total0.450.490.488.15%−1.70%6.32%
Disclaimer/Publisher’s Note: The statements, opinions and data contained in all publications are solely those of the individual author(s) and contributor(s) and not of MDPI and/or the editor(s). MDPI and/or the editor(s) disclaim responsibility for any injury to people or property resulting from any ideas, methods, instructions or products referred to in the content.

