Article

El Niño Southern Oscillation (ENSO) Implication towards Crocodile River Water Quality in South Africa

by
Babalwa Gqomfa
1,
Thabang Maphanga
1,*,
Takalani Terry Phungela
2,
Benett Siyabonga Madonsela
1,
Karabo Malakane
3 and
Stanley Lekata
4
1
Department of Environmental and Occupational Studies, Faculty of Applied Sciences, Cape Peninsula University of Technology, Zonnebloem, Cape Town 7925, South Africa
2
Department of Water and Sanitation, 35 Brown Street, Mbombela 1201, South Africa
3
Department of Biodiversity, School of Molecular and Life Sciences, Private Bag X1106, Sovenga 0727, South Africa
4
Centre for Postgraduate Studies (CPGS), Faculty of Applied Sciences, Cape Peninsula University of Technology, Bellville South Industrial, Cape Town 7530, South Africa
*
Author to whom correspondence should be addressed.
Sustainability 2023, 15(14), 11125; https://doi.org/10.3390/su151411125
Submission received: 14 June 2023 / Revised: 11 July 2023 / Accepted: 14 July 2023 / Published: 17 July 2023

Abstract

:
This paper investigates the impact of ENSO on water quality by looking at COD, SS, and Escherichia coli along the Crocodile River. Water samples were collected between 2016 and 2021 at three strategic sites on the river and were tested in an accredited laboratory. Python (version 3.8), Spyder and Microsoft Excel 2019 were used to analyze the data. The highest COD concentration (800 mg/L) was recorded at the White River site during El Niño, followed by 600 mg/L during the normal period, and 240 mg/L during the La Niña period. In 2019 during La Niña and the normal period, the E. coli levels were centered in one place at 60 cfu/100 mL, while in 2021 no E. coli levels were detected from the La Niña, El Niño, and normal periods. The suspended solids in this study were more prevalent in the White River (upstream) during the El Niño period. These analyses demonstrate that it is possible to evaluate the local effects associated with large-scale climate variability.

1. Introduction

The El Niño Southern Oscillation (ENSO), which is the main cause of inter-annual variability in the Earth’s climate, is responsible for oceanic and atmospheric variations [1]. It is crucial to understand the local effects of climate-altering phenomena like the ENSO as these atmospheric changes determine water availability in a region or country [2,3]. Given that South Africa has a limited water supply and only receives a mean of 497 mm of rainfall annually [4], it is significant to study the effect of ENSO on surface water. Southern Africa is popularly known for being a semi-arid region characterized by a lack of rainfall, complex topography, and poor water management.
ENSO episodes may have a considerable influence on water quality due to shifting climatic conditions ranging from droughts in some areas to floods in others [5]. Researchers have attributed ENSO as a major driver of the inter-annual climate variability in Southern Africa as well as the African continent at large [6,7]. For example, during the El Niño phase, higher sea surface temperatures warm the atmosphere, resulting in increased convection and rainfall over Eastern Africa. Southern Africa, on the other hand, is dominated by a continental high-pressure system that suppresses regional atmospheric convection and rainfall [8]. As a result of ENSO, climatic variability is notably important in Southern and Eastern Africa as it determines water availability which is key to socio-economic development [2,6]. Previous research has looked at evaluating surface water and ENSO, whereby these studies highlighted the need to understand patterns and drivers of climate variability, both temporally and spatially, that influence the recharge of groundwater [6,9]. Inter-annual fluctuations in hydrology are important in water management planning. Numerous studies have found that fluctuations in temperature and precipitation caused by ENSO correlate closely with the mean annual and seasonal river flow [7,10,11].
Two-thirds of the extremely hot temperature events in South Africa between 1970 and 2015 can be tied to El Niño [3], whereas La Niña events are linked to the development of tropical-temperate troughs that boost rainfall across South Africa [8]. According to a study by Bradshaw et al. [12], South Africa has a 4% annual chance of witnessing uncharacteristically high temperatures; this chance rises to 62% during intense El Niño years. The warming air resulting from higher temperatures allows for a higher capacity for moisture absorption, which leads to increased heavy rains or storms. This would have a serious negative impact on water quality because floodwater can be contaminated with pollutants like sewage, agricultural pesticides, industrial chemicals, and debris. On the other hand, droughts may result in decreased flow, and water levels during hydrological droughts may impact water quality due to limited dilution [13]. During El Niño, prolonged low stream flows may raise toxicant concentrations and reduce dissolved oxygen levels [14]. El Niño has been linked to unusually warm sea surface temperature anomalies which may also impact river water quality by influencing evaporation and water temperature. Increased water temperatures will induce eutrophication and excess algae development in many regions, lowering drinking water quality [15].
Thus, the water quality of rivers is influenced by changes in climate and season in their catchment areas [16]. This is corroborated by literature in the sense that there is a general agreement that water quality in lakes and reservoirs will change as climate changes [17,18,19].
Climate change has been shown to affect water quality parameters such as stratification [20], water transparency [21], oxygen content [22], primary production and algal biomass [23], phenological patterns [24,25], and harmful algae blooms [26]. The majority of these studies attribute the changes in these water quality parameters to rising air temperatures, which cause changes in heat balances and water body mixing dynamics.
According to the literature search for this study, it has been found that limited studies have looked at the impact of ENSO on surface water quality, especially in Southern Africa. The water quality parameters for this study are Escherichia coli (E. coli), Suspended Solids (SS), and Chemical Oxygen Demand (COD). E. coli concentrations in surface water systems fluctuate in response to socio-economic factors like urbanization, population growth, and sanitation, as well as climate change, which includes fluctuations in precipitation patterns and surface air temperature. Examples of the mechanisms that affect E. coli concentrations in surface water are universal [27]. Contamination of water bodies, brought on by microbial fecal pollution, is a major issue in many countries, particularly low- and middle-income countries.
The presence of Suspended Solids (SS) is generally associated with a decrease in water clarity, such as light penetration or visibility. Suspended Solids (SS) transported by rain runoff water have been identified as one of the primary sources of polluted sediments from urban developments. Torres and Bertrand-Krajewski [28] and Hoshiba et al. [29] concur that various contaminants in urban rainy-weather discharges are associated with suspended particles.
Chemical Oxygen Demand (COD) indicates the amount of oxygen in a measured solution that can be consumed by reactions. It serves as an indicator for the amount of reducing substances in water, including organic, sulphide, nitrite, ferrous salts, and others., with the organic dominating. The mass of oxygen consumed over the volume of solution is a typical way to express COD. The basic principle behind COD detection is that almost all organic compounds can completely oxidize to carbon dioxide when exposed to acidic conditions and a strong oxidizing agent [30]. High levels of COD indicate the presence of organic matter, both biodegradable and nonbiodegradable, which results in high levels of pollution [31]. The death of bacterial cells may also result in an increase in COD as a result of the cells’ release of dissolved organic carbon as they decompose. High levels of COD in river systems indicate pollution and may be harmful to aquatic life, especially fish, whereas low levels in river systems indicate acceptable water quality [32]. To sustain fish and human beings, surface water should record low levels of COD. That is, COD levels should not exceed 75 mg/L, according to the South African water guidelines for wastewater.
There have been very few studies on the El Niño Southern Oscillation (ENSO) and its impact on River water quality, particularly in South Africa. This research can help raise awareness about how the ENSO affects water quality. Furthermore, it may serve as a model for many future studies that the city will be required to do.
There are three phases to ENSO, namely El Niño, La Niña, and Neutral (normal). All three phases create variation in rainfall due to ENSO directly affecting the weather conditions, which subsequently affects water resources. Therefore, the nonstationary nature of rainfall variability in South Africa, ENSO, and river inflow fluctuations make it advantageous to study water quality using E. coli, COD, and SS. Therefore, this paper investigates the impact of ENSO (rainfall) on the Crocodile River water quality by looking at COD, SS, and E. coli at three strategic sites along the river. The scientific question addressed is whether there exists a statistically valid link between three events of ENSO, with COD, SS, and E. coli as part of river water quality parameters.

2. Materials and Methods
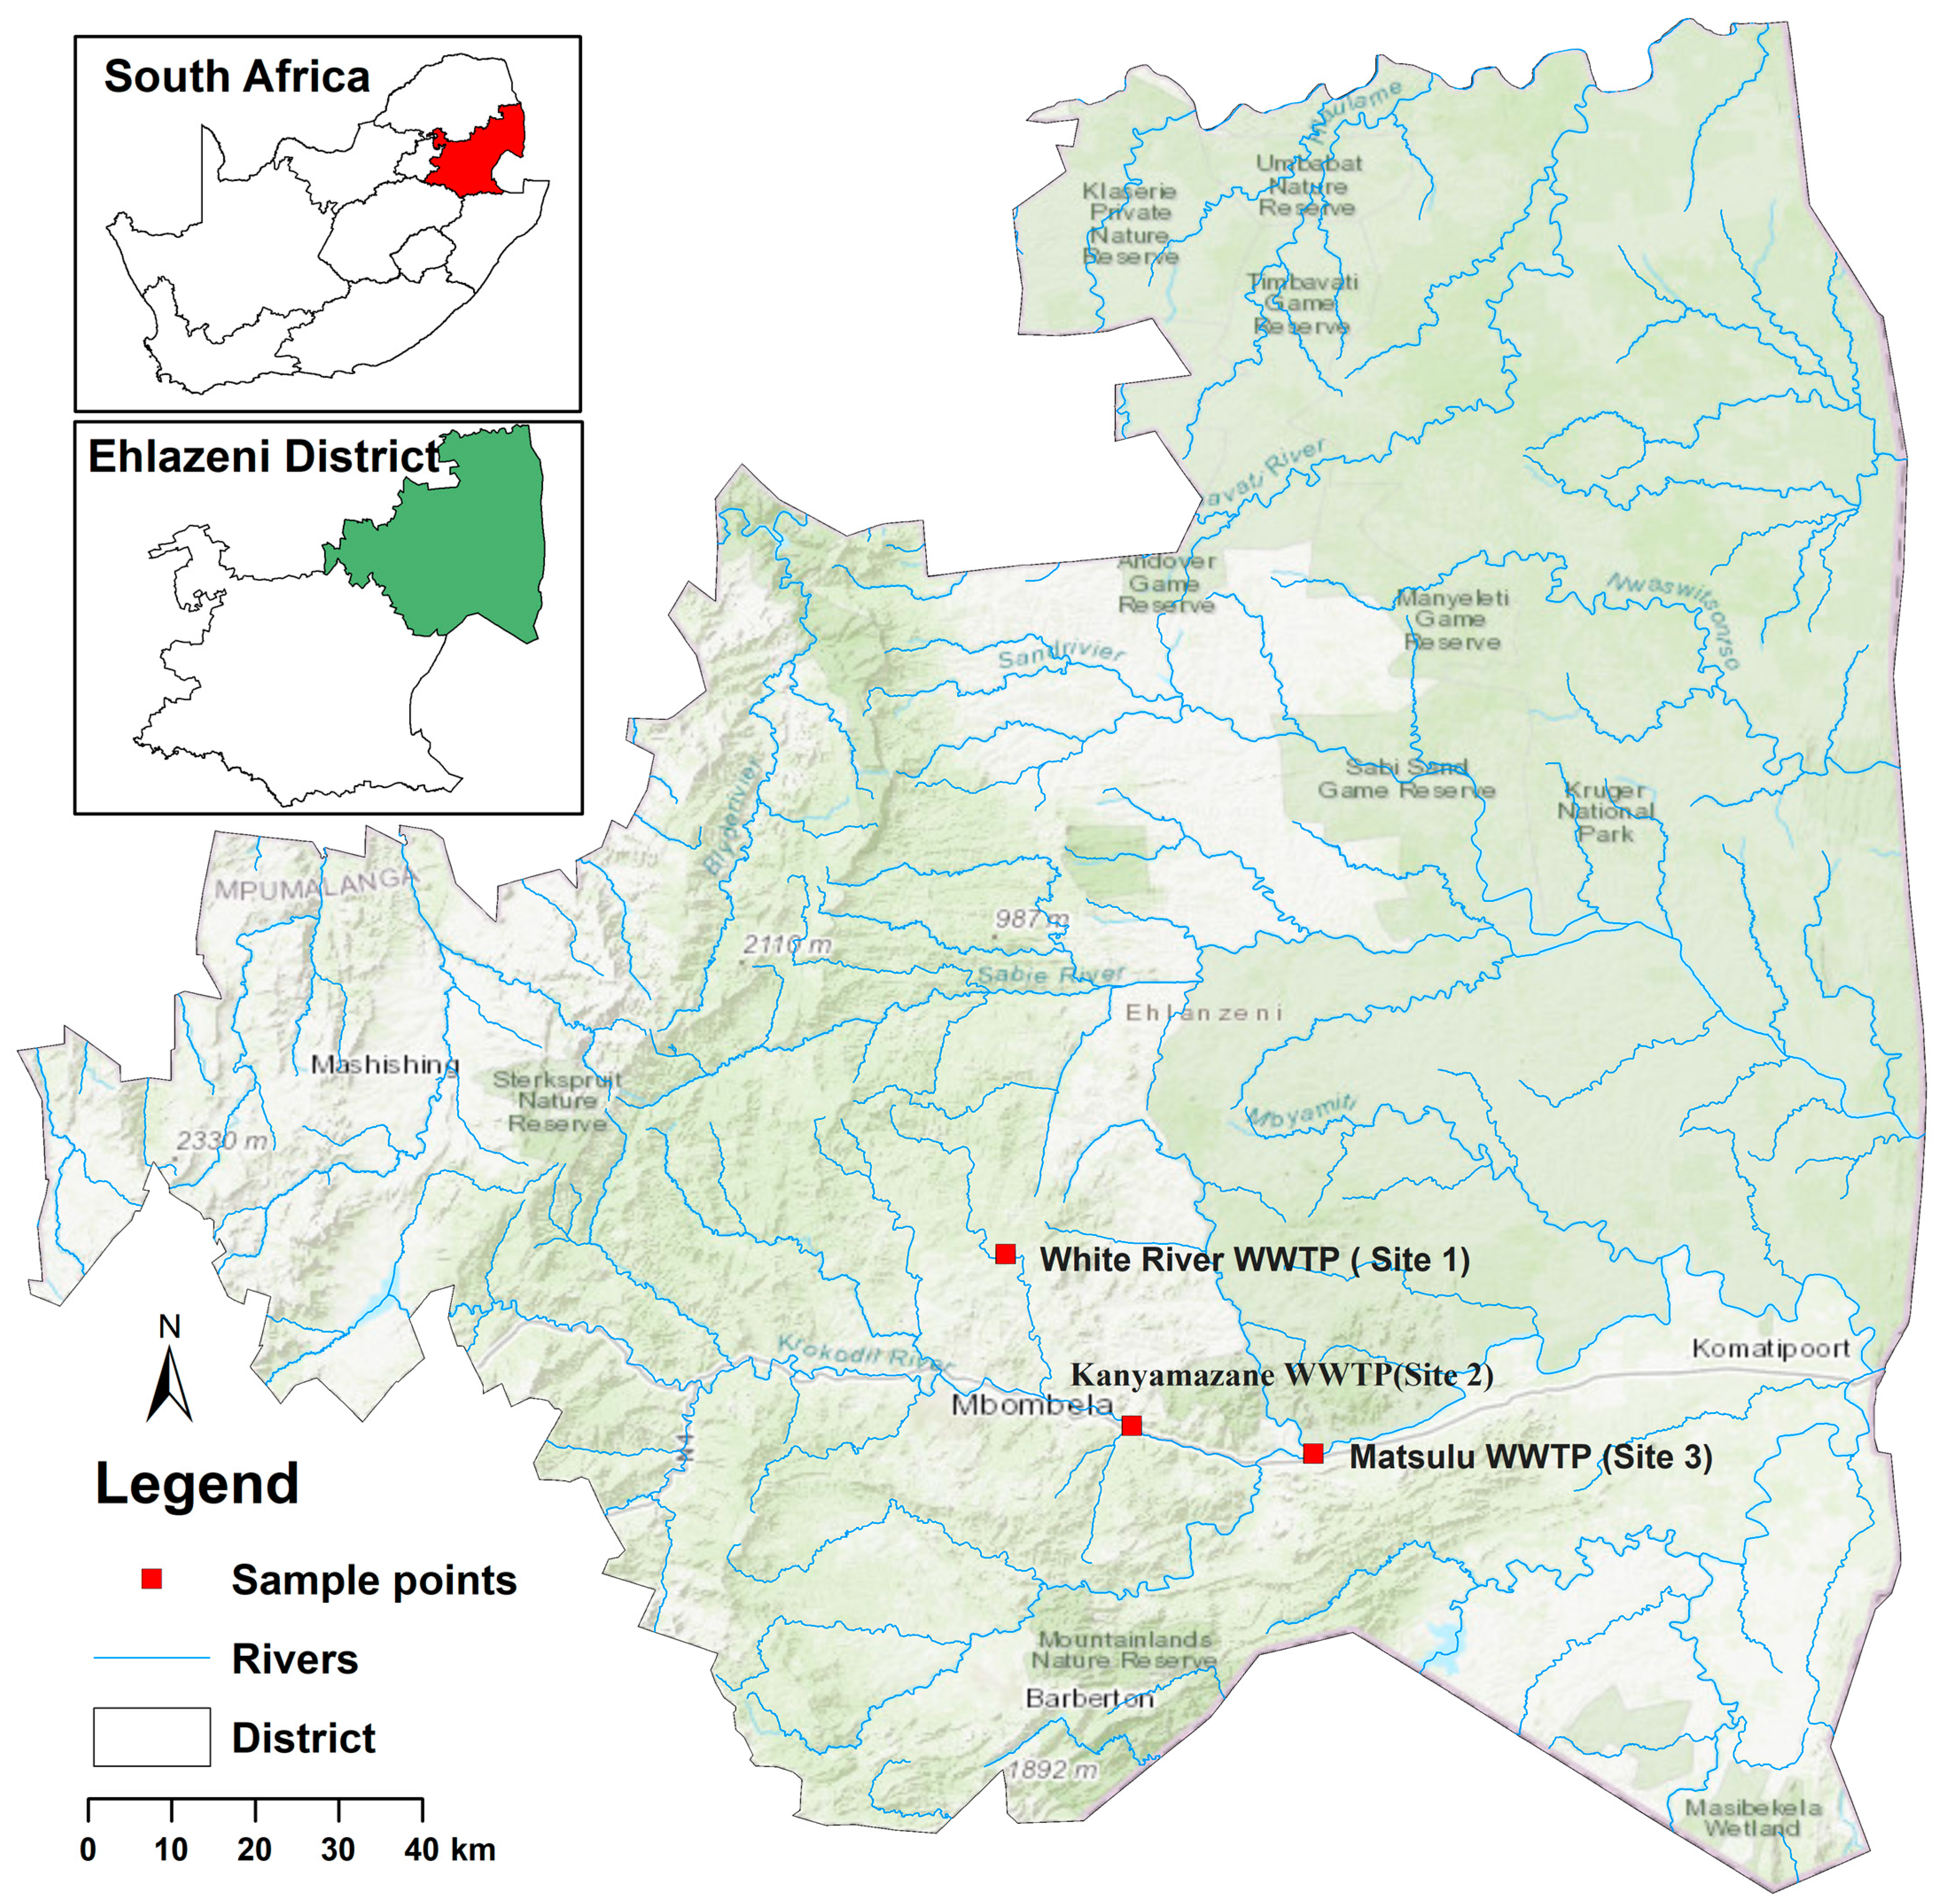
2.1. Study Area

The Crocodile River originates from the Steekampsberg mountains north of Dullstroom, Mpumalanga. It is the largest tributary of the Komati River. The Crocodile River catchment area is 10,446 km2, flowing into the Kwena Dam and eastwards through Nelspruit and confluences with the Komati River before flowing into Mozambique at the Lebombo border gate. Elands River and Kaap River are two major tributaries of the Crocodile River system. Other smaller tributaries include the Lunsklip River, Nels River, Houtbosloop River, Gladdespruit, White River, and Besterspruit. The Crocodile River catchment is mostly dominated by agricultural activities (fruit orchards, sugar cane plantation, vegetables), commercial forestry, and rural and urban settlements. The river flows through the major towns of Nelspruit, Malelane, and Kaapmuiden. The middle region of the river has experienced a rapid increase in urbanization in the past decade. Other major activities occurring within the catchment include mining and paper milling in the Kaap and Elands River sub-catchment.

2.2. Characterization of the Sampling Sites

Figure 1 shows the three sampling locations, namely White River, Matsulu, and Kanyamazane. The samples were taken at the three sampling sites located within the study area between 2016 and 2021 during El Niño (drier seasons and drought conditions), La Niña (rainfall and abundant seasons), and the normal period (normal (neutral) period).
  • White River Wastewater Treatment Plant (WWTP) (Site 1)
The White River WWTP treats only domestic wastewater and has a design capacity of 6 Megaliters per day (ML/d). The domestic wastewater from the nearby town of Plaston and the town of White River is treated at the White River WWTP before being discharged into the tributary of the Crocodile River known as the White River. The WWTP has been classified as a Class B, the process controllers are classified, and the WWTP is authorized to discharge effluent. WWTP treats domestic wastewater only, not stormwater runoff; however, during extreme flood events, there is some stormwater ingress into the system, but not significant. The area’s current land use is a combination of residential settlements and shopping malls, notably towards the White River Central Business District. Most of the surrounding areas are agricultural grounds where flowers, tropical fruits, and timber predominate.
  • Kanyamazane WWTP (Site 2)
The domestic wastewater from Kanyamazane township is treated at the Kanyamazane WWTP before being released into the Crocodile River. The region is heavily populated, and human activities occurring in the nearby residential settlements along the Crocodile River have a major impact on the water quality. Kanyamazane, the southernmost settlement in the Nsikazi activity corridor, is about 30 km east of Nelspruit and 17 km south of Kabokweni. All process controllers are classified, and the plant itself is classified as Class D. It nearly forms a continuously developed area connecting to Msogwaba in the north. Kanyamazane’s oblong, north-south configuration can be attributed to the nearby mountainous terrain and a significant tributary.
  • Matsulu WWTP (Site 3)
Matsulu town is relatively remote, located 45 km east of Nelspruit in the municipality’s easternmost section. The railway line to Phalaborwa cuts through Matsulu, which is sandwiched between the N4 highway, the Kruger National Park, and the Mthethomusha Nature Reserve. The Matsulu a, b, c, and Matsulu West townships are the official townships that make up Matsulu. The governance of the WWTP is good, with it holding a Class C classification and authorization to discharge effluent into the river. The informal settlement is a fast-expanding region with a large influx of people due to its proximity to the N4 national road. The Matsulu wastewater treatment facility processes domestic wastewater from Matsulu township and releases the treated effluent into the Crocodile River. The plant is in a residential area where most land use activities are related to agriculture.

2.3. Sampling

The samples were collected at three points of the Crocodile River from 2016 to 2021 (monthly) to test the quality of the water. COD, SS, and E. coli were analyzed in different years, seasons, and months during the El Niño, La Niña, and normal periods. Using a permanent marker, the site code, date, and time of sample collection were written on the polyethylene plastic water quality sampling bottles. The microbial sampling bottles were already pre-sterilized before sampling; therefore, no additives were introduced to them. The grab-sample approach was used to sample chemicals and microorganisms to determine the water quality [33]. The bottle lids remained on until the sample was ready for collection. All required samples were collected at the effluent discharge points of the wastewater treatment plant. However, one-liter bottles were rinsed three times before being filled with samples for chemical analysis, while the 300 mL sampling bottles used for microbial analysis were not rinsed since they had already been sterilized, and there was enough space within the bottle for mixing by shaking [33]. Water quality samples, both chemical and microbial, were kept in two different cooler boxes and kept cold with ice cubes or packs.

2.4. Rainfall Data and ENSO Data

The South African Weather Service provided rainfall data for the years 2016 to 2021. This data comprised daily rainfall observations for each study site. Data on rainfall is essential as rainfall can cause seasonal and inter-annual fluctuations and so can affect the effluent discharge. Based on the Oceanic Niño Index (ONI), events are defined as 5 consecutive overlapping 3-month periods at or above the +0.5 anomaly for warm (El Niño) events and at or below the −0.5 anomaly for cool (La Niña) events [34,35]. The ENSO data were acquired by using the Southern Oscillation Index (SOI) on the data for this study. An SOI value greater than 0.5 indicates the El Niño phase and an SOI value less than −0.5 indicates the La Niña phase. SOI values between −0.5 and 0.5 indicate a normal (neutral) period. Not only do these new indices exhibit close correlations with ENSO indices derived from a variety of previous methods, but they are also capable of distinguishing between three types of ENSO events [36].
SOI is calculated using the formula:
S O I = S t a n d a r d i z e d   T a h i t i S t a n d a r d i z e d   D a r w i n M o n t h l y   S t a d a r d   D e v i a t i o n
where:
S t a n d a r d i z e d   T a h i t i = A c t u a l   T a i h i t i   S e a   L e v e l   P r e s s u r e M e a n   T a i h i t i   S e a   l e v e l   P r e s s u r e S t a d a r d   D e v i a t i o n   T a h i t i
S t a n d a r d i z e d   D a r w i n = A c t u a l   D a r w i n   S e a   L e v e l   P r e s s u r e M e a n   D a r w i n   S e a   l e v e l   P r e s s u r e S t a d a r d   D e v i a t i o n   D a r w i n
Also
S t a d a r d   D e v i a t i o n   T a h i t i = A c t u a l   T a i h i t i   S e a   L e v e l   P r e s s u r e M e a n   T a h i t i   S e a   l e v e l   P r e s s u r e 2   N
S t a d a r d   D e v i a t i o n   D a r w i n = A c t u a l   D a r w i n   S e a   L e v e l   P r e s s u r e M e a n   D a r w i n   S e a   l e v e l P r e s s u r e 2 N
M o n t h l y   S t a d a r d   D e v i a t i o n = S t a d a r d   D e v i a t i o n   T a h i t i S t a n d a r d i z e d   D a r w i n 2 N
N is the number of months.

2.5. Prescribed Physicochemical Parameters

The General Authorization guidelines (general and special limits) of the South African Department of Water and Sanitation (DWS) were used as benchmarks to assess compliance with the final effluent quality [37]. When a WWTP discharges less than 2000 m3 of effluent into a water resource that is not specified in the regulations, general limits apply, but special limits apply to WWTPs that discharge less than 2000 m3 of effluent into a water resource that is listed in the regulations [37]. As stipulated by the WWTP Water Use License, Table 1 outlines the various effluent discharge quality limits for each site.
These standards were established by South Africa’s Department of Water Affairs (DWA), and water use licenses were issued in accordance with the government gazette number 39614, which was published on 22 January 2016. The Crocodile River mainly supports agriculture as well as commercial and subsistence fishing, and it has a class C ecological status. Depending on the quality of the receiving water, recreational usage, the effects on aquatic life, transboundary water management requirements, and other considerations, discharge limits vary from plant to plant.

2.5.1. Water Sampling Procedure for Physicochemical Parameters

To cover the pollutant’s spatial distribution in the Crocodile River, water quality samples were taken between 2016 and 2021 at three separate locations. On each site, monthly samples were taken using the same sampling method as described above. The samples were delivered to a laboratory that is accredited in terms of the South African National Accreditation System (SANAS). Within 12 h of collection, microbiological samples were processed.
Chemical oxygen demand was examined using Potassium Dichromate as an oxidizing agent. Potassium Dichromate was used to digest the sample, oxidizing the biodegradable organic carbon present. As reagents, potassium dichromate, sulfuric acid, and potassium hydrogen phthalate were utilized. A spectrophotometer at the wavelength of 543 nm was used since it is a colorimetric method. Ammonia was determined using a UV spectrophotometer following a Nessler method. Reagents such as Potassium sodium tartrate, ammonia standard solution, and Nessler Reagent were used. A spectrophotometer at wavelength 430 nm was used. A spectrophotometer (Thermo Scientific Orion AquaMate 8100 UV-Vis, Labotec, Cape Town, South Africa) was used to analyze the sample at 610 nm, while the Hach USEPA membrane filtration method 8367 m-TEC Agar was utilized for E. coli. In two steps, the m-TEC approach can identify E. coli in samples of freshwater used for recreational purposes. Membrane filters were incubated on m-TEC Agar for two hours at 35 °C to resuscitate injured organisms. Thereafter, the thermos-tolerant organisms were chosen by fermenting lactose at 44.5 °C. The second step involves the use of a substrate medium containing urea to differentiate urease-negative E. coli from other thermotolerant coliforms that hydrolyze urea. E. coli is present in colonies that are yellow or yellow–brown without urease. Suspended Solids (SS) were analyzed using the Hach gravimetric method, whereby a glass fiber disc was used as a filter in a filtering flask. A fiber filter disc was dried to a constant weight in an oven at 102–105 °C to remove any solids on the filter. A well-mixed filtered sample was dried in the filter in the oven at 102–105 °C, and the weight difference between the empty disc and the disc with remaining solids showed total dissolved solids.

2.5.2. Statistical Analysis

To analyze the data, Python (version 3.8) Spyder (https://www.spyder-ide.org/ (accessed on 5 May 2022)|Licensed MIT|design by FreeHTML5.co (CC-BY 3.0) Hugo port by SteveLane) and Microsoft Excel 2019 were both used. The Seaborn package for Python was utilized to create the heat maps that were needed for better data visualization. Parameters like Chemical Oxygen Demand (COD), Suspended Solids, and E. coli were analyzed from water samples taken during the El Niño, La Niño, and normal periods, respectively. The cross-tabulations or pivot tables for average E. coli, average COD, and Suspended Solids for different categories were generated between the sites upstream, midstream, and downstream. In addition to evaluating single-variate patterns of water quality parameters, the study also looked at multivariate patterns as proposed by Alberto et al. [38] and Singh et al. [39], in addition to examining single-variate patterns of water quality parameters. All statistical analyses were performed at the 95% confidence limit.

3. Results and Discussion

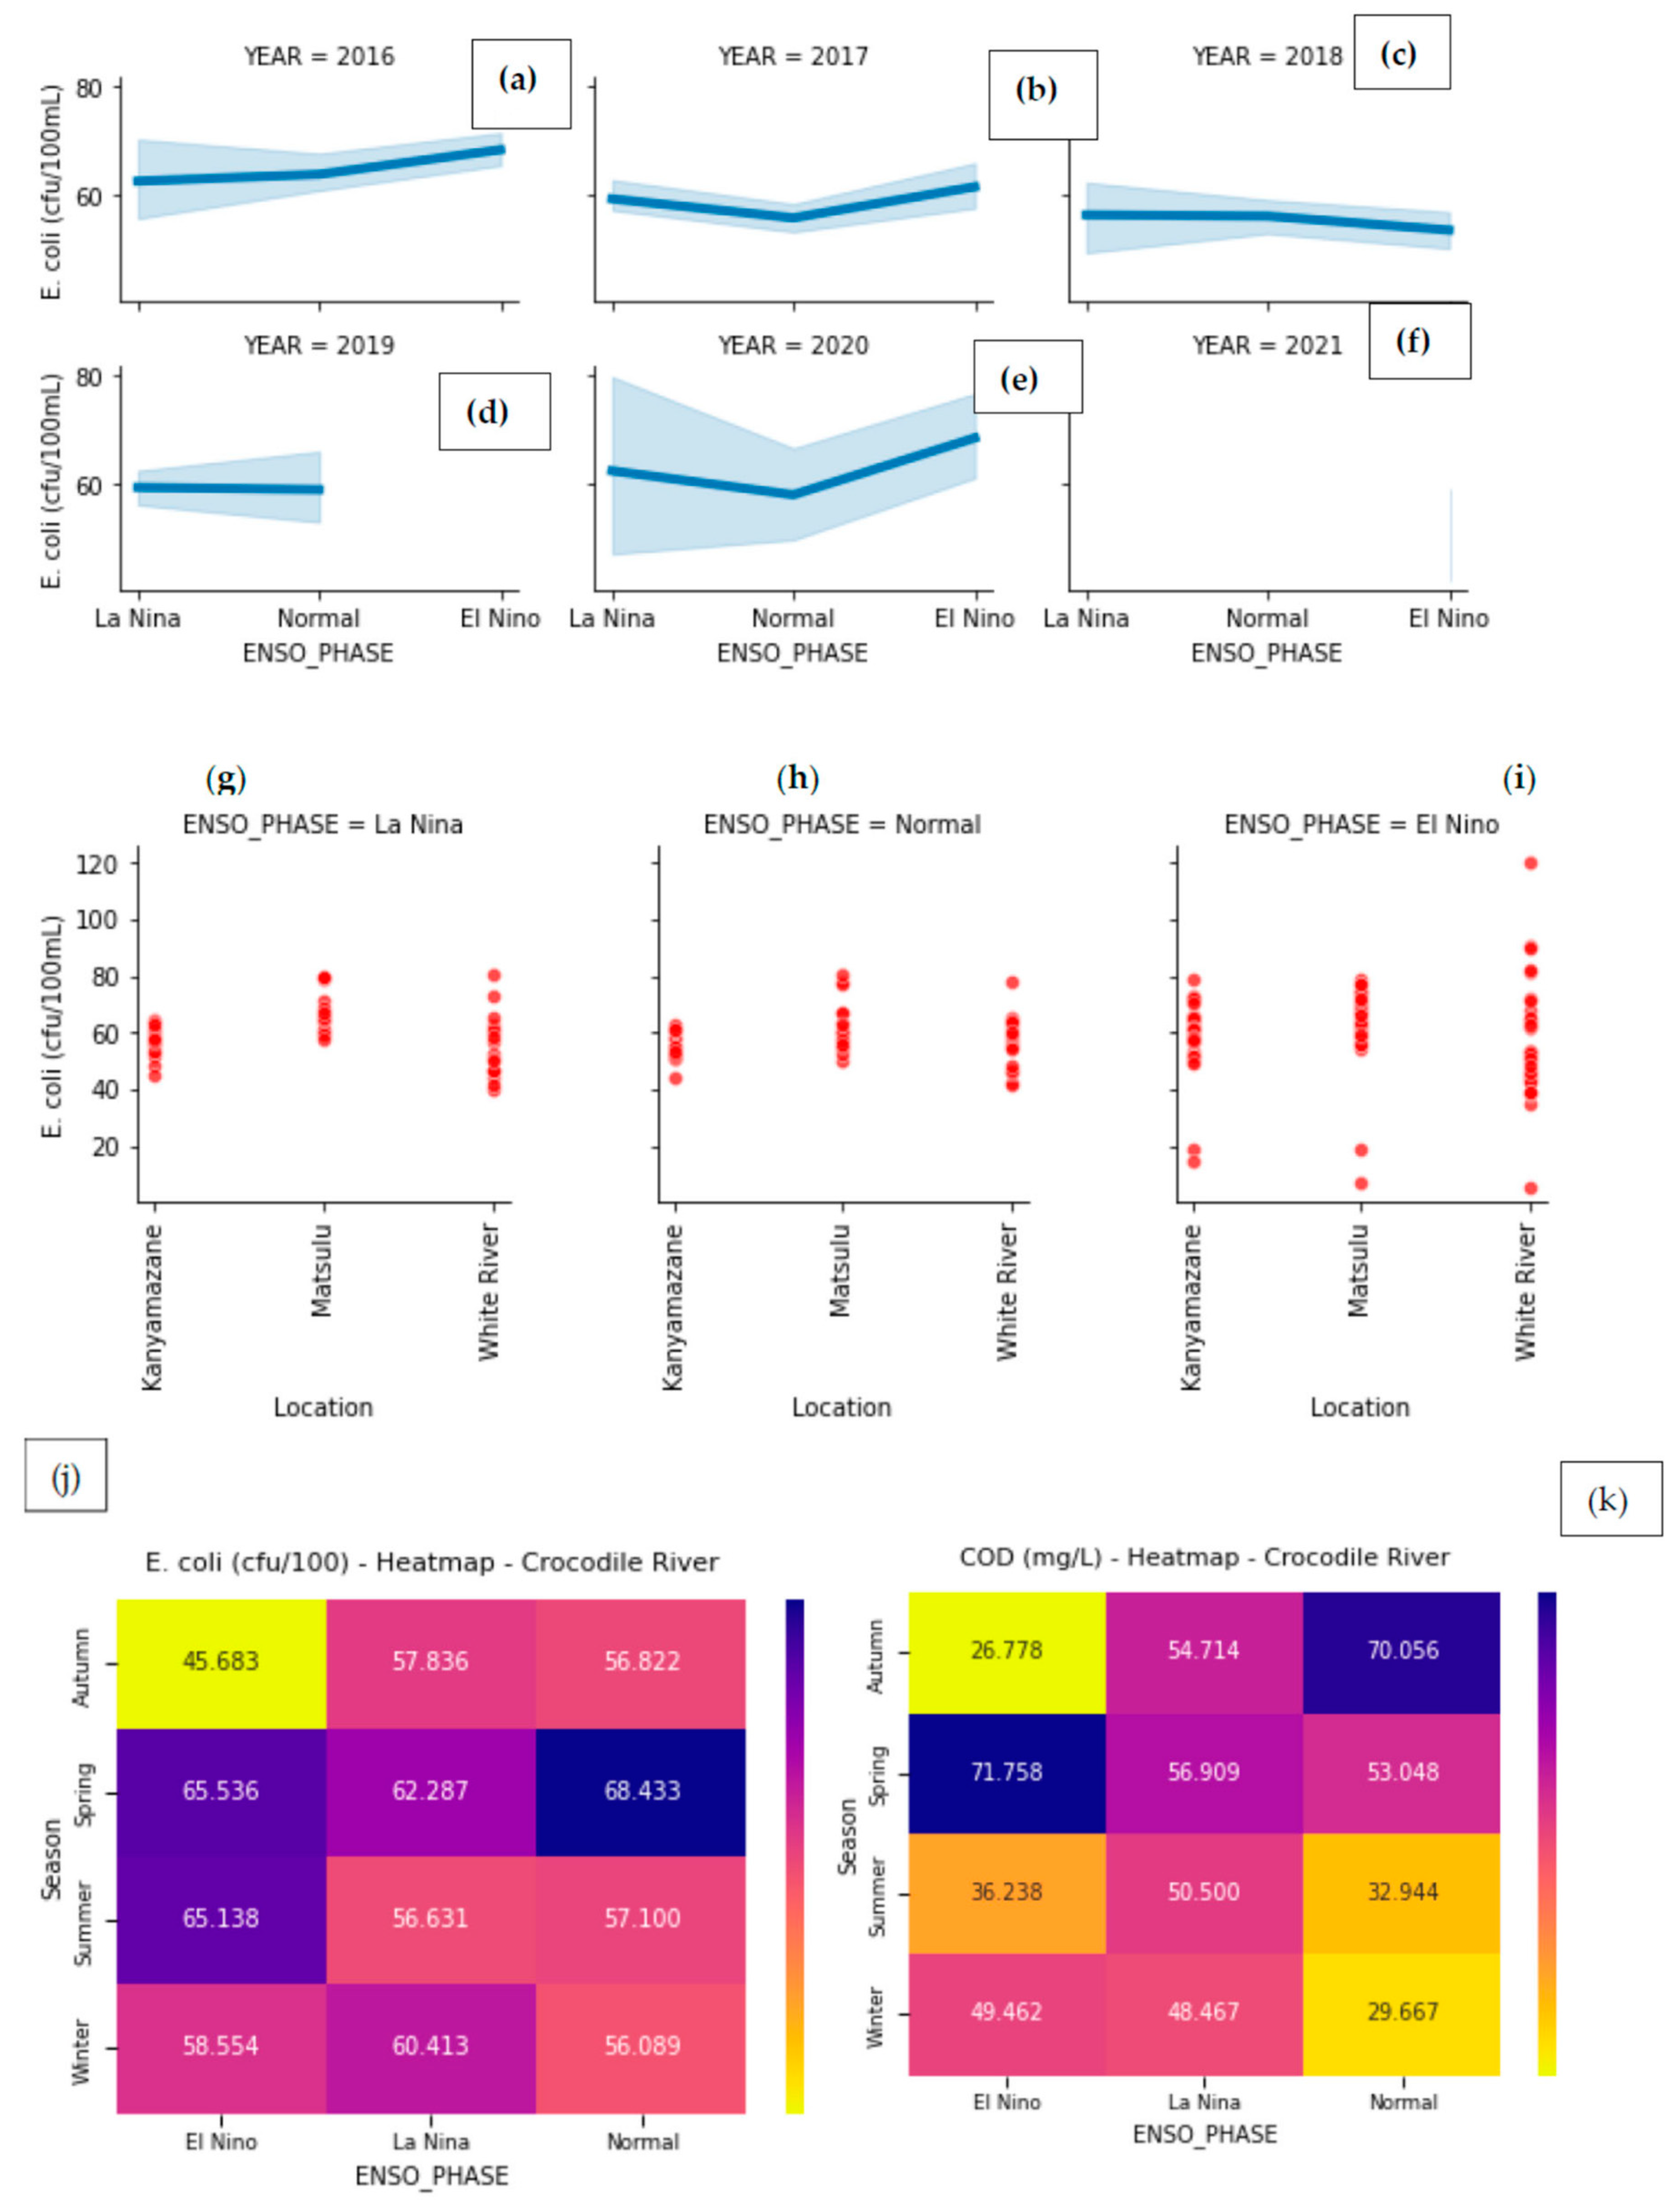
3.1. Escherichia coli (E. coli) Concentration during the Three ENSO Phases

Figure 2a–f depicts E. coli levels from 2016 to 2021 for the normal (Neutral), El Niño, and La Niña periods. The levels of E. coli increased during the 2016 and 2017 El Niño periods and then dropped the following year in 2018, before rising again in 2020. In 2019 during La Niña and the normal period, the E. coli levels were centered in one place at 60 cfu/100 mL, while in 2021, no E. coli levels were detected from the La Niña, El Niño, and normal periods. Although the El Niño period had the highest E. coli count between 70 and 80 cfu/100 mL in 2016 and 2020, the E. coli levels in all periods from 2016–2020 exceeded 0 cfu/100 mL for effluent discharge quality limit. Figure 2g–i depicts the E. coli levels at each sampling location. The results show that during the La Niña period, the Matsulu and White River sites had similar E. coli concentration levels, which were higher than that of the Kanyamazane site. During the normal period, Matsulu displayed the highest E. coli count, followed by White River and Kanyamazane. However, the White River site had the greatest E. coli level during the El Niño period at 120 cfu/100 mL. According to the heat map (Figure 2j), the recorded concentration of E. coli (35.900 cfu/100 mL) was the lowest during El Niño in April when it was dry. In Autumn, during the El Niño period when it is wet, E. coli was still lower at 45.683 cfu/100 mL (Figure 2k). During La Niña, E. coli values showed no increase; they were clustered between 40 and 80 cfu/100 mL. Figure 2j shows that the highest count of E. coli (71.667 cfu/100 mL) was recorded in April during La Niña, while the lowest E. coli count (35.900 cfu/100 mL) was recorded in April during El Niño. The highest E. coli record may be attributed to high E. coli concentrations due to lack of dilution since April falls under the dry months in Mpumalanga province. For the White River site, it may also be attributed to the partial or inadequate treatment of wastewater from the White River WWTP. A similar pattern was reported by Maphanga et al. [40], stating that high levels of E. coli were recorded during the wet season. Moreover, the study correlated rainfall and E. coli, indicating that they have an inverse relationship (rainfall and E. coli). Furthermore, research was conducted by Abia et al. [41] in the Apies River, where contaminated water flows downstream before reaching an area of altered flow conditions (wider, flatter river channels and slower water velocity). These findings show that each phase of the ENSO influences the behavior of certain parameters such as E. coli.
South Africa’s water guidelines state that E. coli levels should not exceed 0 cfu/100 mL for irrigation, and the effluent discharge quality limits should not be above 0 cfu/100 mL. From 2016 to 2020, the E. coli levels were higher than the set limit for irrigation and the effluent discharge quality limits for all ENSO phases, but in 2021 the standard was met as no E. coli levels were detected in all periods. The Kanyamazane, Matsulu, and White River sites have also exceeded the irrigation limit and the effluent discharge quality limit during the La Niña, El Niño, and normal periods. During the El Niño period, there was fluctuation at the White River site, as records show the lowest and the highest counts of E. coli. The fluctuation in E. coli counts during the El Niño period at the White River site could be attributed to the change in rain patterns and the inadequate treatment of wastewater at the White River WWTP. This observation is similar to the one made by Castro Fernández [42], who stated that there is an untreated or inadequate discharge of water into the Bogotá River, leading to the accumulation of sludge and, consequently, E. coli in the river. Castillo et al. [43] confirmed that this is a correlation between seasonal effects and the E. coli level that was evaluated in Casacara Rivers.
The regression analysis for E. coli for the El Niño period shows that the square of the correlation (R2) was 14%, which means that only 14% of the variation can be explained by the regression model. The correlation value was −1.3486 in rainfall, indicating that there was a negative correlation between E. coli and rainfall. The p-value of rainfall was also at 0.0134. This p-value was below 0.05 and considered statistically significant; see Table 2 below. The regression analysis for the La Niña period shows that the square of the correlation (R2) was 39.7%, which means that the variation can be partially explained; +60% cannot be explained by the regression model. The p-value of rainfall was significant at 0.0240 (see Table 3). Even the normal period had an R2 of 37% and a p-value that was 0.0688, considered statistically insignificant. The statistics in all the periods showed a negative correlation between E. coli and rainfall. According to this study, the declining river water quality during the wet season is linked to increased rainfall in the Chobe River in Botswana, where a study found the same results for E. coli [44]. There was additional evidence that La Niña conditions, which are responsible for above-average Chobe River floods and rainfall during the wet season, were linked to increased E. coli concentrations in the river. On the contrary, a study conducted in Limpopo, South Africa, revealed higher levels of E. coli in the dry season than in the wet season. The dry season (April–June) had higher E. coli levels than the wet season (January–March) [45]. In this study, the high E. coli levels during La Niña can be attributed to increased rainfall, which could result in excessive surface runoff into the river, as well as inadequate treatment of wastewater from the White River WWTP and the nearby wastewater treatment plants. The standard deviation for E. coli was 16.44 during the El Niño period, 8.50 during the normal period, and 9.68 during La Niña period. All standard deviations during the three periods were high, and this indicates data are more spread out, and values are generally far from the mean.

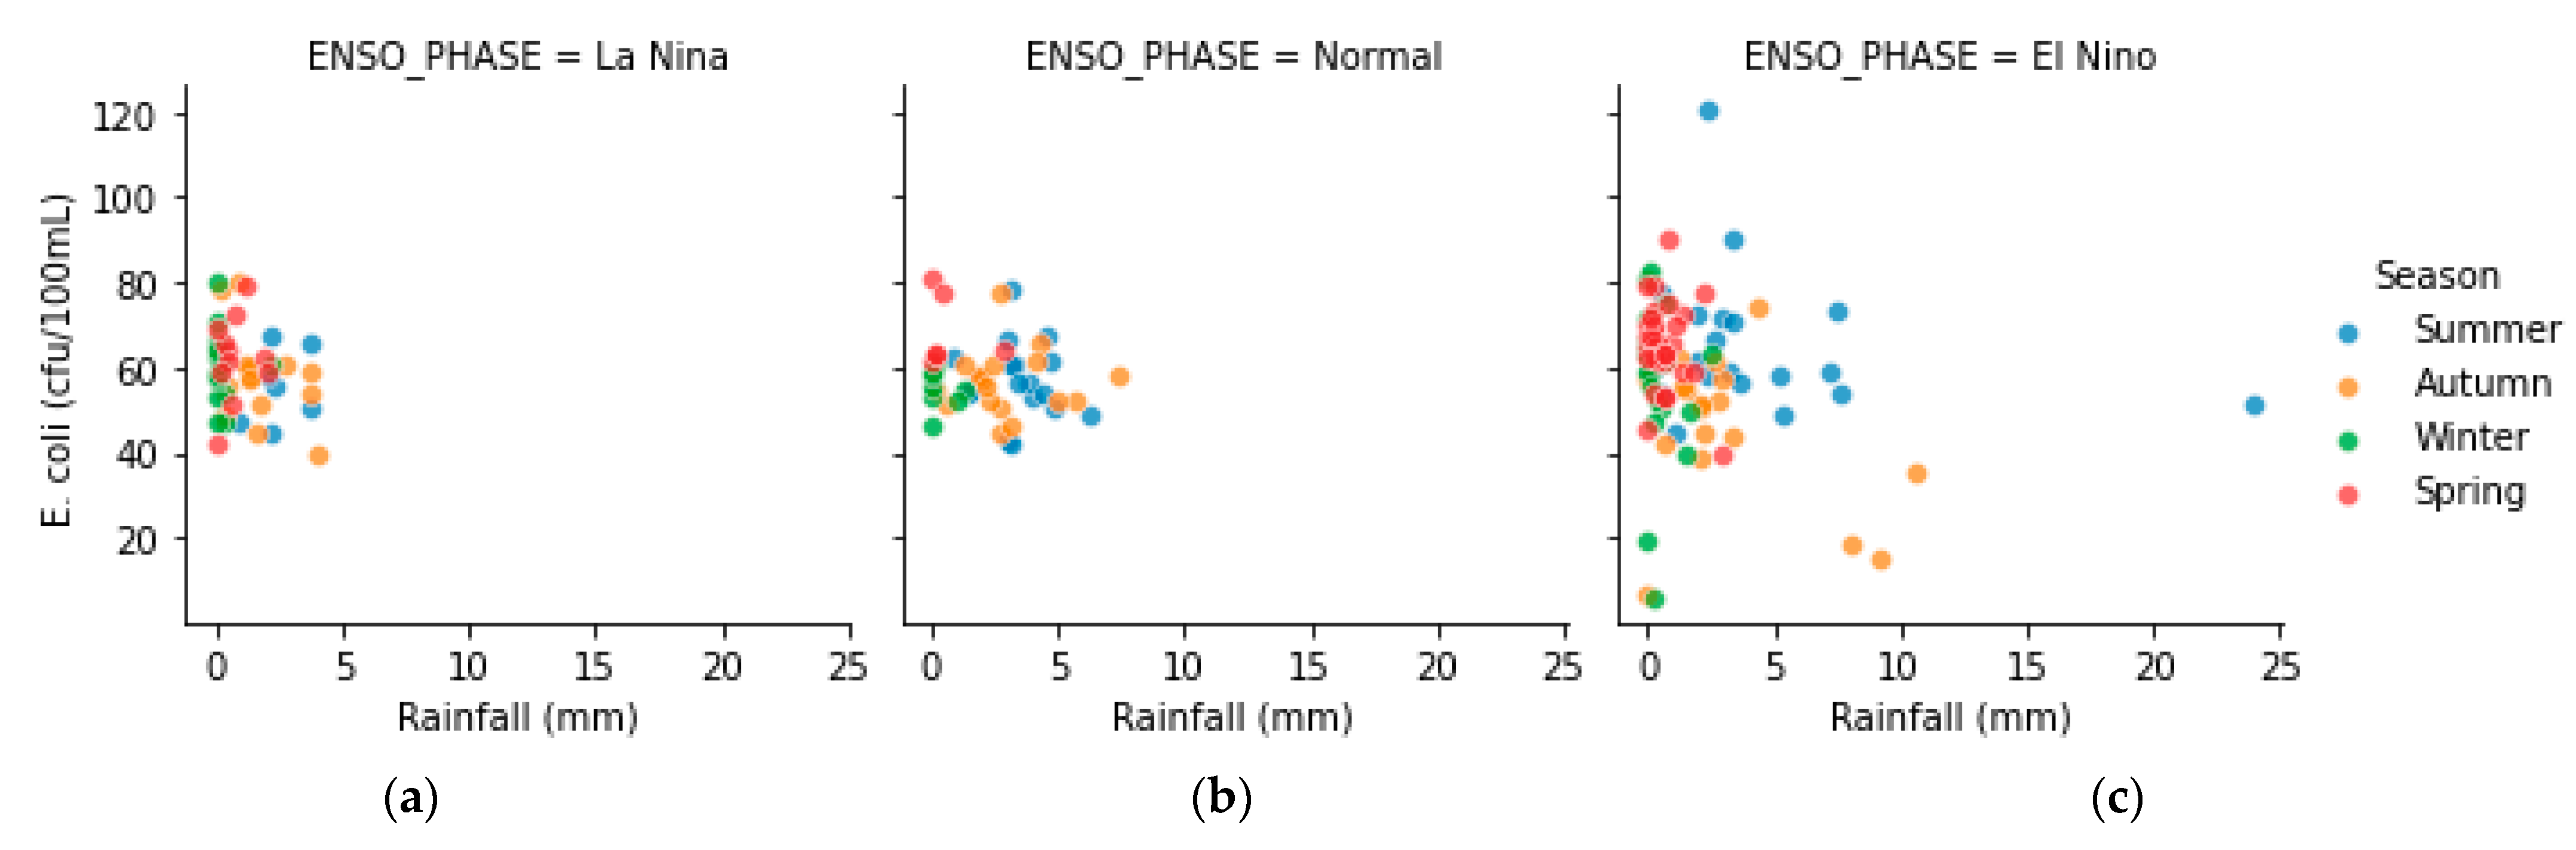
E. coli Seasonal Concentrations with the Influence of Rainfall during the Three ENSO Phases

Figure 3 shows the highest E. coli levels during the El Niño period in Summer compared to the normal and La Niña periods. During the La Niña phase, the E. coli levels were clustered between 40 and 80 cfu/100 mL. During the normal period, the E. coli levels were slightly higher in Spring compared to other seasons. However, the concentration was also clustered between 40 and 80 cfu/100 mL. Winter and Autumn recorded the lowest E. coli count during the El Niño period. In this study, rainfall is an excellent predictor of E. coli during the El Niño, La Niña, and normal periods. Researchers have found that the El Niño Southern Oscillation (ENSO) impacts rivers throughout the world in a predictable manner. It is important to determine the potential relationship between ENSO and streamflow since ENSO could have a significant impact on seasonal and interannual variability in rivers [46]. Maphanga et al. [40] discovered that the spatial distribution of E. coli varies from upstream to downstream of the Crocodile River, consistent with the findings of this study. However, it is worth noting that seasonal differences were observed between the studies. Despite the fact that some studies have observed a similar seasonal variation in high concentration levels of E. coli, which is associated with water temperature [47] and heavy rainfall during the wet season [48], other studies have not observed this phenomenon.

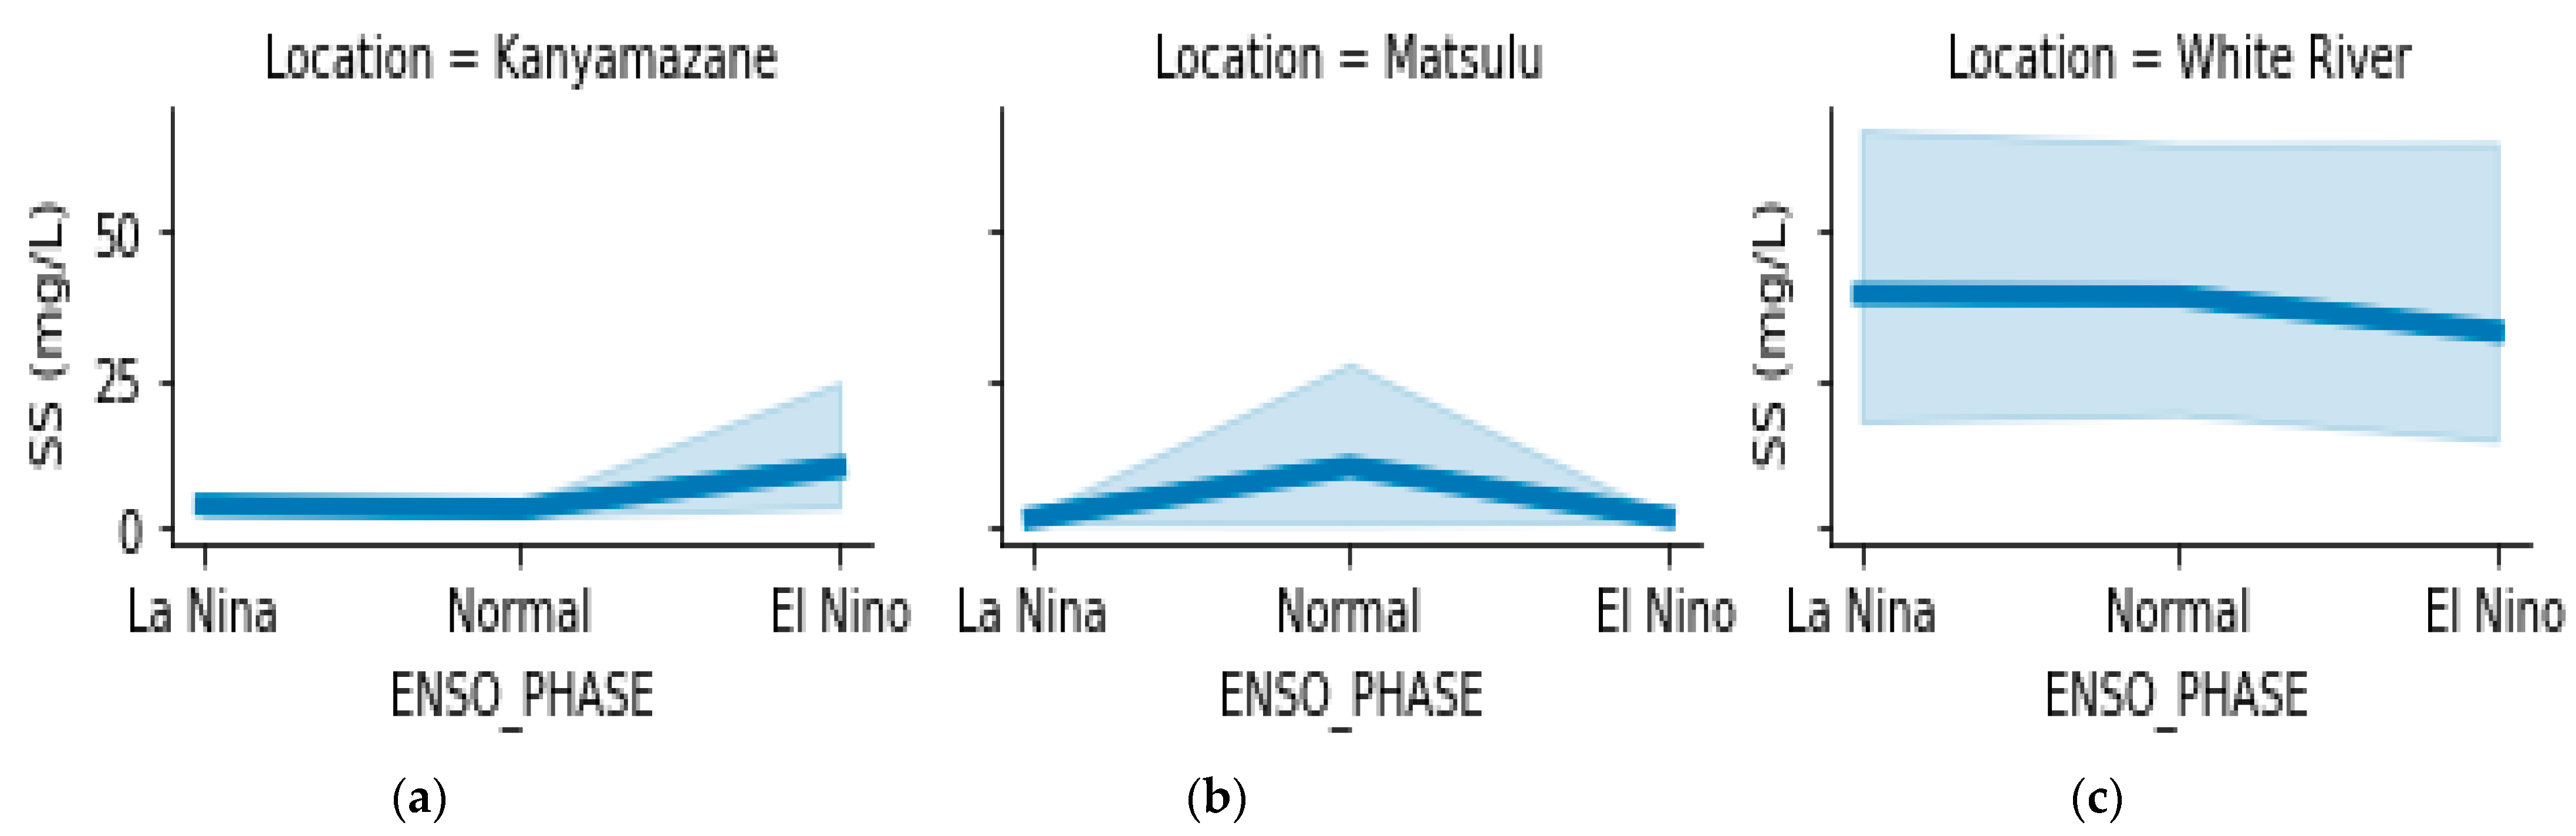
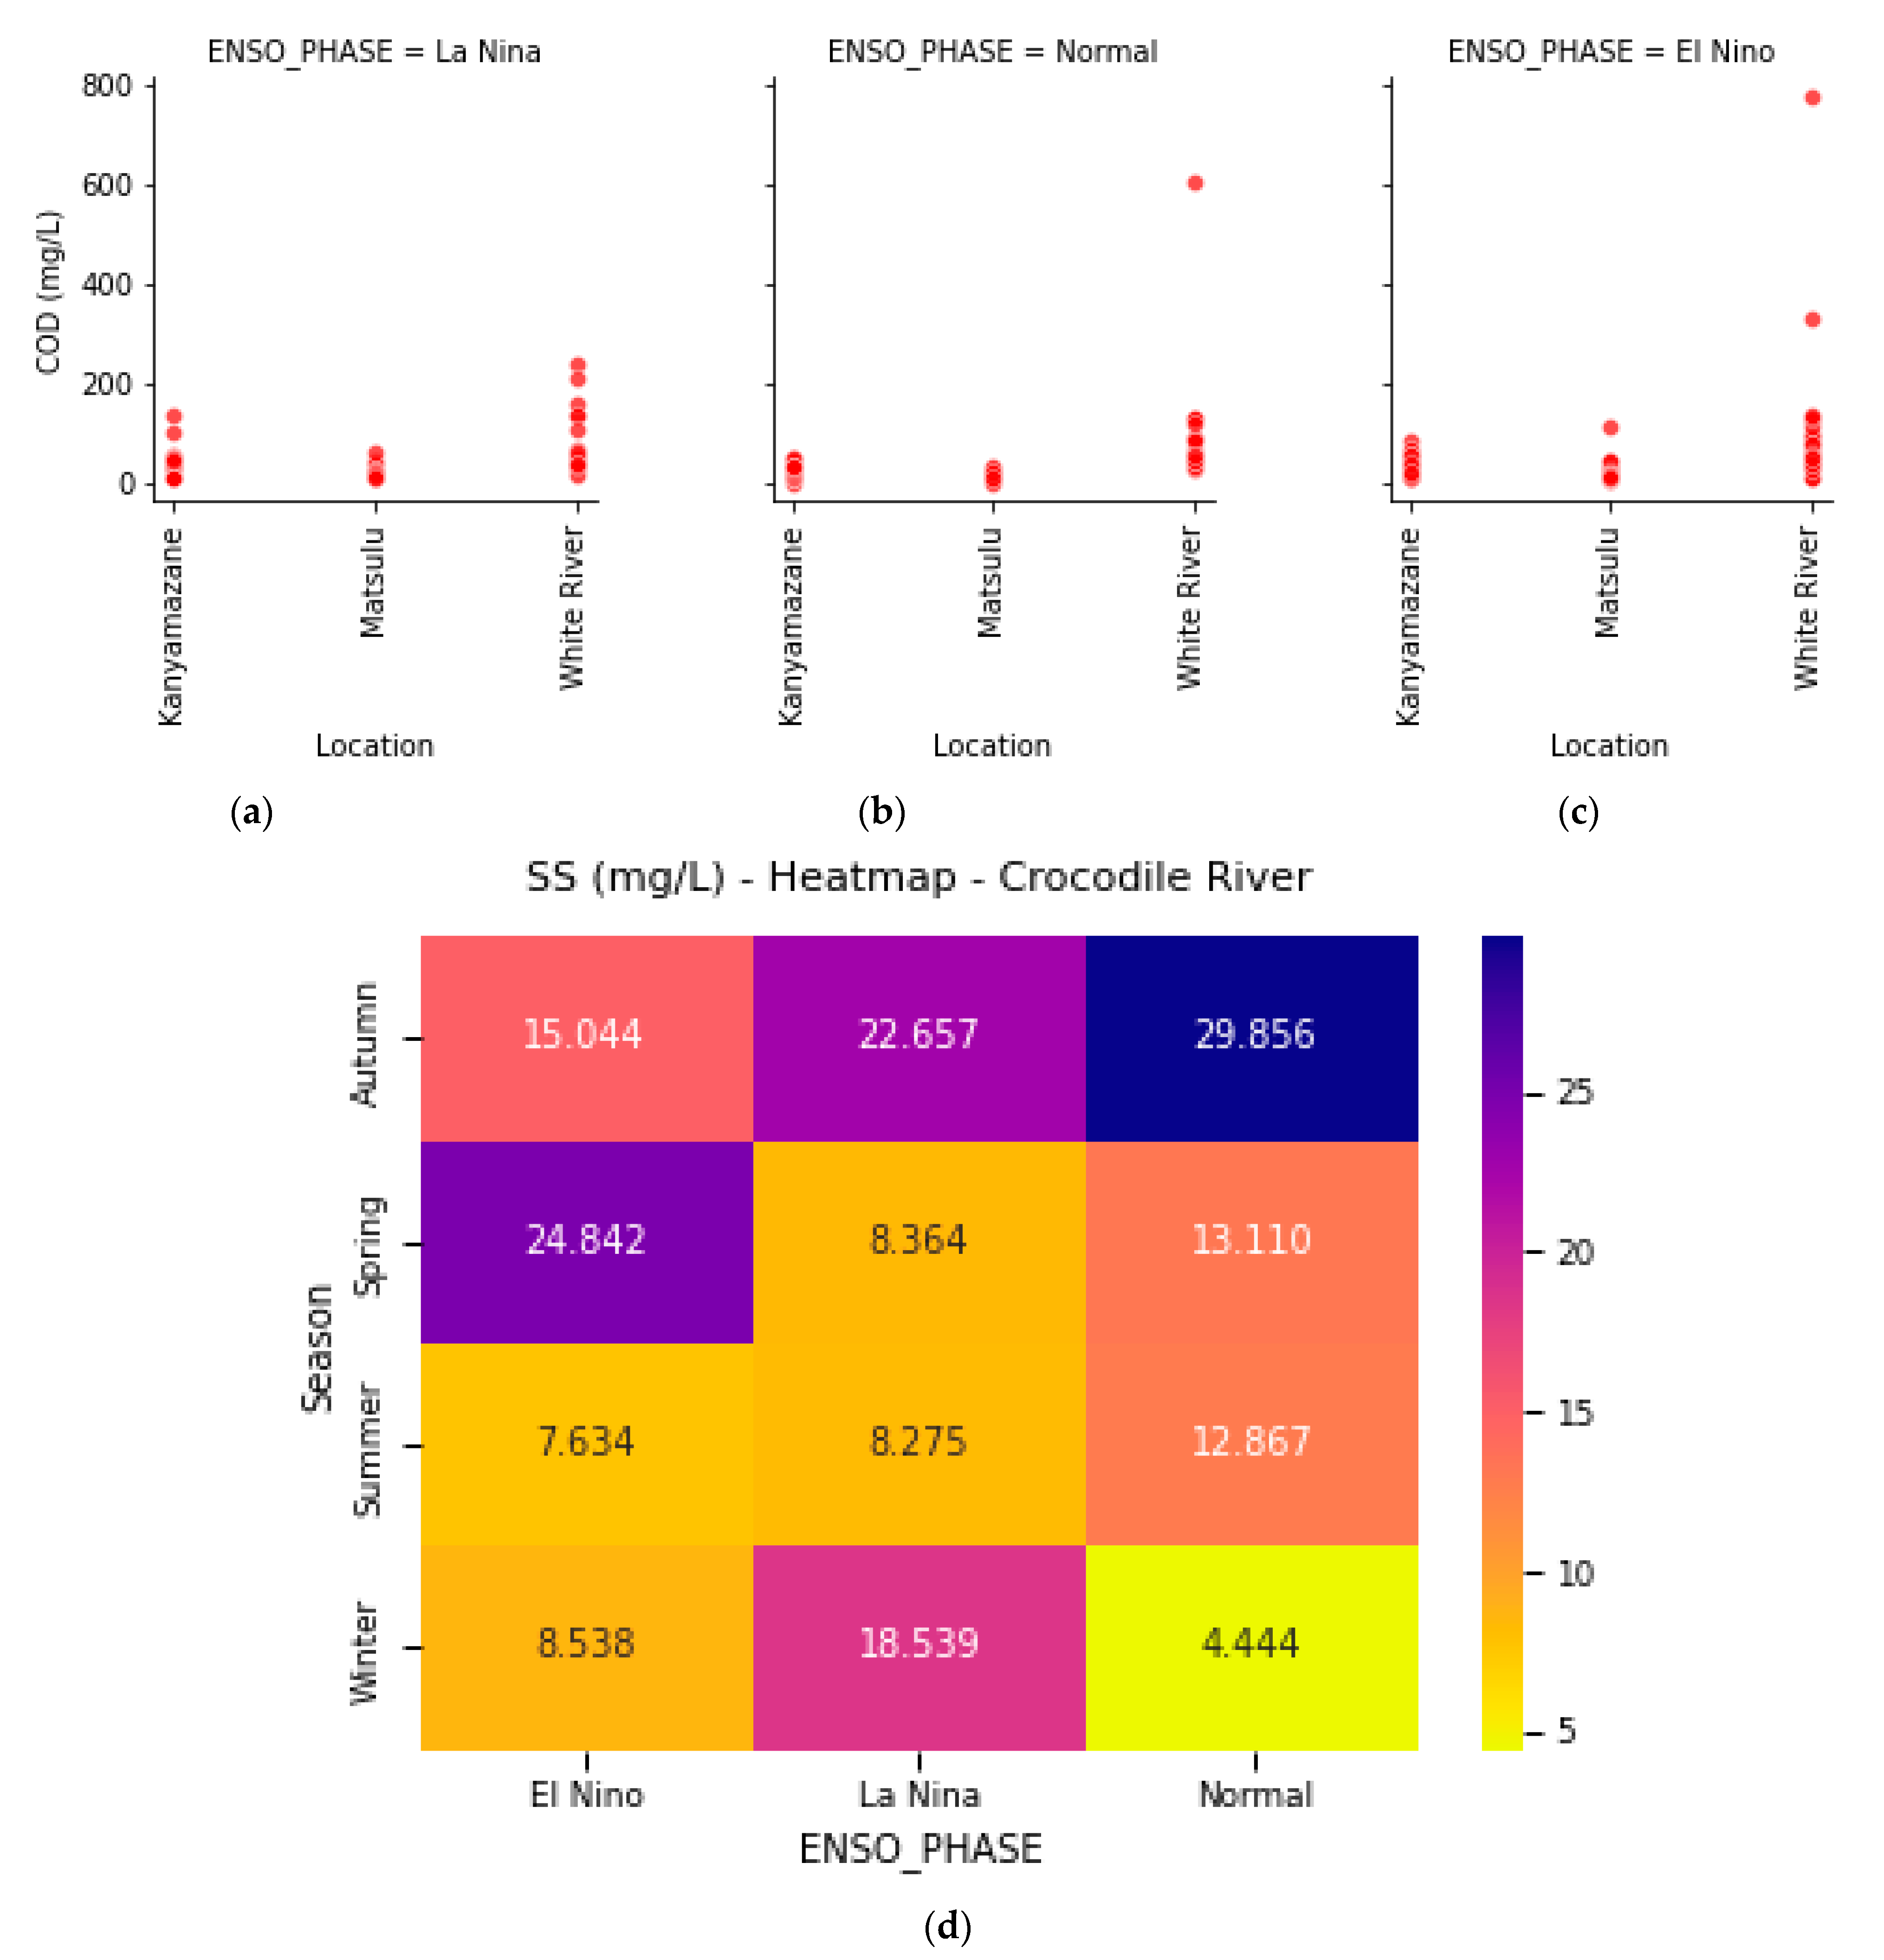
3.2. Suspended Solids from Sampling Sites during the Three ENSO Phases

Figure 4 displays the levels of Suspended Solids (SS) at each sampling site throughout the La Niña, normal, and El Niño seasons. The levels of SS at the Kanyamazane location were lower during the normal and La Niña periods, and they increased during the El Niño period. The Matsulu location showed a rise in SS during normal conditions and a decrease during El Niño and La Niña events. During La Niña, the White River had an increase in SS and a slight decrease during El Niño, even though it remained the highest in all the sampling sites. There were no variations between La Niña and the normal period at the White River site. The South African wastewater guidelines recommend that SS levels not exceed 25 mg/L. At the Kanyamazane site, the SS were highest during the El Niño period but were below the acceptable limit of 25 mg/L. Matsulu showed the highest SS during the normal period but below the limit of 25 mg/L. The White River had the highest SS (30–50 mg/L) during La Niña period, which was above the accepted 25 mg/L limit. However, the White River exceeded the limits in all ENSO phases.
The wet season was found to have greater suspended sediment parameters, and they were more dominant in the oxbow lake (Harun et al. 2014). The White River site displayed a similar reaction to the Lower Kinabatangan River catchment. The SS in this study were more dominant in the White River during the El Niño period. The rise of SS in the White River during the El Niño period may be attributed to surface runoff due to floods and the presence of clay, silt, sandy clay, and other particles or suspended material released as a result of structural damage caused by floods. In Florida, during El Niño or La Niña years, certain months can experience more precipitation than others, which would result in increased runoff and, in turn, increased SS load [49].
In another study, the Kampar River, which provides drinkable water to 92,850 people, was investigated for water quality variations in the wake of a significant El Niño warming event in 2016 that caused extremely dry weather in Malaysia [50]. With less precipitation, a few parameters were analyzed, including Total Suspended Solids (TSS). Data indicated that variations in TSS, turbidity, and ammoniacal nitrogen concentrations had been brought on by prolonged dry weather and intermittent pollution episodes. In April 2016, some sites in zones A and B in Malaysia showed an unusual decline in TSS levels [51]. It must be emphasized that this decline in TSS levels cannot be interpreted as an adverse reaction to low precipitation. On 24 April 2016, an atypical storm happened in Malaysia during the routine monthly water sampling process. The TSS measured in zones A (524 and 602 mg/L), B (125 and 130 mg/L), and C (135 and 136 mg/L) were abnormally high. This demonstrates how excessive sedimentation during periods of intense precipitation in a tropical climate can cause an alluvial river to become typically polluted. Similar anomalies were observed in this study as the highest levels of SS were recorded at the Kanyamazane site during El Niño when the weather was dry. However, the highest recording for SS was observed at the White River site during La Niña and this could be attributed to runoffs eroding sediments during heavy rains and polluting the river. The White River site exceeded the SS limit of 10 mg/L for effluent discharge quality. Suspended Solids data showed a high standard deviation in all the three periods. During El Niño it was 54.93, 39.66 during the normal period and 35.57 during La Niña. This indicates that values are generally far from the mean (see Appendix A).
The El Niño period showed a regression analysis where the SS is the independent variable. The regression analysis shows that the square of the correlation (R2) was 78%, which means that the 78% variation in SS can be explained. The p-value of rainfall was also at 0.7416, which is above 0.05 and therefore considered statistically insignificant. The La Niña period shows a regression analysis where the suspended solid is the independent variable. The results show that the square of the correlation (R2) was 71%, which means that the 71% variation in SS was explained by the regression. The p-value of rainfall was also at 0.6283, which is above 0.05 and therefore considered statistically insignificant.

3.3. COD Concentrations during the Three ENSO Phases

Chemical oxygen demand (COD) is commonly used to monitor the efficacy of water treatment plants and to evaluate the quality of water and wastewater. Figure 5a–c demonstrates that the COD concentration at the White River site was the highest across all three periods (La Niña, normal, and El Niño). This may be attributed to human and agricultural waste as the site is close to the White River wastewater treatment plant and agricultural fields. The highest COD concentration (800 mg/L) was recorded at the White River site during El Niño, followed by 600 mg/L during the normal period and 240 mg/L during the La Niña period. During La Niña, Kanyamazane recorded 180 mg/L in COD, and the Matsulu location recorded approximately 100 mg/L. Kanyamazane received 50 mg/L COD during the normal period, while Matsulu received 25 mg/L. The COD at the Matsulu site was lower than that of the Kanyamazane site for both periods. There have been fluctuations in COD levels at all sites. The lowest count was 0 mg/L and the highest was 180 mg/L at the White River site. During the La Niña, El Niño, and normal periods, the White River site had the highest COD levels that exceeded the 75 mg/L limit for effluent discharge quality.
The highest COD concentration was 134.000 mg/L in February during the normal period. The El Niño period showed the second-highest concentration in August at 106,583 mg/L. The lowest COD concentration was in January during the normal period at 20,222 mg/L. On average, the highest COD concentration was at 52,193 mg/L during the La Niña period, followed by a concentration of 46,423 mg/L during the normal period, and the smallest average concentration was recorded during the El Niño period at 44,566 mg/L. COD data showed a high standard deviation of 84.42 during El Niño period, 84.87 during the normal period and 77.40 during La Niña period. This indicates that values are generally far from the mean (see Appendix A). According to a study by Maphanga et al. [40], there is no spatial distribution of chemical oxygen demand in the Crocodile River, nor is there seasonal variation between sites. According to a study by Makuwa et al. [48] noted how COD may vary during the wet and dry seasons despite precipitation not predicting it. In contrast, Osuolale and Okoh [52] suggest that lower COD levels are primarily due to increased rainfall.
Although the highest single record of COD was in February during the normal period, the La Niña period’s average COD results of this study are similar to the results of a study by Harun et al. (2014) which was conducted between October 2004 and June 2005 during the mild La Niña event, where the surface water quality was studied to evaluate spatial and seasonal fluctuations in the Lower Kinabatangan River catchment, Sabah, Malaysia. Furthermore, Harun et al. (2014) found that the wet season recorded higher levels of COD. The COD was found to be dominant in the stream that is located in the oil palm plantation. Weak La Niña events in 2005 and 2006 may have had an impact on fluctuations in surface water quality, as evidenced by precipitation anomalies during the sampling campaign (Harun et al. 2014).
The El Niño period shows a regression analysis where chemical oxygen demand is the dependent variable. The analysis shows that the square of the correlation (R2) was 79%, which means that the 79% variation can be explained by the regression model. The p-value of rainfall was also at 0.5345, which is above 0.05 and is considered statistically insignificant. The La Niña period shows a regression analysis where the COD is the dependent variable. The results show that the square of the correlation (R2) was 90%, which means that the 90% variation is explained by the regression. The p-value of rainfall was also at 0.6998 and is considered statistically insignificant. Furthermore, Abagale [53] found that COD concentrations in wastewater varied considerably among the various treatment units, which contradicts the findings of this study since no real statistical significance was evident (p-value).

4. Conclusions

Extreme weather patterns produced by the La Niña and El Niño variability in the Mpumalanga province have impacted water quality in the Crocodile River. The main objective of this study was to investigate the impact of El Niño Southern Oscillation (ENSO) on the water quality in the Crocodile River in South Africa. In the Crocodile River, E. coli bacteria were used to measure changes in water quality. Results showed that these changes varied with ENSO phases. La Niña period had the highest E. coli count that was above the stipulated limit for irrigation and effluent discharge quality. Despite the fact that this study discovered that only 37% of the variation could be explained by the model, it was found that the model explains a poor amount of variation. At 0.0240, the p-value for precipitation was significant. Even the normal period had an R2 of 37% and a p-value of 0.0688, both of which are considered statistically insignificant. During the La Niña, El Niño, and normal periods, the irrigation and effluent discharge quality limits at the Kanyamazane, Matsulu, and White River sites were also exceeded.
The highest COD had been observed during the El Niño period at the White River Site, and they were also above the acceptable limit. The Suspended Solids were also highest in Summer during the El Niño period. The results have also shown that rainfall is an excellent predictor of E. coli during the three periods, El Niño, La Niña, and normal. These catastrophic events of El Niño and La Niña have worsened floods or droughts, and this has led to a negative impact on water quality due to the possibility of sewage contamination, industrial chemicals, and agricultural pesticide debris in floodwater. On the other hand, droughts may have resulted in decreased flow and reduced water levels during hydrological droughts, and this may impact water quality due to the lack of dilution.
Each ENSO event has been proven to be unique, making it impossible to forecast the repercussions of the occurrence of this weather phenomenon. To solve this issue, we recommend that new monitoring technology be implemented. The government should enforce compliance and establish legislative measures to combat water contamination throughout the country as pollution compromises the quality of water. Administrative, civil, and criminal enforcement actions should be taken for municipalities found to have broken water regulations in respect to WWTWs.

Limitation of the Study

In order to identify the main pollutant source in the Crocodile River, producers of industrial effluents and river quality should be continuously monitored. Optimization of the plant can be achieved even if the input varies over time. This, however, would necessitate the online solution to a dynamic (rather than static) optimization problem, a more challenging undertaking that could be the subject of future research. Project constraints for wastewater plant design (WWTP) include economics, accessibility, health and environment, wind direction, hydrogeological suitability, sufficient technical facilities, institutional setup, personnel capacity, and political commitment.

Author Contributions

Conceptualization, B.G. and T.M.; methodology, T.T.P.; software, S.L.; validation, K.M., B.G. and B.S.M.; formal analysis, T.T.P., B.G. and T.M.; investigation, K.M., T.T.P., T.M. and B.G.; resources, B.G., T.M., B.S.M. and T.T.P.; data curation, S.L. and K.M.; writing—original draft preparation, B.G.; writing—review and editing, T.M.,T.T.P., B.S.M., K.M. and S.L.; visualization, S.L. and T.M. All authors have read and agreed to the published version of the manuscript.

Funding

This research received no external funding, and The APC was funded by Cape Peninsula University of Technology (CPUT).

Institutional Review Board Statement

Not applicable.

Informed Consent Statement

Not applicable.

Data Availability Statement

The data presented in this study are available on request from the corresponding author.

Acknowledgments

The authors would like to thank the anonymous reviewers that gave constrictive feedback to the manuscript. We would also like to thank our families and respective institutions for their support.

Conflicts of Interest

The authors declare no conflict of interest.

Appendix A

Table A1. Descriptive statistics showing the averages of the parameters.
ALL Data
StatsE. coliCODSSRainfallSOI_Values
Ave59.3750.0515.811.750.34
min5.800.290.260.00−3.60
Max120.50776.00517.0023.903.20
Stdv13.2477.4046.892.511.27
Var175.255991.472198.856.311.62
Mode58.0012.000.400.00−0.10
skew−0.426.517.464.30−0.45
Kurt4.7852.5070.0331.350.95
Q152.9017.001.600.15−0.40
Q260.1033.003.200.910.40
Q165.6052.0012.802.641.10

References

  1. McPhaden, M.J. Playing hide and seek with El Niño. Nat. Clim. Chang. 2015, 5, 791–795. [Google Scholar] [CrossRef]
  2. Ryberg, K.R.; Chanat, J.G. Climate extremes as drivers of surface-water-quality trends in the United States. Sci. Total Environ. 2022, 809, 152165. [Google Scholar]
  3. Nangombe, S.; Zhou, T.; Zhang, W.; Wu, B.; Hu, S.; Zou, L.; Li, D. Record-breaking climate extremes in Africa under stabilized 1.5 °C and 2 °C global warming scenarios. Nat. Clim. Chang. 2018, 8, 375–380. [Google Scholar]
  4. Pouris, A. Water research and collaboration in the Southern African Development Community. Water SA 2018, 44, 358–364. [Google Scholar] [CrossRef] [Green Version]
  5. Chen, P.; Li, W.; He, K. Impacts of different types of El Niño events on water quality over the Corn Belt, United States. Hydrol. Earth Syst. Sci. 2022, 26, 4875–4892. [Google Scholar] [CrossRef]
  6. Cuthbert, M.O.; Acworth, R.I.; Andersen, M.S.; Larsen, J.R.; McCallum, A.M.; Rau, G.C.; Tellam, J.H. Understanding and quantifying focused, indirect groundwater recharge from ephemeral streams using water table fluctuations. Water Resour. Res. 2016, 52, 827–840. [Google Scholar] [CrossRef] [Green Version]
  7. Manatsa, D.; Mushore, T.; Lenouo, A. Improved predictability of droughts over southern Africa using the standardized precipitation evapotranspiration index and ENSO. Theor. Appl. Climatol. 2017, 127, 259–274. [Google Scholar]
  8. Mulenga, H.M.; Rouault, M.; Reason, C.J.C. Dry summers over northeastern South Africa and associated circulation anomalies. Clim. Res. 2003, 25, 29–41. [Google Scholar] [CrossRef]
  9. Jasechko, S.; Taylor, R.G. Intensive rainfall recharges tropical groundwaters. Environ. Res. Lett. 2015, 10, 124015. [Google Scholar] [CrossRef] [Green Version]
  10. Dettinger, M.D.; Cayan, D.R.; McCabe, G.J. Multiscale streamflow variability associated with El Niño/Southern Oscillation. In El Niño and the Southern Oscillation-Multiscale Variability and Global and Regional Impacts; Diaz, H.F., Markgraf, V., Eds.; Cambridge University Press: Cambridge, UK, 2000; pp. 113–147. [Google Scholar]
  11. Dettinger, M.D.; Battisti, D.S.; Garreaud, R.D.; McCabe, G.J.; Bitz, C.M. Interhemispheric effects of interannual and decadal ENSO-like climate variations on the Americas. In Interhemispheric Climate Linkages; Markgraf, V., Ed.; Academic Press: San Diego, CA, USA, 2001; pp. 1–16. [Google Scholar]
  12. Bradshaw, C.D.; Pope, E.; Kay, G.; Davie, J.C.; Cottrell, A.; Bacon, J.; Cosse, A.; Dunstone, N.; Jennings, S.; Challinor, A.; et al. Unprecedented climate extremes in South Africa and implications for maize production. Environ. Res. Lett. 2022, 17, 084028. [Google Scholar] [CrossRef]
  13. Peña-Guerrero, M.D.; Nauditt, A.; Muñoz-Robles, C.; Ribbe, L.; Meza, F. Drought impacts on water quality and potential implications for agricultural production in the Maipo River Basin, Central Chile. Hydrol. Sci. J. 2020, 65, 1005–1021. [Google Scholar] [CrossRef] [Green Version]
  14. Patil, R.; Wei, Y.; Pullar, D.; Shulmeister, J. Effects of change in streamflow patterns on water quality. J. Environ. Manag. 2022, 302, 113991. [Google Scholar] [CrossRef]
  15. Chatterjee, S.; More, M. Cyanobacterial Harmful Algal Bloom Toxin Microcystin and Increased Vibrio Occurrence as Climate-Change-Induced Biological Co-Stressors: Exposure and Disease Outcomes via Their Interaction with Gut–Liver–Brain Axis. Toxins 2023, 15, 289. [Google Scholar]
  16. Koushali, P.H.; Mastouri, R.; Khaledian, M.R. Impact of Precipitation and Flow Rate Changes on the Water Quality of a Coastal River; Hindawi (Shock and Vibration): London, UK, 2021; pp. 1–13. [Google Scholar]
  17. Gleick, P.H.; Cooley, H.; Morikawa, M.; Morrison, J.; Cohen, M.J. The World’s Water 2008–2009: The Biennial Report on Freshwater Resources; Island Press: Washington, DC, USA, 2009; Volume 36, p. 171. [Google Scholar]
  18. Marce, R.; Rodriguez-Arias, M.A.; García, J.C.; Armengol, J. El Niño Southern Oscillation and climate trends impact reservoir water quality. Glob. Chang. Biol. 2010, 16, 2857–2865. [Google Scholar] [CrossRef]
  19. Carpenter, S.R.; Stanley, E.H.; Vander Zanden, M.J. State of the world’s freshwater ecosystems: Physical, chemical, and biological changes. Annu. Rev. Environ. 2011, 36, 75–99. [Google Scholar] [CrossRef] [Green Version]
  20. Jankowski, J. Changes of water quality in a stream impacted by longwall mining subsidence. In Mine Subsidence 2007, Proceedings of the Seventh Triennial Conference on Mine Subsidence, Wollongong, Australia, 26–27 November 2007; Mine Subsidence Technological Society: Sydney, Australia, 2007; pp. 241–251. [Google Scholar]
  21. O’Reilly, A.; Coffey, R.; Gowen, A.; Cummins, E. Evaluation of near-infrared chemical imaging for the prediction of surface water quality parameters. Int. J. Environ. Anal. Chem. 2015, 95, 403–418. [Google Scholar] [CrossRef]
  22. Hampton, T.B.; Lin, S.; Basu, N.B. Forest fire effects on stream water quality at continental scales: A meta-analysis. Environ. Res. Lett. 2022, 17, 064003. [Google Scholar] [CrossRef]
  23. Magnuson, J.J.; Webster, K.E.; Assel, R.A.; Bowser, C.J.; Dillon, P.J.; Eaton, J.G.; Evans, H.E.; Fee, E.J.; Hall, R.I.; Mortsch, L.R.; et al. Potential effects of climate changes on aquatic systems: Laurentian Great Lakes and Precambrian Shield Region. Hydrol. Process. 1997, 11, 825–871. [Google Scholar]
  24. Winder, M.; Schindler, D.E. Climate change uncouples trophic interactions in an aquatic ecosystem. Ecology 2004, 85, 2100–2106. [Google Scholar] [CrossRef]
  25. Whitehead, P.G.; Wilby, R.L.; Battarbee, R.W.; Kernan, M.; Wade, A.J. A review of the potential impacts of climate change on surface water quality. Hydrol. Sci. J. 2009, 54, 101–123. [Google Scholar]
  26. Iqbal, M.S.; Islam, M.M.M.; Hofstra, N. The impact of socio-economic development and climate change on E. coli loads and concentrations in Kabul River, Pakistan. Sci. Total Environ. 2019, 650, 1935–1943. [Google Scholar] [CrossRef]
  27. Verburg, P.; Hecky, R.E.; Kling, H. Ecological consequences of a century of warming in Lake Tanganyika. Science 2003, 301, 505–507. [Google Scholar] [CrossRef] [Green Version]
  28. Torres, A.; Bertrand-Krajewski, J.-L. Evaluation of uncertainties in settling velocities of particles in urban stormwater runoff. Water Sci. Technol. 2008, 57, 1389–1396. [Google Scholar] [CrossRef] [Green Version]
  29. Hoshiba, Y.; Hasumi, H.; Itoh, S.; Matsumura, Y.; Nakada, S. Biogeochemical impacts of flooding discharge with high suspended sediment on coastal seas: A modeling study for a microtidal open bay. Sci. Rep. 2021, 11, 21322. [Google Scholar] [CrossRef]
  30. Li, D.; Liu, J. Water Quality Detection for Lakes. In Water Quality Monitoring and Management; Li, D., Liu, S., Eds.; Academic Press: Cambridge, UK, 2019; pp. 221–231. [Google Scholar]
  31. Islam, M.M.M.; Shafi, S.; Bandh, S.A.; Shameem, N. Chapter 3—Impact of environmental changes and human activities on bacterial diversity of lakes. In Freshwater Microbiology: Perspectives of Bacterial Dynamics in Lake Ecosystems; Academic Press: London, UK, 2019; pp. 105–136. [Google Scholar]
  32. Edokpayi, J.N.; Odiyo, J.O.; Durowoju, O.S. Impact of Wastewater on Surface Water Quality in Developing Countries: A Case Study of South Africa. In Water Quality; Tutu, H., Ed.; IntechOpen Limited: London, UK, 2017; pp. 401–416. [Google Scholar]
  33. US Environmental Protection Agency. Wastewater Sampling. Available online: https://www.epa.gov/sites/default/files/2015-06/documents/Wastewater-Sampling.pdf (accessed on 25 April 2022).
  34. Jeong, H.I.; Ahn, J.B. A new method to classify ENSO events into eastern and central Pacific types. Int. J. Climatol. 2017, 37, 2193–2199. [Google Scholar] [CrossRef]
  35. Erasmi, S.; Propastin, P.; Kappas, M.; Panferov, O. Spatial patterns of NDVI variation over Indonesia and their relationship to ENSO warm events during the period 1982–2006. JCLI 2009, 22, 6612–6623. [Google Scholar] [CrossRef]
  36. Null, J. El Nino and La Nina Years and Intensities Based on Oceanic Nino index (ONI); Golden Gate Water Services. 2023. Available online: https://ggweather.com/enso/oni.htm (accessed on 2 July 2023).
  37. Department of Water and Sanitation. Level Review of Water Quality in South Africa; Department of Water and Sanitation: Pretoria, South Africa, 2013. Available online: https://www.dws.gov.za/iwrp/iwqms/Documents/Report%201.1_Inception%20Report.pdf (accessed on 5 May 2022).
  38. Alberto, W.D.; Del Pilar, D.M.; Valeria, A.M.; Fabiana, P.S.; Cecilia, H.A.; De Los Ángeles, B.M. Pattern recognition techniques for the evaluation of spatial and temporal variations in water quality. A case study: Suquía River Basin (Córdoba—Argentina). Water Res. 2001, 35, 2881–2894. [Google Scholar] [CrossRef]
  39. Singh, K.P.; Malik, A.; Mohan, D.; Sinha, S. Multivariate statistical techniques for the evaluation of spatial and temporal variations in water quality of Gomti River (India)—A case study. Water Res. 2004, 38, 3980–3992. [Google Scholar] [CrossRef]
  40. Maphanga, T.; Madonsela, B.S.; Chidi, B.S.; Shale, K.; Munjonji, L.; Lekata, S. The Effect of Rainfall on Escherichia coli and Chemical Oxygen Demand in the Effluent Discharge from the Crocodile River Wastewater Treatment; South Africa. Water 2022 14, 2802. [CrossRef]
  41. Abia, A.L.; Ubomba-Jaswa, E.; Momba, M.N. Impact of seasonal variation on Escherichia coli concentrations in the riverbed sediments in the Apies River, South Africa. Sci. Total Environ. 2015, 537, 462–469. [Google Scholar] [CrossRef]
  42. Castro Fernández, M.F.; Cárdenas Manosalva, I.R.; Colmenares Quintero, R.F.; Montenegro Marín, C.E.; Diaz Cuesta, Y.E.; Escobar Mahecha, D.; Pérez Vásquez, P.A. Multitemporal Total Coliforms and Escherichia coli Analysis in the Middle Bogotá River Basin, 2007–2019. Sustainability 2022, 14, 1769. [Google Scholar] [CrossRef]
  43. Castillo, Y.M.B.; Fontalvo, J.A.L.; Borja, I.M.R. Bacteriological quality of the water of the manaure and casacara rivers, department of Cesar, Colombia. Rev. Luna Azul 2018, 46, 106–124. [Google Scholar]
  44. Alexander, K.A.; Heaney, A.K.; Shaman, J. Hydrometeorology and flood pulse dynamics drive diarrheal disease outbreaks and increase vulnerability to climate change in surface-water-dependent populations: A retrospective analysis. PLoS Med. 2018, 15, e1002688. [Google Scholar] [CrossRef] [PubMed] [Green Version]
  45. Edokpayi, J.N.; Odiyo, J.O.; Popoola, E.O.; Msagati, T.A.M. Evaluation of Microbiological and Physicochemical Parameters of Alternative Source of Drinking Water: A Case Study of Nzhelele River, South Africa. Open Microbiol. J. 2018, 12, 18–27. [Google Scholar] [CrossRef] [PubMed] [Green Version]
  46. Soueidan, J.; Warren, A.; Pearson, M.; Montie, E.W. A changing estuary: Understanding historical patterns in salinity and fecal coliform levels in the May River, SC. Mar. Pollut. Bulletin. 2021, 168, 112384. [Google Scholar] [CrossRef]
  47. Dehghani, M.; Sorooshian, A.; Ghorbani, M.; Fazlzadeh, M.; Miri, M.; Badiee, P.; Parvizi, A.; Ansari, M.; Baghani, A.N.; Delikhoon, M. Seasonal variation in culturable bioaerosols in a wastewater treatment plant. Aerosol. Air Qual. Res. 2018, 18, 2826. [Google Scholar] [CrossRef] [Green Version]
  48. Makuwa, S.; Tlou, M.; Fosso-Kankeu, E.; Green, E. The effects of dry versus wet season on the performance of a wastewater treatment plant in North West Province, South Africa. Water SA 2022, 48, 40–49. [Google Scholar] [CrossRef]
  49. Keener, V.W.; Ingram, K.T.; Jacobson, B.; Jones, J.W. Effects of El Niño/Southern Oscillation on simulated phosphorus loading in south Florida. Trans. ASABE 2007, 50, 2081–2089. [Google Scholar] [CrossRef]
  50. Harun, S.; Dambul, R.; Abdullah, M.H.; Mohamed, M. Spatial and seasonal variations in surface water quality of the Lower Kinabatangan River Catchment, Sabah, Malaysia. J. Trop. Biol. Conserv. JTBC 2014, 11. [Google Scholar]
  51. Xiang, R.; Wang, L.; Li, H.; Tian, Z.; Zheng, B. Temporal and spatial variation in water quality in the Three Gorges Reservoir from 1998 to 2018. Sci. Total Environ. 2021, 768, 144866. [Google Scholar] [CrossRef]
  52. Osuolale, O.; Okoh, A. Assessment of the physicochemical qualities and prevalence of Escherichia coli and vibrios in the final effluents of two wastewater treatment plants in South Africa: Ecological and public health implications. Int. J. Environ. Res. Public Health 2015, 12, 13399–13412. [Google Scholar] [CrossRef] [PubMed] [Green Version]
  53. Abagale, F.K. Seasonal Variation and Removal of Organic Pollutants in Wastewater Using Low-Cost Treatment Technologies in Tamale Metropolis, Ghana. J. Water Resour. Prot. 2021, 13, 271–282. [Google Scholar] [CrossRef]
Figure 1. The study area map of the Crocodile River with sampling sites.
Sustainability 15 11125 g001
Figure 2. E. coli annual concentrations (af). E. coli concentration from each sampling site (gi). E. coli heat maps (jk).
Sustainability 15 11125 g002
Figure 3. E. coli seasonal concentrations with the influence of rainfall (ac).
Sustainability 15 11125 g003
Figure 4. Suspended solids during ENSO phase at different sites (ac).
Sustainability 15 11125 g004
Figure 5. COD per location/sampling site (ac). COD Heat map in Months (d).
Sustainability 15 11125 g005
Table 1. Effluent Discharge Quality limits in the three studied sites as per WWTP Water Use License.
E. coli (Count Per 100 mL) SS (mg/dL)Chemical Oxygen Demand (COD) (mg/L)Class Discharge Volume (Ml/Day)
Matsulu WWTP02575B3.5
Kanyamazane WWTP02575D9.1
White River WWTP02575C4.1
Table 2. E. coli El-Niño period regression.
Regression Statistics
Multiple R0.3802
R Square0.1446
Adjusted R Square0.0677
Standard Error15.8758
Observations98
ANOVA
DfSSMSFSignificance F
Regression83790.5541473.81931.87990.0730
Residual8922431.5705252.0401
Total9726222.1246
CoeffStandard
Error
t Statp-valueLower 95%Upper 95%
Intercept40.150416.12842.48940.01478.103872.1971
SS0.00790.06270.12550.9004−0.11670.1325
COD−0.00890.0424−0.21050.8337−0.09320.0754
NH3-N0.70030.28172.48630.01480.14071.2600
Rainfall−1.34860.5342−2.52450.0134−2.4101−0.2872
SOI Values4.19012.38141.75950.0819−0.54188.9219
Table 3. E. coli La-Niña period regression.
Regression Statistics
Multiple R0.6302
R Square0.3972
Adjusted R Square0.2735
Standard Error8.2543
Observations48
ANOVA
DfSSMSFSignificance F
Regression81750.6990218.83743.21190.0067
Residual392657.228968.1341
Total474407.9279
CoefficientsStandard
Error
t Statp-valueLower
95%
Upper 95%
Intercept−1.608530.0460−0.05350.9576−62.382359.1653
SS−0.06240.0622−1.00190.3226−0.18820.0635
COD−0.05760.0537−1.07190.2904−0.16630.0511
NH3-N0.71630.26792.67420.01090.17451.2581
Rainfall−2.36671.0078−2.34840.0240−4.4051−0.3283
SOI Values−0.48721.3455−0.36210.7192−3.20872.2343
Disclaimer/Publisher’s Note: The statements, opinions and data contained in all publications are solely those of the individual author(s) and contributor(s) and not of MDPI and/or the editor(s). MDPI and/or the editor(s) disclaim responsibility for any injury to people or property resulting from any ideas, methods, instructions or products referred to in the content.

