Article

Research on the Impact of Global Economic Policy Uncertainty on Manufacturing: Evidence from China, the United States, and the European Union

1
Business School, Zhengzhou University, Zhengzhou 450001, China
2
School of Economics and Management, Beijing Forestry University, Beijing 100083, China
*
Author to whom correspondence should be addressed.
Sustainability 2023, 15(14), 11217; https://doi.org/10.3390/su151411217
Submission received: 17 May 2023 / Revised: 11 July 2023 / Accepted: 17 July 2023 / Published: 18 July 2023

Abstract

:
Events such as COVID-19 and the Russia–Ukraine conflict have significantly increased the uncertainty and volatility of global economic policies. In the context of economic globalization, the key question we investigate is whether global economic policy uncertainty will have different impacts on the manufacturing of the three major economies in China, the United States, and Europe Union. This study employs the time-varying parameter vector autoregressive (TVP-VAR) model to examine how global economic policy uncertainty (GEPU) affected manufacturing from March 2008 to March 2023. The empirical results show that the effects of GEPU are time varying; its short-term effects on Chinese manufacturing are slightly greater than its medium- and long-term effects, whereas its medium- and long-term effects on manufacturing in the United States (US) and European Union (EU) are significantly greater than its short-term effects. The impact of European debt crisis, the China–US trade war and Russia–Ukraine conflict on EU manufacturing is higher than that of China and the US, and the impact of the COVID-19 pandemic on China’s manufacturing is much smaller than that of the US and the EU; thus, Chinese manufacturing has a greater capacity for risk mitigation than US and EU manufacturing. This study not only provides a new perspective on the study of global economic policy uncertainty; it also provides new empirical evidence on how global economic policy uncertainty affects the manufacturing sector in China, the US and Europe and provides policymakers with guidance for decision making.

1. Introduction

The manufacturing industry is an important component of the national economy [1,2]. As one of the important engines of economic growth [3,4,5], the manufacturing sector is indispensable in increasing employment, advancing technology, and boosting exports [1,6]. Researchers typically use the manufacturing purchasing manager’s index (PMI) to measure and forecast the trend of manufacturing [7,8,9,10]. The manufacturing PMI originated in the United States. This index, which is one of the most widely used in the world to track macroeconomic trends, is compiled from the results of a monthly survey of corporate purchasing managers; it is calculated using data from the manufacturing sector’s new orders, inventory, production, supplier delivery, and employment domains; it offers effective warning and prediction capabilities [11], and it is also considered the “leading indicator of overall economic activity in the US ” (Purchasing Managers’ Index (PMI) Defined and How It Works (investopedia.com)). The manufacturing boom line, which indicates the strength of the manufacturing industry, is often regarded by researchers as the manufacturing PMI of 50: when the PMI is higher than 50, the manufacturing sector of the economy is experiencing prosperity; when the PMI is lower than 50, the manufacturing sector is experiencing a recession. As a result, market economy players can use the manufacturing PMI as a useful decision-making tool [12,13].
The outlook toward the world economy is gloomy (World Economic Outlook Update, July 2022: Gloomy and More Uncertain (imf.org)); global economic policy uncertainty is rising while the manufacturing purchasing manager’s index is declining. Global economic policy uncertainty (GEPU) evolves from economic policy uncertainty (EPU), and economic policy uncertainty (EPU) refers to the fact that in the process of economic policy adjustment, the primary body involved in economic production cannot predict changes in economic policy, thereby leading to a series of unpredictable economic risks [14]. The formulation of economic policy uncertainty (EPU) is based on the coverage frequency method of mainstream newspapers, which calculates the number of news-related to keywords such as economy, policy, and uncertainty in mainstream newspapers with high circulation. It is composed of three weighted indices: news index, tax law invalidation index, and economic forecast difference index [14,15]. The modification of economic policies, such as monetary, fiscal, and national security policies, has a significant impact on the development of EPU [14]. Following Baker [14], Davis [16] weighted the national EPU indices of 21 major industrial countries according to the proportion of each country’s gross domestic product (GDP) and then developed the global economic policy uncertainty (GEPU) method. According to Davis [16], the specific calculation steps of GEPU are as follows: first, renormalize each national EPU index to a mean of 100 from 1997 (or first year) to 2015; second, impute missing values for certain countries using a regression-based method; this step yields a balanced panel of monthly EPU index values for 21 countries from January 1997 onwards; third, compute the GEPU Index value for each month as the GDP-weighted average of the 21 national EPU index values, using GDP data from the IMF’s World Economic Outlook Database. Global economic recovery has been hampered by the US financial crisis, the European debt crisis, the China–US trade war, COVID-19, the Russia–Ukraine conflict, and numerous other uncertainties (Multiple crises unleash one of the lowest global economic outputs in recent decades, says UN report|UNCTAD) [17,18,19]. Unexpected events led to a rapid rise in global economic policy uncertainty, while the manufacturing purchasing manager’s index has dropped sharply. For instance, from March 2018 to June 2019, the China–US trade war led to an increase in GEPU from 162.22 to 335.35, an increase of 2.07 times; meanwhile, China’s manufacturing PMI dropped from 51.5 to 49.4, a drop of 4.82%; while the US manufacturing PMI dropped from 59.3 to 51.7, a drop of 12.82%; and the EU manufacturing PMI dropped from 56.6 to 47.6, a drop of 15.9%. Based on this, it is worth studying the impact of GEPU on the manufacturing sectors of major economies.
China, the US, and the EU are the drivers of world manufacturing. According to the data from the World Bank (WB) Manufacturing, value added (current US$)—China, United States, European Union|Data (worldbank.org) (accessed on 18 July 2023 (worldbank.org)), in 2021, the GDP in China, the US, and the EU was 17.73 trillion dollars, 23.32 trillion dollars, and 17.09 trillion dollars, respectively, and the world GDP was 96.53 trillion dollars. The three economies account for 60.23% of world GDP; the manufacturing value added in China, the US, and the EU was 4.87 trillion dollars, 2.50 trillion dollars, and 2.53 trillion dollars, respectively, and the world manufacturing value added was 16.05 trillion dollars. The three economies account for 61.68% of the value added of world manufacturing. The ratio of manufacturing value added to GDP can be used to assess the contribution of manufacturing in the national economy [6,20]. The proportion of manufacturing value added to GDP in these three countries is 27.47%, 10.72%, and 14.80%, respectively, and as it is a single economy with the relatively high proportion of manufacturing value added in GDP, manufacturing’s vigorous development depends on a stable political and economic environment. China is transitioning from low-end to mid-to-high-end manufacturing [21,22], especially in the green energy such as photovoltaics, lithium batteries, wind energy, and electric vehicle manufacturing sectors [23,24,25]. The US and the EU have a comparative advantage in the field of high value-added manufacturing such as those concerning automobiles, electrical and optical equipment, semiconductors, and materials [26,27,28]. Although China, the US, and the EU are the world’s three main pillars, its manufacturing industry still struggles with a number of issues brought on by GEPU in the context of the decoupling of China and the US, the COVID-19 pandemic, and Russia–Ukraine conflict. Since 2018, manufacturing in China has suffered from the outflow of low-end manufacturing and slowing economic growth rate (Challenges and countermeasures facing the high-quality development of China’s manufacturing-NDRC); manufacturing in the US is subject to labor shortages and high inflation (Tackling the manufacturing hiring crisis|The Daily Reporter—WI Construction News & Bids); and manufacturing in the EU has endured a doubling of energy prices (Energy Crisis Poses Existential Threat to Europe’s Industry|OilPrice.com). Furthermore, the increase in GEPU led to severe fluctuations in the manufacturing PMI of major global economies, casting a shadow over the global economic recovery (World Economic Outlook Update, July 2022: Gloomy and More Uncertain (imf.org)).
Few studies have examined the link between global economic policy uncertainty and manufacturing, nor have they examined the similarities and differences of the problems in manufacturing in different economies brought on by GEPU within the same dimension. For instance, Fasanya [29] used TVP-VAR to analyze the volatility spillover effect relationship between GEPU and Asian industrial stocks, but this research still focuses on financial market stock price fluctuations and excludes the involvement of the manufacturing sector. Masona [30] used the least squares method to analyze the impact of GEPU on enterprise R&D investment and found that the negative impact of GEPU on manufacturing R&D investment is higher than that of the service sector. A few academics have talked about using PMI to track GDP [7], or thought China’s manufacturing PMI to be ahead of the US and the EU’s [8], or have shown interested in the correlation between manufacturing PMI and macroeconomic indicators such as CPI and PPI [9]. Although the above studies are all related to GEPU or PMI, they have not empirically analyzed the direct impact of GEPU on manufacturing PMI, nor have they demonstrated manufacturing’s risk resilience. As a result, in order to address the aforementioned problems, our research’s goals and contributions are primarily reflected in the following areas follows: first, we shift our research focus from the impact of GEPU from finance to manufacturing and use the TVP-VAR model to empirically analyze the uncertainty in manufacturing caused by global economic policy; second, because China, the US, and the EU produce 61.68% of the value added in manufacturing globally, it is necessary to compare the direction and degree of GEPU’s effects on these three economies; third, examining how GEPU impacts manufacturing in China, the US, and the EU would enable us to confirm the anti-risk capacities of the sector across many economies, as well as to provide a reference point for capital transfers in the manufacturing sector and the development of industry support policies.

2. Literature Review and Hypothesis

2.1. Literature Review

The existing research on economic policy uncertainty (EPU) is primarily concentrated on the fields of financial market volatility and economic growth [31,32,33,34,35,36,37,38,39]. It should be clarified that EPU exhibits countercyclicality, and its impact effect increases with the expansion of economic output scale; the degree of positive and negative impact on actual economic output varies by country [31]. Concerning the relationship between economic policy uncertainty and US stock returns, Arouri [32] claimed that it is nonlinear, with a decrease in stock returns leading to an increase in EPU. EPU not only lowers stock returns but also exacerbates volatility in exchange rates. For instance, Nilavongse [33] utilized a structural vector autoregressive model to claim that fluctuations in the pound exchange rate are mostly caused by changes in UK economic policies, but uncertainty in US economic policies causes a drop in industrial production capacity in the UK, and the UK’s Brexit vote caused the pound to decline significantly. Chen [34] employed quantile regression to discover that the influence of China’s EPU on its exchange rate fluctuations is asymmetric and heterogeneous, and that the impact of the US EPU on China’s exchange rate fluctuations rises with the quantile, while Hong Kong EPU has no effect on China’s exchange rate fluctuations, Japan and the EU EPU have an inverted U-shaped relationship with China’s exchange rate changes. Bank lending gives the economy a boost, while high EPU discourages investors from making credit investments. Nguyen [35], who used the generalized least squares method to evaluate the data, claims that there is a negative correlation between bank lending and EPU, with the latter having a larger negative influence on industrialized nations than emerging ones. Phan [36], who studied EPU and financial stability data from 23 countries worldwide from 1996 to 2016, does not appear to share Nguyen’s [35] point of view; Phan [36] discovered that EPU has a greater detrimental effect on financial stability for nations with smaller financial systems, lax regulation, and high levels of competition. It is clear from the foregoing that significant changes in EPU have a negative impact on economic growth, investment, and consumption; high uncertainty causes investment to decline more than output or consumption does [37]. However, tools like Bitcoin can be used to hedge EPU risks. Demir [38] discovered that EPU can forecast Bitcoin returns, even though Bitcoin returns and EPU have a negative correlation; quantile regression research results reveal that the return rates of Bitcoin and EPU are significant at lower and lower quantiles, and investors can use Bitcoin to hedge EPU risks. According to Fang [39], EPU has a negative impact when compared to Bitcoin bonds, but a positive impact when compared to Bitcoin-related commodities and equities. As a result, bitcoin can be used in hedging operations to lower the risk of EPU.
Research on how EPU affects carbon emissions has increased along with the growth of the low-carbon economy. Pirgaip [40] found that there is a one-way causal relationship between Japan’s EPU on energy consumption, the US and Germany’s EPU on carbon emissions, and Canada’s EPU on energy consumption and carbon emissions. In other words, an increase in carbon emissions will result from increased energy use, EPU, and economic expansion. Moreover, he urged the G7 nations to consider the detrimental effects of EPU on energy conservation and emission reduction, as well as to reduce carbon dioxide emissions and consumption. Huang [41] demonstrated that outward direct investment, per capita GDP, and EPU all contribute to rising greenhouse gas emissions. Adams [42] examined how countries with high geopolitical risk emitted carbon; the study’s findings demonstrate not only that rising energy consumption raises carbon emissions but also that there is a strong negative correlation between rising EPU and carbon emissions, suggesting that rising EPU will make it more difficult for nations with high geopolitical risks to maintain environmental sustainability. Additionally, some academics have examined how EPU affects energy consumption by starting with renewable energy. EPU was shown to have an impact on the utilization of renewable energy in Nakhli’s [43] study, and there is only a one-way causative relationship between US electricity consumption and EPU, as opposed to a two-way causal relationship between carbon emissions and EPU; thus, when creating environmental policies, EPU should be taken into account. As research continues to advance, more academics are concentrating on the connection between EPU and carbon emissions at the micro level. Yu [44] asserts that China’s provincial EPU have a significant positive impact on the intensity of carbon emissions and that industrial firms are more willing to employ cheap fossil fuels to satisfy the EPUs’ continually increasing standards. Luo [45] discovered a strong inverse relationship between the unpredictability of economic policy and green innovation in businesses, while this relationship can be weakened by increasing the transparency of carbon information. Khan [46] found that carbon emissions in China, South Korea, Singapore, and Japan are positively correlated with trade, GDP, and EPU, and the environmental quality of East Asian economies is enhanced by FDI and the use of renewable energy sources.
The research focus of global economic policy uncertainty (GEPU) is comparable to that of EPU, and it examines how GEPU has affected global financial and commodity future markets. Yu [47] contended that as China’s integration into the global economy progresses, the unpredictability of global economic policy will become one of the main causes of, and a substantial contributor to, the volatility of the Chinese stock market. Miao [48] was of the opinion that the addition of a regime switching model could increase the precision with which GEPU forecasts change in the US stock market. Qin [49] thought that gold could be utilized as a hedge against GEPU risks during economic downturns; gold prices fluctuate as a result of GEPU, but GEPU is also impacted by gold prices both favorably and unfavorably. Shao [50] claims that there is an imbalanced relationship between GEPU and the transmission of global grain prices, with the effects of GEPU being more beneficial for soybean prices than maize and wheat prices.
While GEPU research methods are relatively rich and unique, the present research methods on PMI are pretty straightforward. Yu [51] used the DCC-MVGARCH method to study the dynamic correlation between the PMI and GDP growth rate of manufacturing in the US. Yanik [52] examined the causal relationship between manufacturing PMI and Türkiye’s stock market through the Granger causality test. Zhang [8] used the state space equation and KALMAN filter algorithm to test the fluctuation of PMI potential signals of manufacturing industries in the US, the EU, Japan and China. The nested regression and VAR models were used to study the relation between economic activity and uncertainty by Shaikh [53]. In the latest research method on GEPU, Zhang [54] used the TVP-VAR model to study the time-varying relationship between EPU, geopolitical risk (GPR), and inbound tourism in China. Gu [55] used the TVP-VAR model to compare the dynamic impact of GPR and EPU indices on the oil market.
Although the above research clearly proves that EPU and GEPU affect the stability of stock returns [32], exacerbate exchange rate fluctuations [32,33,34], inhibit investment and output [35], and affect carbon emission intensity [41,42,43,44], the above-mentioned research methods on EPU and GEPU are mostly based on linear models such as the VAR model and its evolutions [31,32,33,40,41,42,43], quantile regression [34], the least square method [35], etc. These methods are relatively simple. Moreover, it is impossible to capture the dynamic time-varying characteristics of EPU or GEPU shocks, and it is impossible to further analyze the time-point shocks caused by crucial events in EPU and GEPU. Among the above research methods on PMI, Granger causality can only test the overall causality among variables and cannot reflect its dynamic correlation [52]; the state space equation and KALMAN filter algorithm are limited to the correlation study of two variables; the DDC MVGRACH model has relatively low accuracy in the long-term prediction of variables [51]; the VAR model can better predict multiple variables, but the conclusions drawn lack completeness and accuracy due to its failure to consider the changes in model coefficients with different periods. Although the above methods can, to some extent, reflect the dynamic interaction between variables, they cannot reflect the dynamic correlation between variables in different periods and the marginal impact effects at different time points. With the deepening of the research, the dynamic and time-varying impact of emergencies in EPU and GEPU on the economy has gradually attracted the attention of scholars. Zhang [54] used the TVP-VAR model to empirically analyze the impact of GPR emergencies such as the 911 incident and the US financial crisis on tourism but did not involve the impact of COVID-19 or the Russia–Ukraine conflict on tourism. Gu [55] also uses the TVP-VAR model, but the selected research scope was up to September 2020; thus, it cannot deeply analyze the impact of COVID-19 on international oil prices, and it does not involve the Russia–Ukraine conflict which has had an important impact on the global economy. Therefore, this study will draw on the gaps and deficiencies of the above research methods and for the first time, try to put the impact of global economic policy uncertainty on manufacturing PMI within a unified analysis framework, pay more attention to the dynamic time-varying characteristics of GEPU, and use the TVP-VAR model to analyze the time-varying impact of GEPU on manufacturing PMI in China, the US, and the EU. In this paper, we perform a comparative analysis of the impact of the US financial crisis, the European debt crisis, and especially the China–US trade war, COVID-19, the Russia–Ukraine conflict and other major global events on manufacturing. TIt also helps to compare and analyze the risk resilience of manufacturing in these three economic systems, providing relevant empirical references for industrial investors and policymakers.

2.2. Hypotheses

The impact of global economic policy uncertainty on manufacturing PMI is mainly reflected in two aspects: (1) Frequent adjustment of economic policies by governments in various countries means increased government intervention in the market. Under high economic policy uncertainty, investment institutions will tighten loan review criteria to reduce risks, slowing down the speed of foreign investment and outward direct investment in the manufacturing industry and having a negative impact on the manufacturing industry [56]. With the rise of trade protectionism leading to global economic policy uncertainty, it will have a significant negative impact on the manufacturing industry of some countries [57]. (2) The long-term impact of economic policy uncertainty on the manufacturing industry may enhance its risk resistance by forcing technological innovation in the manufacturing industry [58], and at this time, economic policy uncertainty may have a positive impact on the manufacturing industry [59]. Therefore, the impact of economic policy uncertainty on the manufacturing industry may be non-linear, and the direction of the impact may also change. Previous studies have confirmed that the impact of economic policy uncertainty on some macroeconomic variables often has temporal differences in direction; for example, Gächter [60] found that the dependence of uncertainty on economic activities depends on the transmission of countries, and global uncertainty shocks can have adverse nonlinear effects on the macroeconomic system; at the same time, Caggiano [61] found that the Canadian unemployment rate reacted more strongly to the impact of the uncertainty of American economic policy during the Canadian economic depression through empirical research. Similarly, Li [62] believed that the impact of economic policy uncertainty on financial stability and the green bond in the long and short run may be different; that is, the impact of economic policy uncertainty on macroeconomic variables is time-varying. Based on this, hypothesis H1 is proposed:
H1. 
Global economic policy uncertainty may have a time-varying impact on the manufacturing industry.
Previous studies have shown that there is heterogeneity in economic policy uncertainty, which has different impact directions and forces on different economies [31]. We analyze and compare the impact of economic policy uncertainty on manufacturing in China, the US, and the EU from aspects such as trade structure and industrial structure characteristics. Firstly, it is known that China has been the world’s largest exporter of goods for many consecutive years. According to UNcomtrade, the proportion of China’s exports in global export trade has increased from 3.9% in 2000 to 15.1% in 2021, and the world’s dependence on Chinese-manufactured goods has been increasing year by year. In China’s export products, the demand elasticity of products such as shoes, hats, textiles, and plastic products is relatively low, and global economic policy uncertainty cannot easily change consumers’ demand for essential goods. Secondly, compared to Europe and America, which have a relatively high proportion of high-end manufacturing, China has a huge and complex industrial chain and a super-large-scale manufacturing capacity [63], and it is constantly moving towards high-end and intelligent development [64]. A complete industrial chain not only ensures strong industrial supporting advantages but also enhances the ability of the industrial chain to resist external shocks [65]. Finally, a country’s trade structure is an external manifestation of its industrial structure, while the industrial structure correlation between countries is a manifestation of economic correlation at the industrial level [66]. The symmetry display comparative advantage index of China’s manufacturing industry is mainly concentrated in labor-intensive and resource-intensive industries, the US’s advantage is mainly concentrated in resource-intensive and technology-intensive industries, and the EU’s advantage is mainly concentrated in technology-intensive industries [67]. The difference in the industrial structure between China and manufacturing in the US has led to a complementary relationship between the manufacturing industries of China and the US [68]. However, there is a highly overlapping industrial structure between the EU and US manufacturing, such as in automobile manufacturing. American automobile manufacturers have a complete and efficient production system for parts and whole-vehicle manufacturing, with strong export competitiveness. Germany, in the EU, is a traditional automotive industry powerhouse, with obvious competitive advantages in the division of labor, process control, technological innovation, brand value, and other aspects of the automotive manufacturing industry layout. Their substitutable industrial structures make European and American manufacturing industries more susceptible to greater economic policy uncertainty. Based on this, hypothesis H2 is proposed:
H2. 
The impact of global economic policy uncertainty on China’s manufacturing might less severe than in Europe and America.

3. Materials and Methods

3.1. Time-Varying Parameter Vector Autoregressive

We utilize the TVP-VAR model to analyze the impact of GEPU on manufacturing. The pulse response results obtained by the TVP-VAR model are calculated through MCMC simulation iterations for each period within the sample, which can simulate the pulse response of the manufacturing industries in China, the US, and the EU when facing global economic policy uncertainty shocks from two perspectives: different lag periods and different time points. This model can effectively test the heterogeneity impact of global economic policy uncertainty on manufacturing PMI and whether the impact of global economic policy uncertainty on manufacturing amounts to a time-delay when a specific event occurs.
The TVP-VAR evolved from the VAR model. Sims [69] first suggested the standard VAR model, which is frequently employed in the analysis of numerous temporal variables. A multivariate time series regression is used to build the VAR model by regressing all current period variables on several lagged terms for all variables. This allows the model to be used to derive correlations between the variables. The classic VAR model is written as follows:
y t = A 1 c + B 1 y t 1 + + B s y t s + A 1 ε t                                                                                                   t = s + 1 ,   s + 2 , , n   ;   ε t ~ N 0 , 1 ,
where y t   is a k × 1 dimensional vector on the observable variables; s denotes the lag period; B i = A 1 F i ; and A and F i   are k × k coefficient matrices. Assume that A is a lower triangular matrix:
A = 1 0 0 a 21 0 a k 1 a k , k 1 1
and
= σ 1 0 0 0 0 0 0 σ k ,
where σ 1 is the standard deviation of the structural shock. The elements in B i are combined into a k 2 s × 1 dimensional column vector β. In X t = I n 1 , y t 1 , , y t 1 , ⨂ is the Kronecker product. Then, Equation (1) can be rewritten as follows:
y t = X t β + A 1 ε t  
The underlying pattern of change is not entirely captured by typical VAR models since none of the factors in the VAR assumptions are time-varying. In order to solve this issue, Primiceri [70] developed the TVP-VAR model, which builds on the VAR model by adding time-varying parameters and stochastic fluctuations. In this model, coefficients follow shock fluctuations; thus, we describe the time-varying relationship among variables from a dynamic perspective. According to Primiceri [70] and Nakajima [71], the specific form of the model is as follows:
y t = X t β t + A t 1 t ε t ,           t = s + 1 , , n .
The coefficient vector β t , the parameter matrix A t , and t in the model all vary with time. To model the time-varying process of these variables, let α t be the stacked vector of row vectors of non-zero, non-1 elements of matrix A t . For the three vectors β t , α t , and h t , they obey the following random walk process:
β t + 1 = β t + μ β t α t + 1 = α t + μ α t h t + 1 = γ t + μ h t ,
where h j t = log σ j t 2 and h t = h 1 t , , h k t . Assume that ε t , μ β t ,   μ α t ,   μ γ t   follows:
ε t μ β t μ α t μ h t ~ N 0 , 1 0 0 β 0 0 0 0 0 0 0 0 α 0 0 h ,
where β s + 1 ~ N μ β 0 , β 0 , a s + 1 ~ N μ a 0 , a 0 , and h s + 1 ~ N μ h 0 , h 0 . It is assumed that shocks to these time-varying parameters are independent of β t , a t , and h t and that β ,   α 0   and   γ 0 are diagonal matrices. The addition of a stochastic wandering process to the model allows it to capture a reasonable amount of potential short-term structural changes in the data, making it appropriate for analysis of the monthly data utilized in this research.
Here, y t = G e p u t , C N t , U S t , E U t , and G e p u t , C N t , U S t ,   and   E U t represent the GEPU, China’s PMI, the US’ PMI, and the EU’s PMI, respectively, in the period t. The time-varying parameter model follows a random walk process.
This study applies MATLAB (Version: R2022a) to estimate the model through the Bayesian method and uses the Markov chain Monte Carlo simulation to make a posterior estimation of parameters.

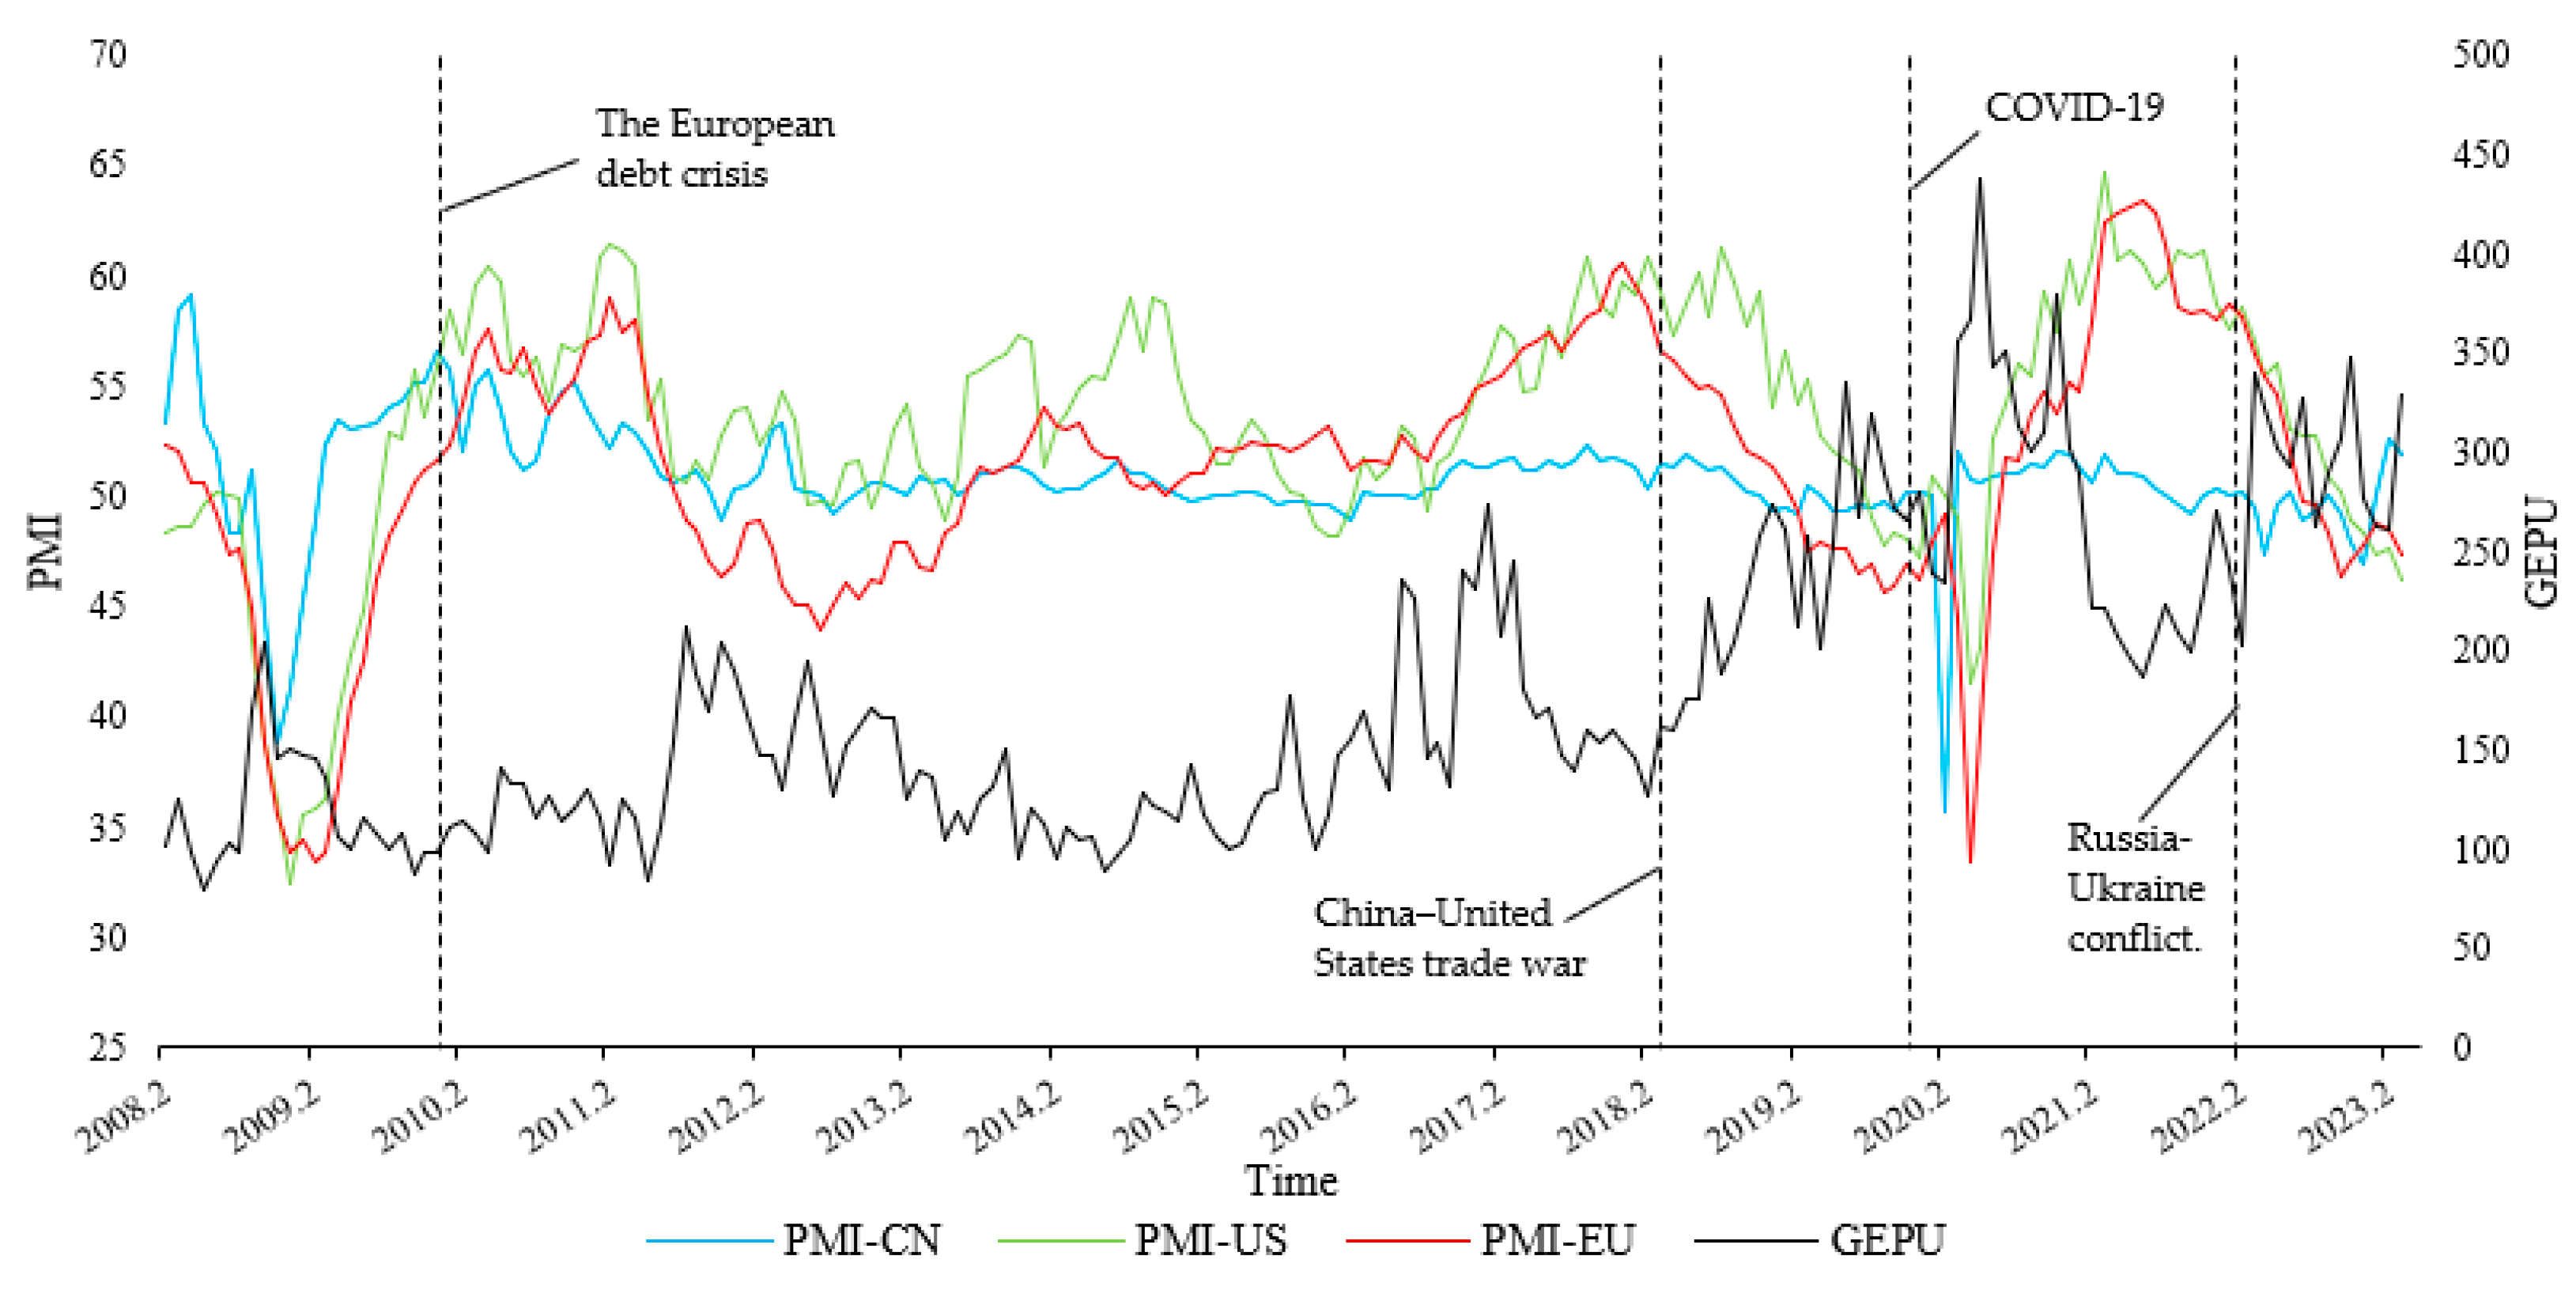
3.2. Data Source and Description

Our study empirically analyzes the effects of GEPU on manufacturing using monthly data from February 2008 to March 2023. According to the availability of data, China’s manufacturing PMI was released in February 2005. The US’ manufacturing PMI was released in January 1970. Although the EU PMI was published in January 2006, we can only obtain the EU manufacturing PMI starting from February 2008, so our work starts in February 2008. In order to ensure this study can capture the latest global manufacturing situation and uncertainty risks, we chose the deadline for the study to be March 2023. Global economic policy uncertainty (GEPU) is used to investigate the impact of external factors on different economies [49], and manufacturing purchasing manager’s index (PMI) covers crucial information of manufacturing sector [11]. Therefore, we use GEPU to represent uncertainty; China’s PMI (CN), the US’ PMI (US), and the EU’s PMI (EU) are used to represent the manufacturing sector. GEPU and PMI are obtained from the EPU (economic policy uncertainty index) and PMI (Investing.com—Stock Market Quotes & Financial News) websites.
Manufacturing PMIs in China, the US, and the EU have experienced significant swings as a result of global economic policy uncertainty. Overall, Figure 1 demonstrates that when the GEPU varies significantly, the manufacturing PMIs for China, the US, and the EU vary similarly, and that the impact of the GEPU on the PMI may have a time-lag effect. In terms of stages, first, the European debt crisis in December 2009 led to a rise in GEPU, and the PMIs of China, the US, and the EU fluctuated sharply above 50; however, they still maintained a certain upward trend, and the reason may be that manufacturing is alleviating the effects of the 2008 financial crisis, while the impact of the European debt crisis is more reflected in the debt area; however, the European debt crisis has caused a decline in the EU manufacturing PMI that is significantly greater than that of China and the US, as the sovereign credit crisis in Greece, Spain, Italy, and other European nations has become worse. Second, the China–US trade war began in March 2018, which led to a spike in GEPU and a steep decline in the PMIs of the US and the EU, but just a minor change in China’s manufacturing PMI. Then, in December 2019, the COVID-19 outbreak caused a sharp increase in GEPU, which peaked in May 2020 at 437.31; at the same time, the manufacturing PMIs of China, the US, and the EU all experienced significant fluctuations; the shutdown had a substantial negative influence on China’s manufacturing PMI, which fell to 35.7 and indicated a severe recession, while the manufacturing PMIs for the US and the EU also dropped below 50. Finally, the Russia–Ukraine crisis caused the GEPU, which had been in a downward trend, to sharply surge again in February 2022; this led to the manufacturing PMIs of the US and the EU collapsing quickly and steeply, whereas China’s manufacturing PMI only experienced a very modest fall.
There follows a descriptive analysis of logarithmic variables. Table 1 reports the descriptive statistics of the sample variables. In terms of mean and standard deviation, except for the GEPU, the PMI mean levels across economies are ranked from high to low for the US, the EU, and China; and the volatility levels are ranked from high to low for the EU, the US and China. The skewness coefficient of the GEPU is positive in comparison to the other indicators’ negative skewness; it shows that a greater proportion of GEPU data samples are above the mean, whereas a greater proportion of PMI data samples are below the mean. The kurtosis of the indicators shows a peak below 3 for the GEPU, but a peak above 3 for the PMI of China, the US, and the EU. China’s PMI especially, which has a peak above 10, shows that the probability density distribution curve for the PMI for the three economies, except for the GEPU, has a steeper form.

4. Results

4.1. Empirical Testing

First, we produce the logarithmic variables and test the stability. In Table 2, the Phillips and Perron and augmented Dickey–Fuller tests indicate that the LNCN and LNGEPU, which are stationary series (whereas the LNUS and LNEU are first-order difference stationary series), meet the requirements for further building the TVP-VAR model.
Second, we determine the lag order of the time series. According to the minimum criteria of SC and AIC, it can be seen from Table 3 that the lag order of the model is three.
Third, we perform cointegration testing to prevent the issue of pseudo regression in time series. The Johansen test results in Table 4 indicate that there are at least two sets of cointegration relationships among the variables, which is consistent with the modeling requirements.
Fourth, we estimate the model parameters. The Markov chain Monte Carlo (MCMC) algorithm is first employed for 10,000 iterations; this article discards the results of the first 1000 iterations to improve the accuracy of the estimation findings. We obtain the posterior distribution of Markov chain convergence after eliminating the first 1000 iterations and take a sample from the posterior distribution to create the mean estimation of each parameter.

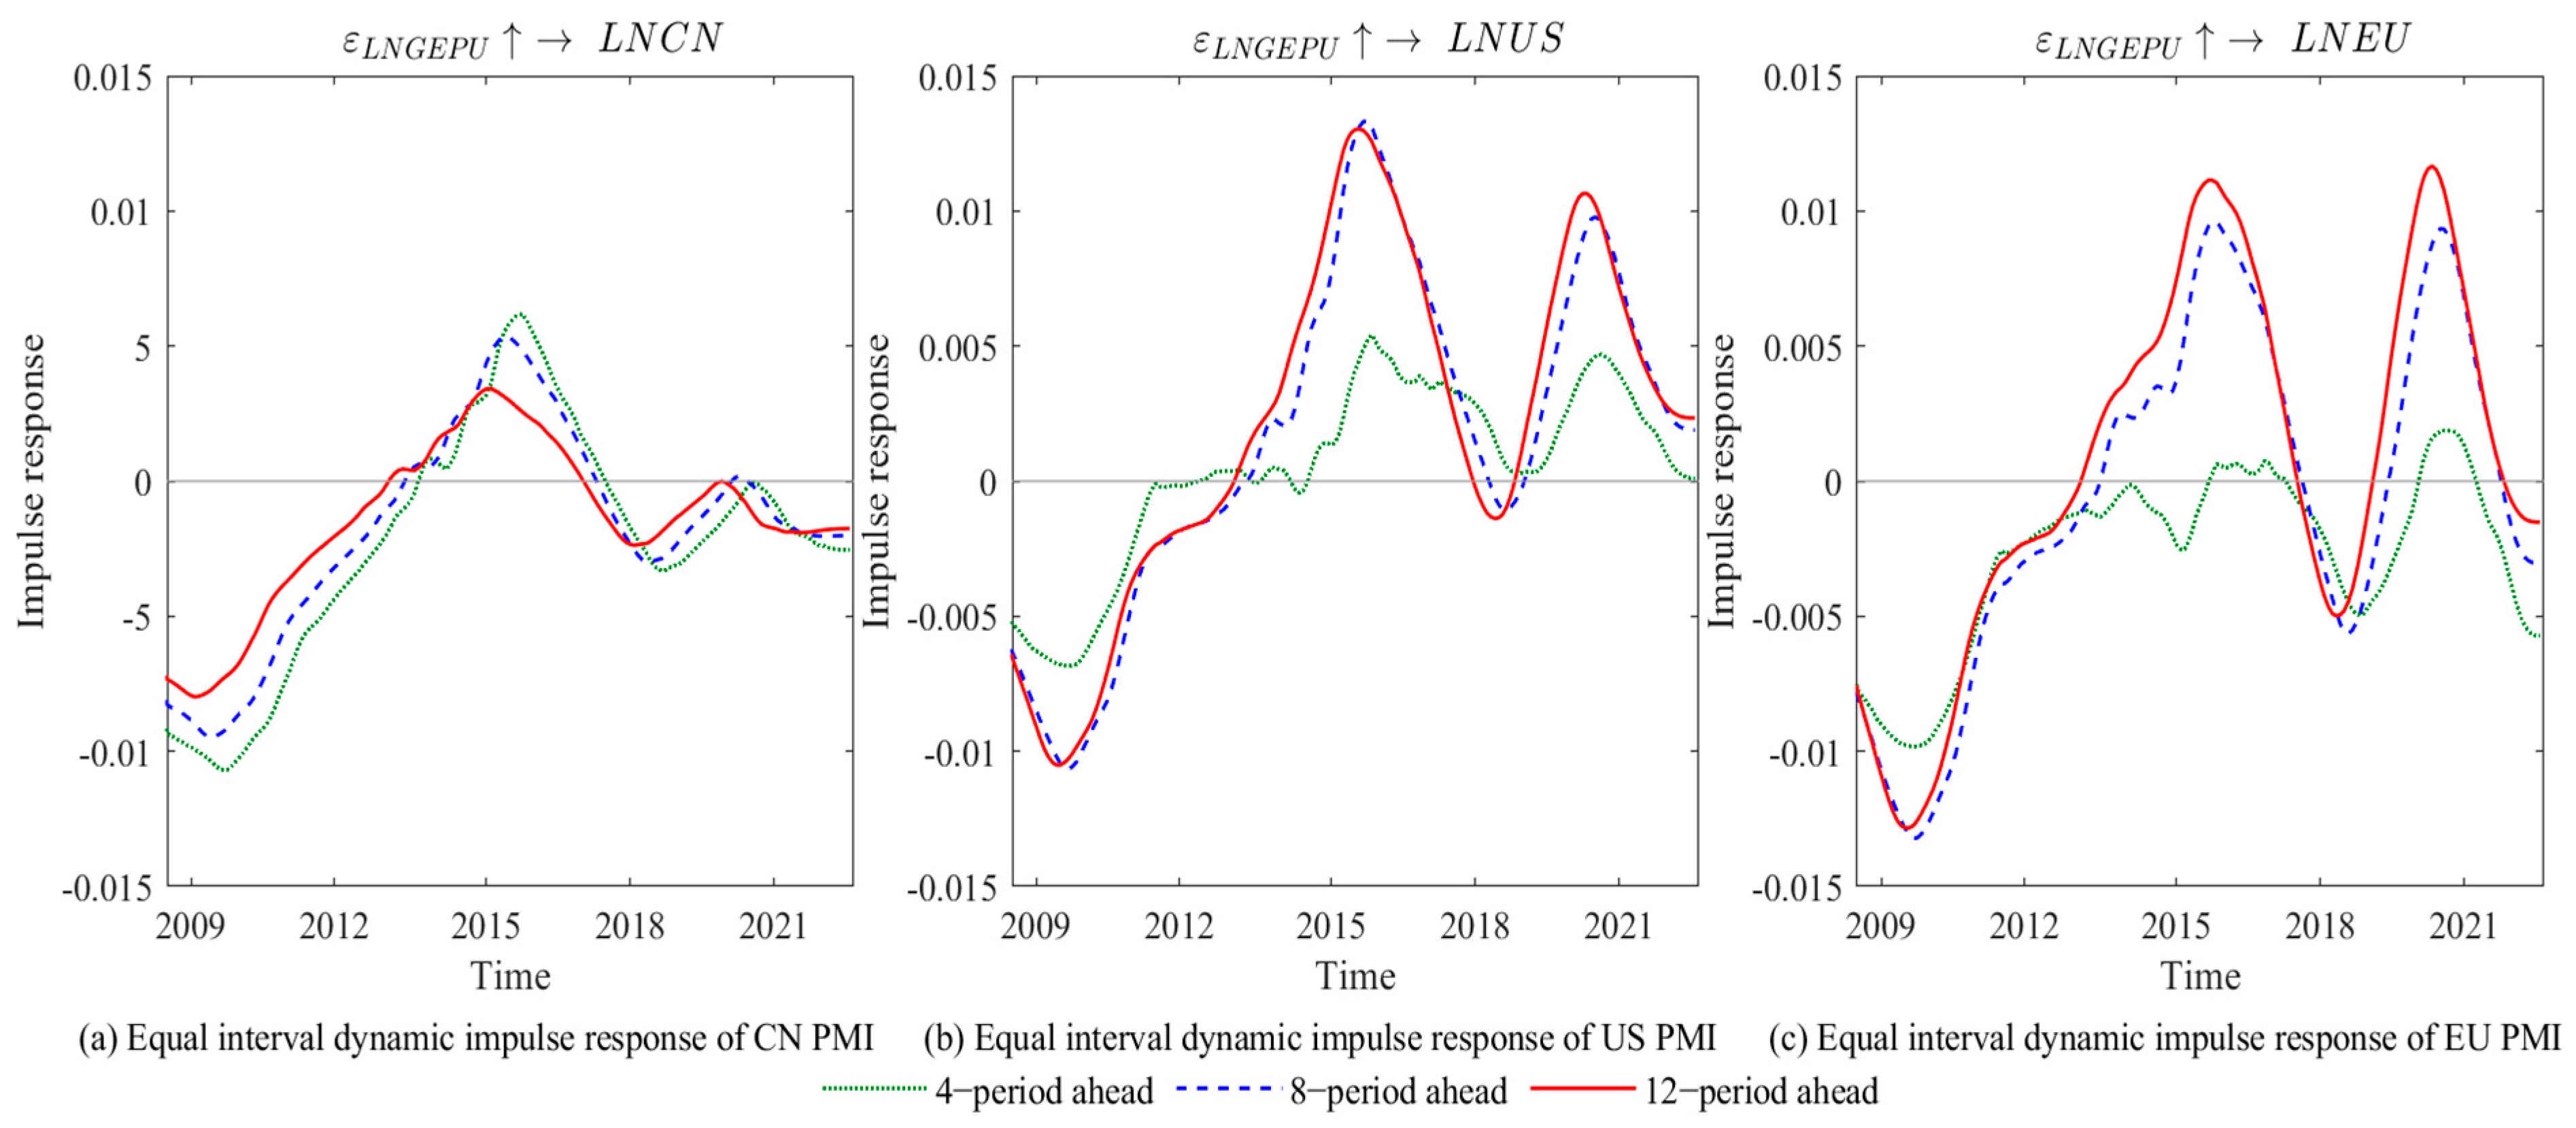
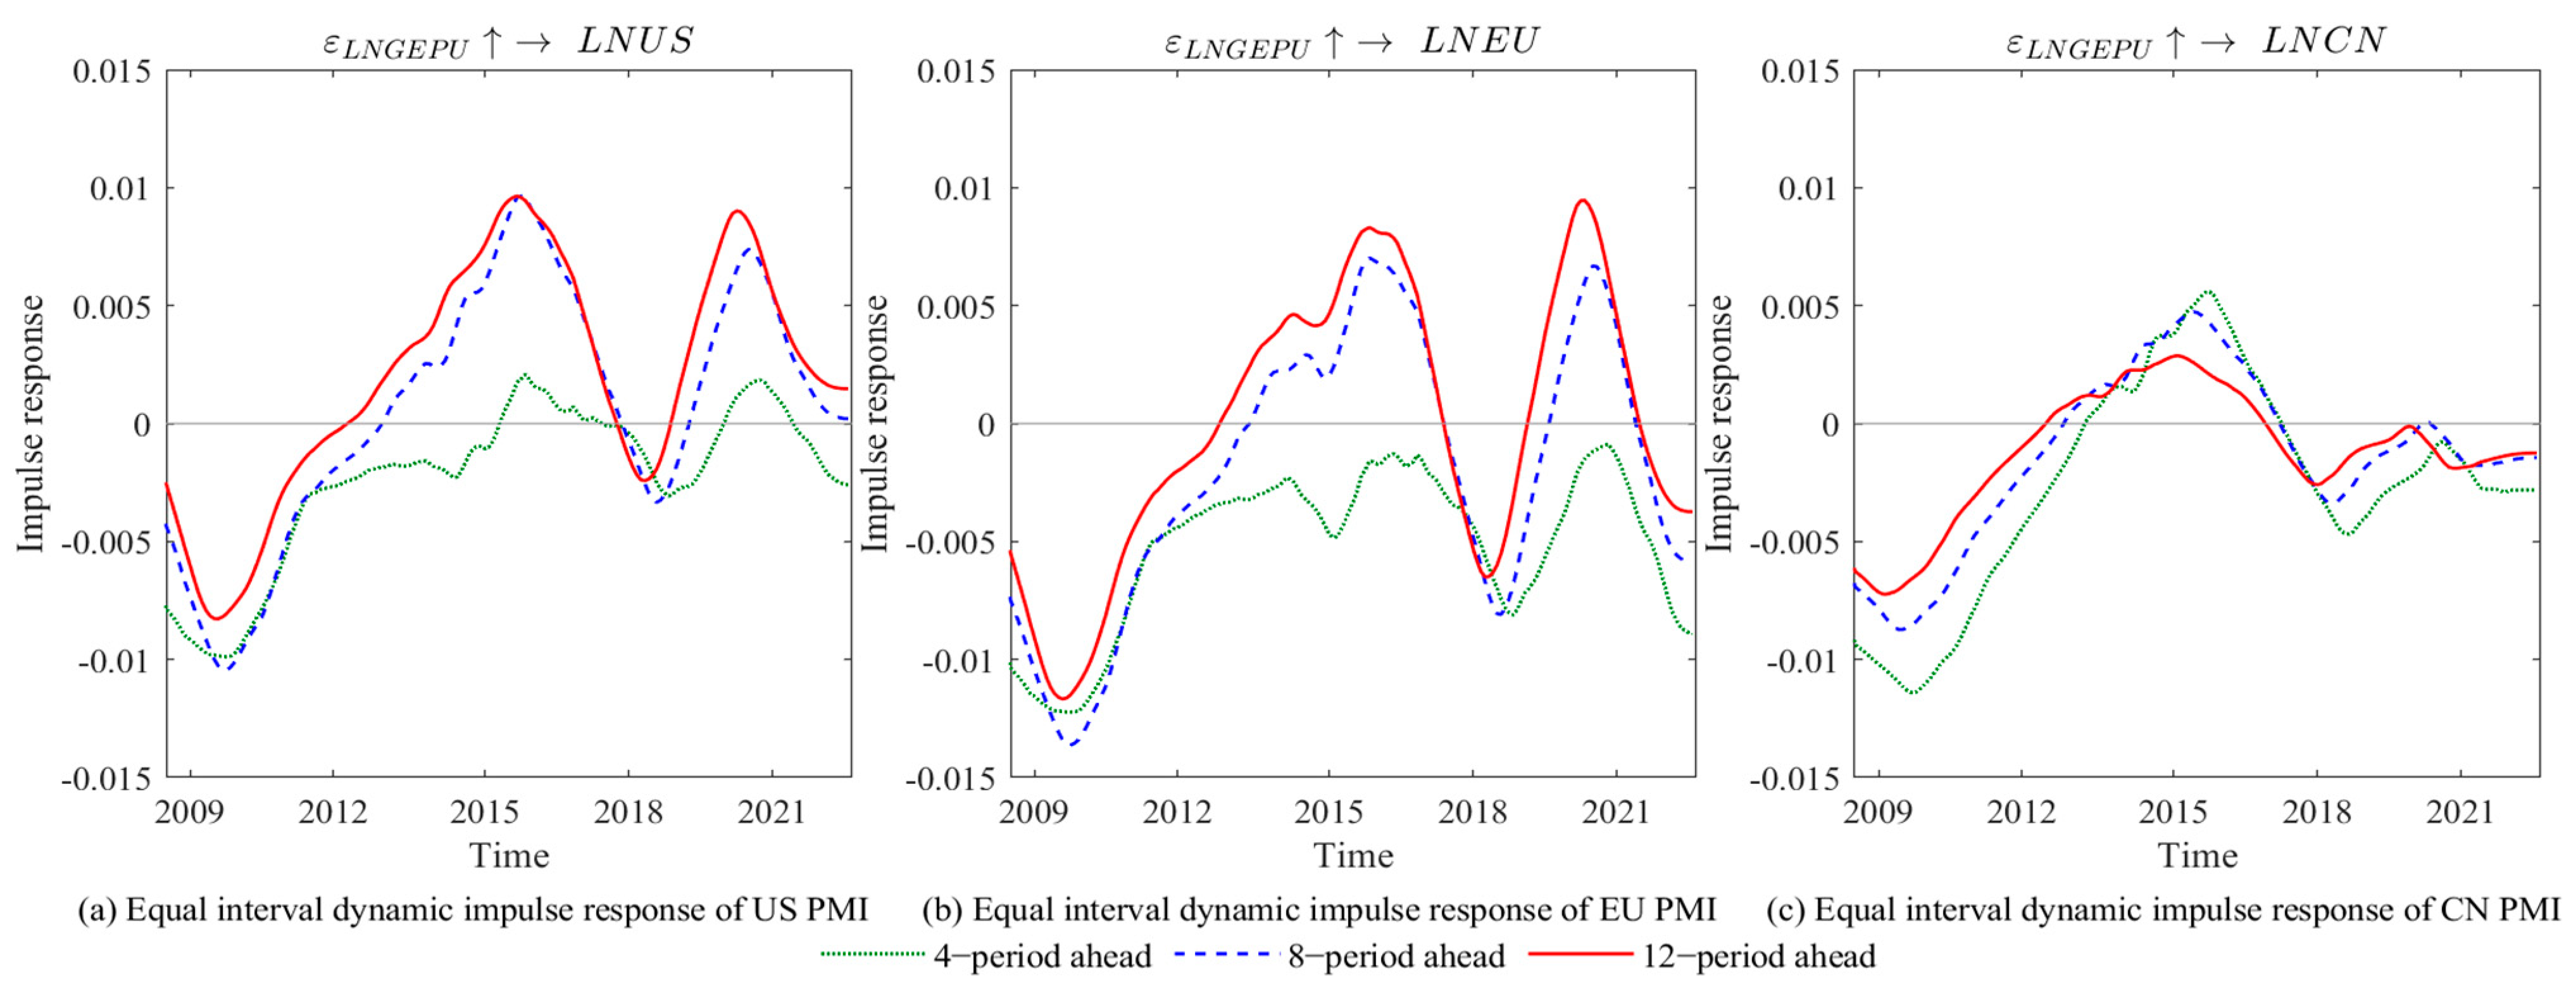
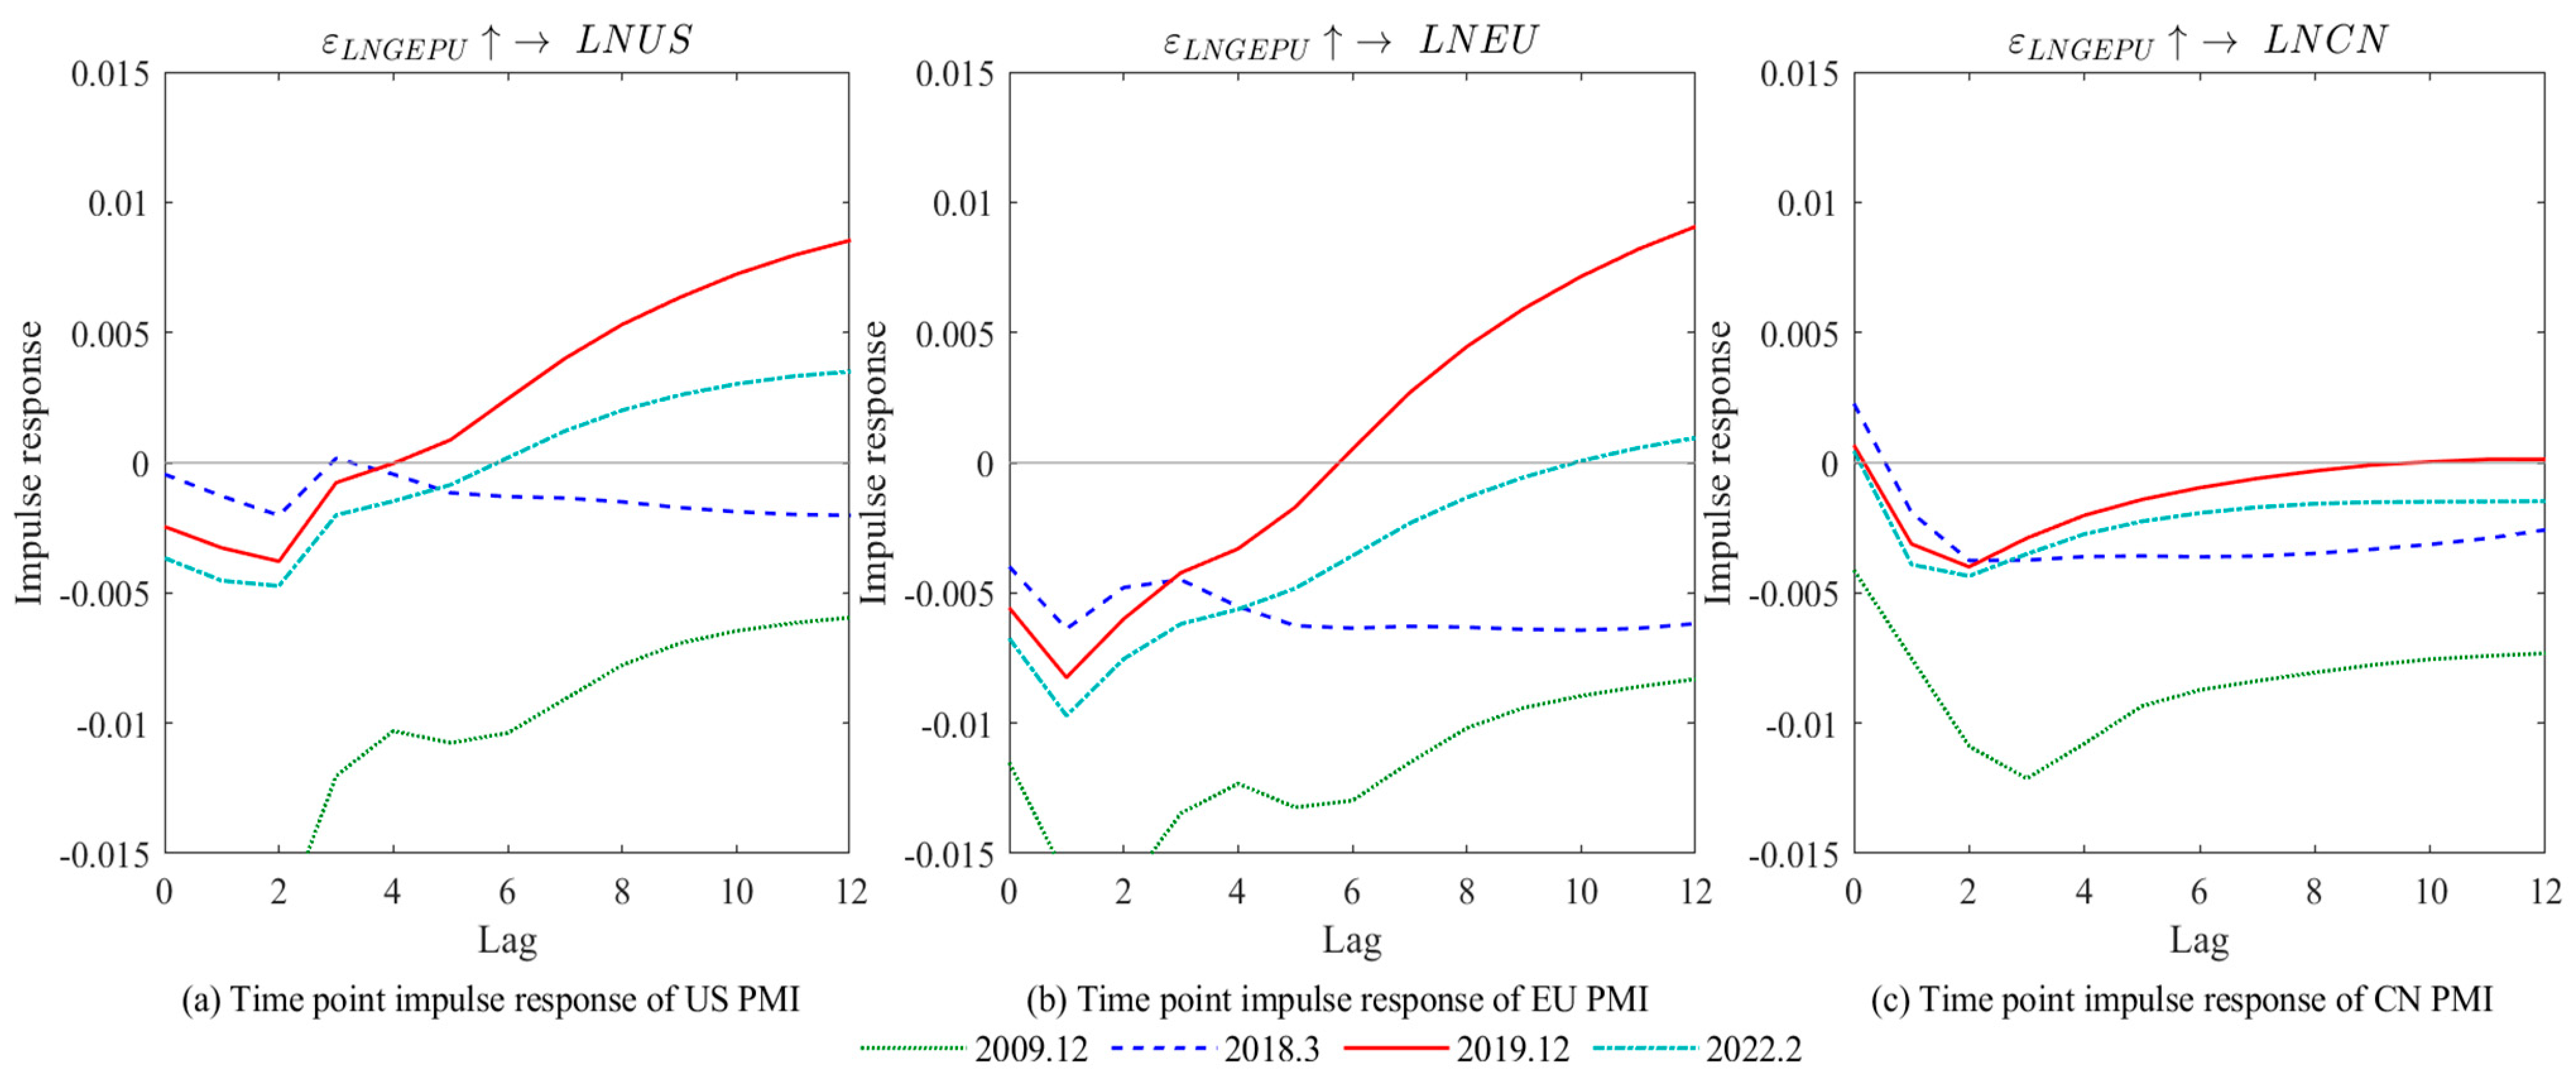
4.2. Empirical Results

The effect of GEPU on manufacturing PMI in China, the US, and the EU can be investigated using the TVP-VAR model. The equal interval dynamic impulse response function (Figure 2), which demonstrate that the impact of GEPU on manufacturing, has time-varying characteristics; impulse response functions at various time points (Figure 3) were used to empirically analyze GEPU on manufacturing, which demonstrate that the impact of GEPU on China’s manufacturing industry is relatively small.
Figure 2a displays the equal interval dynamic impulse response results, which show that GEPU initially had a negative impact on China’s manufacturing from 2008 to 2013 before changing to a positive impact in 2013 and peaking in 2015; thereafter, the impact effect continued to wane and eventually changed to a negative impact in 2017, with a relatively small overall amplitude. Figure 2b,c shows that GEPU has a similar effect on US and EU manufacturing, respectively. Specifically, it has a negative impact on US manufacturing from March 2008 to April 2013, but after that, there is a significant fluctuation above the zero axis; from March 2008 to June 2013, the impact of GEPU on EU manufacturing is negative, but after that, there is a significant fluctuation above the zero axis most of the time. According to empirical findings, the direction and size of GEPU’s effects on manufacturing change over time. For example, GEPU’s short-term impact on China’s manufacturing is slightly greater than its medium- and long-term effects, whereas GEPU’s medium- and long-term effects on manufacturing in the US and the EU are much greater than its short-term effects. China’s manufacturing has a risk resilience advantage because the impact of GEPU is much lower than that of the US and the EU.
Manufacturing is also impacted by critical GEPU events that occur at various times. Our study selects four crucial time points in GEPU, including the European debt crisis (December 2009), the China–US trade war (March 2018), the COVID-19 pandemic (December 2019), and the Russia–Ukraine conflict (February 2022). The results are displayed in Figure 3. China was negatively impacted at these four time points, with the European debt crisis having a higher impact on China’s manufacturing than the China–US trade war and the Russia–Ukraine conflict, whereas the COVID-19 pandemic had the least impact on China’s manufacturing. The US manufacturing industry was most adversely affected by the European debt crisis and most favorably by the COVID-19 pandemic; the US–China trade war and the Russia–Ukraine conflict had less impact on US manufacturing. The EU manufacturing sector was most negatively impacted by the European debt crisis, followed by the China–US trade war and the Russia–Ukraine conflict, and most favorably by the COVID-19 pandemic.

5. Robust Test

The TVP-VAR model is frequently incorrectly set, which compromises the validity of empirical data by leaving out crucial factors or ranking variables incorrectly. As a result, the benchmark TVP-VAR model in this study needs to undergo a robustness test. This study refers to existing research [72]. When doing robustness analysis, one must change the variable order from the original, y t = G e p u t , U S t , C N t , E U t , to y t = G e p u t , U S t , E U t , C N t and elect the same lead time and time point as above. The robustness test results are shown in Figure 4 and Figure 5.
Figure 4 shows that the medium- and long-term impact of GEPU on the manufacturing PMI in the US and the EU is greater than the short-term impact. Moreover, the short-term impact on China’s manufacturing PMI is higher than the medium- and long-term impact, consistent with the results of equal interval pulse response mentioned above. Figure 5 shows that the response strength of the manufacturing PMI for China, the US, and the EU at various time intervals is comparable to the corresponding strength above. This demonstrates that the TVP-VAR model employed for robustness testing exhibits comparable dynamic changes, demonstrating the robustness of the above empirical findings.

6. Discussion and Conclusions

6.1. Discussion

The impact of global economic policy uncertainty on the PMI of manufacturing in China, the US, and the EU has a time-varying characteristic, and the resilience of China’s manufacturing to risks is higher than that of the US and the EU. Comparing the effects of GEPU on the manufacturing sectors of the three major economies at various times, we can see that first, the European debt crisis had a larger detrimental impact on the EU manufacturing industry than on the US or Chinese industries; second, the negative impact of the China–US trade war on EU manufacturing has been greater than that on China and the US; third, the COVID-19 pandemic’s influence on China’s manufacturing is infinitesimally close to the zero axis, thereby indicating that COVID-19 had almost no impact on China’s manufacturing, but it had a greater positive impact on manufacturing in the EU and the US; finally, the impact of the Russia–Ukraine conflict on the EU is higher than that on the US and China. Regarding the effects of GEPU on manufacturing at different time points, the impact on China’s manufacturing is the lowest and that on EU manufacturing is greater than that on US manufacturing. This phenomenon indicates that when facing the impact of GEPU, China’s manufacturing industry has a higher ability to resist risks than the US and the EU, and the reason may be that China is the only country in the world with all industrial sectors and thus has a full industry chain advantage, which significantly enhances the risk resistance ability of China’s manufacturing. As a result of the high degree of industrial chain overlap, the manufacturing sectors of the US and the EU now have a more substitutive relationship, which has increased competition between the two. At the same time, China’s manufacturing sector is complementary to the manufacturing sectors of the US and the EU, meaning that China’s low-end consumer goods can satisfy the market demand of the US and the EU, while compared to the US and China, the industrial sector in the EU has much lower risk resilience.
Previous studies have revealed that the impact of GEPU on finance is mainly reflected in the short-term [34,35]; conversely, our research posits that the impact of GEPU on manufacturing is mainly reflected in the medium and long term. The blockade measures of the COVID-19 pandemic drastically lowered demand and caused factories to close down [36]; however, our research argues that Chinese manufacturing has benefited from its dynamic zero-COVID policy and is almost unaffected by COVID-19. The Russia–Ukraine conflict has increased the uncertainty of German economic policy and negatively impacted its financial and economic systems [37,38,39], hence, we find that EU manufacturing suffered most from the Russia–Ukraine conflict. Bondt’s [7] research suggests that PMI provides a reliable GDP tracker for policymakers and analysts. Yue [9] believes that when the manufacturing PMI is in the expansion range, the PPI shows an upward trend. When PMI is in a recession range, CPI rises. Dan [8] believes that China’s manufacturing PMI is ahead of the United States and the European Union, and the potential trends of manufacturing PMI in these three countries are similar. Our research clearly indicates that China, the US, and the EU’s manufacturing PMI have obvious time-varying characteristics when facing the impact of global economic policy uncertainty; meanwhile, China’s manufacturing industry has stronger risk resilience.
The relationship between manufacturing and supporting industrial chains in different nations is becoming closer, and the mutual influence of industrial policies in different countries is becoming stronger all the time in the context of economic globalization. The above results hold implications for the study of the effects of global economic policy uncertainty on manufacturing and provide a new research perspective and empirical evidence. At the same time, the findings suggest that empirical analysis can help industrial policymakers in China, the US, and the EU develop a clear understanding of their manufacturing’s risk resistance ability and help formulate manufacturing support policies that are in line with the actual situation of their manufacturing industry. The limitations of this study are mainly reflected in the use of manufacturing PMI only to measure the manufacturing industry’s ability to resist risks; more indicators can be introduced, such as foreign direct investment, to further analyze the specific mechanisms of capital transfer in the industrial sectors of China, the US, and the EU under ambiguous economic policies.
Based on our current findings, first, we recommend that China urgently improve its autonomous and controllable capabilities in key components, such as semiconductor manufacturing, basic materials, and basic software field; enhance the competitiveness of new energy fields such as high-speed rail, lithium batteries, wind energy, and photovoltaic energy in the international market; and, at the same time, accelerate the construction of automated production lines and unmanned factories to reduce the pressure of manufacturing outflows caused by rising labor costs. Second, we recommend that the US accelerate the process of “reindustrialization” and improve its domestic supply chain assumptions; promote the development and upgrading of raw material and component suppliers upstream of the supply chain through manufacturing extended partnership plans (MEPs), reducing procurement and operational costs for local enterprises; and reduce the labor burden, introducing support policies in skilled labor training, manufacturing development, etc. Third, we think that the EU should develop a differentiated manufacturing industry with the US, reducing geopolitical risks and ensuring current energy security.

6.2. Conclusions

Against the background of increasing global political and economic volatility, we employ the TVP-VAR model to empirically test the impact of GEPU on manufacturing from February 2008 to March 2023 in China, the US, and the EU. We confirm that the impact of GEPU on manufacturing is time-varying and aggravates the volatility of global manufacturing. We conclude that manufacturing in the EU is more fragile than that in the US and China, thereby making it more susceptible to the harsh effects of GEPU; moreover, manufacturing in China has a higher anti-risk capacity than the US.
The uncertainty of global economic policy is still fluctuating at a high level, and global manufacturing continues to be depressed. According to the latest manufacturing PMI data in June 2023, China’s manufacturing PMI was 49, which rebounded slowly from the previous month and was at the critical value of the manufacturing expansion range and recession range. The PMI of U.S. manufacturing is 46, which has been in recession for 8 consecutive months. The PMI of EU manufacturing is 43.4, which has been in recession for 11 consecutive months. Looking forward to future research, the impact of the Fed’s continuous interest rate hikes and the Russia–Ukraine conflict on inflation and manufacturing transfers in EU countries has not yet fully manifested. Furthermore, industrial competition between China and the United States has intensified, leading to China–US trade conflicts and industrial chain distortions. Geopolitical risks in East Asia may also cause global economic policy uncertainty to rise again. In this context, the relationship between the Association of Southeast Asian Nations (ASEAN) and China and the US is relatively relaxed, so the research can be extended to the impact of GEPU on the economy of ASEAN countries.

Author Contributions

Y.L.: Conceptualization, Methodology, Data curation, Coding, Empirical analysis, Writing—Original draft preparation, Revising. Y.B.: Conceptualization, Methodology, Data curation, Empirical analysis, Writing—Reviewing and Editing, Revising. All authors have read and agreed to the published version of the manuscript.

Funding

This research received no external funding.

Institutional Review Board Statement

Not applicable.

Informed Consent Statement

Not applicable.

Data Availability Statement

The data presented in this study are available on request from the corresponding author.

Acknowledgments

All authors are grateful to the anonymous reviewers and the editor for their constructive comments and suggestions for this article.

Conflicts of Interest

The authors declare no conflict of interest.

References

  1. Marconi, N.; de Borja Reis, C.F.; de Araújo, E.C. Manufacturing and Economic Development: The Actuality of Kaldor’s First and Second Laws. Struct. Chang. Econ. Dyn. 2016, 37, 75–89. [Google Scholar] [CrossRef]
  2. Liu, F.; Ding, Y.; Gao, J.; Gong, P. Effects of Cost Factors on National Manufacturing Based on Global Perspectives. Economies 2017, 5, 45. [Google Scholar] [CrossRef] [Green Version]
  3. McCausland, W.D.; Theodossiou, I. Is Manufacturing Still the Engine of Growth? J. Post Keynes. Econ. 2012, 35, 79–92. [Google Scholar] [CrossRef]
  4. Su, D.; Yao, Y. Manufacturing as the Key Engine of Economic Growth for Middle-Income Economies. J. Asia Pac. Econ. 2017, 22, 47–70. [Google Scholar] [CrossRef] [Green Version]
  5. Cantore, N.; Clara, M.; Lavopa, A.; Soare, C. Manufacturing as an Engine of Growth: Which Is the Best Fuel? Struct. Chang. Econ. Dyn. 2017, 42, 56–66. [Google Scholar] [CrossRef]
  6. Haraguchi, N.; Cheng, C.F.C.; Smeets, E. The Importance of Manufacturing in Economic Development: Has This Changed? World Dev. 2017, 93, 293–315. [Google Scholar] [CrossRef]
  7. de Bondt, G.J. A PMI-Based Real GDP Tracker for the Euro Area. J. Bus. Cycle Res. 2019, 15, 147–170. [Google Scholar] [CrossRef]
  8. Zhang, D.; Xiao, M.; Yang, X.; He, Y. The Analysis of Manufacturing PMI Potential Trends of the US, EU, Japan and China. Procedia Comput. Sci. 2015, 55, 43–51. [Google Scholar] [CrossRef]
  9. He, Y.; Zhang, Y.; Tian, P. The Study of Warning Threshold of Chinese Manufacturing PMI for Important Macroeconomic Indicators. Procedia Comput. Sci. 2015, 55, 1374–1380. [Google Scholar] [CrossRef] [Green Version]
  10. Meyer, D.F.; Habanabakize, T. An assessment of the value of PMI and manufacturing sector growth in predicting overall economic output (GDP) in South Africa. Int. J. EBusiness EGovernment Stud. 2019, 11, 191–206. [Google Scholar] [CrossRef]
  11. Wei, Y.; Bai, L.; Yang, K.; Wei, G. Are Industry-Level Indicators More Helpful to Forecast Industrial Stock Volatility? Evidence from Chinese Manufacturing Purchasing Managers Index. J. Forecast. 2021, 40, 17–39. [Google Scholar] [CrossRef]
  12. Cziráky, D.; Sambt, J.; Rovan, J.; Puljiz, J. Regional Development Assessment: A Structural Equation Approach. Eur. J. Oper. Res. 2006, 174, 427–442. [Google Scholar] [CrossRef]
  13. Raiser, M.; Di Tommaso, M. The Measurements and Determinants of Institutional Change: Evidence from Transition Economies; 2001. Available online: https://www.ebrd.com/downloads/research/economics/workingpapers/wp0060.pdf (accessed on 16 May 2023).
  14. Baker, S.R.; Bloom, N.; Davis, S.J. Measuring Economic Policy Uncertainty. Q. J. Econ. 2016, 131, 1593–1636. [Google Scholar] [CrossRef]
  15. Gulen, H.; Ion, M. Policy Uncertainty and Corporate Investment. Rev. Financ. Stud. 2016, 29, 523–564. [Google Scholar] [CrossRef] [Green Version]
  16. Davis, S.J. An Index of Global Economic Policy Uncertainty; National Bureau of Economic Research: Cambridge, MA, USA, 2016. [Google Scholar]
  17. Baker, S.R.; Bloom, N.; Davis, S.J. Has Economic Policy Uncertainty Hampered the Recovery? In Government Policies and the Delayed Economic Recovery; Hoover Institution: Stanford, CA, USA, 2012. [Google Scholar]
  18. Stock, J.H.; Watson, M.W. Disentangling the Channels of the 2007–2009 Recession; National Bureau of Economic Research: Cambridge, MA, USA, 2012. [Google Scholar]
  19. Collins, A.; Florin, M.-V.; Renn, O. COVID-19 Risk Governance: Drivers, Responses and Lessons to Be Learned. J. Risk Res. 2020, 23, 1073–1082. [Google Scholar] [CrossRef]
  20. Zhang, J. The changing trend and internal law of the proportion of China’s manufacturing added value in GDP. J. Explor. Controv. 2021, 379, 57–72+181+178. [Google Scholar]
  21. Zhou, R.; Tang, D.; Da, D.; Chen, W.; Kong, L.; Boamah, V. Research on China’s Manufacturing Industry Moving towards the Middle and High-End of the GVC Driven by Digital Economy. Sustainability 2022, 14, 7717. [Google Scholar] [CrossRef]
  22. Wang, L.; Wei, L. Low-End Locking or Crowding-out Effects-An Empirical Analysis of China’s Manufacturing Industry Embedded in GVCS. J. Trans Bus. Econ. 2018, 17, 216–236. [Google Scholar]
  23. Kimble, C.; Wang, H. China’s New Energy Vehicles: Value and Innovation. J. Bus. Strategy 2013, 34, 13–20. [Google Scholar] [CrossRef] [Green Version]
  24. Wang, S. Exploring the Sustainability of China’s New Energy Vehicle Development: Fresh Evidence from Population Symbiosis. Sustainability 2022, 14, 10796. [Google Scholar] [CrossRef]
  25. Xu, B.; Lin, B. Assessing the Development of China’s New Energy Industry. Energy Econ. 2018, 70, 116–131. [Google Scholar] [CrossRef]
  26. Council, N.R. Rising to the Challenge: U.S. Innovation Policy for the Global Economy; National Academies Press: Washington, DC, USA, 2012; ISBN 978-0-309-25551-6. [Google Scholar]
  27. Appelbaum, E. Manufacturing Advantage: Why High-Performance Work Systems Pay Off; Cornell University Press: Ithaca, NY, USA, 2000; ISBN 978-0-8014-3765-6. [Google Scholar]
  28. Behun, M.; Gavurová, B.; Tkáčová, A.; Kotaskova, A. The impact of the manufacturing industry on the economic cycle of European Union countries. J. Compet. 2018, 10, 23–39. [Google Scholar] [CrossRef] [Green Version]
  29. Fasanya, I.O.; Oyewole, O.J.; Agbatogun, T. How Does Economic Policy Uncertainty Connect with the Volatility Spillovers in Asia-Pacific Markets? Asian Econ. Lett. 2021, 2. [Google Scholar] [CrossRef]
  30. Masona, C.; Sakarombe, U.; Nyawo, T.; Dube, B. Role of COVID-19 pandemic and global economic policy uncertainty on firms’ participation in innovation: An empirical study in sub-Saharan Africa SMES. Gap iNterdisciplinarities 2022, 5, 123–129. [Google Scholar]
  31. Istiak, K.; Serletis, A. Economic Policy Uncertainty and Real Output: Evidence from the G7 Countries. Appl. Econ. 2018, 50, 4222–4233. [Google Scholar] [CrossRef]
  32. Arouri, M.; Estay, C.; Rault, C.; Roubaud, D. Economic Policy Uncertainty and Stock Markets: Long-Run Evidence from the US. Financ. Res. Lett. 2016, 18, 136–141. [Google Scholar] [CrossRef]
  33. Nilavongse, R.; Michal, R.; Uddin, G.S. Economic Policy Uncertainty Shocks, Economic Activity, and Exchange Rate Adjustments. Econ. Lett. 2020, 186, 108765. [Google Scholar] [CrossRef]
  34. Chen, L.; Du, Z.; Hu, Z. Impact of Economic Policy Uncertainty on Exchange Rate Volatility of China. Financ. Res. Lett. 2020, 32, 101266. [Google Scholar] [CrossRef]
  35. Nguyen, C.P.; Le, T.-H.; Su, T.D. Economic Policy Uncertainty and Credit Growth: Evidence from a Global Sample. Res. Int. Bus. Financ. 2020, 51, 101118. [Google Scholar] [CrossRef]
  36. Phan, D.H.B.; Iyke, B.N.; Sharma, S.S.; Affandi, Y. Economic Policy Uncertainty and Financial Stability—Is There a Relation? Econ. Model. 2021, 94, 1018–1029. [Google Scholar] [CrossRef]
  37. Sahinoz, S.; Erdogan Cosar, E. Economic Policy Uncertainty and Economic Activity in Turkey. Appl. Econ. Lett. 2018, 25, 1517–1520. [Google Scholar] [CrossRef]
  38. Demir, E.; Gozgor, G.; Lau, C.K.M.; Vigne, S.A. Does Economic Policy Uncertainty Predict the Bitcoin Returns? An Empirical Investigation. Financ. Res. Lett. 2018, 26, 145–149. [Google Scholar] [CrossRef] [Green Version]
  39. Fang, L.; Bouri, E.; Gupta, R.; Roubaud, D. Does Global Economic Uncertainty Matter for the Volatility and Hedging Effectiveness of Bitcoin? Int. Rev. Financ. Anal. 2019, 61, 29–36. [Google Scholar] [CrossRef]
  40. Pirgaip, B.; Dinçergök, B. Economic Policy Uncertainty, Energy Consumption and Carbon Emissions in G7 Countries: Evidence from a Panel Granger Causality Analysis. Environ. Sci. Pollut. Res. 2020, 27, 30050–30066. [Google Scholar] [CrossRef] [PubMed]
  41. Huang, H.; Ali, S.; Solangi, Y.A. Analysis of the Impact of Economic Policy Uncertainty on Environmental Sustainability in Developed and Developing Economies. Sustainability 2023, 15, 5860. [Google Scholar] [CrossRef]
  42. Adams, S.; Adedoyin, F.; Olaniran, E.; Bekun, F.V. Energy Consumption, Economic Policy Uncertainty and Carbon Emissions; Causality Evidence from Resource Rich Economies. Econ. Anal. Policy 2020, 68, 179–190. [Google Scholar] [CrossRef]
  43. Nakhli, M.S.; Shahbaz, M.; Jebli, M.B.; Wang, S. Nexus between Economic Policy Uncertainty, Renewable & Non-Renewable Energy and Carbon Emissions: Contextual Evidence in Carbon Neutrality Dream of USA. Renew. Energy 2022, 185, 75–85. [Google Scholar]
  44. Yu, J.; Shi, X.; Guo, D.; Yang, L. Economic Policy Uncertainty (EPU) and Firm Carbon Emissions: Evidence Using a China Provincial EPU Index. Energy Econ. 2021, 94, 105071. [Google Scholar] [CrossRef]
  45. Luo, X.; Yu, M.; Jin, Y. The Impact of Economic Policy Uncertainty on Enterprise Green Innovation: A Study on the Moderating Effect of Carbon Information Disclosure. Sustainability 2023, 15, 4915. [Google Scholar] [CrossRef]
  46. Khan, Y.; Hassan, T.; Kirikkaleli, D.; Xiuqin, Z.; Shukai, C. The Impact of Economic Policy Uncertainty on Carbon Emissions: Evaluating the Role of Foreign Capital Investment and Renewable Energy in East Asian Economies. Environ. Sci. Pollut. Res. 2022, 29, 18527–18545. [Google Scholar] [CrossRef]
  47. Yu, H.; Fang, L.; Sun, W. Forecasting Performance of Global Economic Policy Uncertainty for Volatility of Chinese Stock Market. Phys. Stat. Mech. Appl. 2018, 505, 931–940. [Google Scholar] [CrossRef]
  48. Yu, M.; Song, J. Volatility Forecasting: Global Economic Policy Uncertainty and Regime Switching. Phys. Stat. Mech. Appl. 2018, 511, 316–323. [Google Scholar] [CrossRef]
  49. Qin, M.; Su, C.-W.; Xiao, Y.-D.; Zhang, S. Should Gold Be Held under Global Economic Policy Uncertainty? J. Bus. Econ. Manag. 2020, 21, 725–742. [Google Scholar] [CrossRef] [Green Version]
  50. Long, S.; Li, J.; Luo, T. The Asymmetric Impact of Global Economic Policy Uncertainty on International Grain Prices. J. Commod. Mark. 2022, 30, 100273. [Google Scholar]
  51. Yu, Z.; Qian, L. Research on the dynamic correlation between U.S. manufacturing PMI and GDP growth rate. J. Times Financ. 2012, 499, 278. [Google Scholar]
  52. Yanik, R.; Osman, A.B.; Ozturk, O. Impact of Manufacturing PMI on Stock Market Index: A Study on Turkey. SSRN. Available online: https://papers.ssrn.com/sol3/papers.cfm?abstract_id=3743277 (accessed on 5 July 2023).
  53. Shaikh, I. On the Relation between Purchasing Manager’s Index and Trade Policy Uncertainty: Evidence from China, Japan and the USA. J. Chin. Econ. Foreign Trade Stud. 2021, 14, 202–223. [Google Scholar] [CrossRef]
  54. Zhang, H.; Jiang, Z.; Gao, W.; Yang, C. Time-Varying Impact of Economic Policy Uncertainty and Geopolitical Risk on Tourist Arrivals: Evidence from a Developing Country. Tour. Manag. Perspect. 2022, 41, 100928. [Google Scholar] [CrossRef]
  55. Gu, X.; Zhu, Z.; Yu, M. The Macro Effects of GPR and EPU Indexes over the Global Oil Market—Are the Two Types of Uncertainty Shock Alike? Energy Econ. 2021, 100, 105394. [Google Scholar] [CrossRef]
  56. Zhang, B.; Ma, J.; Khan, M.A.; Repnikova, V.; Shidlovskaya, K.; Barykin, S.; Ahmad, M.S. The Effect of Economic Policy Uncertainty on Foreign Direct Investment in the Era of Global Value Chain: Evidence from the Asian Countries. Sustainability 2023, 15, 6131. [Google Scholar] [CrossRef]
  57. Feng, Z.; Xiyuan, L.; Lidong, W.; Xile, Y. Product Innovation or Service Transformation: Economic Policy Uncertainty and Manufacturing Innovation Choice. J. Chin. Ind. Econ. 2019, 7, 101–118. [Google Scholar]
  58. Xia, G.; Yong, C.; Shi, P. Economic Policy Uncertainty and Innovation—Based on the Empirical Analysis of my country’s Listed Companies. J. Econ. Res. 2018, 53, 109–123. [Google Scholar]
  59. He, F.; Ma, Y.; Zhang, X. How Does Economic Policy Uncertainty Affect Corporate Innovation?—Evidence from China Listed Companies. Int. Rev. Econ. Financ. 2020, 67, 225–239. [Google Scholar] [CrossRef]
  60. Gächter, M.; Geiger, M.; Stöckl, S. Credit Intermediation and the Transmission of Macro-Financial Uncertainty: International Evidence. J. Int. Money Financ. 2020, 108, 102152. [Google Scholar] [CrossRef] [Green Version]
  61. Caggiano, G.; Castelnuovo, E.; Figueres, J.M. Economic Policy Uncertainty Spillovers in Booms and Busts. Oxf. Bull. Econ. Stat. 2020, 82, 125–155. [Google Scholar] [CrossRef]
  62. Li, H.; Li, Q.; Huang, X.; Guo, L. Do Green Bonds and Economic Policy Uncertainty Matter for Carbon Price? New Insights from a TVP-VAR Framework. Int. Rev. Financ. Anal. 2023, 86, 102502. [Google Scholar] [CrossRef]
  63. Gao, H.W. Chinese-style modernization and industrial chain resilience: Historical logic, theoretical basis and countermeasures. J. Contemp. Econ. Manag. 2023, 45, 11–19. [Google Scholar]
  64. Li, L.S.; Shi, X.A.; Liu, J. 40 years of China’s manufacturing industry: The process and prospect of intelligentization. J. China Soft Sci. 2019, 1–9+30. [Google Scholar]
  65. Li, X.H. The Supporting Basis of Industrial Chain Resilience: Based on the Perspective of Industrial Embeddedness. J. Gansu Soc. Sci. 2022, 180–189. [Google Scholar]
  66. Deng, Z.L. Sino-US trade friction from the perspective of Sino-US trade structure. J. China Circ. Econ. 2018, 32, 80–92. [Google Scholar] [CrossRef]
  67. Ding, C.; Chen, T.H. China-U.S.-EU manufacturing competition: Status quo, policy responses and prospects. J. Eur. Stud. 2021, 39, 5–35. [Google Scholar]
  68. Lv, J.; Xiang, L. Empirical Analysis of Bilateral Trade Complementarity between China and the USA. In Proceedings of the 2010 International Conference on Management and Service Science, Wuhan, China, 24–26 August 2010; IEEE: Piscataway, NJ, USA, 2010; pp. 1–6. [Google Scholar]
  69. Sims, C.A. Macroeconomics and Reality. Econometrica 1980, 48, 1–48. [Google Scholar] [CrossRef] [Green Version]
  70. Primiceri, G.E. Time Varying Structural Vector Autoregressions and Monetary Policy. Rev. Econ. Stud. 2005, 72, 821–852. [Google Scholar] [CrossRef] [Green Version]
  71. Nakajima, J. Time-Varying Parameter VAR Model with Stochastic Volatility: An Overview of Methodology and Empirical Applications. Monet. Econ. Stud. 2011, 29, 107–142. [Google Scholar]
  72. Bai, Y.; Wang, C.; Zhang, L. Impact of Imported Dairy Products on China’s Raw Milk Production. J. Intell. Fuzzy Syst. 2022, 43, 7511–7524. [Google Scholar] [CrossRef]
Figure 1. Status of changes in global economic policy uncertainty (GEPU) and manufacturing purchasing managers’ index (PMI). Note: The dotted line represents the time point of the outbreak of the international event we chose. PMI-CN means China’s manufacturing purchasing managers’ index; PMI-US means the US’s manufacturing purchasing managers’ index; PMI-EU means the EU’s manufacturing purchasing managers’ index.
Sustainability 15 11217 g001
Figure 2. Equal interval dynamic impulse response of manufacturing purchasing managers’ index (PMI) to global economic policy uncertainty (GEPU).
Sustainability 15 11217 g002
Figure 3. Time point impulse response of manufacturing purchasing managers’ index (PMI) to global economic policy uncertainty (GEPU). Note: 2009.12 represents the European debt crisis; 2018.3 represents the China–United States trade war; 2019.12 represents the COVID-19 pandemic; and 2022.2 represents Russia–Ukraine conflict.
Sustainability 15 11217 g003
Figure 4. Robustness test: equal interval impulse response results.
Sustainability 15 11217 g004
Figure 5. Robustness test: time point impulse response results.
Sustainability 15 11217 g005
Table 1. Descriptive statistics.
VariableNMeanStdMinMaxSkewnessKurtosis
GEPU175175.9855397.80879.854437.2380.9112.990
CN17550.8736.18035.759.2−1.67814.59
US17553.63830.70832.464.7−1.0504.866
EU17551.41533.29033.463.4−0.7294.350
Table 2. Stationary test.
VariableADF Test StatisticProb. *PP Test StatisticProb. *
LNCN−5.6905360.0000−6.9137050.0000
ΔLNCN−10.0511500.0000−22.5480400.0000
LNEU−2.7198340.0727−2.8613980.0521
ΔLNEU−9.2760440.0000−9.2795640.0000
LNUS−2.7492210.0679−3.0534980.0321
ΔLNUS−12.3314300.0000−12.3405200.0000
LNGEPU−4.9654040.0004−4.8423200.0006
ΔLNGEPU−16.2953400.0000−19.8657300.0000
Note: * MacKinnon (1996) one-sided p-values; PP test: Phillips and Perron test; ADF test: augmented Dickey–Fullert test.
Table 3. Lag length criteria.
LagLogLLRFPEAICSCHQ
1986.3979NA1.29 × 10−10−11.41645−11.12131−11.29668
21028.41680.081879.53 × 10−11−11.72254−11.13228−11.48302
31074.66985.974976.68 × 10−11 *−12.07845 *−11.19305 *−11.71917 *
41088.18724.492976.89 × 10−11−12.04926−10.86873−11.57022
51103.39126.83033 *6.97 × 10−11−12.0399−10.56423−11.44109
Note: * indicates lag order selected by the criterion. LR: sequential modified LR test statistic (each test at 5% level); FPE: Final prediction error; AIC: Akaike information criterion; SC: Schwarz information criterion; HQ: Hannan–Quinn information criterion.
Table 4. Johansen cointegration test.
Hypothesized No. of CE (s)EigenvalueTrace Statistic0.05 Critical ValueProb. **
None *0.31098895.7725847.856130
At most 1 *0.09818531.703229.797070.0298
At most 20.0629513.927715.494710.0849
At most 30.0158292.7444193.8414660.0976
Note: * denotes the rejection of the hypothesis at the 0.1 level. ** denotes the rejection of the hypothesis at the 0.05 level.
Disclaimer/Publisher’s Note: The statements, opinions and data contained in all publications are solely those of the individual author(s) and contributor(s) and not of MDPI and/or the editor(s). MDPI and/or the editor(s) disclaim responsibility for any injury to people or property resulting from any ideas, methods, instructions or products referred to in the content.

