Abstract
The majority of energy consumption is attributed to buildings. Buildings designed with environmentally sustainable features have the potential to reduce energy consumption. The demolition of ecologically detrimental structures incurs expenses and damages the natural environment. The act of constructing models for the purpose of destruction was deemed superfluous. The replication of the structural model was accompanied by a modification of the design, and a variety of tactics were employed. The proposed upgrades for the building include the installation of new windows, incorporation of greenery on the walls and roof, implementation of insulation, and integration of solar panels in a four-story residential building in Najran, Saudi Arabia. Simultaneously installing insulation prior to changing windows will ensure that the energy consumption of the building, green wall, or green roof will remain unaffected. The installation of solar panels on the walls and top roof of a structure has the potential to generate a monthly electricity output up to two times greater than the structure’s consumption. The spas can be heated on a daily basis by substituting the heating system with solar collectors. The implementation of sustainable building practices has resulted in a significant reduction in energy consumption. Specifically, electricity, gas, heating, and cooling consumption decreased by 11%, 85%, 28%, and 83%, respectively.
1. Introduction
The utilization of fossil fuels has presented significant challenges on a global scale, with particular implications for the Middle East region [1,2]. These challenges encompass a range of factors, including environmental, economic, and political concerns [3]. Buildings are responsible for 60% of the world’s total energy consumption and make a significant contribution to the production and expansion of greenhouse gases [4,5]. The exploration of energy resources and renewable energy sources has been subject to re-evaluation, presenting three prominent avenues for consideration. Another example is the optimization of consumption through a reduction in demand. The act of maximizing consumption has the potential to decrease the demand for resources derived from fossil fuels, thereby preserving these resources. Additionally, it serves as a foundation for the utilization of alternative resources [6,7]. Energy consumption, air pollution, and greenhouse gas emissions will be greatly influenced by urban development [8,9]. A reduction in energy consumption in the construction and housing sectors would yield environmental benefits by decreasing overall energy consumption.
The implementation of energy conservation measures and the reduction in fossil fuel usage are expected to yield positive outcomes for both the economy and environment [10]. In the subsequent paragraphs, we shall examine the potential of sustainable and green architecture to mitigate building energy consumption through environmentally conscious means. Contemporary designers and architects are increasingly embracing the principles of green architecture, alternatively referred to as sustainable architecture. Sustainable architecture is characterized by its environmentally friendly attributes [11,12]. The majority of global energy consumption is attributed to residential heating and cooling systems. Consequently, there has been a significant surge in the adoption of sustainable energy sources, specifically within the context of residential buildings, with the aim of mitigating overall energy consumption in these structures. Large green roof systems are highly effective at conserving energy. This intervention has been found to enhance both individual health outcomes, the aesthetic appeal of residential spaces, and the overall ecological footprint [13].
Green buildings have been shown to have a positive impact on the health, well-being, and productivity of their occupants. Previous studies have extensively explored this subject matter from multiple perspectives and employed diverse research approaches [14,15]. The analysis focused solely on the cooling load associated with the green wall and apertures in seven hypothetical building alternatives. The heat and cold load of a building were investigated through the examination of vegetation as a passive system [16,17]. Mirlohi et al. [18] presents a strategy for achieving net-zero energy in buildings (NZEB) in a hot and dry climate, specifically in the region of Yazd, Iran. The study includes a comparative analysis between a net-zero-energy building and a conventional house. The implementation of various measures such as advancements in wall insulation, the use of efficient heating and cooling equipment, the adoption of solar energy, and the utilization of energy storage devices can effectively address the issue of balancing energy supply and demand.
A collaborative effort has been undertaken by a multitude of architects, engineers, and construction firms to ensure the provision of electrical power to the structure through the utilization of alternative energy sources [19]. For instance, enterprises seeking the most suitable solar collector variant to align a structure with NZEB standards, as well as those considering diverse scenarios encompassing distinct physical attributes and thermal capabilities, have identified the optimal model that offers a favorable return on investment. Consequently, investments in the emerging energy sector have become justifiable [20,21,22].
The attainment of NZEB is an imminent and imperative strategy in the foreseeable future, owing to the constraints associated with fossil fuel-based energy sources. The implementation of new environmentally friendly buildings is one of the proposed solutions. Nevertheless, engineers encounter a significant obstacle in the form of transforming pre-existing structures into environmentally sustainable buildings. The implementation of green buildings involves significant financial implications, primarily due to the substantial costs associated with demolishing existing structures and constructing new ones. Additionally, the process of demolishing current buildings carries numerous environmental ramifications. Hence, the conversion of existing buildings into structures with zero energy consumption, while preserving the integrity of the original edifice, may present a viable solution. Hence, this study aims to examine the potential transformation of a four-story residential building situated in Najran, Saudi Arabia, by evaluating four novel strategies within various scenarios. The proposed strategies encompass the replacement of the building’s windows and doors, the implementation of wall insulation, the incorporation of green walls and roofs, the utilization of solar panels for electricity generation, and the substitution of the building’s heating and cooling system with a contemporary alternative. The strategies employed in the study area were deemed suitable given the prevailing environmental conditions, available resources, and economical considerations. The simulation process has involved the utilization of DesignBuilder and Energy Plus tools.
2. Case Study
The subject of investigation is a residential building located in Najran, Saudi Arabia, comprising four stories. Figure 1 depicts the spatial arrangement of the building under investigation in a sequential manner. The orientation of the building’s facade is toward the southern direction, while the northern side of the building diverges 10 degrees westward from the true north per geographical coordinates. The structure is situated in a geographical position characterized by a latitude of 17.52 degrees and a longitude of 44.49 degrees.
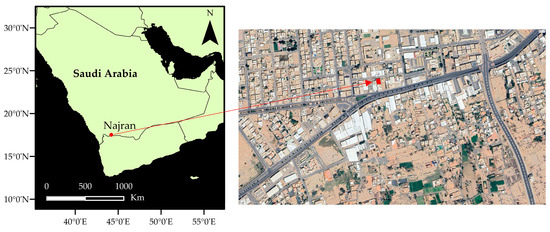
Figure 1.
Location of case study.
The power of individual devices can be determined by referencing the catalog or energy label associated with the building devices. Additionally, the power consumption pattern of the electrical load can be computed by considering the power value of each device and the duration of consumption. The exterior walls of this structure comprise 22 cm thick bricks, whereas the majority of the interior walls comprise 11 cm thick bricks. The inner surface of the walls is covered with plaster or tiles, while the north and south faces are covered with white granite.
3. Materials and Methods
For simulating the building structure, material, and energy consumption, DesignBuilder and Energy Plus tools were utilized. DesignBuilder is an environment for graphical modeling in addition to functioning as a computing engine, comparable to Energy Plus [23]. One of the advantages of utilizing this program is that it does not require the user to exit the software environment to perform simultaneous computations and sketching operations. DesignBuilder is one of the most reliable and up-to-date tools available anywhere in the world for modeling the impact that a building will have on its surrounding environment in terms of its energy consumption [24]. DesignBuilder can simulate the structure from a variety of viewpoints, such as building physics and architecture, as well as predict the amount of daylight entering the building, simulate flow using computational fluid dynamics, and predict cooling, heating, and lighting systems.
To make the building more environmentally friendly, potential solutions should be offered in the form of strategies. First, potential solutions to reducing the heat and cold load on the structure by, among other things, modifying the building’s walls and windows were analyzed [25]. As a building’s cold and heat loads decrease, the overall energy consumption also decrease. Subsequently, solar energy was replaced with energy derived from fossil fuels. Each stage is broken down into multiple strategies and potential outcomes from which the optimal choice is selected. Finally, the structure possessing the most desirable alternatives was modified, and the degree to which it adhered to environmentally friendly building practices was evaluated. The strategy information is listed in Table 1.

Table 1.
The overview of the strategies and scenarios implemented in to building.
The selection of solutions to convert the building into a zero-energy building is contingent upon various criteria. Several factors can be considered in relation to the suitability of the building in Najran’s environment and weather conditions, the accessibility of equipment and materials for construction purposes, the potential for future development and expansion, such as the incorporation of solar panels, and the economic feasibility of the project. The four strategies employed in this study are described in detail below.
3.1. Strategy 1
The frame of the building’s major windows is iron and the reflex glass is single-paned. One of the practices that indicate an increase in thermal load capital and capital in such windows is changing the window frame to UPVC [26,27]. The following changes were made: (1) replacing the iron used to form the frame of the building with UPVC, (2) updating all of the building’s windows to those with UPVC frames, double panes, and no reflexes, and (3) adding new doors. All of the building’s glass can be converted into double-glazed glass without a reflex on the south front and double-glazed glass with a reflex on the north front, while all of the building’s windows can be converted into to triple-glazed glass without reflection automatic inside curtains can be utilized and fixed window awnings can be utilized for the main structure (Figure 2).
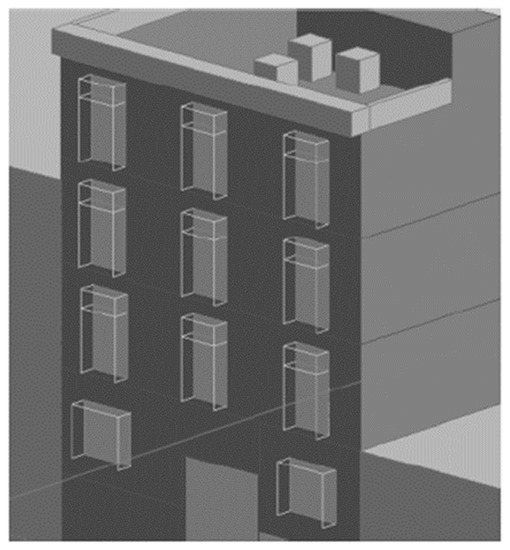
Figure 2.
View of the windows on the south side with a fixed canopy.
3.2. Strategy 2
This method can be implemented by providing green cover to the building. This is carried out for two reasons: first, to lower the cold and heat load of the structure, and second, to approach the sustainability standards from this perspective owing to the environmental effects of this cover [28].
Green cover refers to the use of plants as a cover on the outside of a structure [29]. This approach is broken down into three scenarios: first, all of the building walls are assumed to be covered with a 22 cm layer of green wall; in another scenario, a 22 cm layer of green roof is placed on the roof; and in yet another scenario, both the roof and the walls are green.
3.3. Strategy 3
The goal of this method is to use solar energy to power buildings. Building electrical fuels, as previously discussed, are used for lighting, office equipment, cooling, and ventilation, as well as gas for heating, hot water supply, and cooking. This technique investigates the ability of a building to generate electrical energy. Solar panels generate power, whereas solar water heaters generate hot water [30,31].
First, the external sections of the building that have the potential to install solar panels are covered with these panels using this technique. Because the water cooler is located at the back of this building, not all of the backup area can be used to install solar panels; therefore, we tried to use the most available space to install solar panels [32]. It is well-known that proper orientation, installation, construction, and design allow for the optimal efficiency of solar collectors (heat panels and panels). However, the effectiveness of a solar collector is determined by its direction (relative to the equator) and inclination angle with respect to the sun. Because it affects both parameters of solar radiation that reach the collector’s surface, the horizon level is measured with regard to the Earth [33].
The ideal direction towards the south for Najran is calculated to be 57.5° in cold seasons and 35.1° in hot seasons relative to the horizon [34]. The angles of the panels should be altered every month to achieve better outcomes. However, the presence of bases to adjust the proper inclination takes up a lot of space. Therefore, we investigated a mode (PV-R1) where the angle of the panels was zero degrees; however, because the bases available on the market were 45°, this mode was also in use. The location of the panel installation on the roof (PV-R2) is shown in Figure 3.
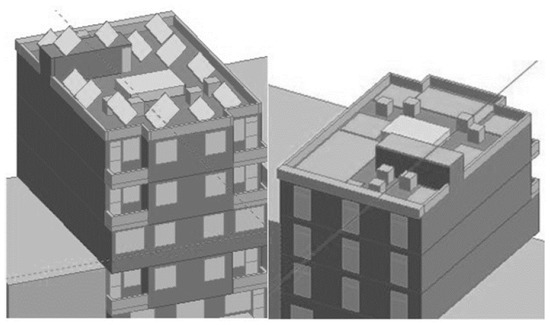
Figure 3.
Solar panels are mounted on the backrest at a zero angle (R1) and a 90-degree angle (R2).
Solar panels were mounted on the external walls to determine the maximum power generation capacity owing to the placement of panels in the building, and the quantity of production from each was estimated independently [35,36]. Figure 4 shows the placement of panels on the wall.
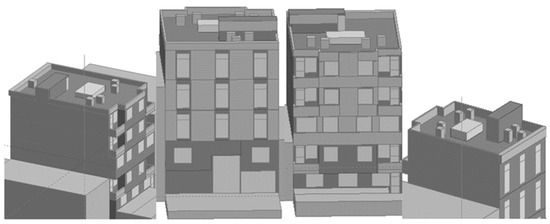
Figure 4.
Solar panel placement on the building’s walls, from right to left (east wall, W1; south wall, W2; north wall, W3; west wall, W4).
3.4. Strategy 4
This strategy investigates the ability of a building to reduce gas usage. To generate hot water, a solar water heater is employed, and upgrading the heating system can lower the need for gas. Two scenarios were examined for this purpose; the new fan coil scenario uses a fan coil instead of a heater, and the new radiator scenario uses a heated radiator instead of a heater. In all instances, the spa is provided by a solar water heater with a surplus provided by the reservation water heater.
4. Results
In this section, each strategy is introduced in the form of different scenarios under the model, and the best scenario of each strategy is introduced and finally executed in a final model.
4.1. Strategy 1
As described in previous section, the implementation of the modification of the glass and frame of windows is the first strategy. The glass and window frames are assumed to change in this scenario. These modifications are implemented in accordance with Table 2.
Table 2.
Strategy 1 scenarios in windows and glass frames.
To begin, to make an accurate assessment of the effects of the alterations, we determined the quantity of solar heat that comes in via the windows. When it comes to warming the air inside a building, it is best to absorb less solar heat during the first half of the year. This is because the sun’s rays are more intense during this time. It is expected that both the quantity of heat that glass loses and the amount of heat that it puts off will decrease over the second half of the year. Figure 5a illustrates the numerical results of heat generated by external windows throughout the course of the year at various temperatures for each of the three possible outcomes detailed in Table 2. Automatic radiation also shields the body from excessive radiation. Even when the wood window frame was replaced with UPVC, no discernible difference was observed in the total amount of heat produced.
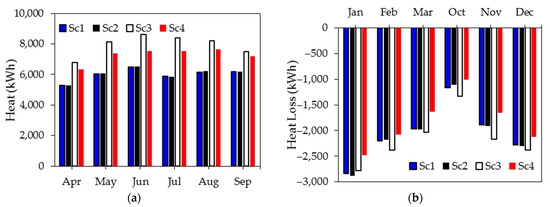
Figure 5.
(a) Heat acquisition from external windows in the spring and summer; (b) heat loss from glass in winter and autumn.
Figure 5b depicts the amount of heat lost from the glass throughout the second half of the year, broken down monthly. It is important to note that the negative sign represents a loss of heat, and that winter is associated with the months of January, February, and March, while fall is associated with the months of October, November, and December. Triple glazing is the optimal choice because it has a lower heat transfer coefficient than that of the other two potential solutions. Therefore, triple glazing was the best-case scenario.
4.2. Strategy 2
Strategy 2 involves using plants to reduce the amount of heating and cooling of the building. The purpose of this strategy was to reduce the heat and cold loads of the building and the use of plants in the building. The different scenarios for this strategy are listed in Table 3.
Table 3.
Specifications of different scenarios for strategy 2.
The top-most layer of the external wall was set aside for the installation of a living wall or green roof. It is important to note that the calculations that are performed in the DesignBuilder program are performed with the premise that the volume of the structure is fixed, that this vegetation is actually the last layer of the external wall, and that the volume of the building’s inner space is lowered. In addition, it is important to note that the calculations performed in the DesignBuilder program are performed with the premise that the volume of the structure is fixed. It is also essential to keep in mind that the Design Builder program performs its calculations on the presumption that the volume of construction will remain unchanged. The volume of the building in the green wall star scenario is less than 1.8% of the actual volume of the building, the volume of the building in the green roof scenario is less than 0.7% of the actual volume of the building, and the volume of the building in the green wall roof scenario is less than 2.5% of the actual volume of the building. After a new material is developed it will also be required to bring in the green roof component. The default values of the software were used for the other characteristics of the vegetation; the height of the vegetation was set to 22 cm, and its leaf area index (LAI) was modified to 1.7. The default values of the software were used for other vegetation parameters. The outcomes of putting the model through its pace by simulating a number of distinct circumstances in various combinations could then be analyzed. It was is feasible to keep track of the quantity of heat released from the structure throughout each of the 12 months of the year, as shown in Figure 6a. The existence of a negative signal lends credence to the hypothesis that heat is lost from the interior of a building to the surrounding environment. The amount of heat brought into the space via the walls should be kept at a minimum. With the green wall and green wall roof, as one may have guessed, this is the case.
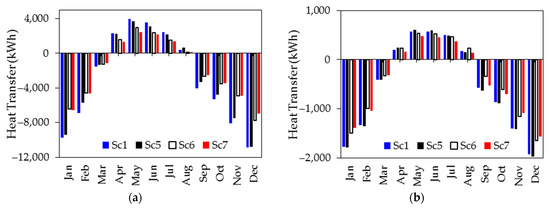
Figure 6.
Total heat transferred from (a) the walls and (b) top roof, in different months of the year.
The amount of heat carried from the back is depicted in Figure 6b, which displays yet another component of the vehicle that may be evaluated. This aspect is related to the vehicles. As anticipated, the amount of heat transferred from the backlight was drastically reduced in the two scenarios involving green roofs and green wall roofs. However, in the case of the green wall, this quantity is extremely low, and during some months, it may even have a detrimental impact.
4.3. Strategy 3
The purpose of the third strategy is to compare the amount of monthly electricity generated according to the location of the panels and to calculate the maximum electricity generated by the building. Table 4 details the different scenarios of this strategy.
Table 4.
Specifications of different scenarios of the strategy 3.
Upon rendering the solar panels on the edifice and implementing the aforementioned scenarios, the monthly electrical output generated from each scenario is depicted in Figure 7. To facilitate a more accurate comparison, the figure also displays the monthly electricity consumption. It is evident that during the months of March, April, May, June, July, and August, the SC11 and SC13 scenarios have the capability to not only provide electricity to the building, but also to export surplus electricity to the grid. Networking is a prerequisite for the SC13 scenario during the months of September and February.
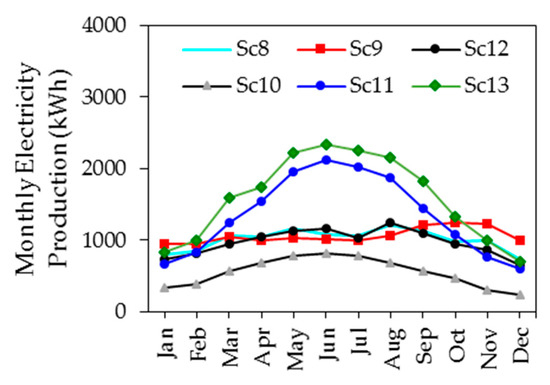
Figure 7.
The monthly electricity production in various scenarios of strategy 4.
4.4. Strategy 4
The goal of this strategy is to use solar energy to generate heating energy and hot water in a building. The remaining gas consumption in a building is related to cooking, for which solar ovens can be used, or for which converting the gas-burning appliances in this section into energy can be carried out, and they can acquire the energy they require from the generated electricity.
For this purpose, it was assumed that the environment of each unit was heated using hot water supplied by solar hot water collectors. The required area of the collectors for the system to be without a water heater was 39 m2. This heating system was changed in two separate scenarios. First, in the new fan coil scenario, it is assumed that a fan coil is used in each unit [37], in and the second one, the new radiator scenario, it is assumed that a hot water radiator is used in each unit [38] (Table 5).
Table 5.
Detailed explanation of the heating system for strategy 4.
Following the implementation of the scenarios in the model, the results of the natural gas consumption (heating and hot water sector) and electricity consumption (cooling sector and pumps and fans) scenarios are comparable with those of the main building, as shown in Figure 8 and Table 6. As can be seen, in these two scenarios, natural gas consumption in the heating and hot water sector is nearly zero, while in the new fan scenario, electricity consumption increases in winter due to the presence of a fan in the fan coil.
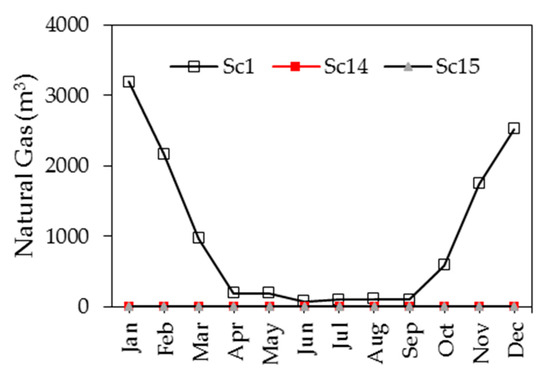
Figure 8.
Comparison of natural gas consumption (heating and hot water sector) values in several scenarios of the fourth strategy.
Table 6.
Power consumption (cooling section, fans, and pumps) in various situations of strategy 4.
The results of comparison between electricity and natural gas consumption in the additional scenario and the main building are presented in Table 7. As can been seen, gas consumption in both scenarios decreases by about 85%; in fact, the consumption of natural gas related to heating and hot water reaches zero. However, due to the fan and pump for the heating system in winter, the amount of electricity consumption in the scenario with a new fan coil reveals a 20.5% increase, but in the Sc15 scenario, the electricity decreases by 3.6%, which can be due to the shading that the collectors have on the roof, and allows the better efficiency of electrical appliances, thus reducing consumption.
Table 7.
A comparison between electricity and natural gas consumption in the additional scenario and the main building.
5. Discussion
This section presents a comparative analysis of the outcomes achieved through various strategies. This phase is conducted subsequent to the energy saving analysis of the preceding scenarios. The optimal scenarios from the previous strategies are implemented concurrently on a simulated model to assess the modified building’s alignment with sustainability criteria. The first strategy remains consistent regardless of the building’s window outcomes, as the observed impact on energy consumption reduction was minimal (less than 5%). It is worth noting that window replacement can be carried out without causing any destruction if necessary. The installation process involved affixing the new frame and glass onto the existing frame.
The SC6 scenario is chosen from the second strategy. Therefore, the entirety of the building is enveloped by a green wall. A layer of polyester insulation measuring 5 cm in thickness is positioned in front of the green wall. The heating system has been modified from a gas heater to a hot water radiator, wherein hot water is supplied by a solar water heater. Additionally, solar panels have been implemented to generate electricity for the building. The third strategy, with respect to the efficiency of the SC13 scenario, indicates that the panels installed on the roof at a 0-degree angle exhibit the highest level of efficiency. The implementation of appropriate strategies has led to a substantial decrease in the utilization of electricity and gas. The consumption of gas undergone a significant reduction of about 85%, while electricity consumption has decreased by 10.39%. Based on the annual electricity production and the assumption that any surplus is sold to the national electricity grid, it can be inferred that the quantity of electricity generated exceeds the demand, amounting to approximately 12,500 kWh. The heat loss of the green building under consideration has been effectively reduced by a significant margin of 35.21%. The distribution of annual heat loss is observed to vary across different sections. Notably, the heat loss from the walls has decreased by 11% in the main building, which is attributed to their green composition. Concurrently, the contribution of glass surfaces and external air infiltration to thermal waste has proportionally increased (Table 8).
Table 8.
A Comparison of thermal and consumption information of the NZEB building and the traditional building.
6. Conclusions
The study building chosen for this research was a residential structure located in the city of Najran, Saudi Arabia. Following the collection of data from the investigated structure, a simulated model was created utilizing DesignBuilder. The analysis of each stage involved the examination of various separation strategies and scenarios. The most optimal options were then chosen, and subsequently, a building was modified based on these options. The extent to which the building aligns with green building principles was assessed. The initial approach involved the identification and application of three distinct scenarios. Similarly, the subsequent approach entailed the utilization of three additional scenarios. Furthermore, the third approach included the implementation of six distinct scenarios, while the final approach involved the application of two scenarios. Subsequently, the outcomes were assessed and evaluated.
After analyzing the monthly heat gain and loss through windows during summer and winter and the building’s cooling and heating load under various conditions, it can be said that replacing the building’s windows does not reduce energy consumption. The best result is inconclusive. The scenario reduces the cooling load by 4.1% compared to that of the primary building. The heating load drops by 3.8%. Green walls reduce heating due to their favorable heat load. This heat load is unfavorable with only a green roof. The green roof does affect winter heating. Green walls slightly increase cooling load, while green roofs reduce it. The findings suggest the addition of green elements to the building simultaneously to optimize results. The third strategy regarding the efficiency of the Sc13 scenario indicates that the most efficient panels are those installed on the roof at a 0° angle. Strategy 4 includes new fan coil and radiator scenarios. Gas consumption in both scenarios has decreased by 85%, and natural gas for heating and hot water has reached zero. However, due to the fan and pump for the heating system in the winter, electricity consumption in the scenario with a new fan coil increases by 20.5%, while in scenario Sc15, it decreases by 3.6%, possibly due to roof shading and improved electrical appliance efficiency. The implementation of sustainable building practices has resulted in a significant reduction in energy consumption. Specifically, electricity, gas, heating, and cooling consumption decreased by 11%, 85%, 28%, and 83%, respectively.
Author Contributions
Conceptualization, H.A. and A.A.-M.; Methodology, H.A.; Software, A.A.-M.; Validation, A.A.-M.; Formal analysis, A.A.-M.; Investigation, H.A. and A.A.-M.; Resources, H.A.; Data curation, A.A.-M.; Writing—review & editing, H.A.; Funding acquisition, H.A. All authors have read and agreed to the published version of the manuscript.
Funding
The research was funded by the Deanship of Scientific Research at Najran University under Research Groups Funding, program grant code NU/RG/SERC/12/16.
Institutional Review Board Statement
Not applicable.
Informed Consent Statement
Not applicable.
Data Availability Statement
Not applicable.
Acknowledgments
The authors are thankful to the Deanship of Scientific Research at Najran University for funding this work under Research Groups Funding, program grant code NU/RG/SERC/12/16.
Conflicts of Interest
The authors declare no conflict of interest.
References
- Voumik, L.C.; Nafi, S.M.; Bekun, F.V.; Haseki, M.I. Modeling Energy, Education, Trade, and Tourism-Induced Environmental Kuznets Curve (EKC) Hypothesis: Evidence from the Middle East. Sustainability 2023, 15, 4919. [Google Scholar] [CrossRef]
- Molajou, A.; Pouladi, P.; Afshar, A. Incorporating Social System into Water-Food-Energy Nexus. Water Resour. Manag. 2021, 35, 4561–4580. [Google Scholar] [CrossRef]
- Koruzhde, M.; Popova, V. Americans Still Held Hostage: A Generational Analysis of American Public Opinion About the Iran Nuclear Deal. Political Sci. Q. 2022, 137, 511–537. [Google Scholar] [CrossRef]
- Zhong, H.; Wang, J.; Jia, H.; Mu, Y.; Lv, S. Vector Field-Based Support Vector Regression for Building Energy Consumption Prediction. Appl. Energy 2019, 242, 403–414. [Google Scholar] [CrossRef]
- Anupong, W.; Muda, I.; AbdulAmeer, S.A.; Al-Kharsan, I.H.; Alviz-Meza, A.; Cárdenas-Escrocia, Y. Energy Consumption and Carbon Dioxide Production Optimization in an Educational Building Using the Supported Vector Machine and Ant Colony System. Sustainability 2023, 15, 3118. [Google Scholar] [CrossRef]
- Beigzadeh, M.; Pourfayaz, F.; Pourkiaei, S.M. Modeling Heat and Power Generation for Green Buildings Based on Solid Oxide Fuel Cells and Renewable Fuels (Biogas). Renew. Energy Res. Appl. 2020, 1, 55–63. [Google Scholar] [CrossRef]
- Hassan, M.K.; Chowdhury, R.; Ghosh, S.; Manna, D.; Pappinen, A.; Kuittinen, S. Energy and Environmental Impact Assessment of Indian Rice Straw for the Production of Second-Generation Bioethanol. Sustain. Energy Technol. Assess. 2021, 47, 101546. [Google Scholar] [CrossRef]
- Franco, A.; Shaker, M.; Kalubi, D.; Hostettler, S. A Review of Sustainable Energy Access and Technologies for Healthcare Facilities in the Global South. Sustain. Energy Technol. Assess. 2017, 22, 92–105. [Google Scholar] [CrossRef]
- Rafiei, A.; Loni, R.; Mahadzir, S.B.; Najafi, G.; Sadeghzadeh, M.; Mazlan, M.; Ahmadi, M.H. Hybrid Solar Desalination System for Generation Electricity and Freshwater with Nanofluid Application: Energy, Exergy, and Environmental Aspects. Sustain. Energy Technol. Assess. 2022, 50, 101716. [Google Scholar] [CrossRef]
- Jahanger, A.; Ozturk, I.; Chukwuma Onwe, J.; Joseph, T.E.; Razib Hossain, M. Do Technology and Renewable Energy Contribute to Energy Efficiency and Carbon Neutrality? Evidence from Top Ten Manufacturing Countries. Sustain. Energy Technol. Assess. 2023, 56, 103084. [Google Scholar] [CrossRef]
- AlTalebi, R.A.; Al-Bazzaz, I. Similarity and Difference between Sustainable and Green Architecture (a Comparative Study). J. Eng. 2018, 24, 21–42. [Google Scholar] [CrossRef]
- Daugelaite, A.; Grazuleviciute-Vileniske, I. The Relationship between Ethics and Aesthetics in Sustainable Architecture of the Baltic Sea Region. Sustainability 2021, 13, 2259. [Google Scholar] [CrossRef]
- Yuan, J.; Patra, I.; Majdi, A.; Ketut Acwin Dwijendra, N.; Jade Catalan Opulencia, M.; Chetthamrongchai, P. Fundamental Green Roof Performance of Residential Building in Desert Climate: In Terms of Sustainability and Decrease in Energy Consumption. Sustain. Energy Technol. Assess. 2022, 53, 102574. [Google Scholar] [CrossRef]
- Versini, P.A.; Gires, A.; Tchiguirinskaia, I.; Schertzer, D. Fractal Analysis of Green Roof Spatial Implementation in European Cities. Urban For. Urban Green. 2020, 49, 126629. [Google Scholar] [CrossRef]
- Zhang, S.; Lin, Z.; Zhang, S.; Ge, D. Stormwater Retention and Detention Performance of Green Roofs with Different Substrates: Observational Data and Hydrological Simulations. J. Environ. Manag. 2021, 291, 112682. [Google Scholar] [CrossRef]
- He, Y.; Yu, H.; Ozaki, A.; Dong, N. Thermal and Energy Performance of Green Roof and Cool Roof: A Comparison Study in Shanghai Area. J. Clean. Prod. 2020, 267, 122205. [Google Scholar] [CrossRef]
- Bollman, M.A.; DeSantis, G.E.; Waschmann, R.S.; Mayer, P.M. Effects of Shading and Composition on Green Roof Media Temperature and Moisture. J. Environ. Manag. 2021, 281, 111882. [Google Scholar] [CrossRef]
- Mirlohi, S.; Sadeghzadeh, M.; Kumar, R.; Ghassemieh, M. Implementation of a Zero-Energy Building Scheme for a Hot and Dry Climate Region in Iran (a Case Study, Yazd). Renew. Energy Res. Appl. 2020, 1, 65–74. [Google Scholar] [CrossRef]
- Fabbri, K.; Tronchin, L.; Barbieri, F. Coconut Fibre Insulators: The Hygrothermal Behaviour in the Case of Green Roofs. Constr. Build. Mater. 2021, 266, 121026. [Google Scholar] [CrossRef]
- Gerzhova, N.; Blanchet, P.; Dagenais, C.; Ménard, S.; Côté, J. Flammability Characteristics of Green Roofs. Buildings 2020, 10, 126. [Google Scholar] [CrossRef]
- Zhang, G.; He, B.-J.; Dewancker, B.J. The Maintenance of Prefabricated Green Roofs for Preserving Cooling Performance: A Field Measurement in the Subtropical City of Hangzhou, China. Sustain. Cities Soc. 2020, 61, 102314. [Google Scholar] [CrossRef]
- Zheng, X.; Zou, Y.; Lounsbury, A.W.; Wang, C.; Wang, R. Green Roofs for Stormwater Runoff Retention: A Global Quantitative Synthesis of the Performance. Resour. Conserv. Recycl. 2021, 170, 105577. [Google Scholar] [CrossRef]
- Y Dahlan, N.; Amiruddin, A.; Duc Luong, N.; Zaharah Sakimin, S. Energy and Climate Analysis of Greenhouse System for Tomatoes Cultivation Using CFD and Open Studio Energy Plus Software. Int. J. Eng. Technol. 2018, 7, 183. [Google Scholar] [CrossRef]
- Al-Qahtani, L.A.H.; Elgizawi, L.S.E. Building Envelope and Energy Saving Case Study: A Residential Building in Al-Riyadh, Saudi Arabia. Int. J. Low-Carbon Technol. 2020, 15, 555–564. [Google Scholar] [CrossRef]
- Naranjo, A.; Colonia, A.; Mesa, J.; Maury, H.; Maury-Ramírez, A. State-of-the-Art Green Roofs: Technical Performance and Certifications for Sustainable Construction. Coatings 2020, 10, 69. [Google Scholar] [CrossRef]
- Riahi Zaniani, J.; Taghipour Ghahfarokhi, S.; Jahangiri, M.; Alidadi Shamsabadi, A. Design and Optimization of Heating, Cooling and Lightening Systems for a Residential Villa at Saman City, Iran. J. Eng. Des. Technol. 2019, 17, 41–52. [Google Scholar] [CrossRef]
- Tushar, Q.; Bhuiyan, M.A.; Zhang, G. Energy Simulation and Modeling for Window System: A Comparative Study of Life Cycle Assessment and Life Cycle Costing. J. Clean. Prod. 2022, 330, 129936. [Google Scholar] [CrossRef]
- Pirouz, B.; Palermo, S.A.; Maiolo, M.; Arcuri, N.; Piro, P. Decreasing Water Footprint of Electricity and Heat by Extensive Green Roofs: Case of Southern Italy. Sustainability 2020, 12, 10178. [Google Scholar] [CrossRef]
- Rafael, S.; Correia, L.P.; Ascenso, A.; Augusto, B.; Lopes, D.; Miranda, A.I. Are Green Roofs the Path to Clean Air and Low Carbon Cities? Sci. Total Environ. 2021, 798, 149313. [Google Scholar] [CrossRef]
- Zhao, L.; Zhang, H.; Wang, Q.; Wang, H. Digital-Twin-Based Evaluation of Nearly Zero-Energy Building for Existing Buildings Based on Scan-to-BIM. Adv. Civ. Eng. 2021, 2021, 6638897. [Google Scholar] [CrossRef]
- Almutairi, K.; Hosseini Dehshiri, S.S.; Hosseini Dehshiri, S.J.; Mostafaeipour, A.; Issakhov, A.; Techato, K. Use of a Hybrid Wind—Solar—Diesel—Battery Energy System to Power Buildings in Remote Areas: A Case Study. Sustainability 2021, 13, 8764. [Google Scholar] [CrossRef]
- Felseghi, R.-A.; Așchilean, I.; Cobîrzan, N.; Bolboacă, A.M.; Raboaca, M.S. Optimal Synergy between Photovoltaic Panels and Hydrogen Fuel Cells for Green Power Supply of a Green Building—A Case Study. Sustainability 2021, 13, 6304. [Google Scholar] [CrossRef]
- Ahmadi, A.; Ehyaei, M.A.; Doustgani, A.; El Haj Assad, M.; Hmida, A.; Jamali, D.H.; Kumar, R.; Li, Z.X.; Razmjoo, A. Recent Residential Applications of Low-Temperature Solar Collector. J. Clean. Prod. 2021, 279, 123549. [Google Scholar] [CrossRef]
- Nijegorodov, N.; Adedoyin, J.A.; Devan, K.R.S. A New Analytical-Empirical Model for the Instantaneous Diffuse Radiation and Experimental Investigation of Its Validity. Renew. Energy 1997, 11, 341–350. [Google Scholar] [CrossRef]
- Alhuyi Nazari, M.; Rungamornrat, J.; Prokop, L.; Blazek, V.; Misak, S.; Al-Bahrani, M.; Ahmadi, M.H. An Updated Review on Integration of Solar Photovoltaic Modules and Heat Pumps towards Decarbonization of Buildings. Energy Sustain. Dev. 2023, 72, 230–242. [Google Scholar] [CrossRef]
- González-González, E.; Martín-Jiménez, J.; Sánchez-Aparicio, M.; Del Pozo, S.; Lagüela, S. Evaluating the Standards for Solar PV Installations in the Iberian Peninsula: Analysis of Tilt Angles and Determination of Solar Climate Zones. Sustain. Energy Technol. Assess. 2022, 49, 101684. [Google Scholar] [CrossRef]
- Aziz, M.; Azman, H.K.; Kadir, K.A.; Vijyakumar, K. Measurement of Air Conditioning and Mechanical Ventilation Command Temperature to Control the Environment of Smart Building. In Proceedings of the 2022 IEEE 8th International Conference on Smart Instrumentation, Measurement and Applications (ICSIMA), Melaka, Malaysia, 26–28 September 2022; pp. 308–312. [Google Scholar]
- Yang, S.; Oliver Gao, H.; You, F. Model Predictive Control for Demand- and Market-Responsive Building Energy Management by Leveraging Active Latent Heat Storage. Appl. Energy 2022, 327, 120054. [Google Scholar] [CrossRef]


Disclaimer/Publisher’s Note: The statements, opinions and data contained in all publications are solely those of the individual author(s) and contributor(s) and not of MDPI and/or the editor(s). MDPI and/or the editor(s) disclaim responsibility for any injury to people or property resulting from any ideas, methods, instructions or products referred to in the content. |
© 2023 by the authors. Licensee MDPI, Basel, Switzerland. This article is an open access article distributed under the terms and conditions of the Creative Commons Attribution (CC BY) license (https://creativecommons.org/licenses/by/4.0/).