Article

Elderly Residents’ Uses of and Preferences for Community Outdoor Spaces during Heat Periods

College of Architecture and Urban Planning, Guangzhou University, Guangzhou 510006, China
*
Author to whom correspondence should be addressed.
Sustainability 2023, 15(14), 11264; https://doi.org/10.3390/su151411264
Submission received: 26 June 2023 / Revised: 16 July 2023 / Accepted: 17 July 2023 / Published: 19 July 2023
(This article belongs to the Topic Sustainable Built Environment)

Abstract

:
The downtown cores of many cities are characterized by aged communities that tend to host a relatively high population of elderly retirement residents. The availability and usage of outdoor spaces within these communities play a crucial role in promoting active aging, providing essential locations for rest, activities, and social interaction among the elderly. However, in the planning and design of these spaces, attention is often focused on the safety and mobility requirements of the elderly population, while a lack of research is apparent in the area of elderly-specific preferences for spaces designed for relaxation and communication. In this study, we selected an aging community as the research target and conducted a detailed investigation of the outdoor spaces where the elderly residents gather and build up spontaneously in summer. Our objective was to evaluate the environmental factors influencing the selection of these outdoor spaces by the elderly for relaxation and communication. We analyzed the correlations between these factors and the number of occupants in these spaces and developed predictive models accordingly. The findings indicate that the environmental factors impacting the utilization of outdoor spaces by the elderly during heat periods within the community are, in order of importance: temperature, relative humidity, human traffic flow, and noise levels. These factors include physical and social aspects; temperature is a negative correlation factor affecting the use of outdoor space by the elderly, and the rest are positive correlation factors. This shows that the elderly like to gather and chat in a cool, crowded, and lively environment. Through the data analysis, it was determined that the random forest regression model was the most effective in predicting the number of residents remaining in these spaces. With a coefficient of determination (R2) of 0.7958, the model can assist in community update planning and design, help in selecting outdoor spaces, and improve the quality of the outdoor environment. This study discusses the factors influencing the elderly’s use of community outdoor space from the physical and social levels, and the prediction model is significant for the optimization of spatial elements and spatial location.

1. Introduction

Globally, populations are aging, a trend that is taking place even more rapidly in urban areas [1]. In the central communities of Guangzhou, China, for example, the percentage of elderly residents has reached 22.5% [2], and this number is growing swiftly. “Urban aging” has emerged as a new direction in the fields of social and health sciences, intersecting with multiple disciplines such as environmental science, psychology, medicine, and urban geography. Older individuals, as a valuable societal resource, should be provided with an urban environment designed with age-friendly spaces and services [3]. A series of initiatives and policies have been established to provide a more age-friendly physical and social environment for the elderly to live healthily in communities [4]. Research on age-friendly cities and communities is continually being advanced, addressing aspects such as housing, transportation, outdoor environments, and technology [5].

1.1. Aging-Friendly Community Outdoor Environment

The outdoor environment has a significant influence on the independence and quality of life of the elderly, affecting their ability to “age in place [5,6,7]”. Outdoor spaces serve as meeting places and support social contacts [8,9]. Studies show that as individuals age, their outdoor activity radius tends to shrink due to decreased mobility, leading to more limited activity spaces. This often results in smaller social networks [10]. Community outdoor spaces can potentially serve as the primary venue for leisure activities for the elderly. They typically prefer to relax, socialize, and converse with neighbors and friends in familiar settings. Researchers Van Melik and Pijpers [11] examined how older residents use and experience public spaces as spaces of encounter in six urban aging environments. Moreover, watching passers-by in the outdoor space is also a meaningful form of social contact [12], particularly for the elderly who lack other forms of social engagement. Therefore, the planning and design of outdoor space for the elderly to provide a comfortable leisure communication environment is particularly important.

1.2. The Planning and Design of Community Outdoor Space

In terms of the planning and layout of outdoor spaces, the World Health Organization (WHO) advocates for the widespread and even distribution of small, quiet, green spaces within age-friendly cities, as opposed to a small number of larger, busier parks [10,13]. Such a distribution structure is conducive to improving space accessibility. Field research has found that the distribution of outdoor spaces in communities where the elderly gather also has similar characteristics, as it may be challenging for older individuals to walk for extended periods without rest [14]. As a result, in contrast to spaces designed for mobility, such as walking, the demand for seating areas in outdoor spaces is more pronounced among the elderly. Seating areas are considered a crucial design element, which includes factors such as the distribution of seating areas within the community, the quantity and material of seats, as well as the presence of greenery and lighting [15]. Suitable planning and design of the outdoor environment may support social interactions and strengthen communities for the aging group [16]. Influenced by a variety of social and physical environmental factors, the principles of outdoor design vary by areas and communities.
Therefore, the purpose of this study is to better understand the preferences of the elderly in hot and humid regions for the use of outdoor leisure spaces through actual case analysis. It aims to identify the primary environmental factors influencing the elderly’s use of outdoor spaces, to guide the planning and design of community outdoor spaces.

2. Theoretical Frameworks

2.1. Environmental Factors Influencing Behavioral Preferences

Historically, physical environmental factors have been recognized as influencing individual behavior, mental and physical health, and quality of life, especially in old age [17]. Some research has focused on the influence of the environmental parameters of outdoor spaces on human behavioral patterns. For instance, the effects of a hot environment on walking behavior and how urban design features stimulate individual and collective walking behavior have been studied [14,18,19]. Both traditional and big data methodologies have been used to assess walking behavior [20,21]. However, fewer studies have addressed the correlation between lingering behavior and the environment, even though lingering behavior, much like walking behavior, is a weather-exposed activity influenced by climatic conditions, environmental comfort, and vitality [18,22].
Occupants’ behaviors in outdoor spaces are profoundly influenced by climatic conditions. This includes elements of the thermal environment [23,24,25,26], such as air temperature, sunlight [27], wind, and humidity [25,28]. Identifying the relationship between space usage and human thermal perception can assist in the creation of more comfortable outdoor environments [29]. For example, people in hot areas are willing to stay under the tree shadows in outdoor spaces, even during the hottest days [30]. The acoustic environment is also a significant factor affecting outdoor environmental comfort, with varying preferences across different age groups [31,32].
Findings also suggest that outdoor spaces differ in terms of spatial form attributes, such as area, open-space ratio, and green plot ratio [33]. Views and physical access to the green outdoor environments help enhance health and reduce stress [28]. Healthy geography provides evidence of how open spaces contribute to improving the health and well-being of the elderly [34,35,36]. To efficiently determine why the elderly choose some specific outdoor spaces, the aforementioned spatial characteristics should be considered as crucial influencing factors. Some researchers regard walkability as a measure of the vibrancy and sociability of an environment. This metric also forms the basis for pedestrians to linger in outdoor spaces and engage in interactions and conversations [37,38]. Enhancing walkability can effectively improve urban vitality and social activity. The pedestrian volume is often used as a measure of walkability [39,40].

2.2. Elderly Residents’s Subjective Preferences for Outdoor Environments

According to research, most elderly individuals choose to age in their own homes rather than in institutions [41]. Communities and neighborhoods significantly impact the capacity for aging in place, with the community environments positively correlating with residence longevity [42]. As noted by Rowles, as people age, they become increasingly aware of and sensitive to their social and physical environments [43]. Furthermore, the older individuals tend to prefer recreational activities within their communities over traveling to more distant city parks [3]. Medical research suggests that the best method to prevent dementia is promoting social interaction among the elderly [44]. Relevant studies show that the elderly are the primary occupants of community outdoor spaces [31]. Aging communities need to provide ample outdoor spaces to promote active aging. Current studies mainly focus on elderly individuals’ behavior in outdoor spaces, which represent passive use and do not entirely reflect the real needs of the elderly for these spaces.
In some densely populated urban centers, the elderly spontaneously repurpose small-scale outdoor spaces within their communities for temporary use [45,46]. Typically, these communities have a high proportion of aging residents, decayed environments, crowded living spaces, and insufficient and unsatisfactory outdoor recreational spaces in terms of both quantity and quality. Through self-built spaces, the elderly naturally express their outdoor environment needs. Compared to the passive space usage, these self-built outdoor spaces more directly reflect the social needs and usage preferences of the elderly in their living environments [15]. However, this issue has received little attention, and there is no relevant research discussing the elderly’s preferences for outdoor space use in relation to this issue. Therefore, this study selected a typical aging community in the Yuexiu District of Guangzhou, China, to investigate several self-built outdoor spaces and discuss the elderly’s usage preferences of the outdoor environment during the hottest days.
Combining the elements discussed in Section 2.1, the environmental factors influencing the elderly residents’ usage preferences include air temperature, wind, humidity, and noise levels, which are the most relevant variables for them to decide to stay in these places [21]. Regarding the form attributes of outdoor spaces, the number of seats is more significant for elderly occupants than the areas. Sky visibility, calculated by the proportion of the sky in spatial elevation, is used to represent the open-space ratio [47]. After considering the correlation and measurement method of each element, pedestrian flow, the number of seats, sky visibility, green visibility, temperature, relative humidity, wind speed, and noise were selected as the eight elements representing the environmental characteristics of outdoor spaces. We analyzed the correlation between each element and the elderly’s use of outdoor spaces [48], exploring the key elements affecting the elderly’s usage preferences for community outdoor spaces.

2.3. Association between Behavioral Preferences and the Environment

Existing studies have not adequately characterized the behavioral impact of the outdoor environment by activity types, age, and gender. For instance, the older adults have a lower sensitivity to hot environments, and their outdoor activities are primarily static [49]. Specialized research in this area can aid in designing specific outdoor spaces. Another issue is the weak causal evidence between outdoor environments and behavioral outcomes [25]. Existing studies primarily relied on traditional observational methods or questionnaires. The former lack long-term records, and the latter are influenced by the subjectivity of the interviewees; both can impact the accuracy of the research [25].
To address these shortcomings, researchers can observe the elderly residents with several fixed video cameras, recording their activities and the duration of their stay in the outdoor spaces. This method efficiently observes them without disturbing their behavior, while the high-quality video data ensure continuity and consistent record keeping [47,50,51]. Simultaneously, it becomes possible to classify the community outdoor space according to the elderly’s activity types from the recordings. This then facilitates a discussion on the relationship between the activities of the elderly and environmental parameters by the types of outdoor spaces.
In terms of the data analysis methods, in 1990, Rotton and others first used a simple linear regression model to establish the association between a hot environment and pedestrian rhythm [52]. Other research has used polynomial models to establish the relationship between weather and human travel behavior [18,53]. Given that the elements influencing human behavior are complex and variable, and their mathematical relationship is nonlinear, the advancement of machine learning algorithms has attracted widespread attention for establishing the association model between human behavior and the environment [54,55,56]. However, the strengths and weaknesses of various machine learning algorithms in the correlation model of human behavior and the environment have not yet been assessed. Furthermore, the discussion on the application of the model in specific scenarios is not in-depth enough.

2.4. Aim of This Study

Taking into account these knowledge gaps, this study aims to explore the linkages between the behaviors of elderly individuals in the community and outdoor environmental conditions. The specific objectives are as follows: (1) To gather and analyze outdoor environmental parameters that are associated with the activity behaviors of the elderly in outdoor spaces. (2) To collect and analyze data pertaining to the comfort of the outdoor environment and space form attributes in hot and humid climates. (3) To examine the quantitative relationships between outdoor environmental parameters and the preferences of the elderly, and to analyze these correlations. (4) To evaluate and predict the number of elderly occupants in community outdoor spaces through the environmental parameters that influence them. This survey is primarily characterized by objective measurements of the outdoor environment in the case community.

3. Methodology

3.1. Methodology Overview

This research strategically selected a community environment comprising 15 outdoor spaces during the summer season in Guangzhou. In situ surveys were deployed to collect pertinent climatic and spatial parameters. Onsite interviews were conducted with a number of elderly participants to understand their environmental perceptions and the factors influencing their space selection. Video recordings were utilized to tally the occupancy of the elderly and the pedestrian flows surrounding the outdoor spaces. Based on the collected data, relationships between the outdoor environmental parameters and the space vitality of the elderly were quantitatively analyzed. The results are expected to contribute to a more nuanced understanding of the impacts of community outdoor environments on the choices and behaviors of the elderly across different outdoor spaces. Such information should prove invaluable for improving the community environment, particularly in hot and humid areas.
The technical approach of this study is divided into four steps: (1) Identifying and categorizing outdoor spaces within the case community and filtering key spatial elements; (2) Field research and data collection: drafting floor plans of each public space within the community and measuring space capacity; monitoring the number of occupants staying in each space, the physical environmental parameters, sky visibility and green visibility, as well as the pedestrian flow on nearby roads; (3) Calculating the correlation between the number of elderly participants staying in the space and the environmental factors and arranging key spatial elements influencing public space use behavior in order of correlation strength; (4) Establishing a quantitative model between the number of residents staying in outdoor spaces and the environmental elements with higher correlation, to be used for optimizing design. Please see Figure 1 for the research process.

3.2. Study Area

The Zhuguang community, which was surveyed in this study, is located in the Yuexiu District of Guangzhou. The total area of Guangzhou is 7434.40 square kilometers with a permanent population of 18,734,100, of which Yuexiu District covers an area of 33.8 square kilometers and has a registered population of 1,174,500 in 2021 [57,58]. This area is typically a high-density area with a population density of 34,748 per square kilometer, which is much higher than the average density of Guangzhou (2520 per square kilometer). However, this district contains a large proportion of elderly individuals with a low per capita green area of 5.69 m2, which is much lower than the whole city (17.33 m2) [57,58]. Detailed data are shown in Table 1.
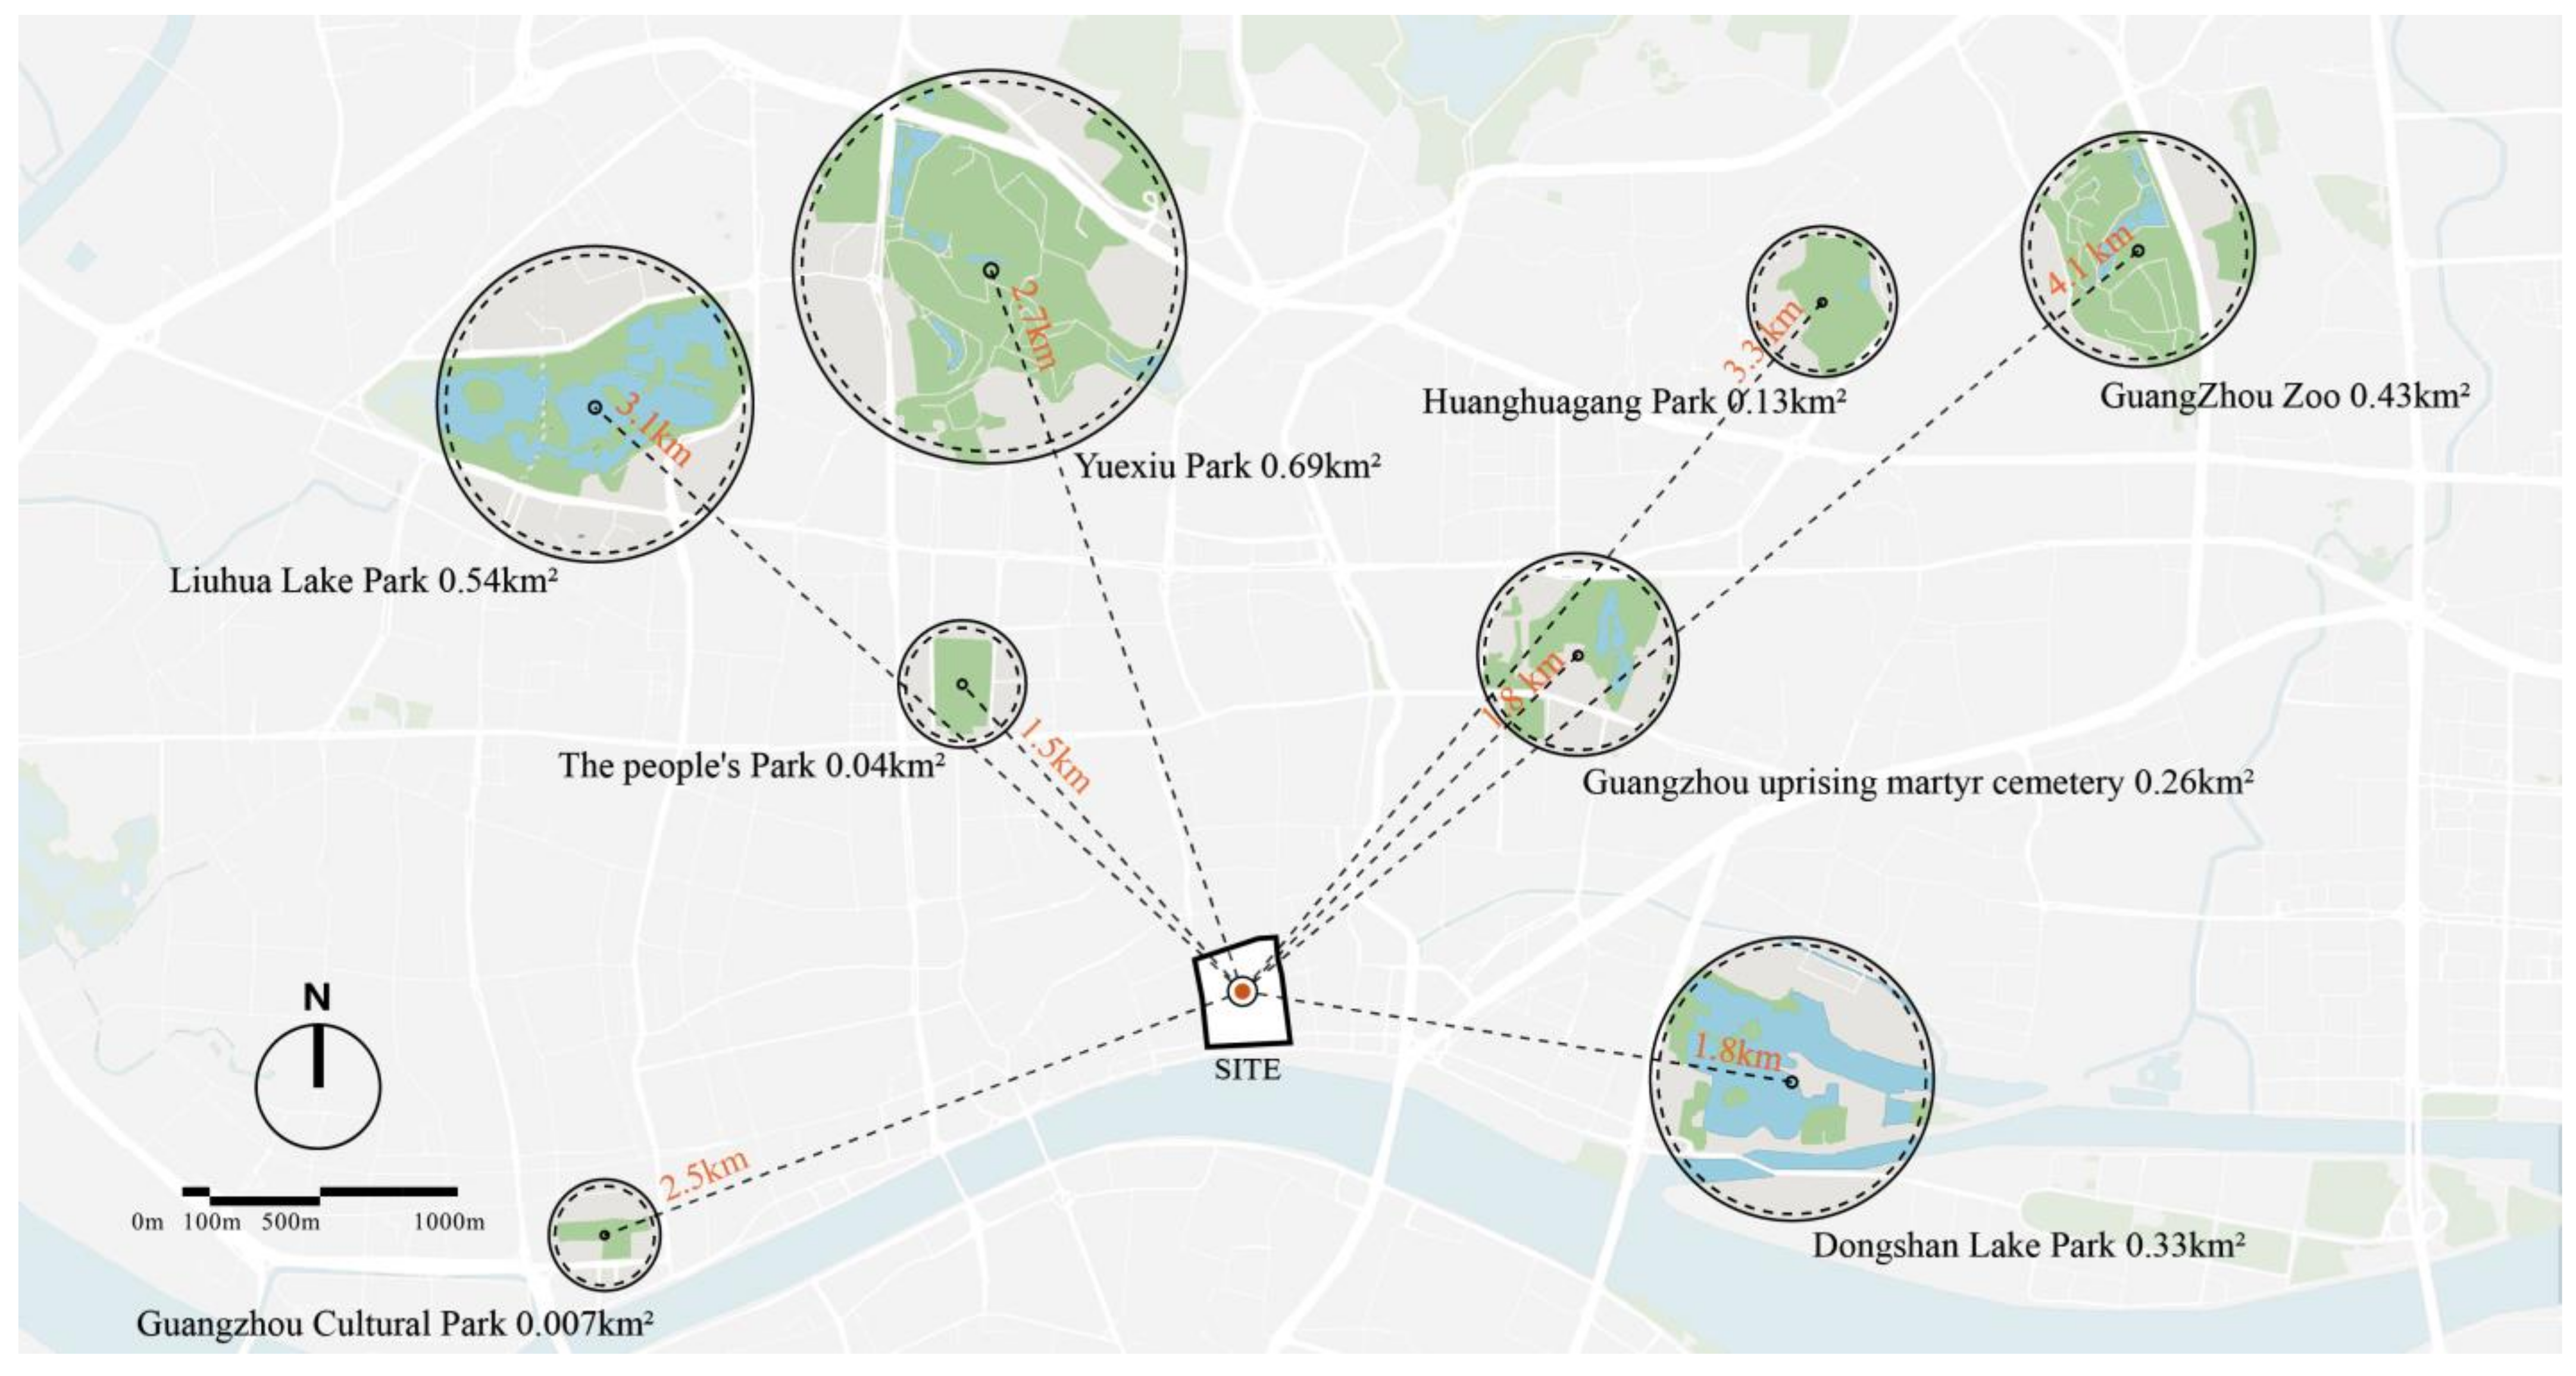
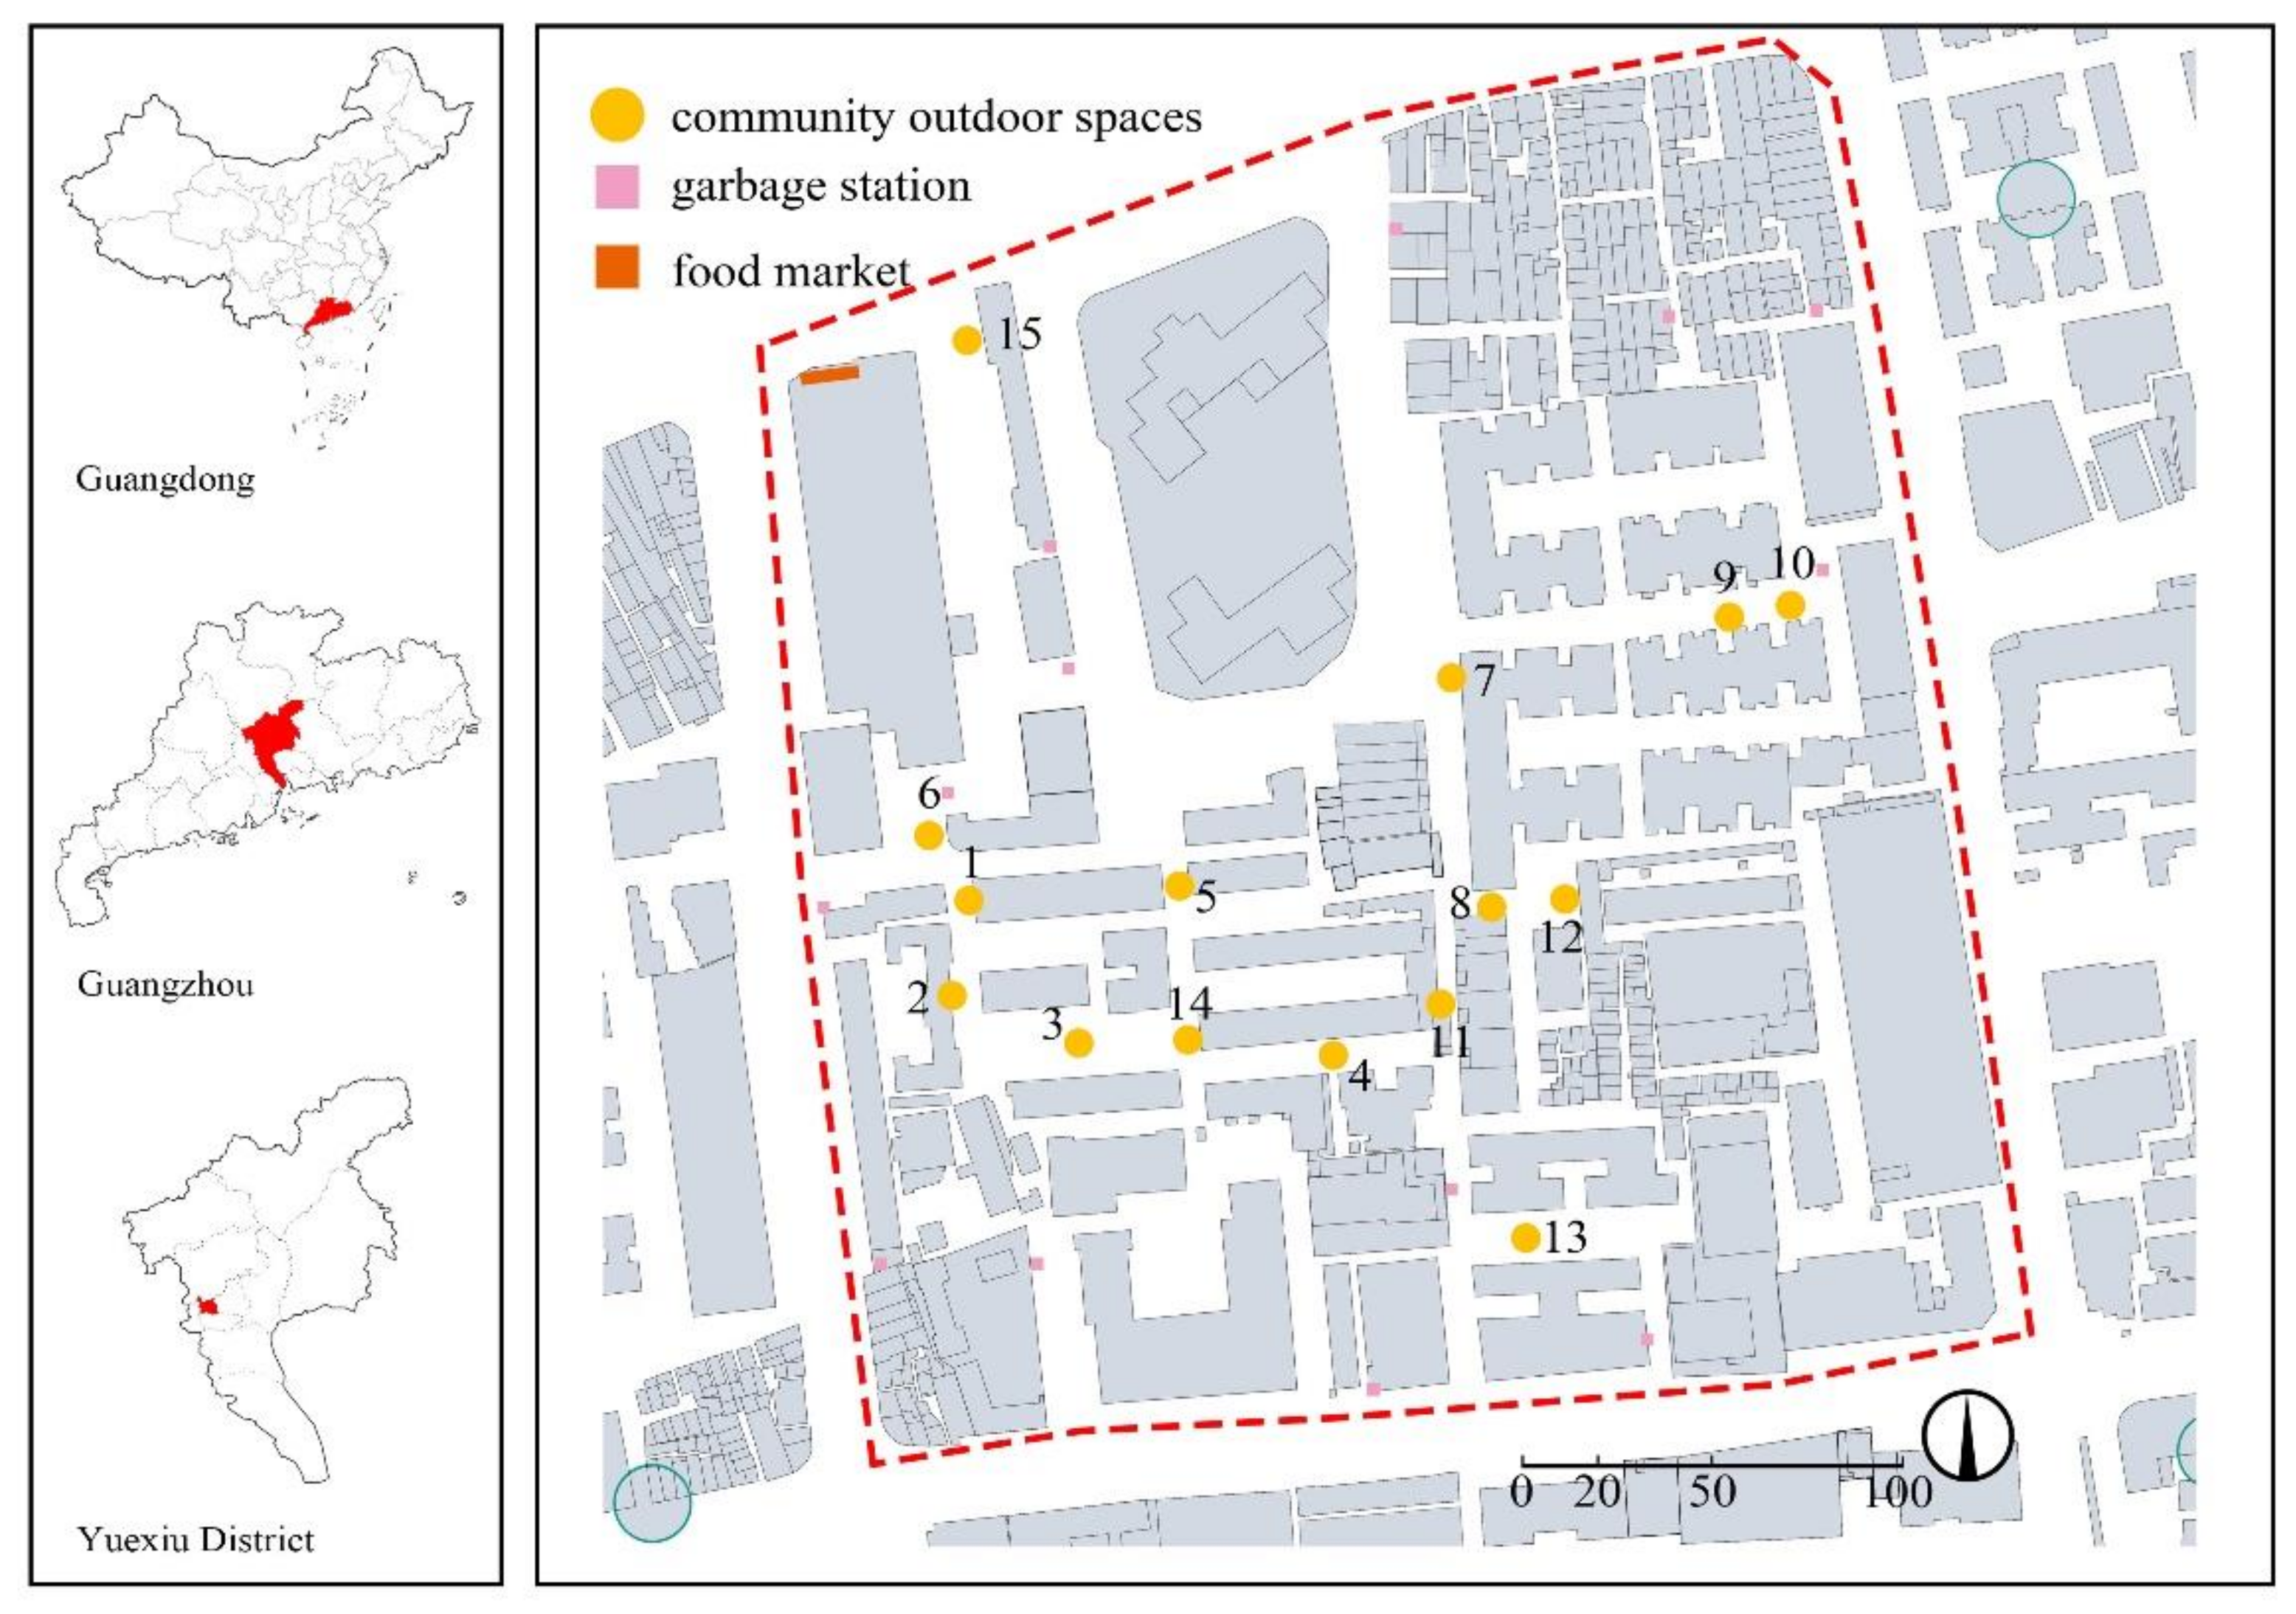
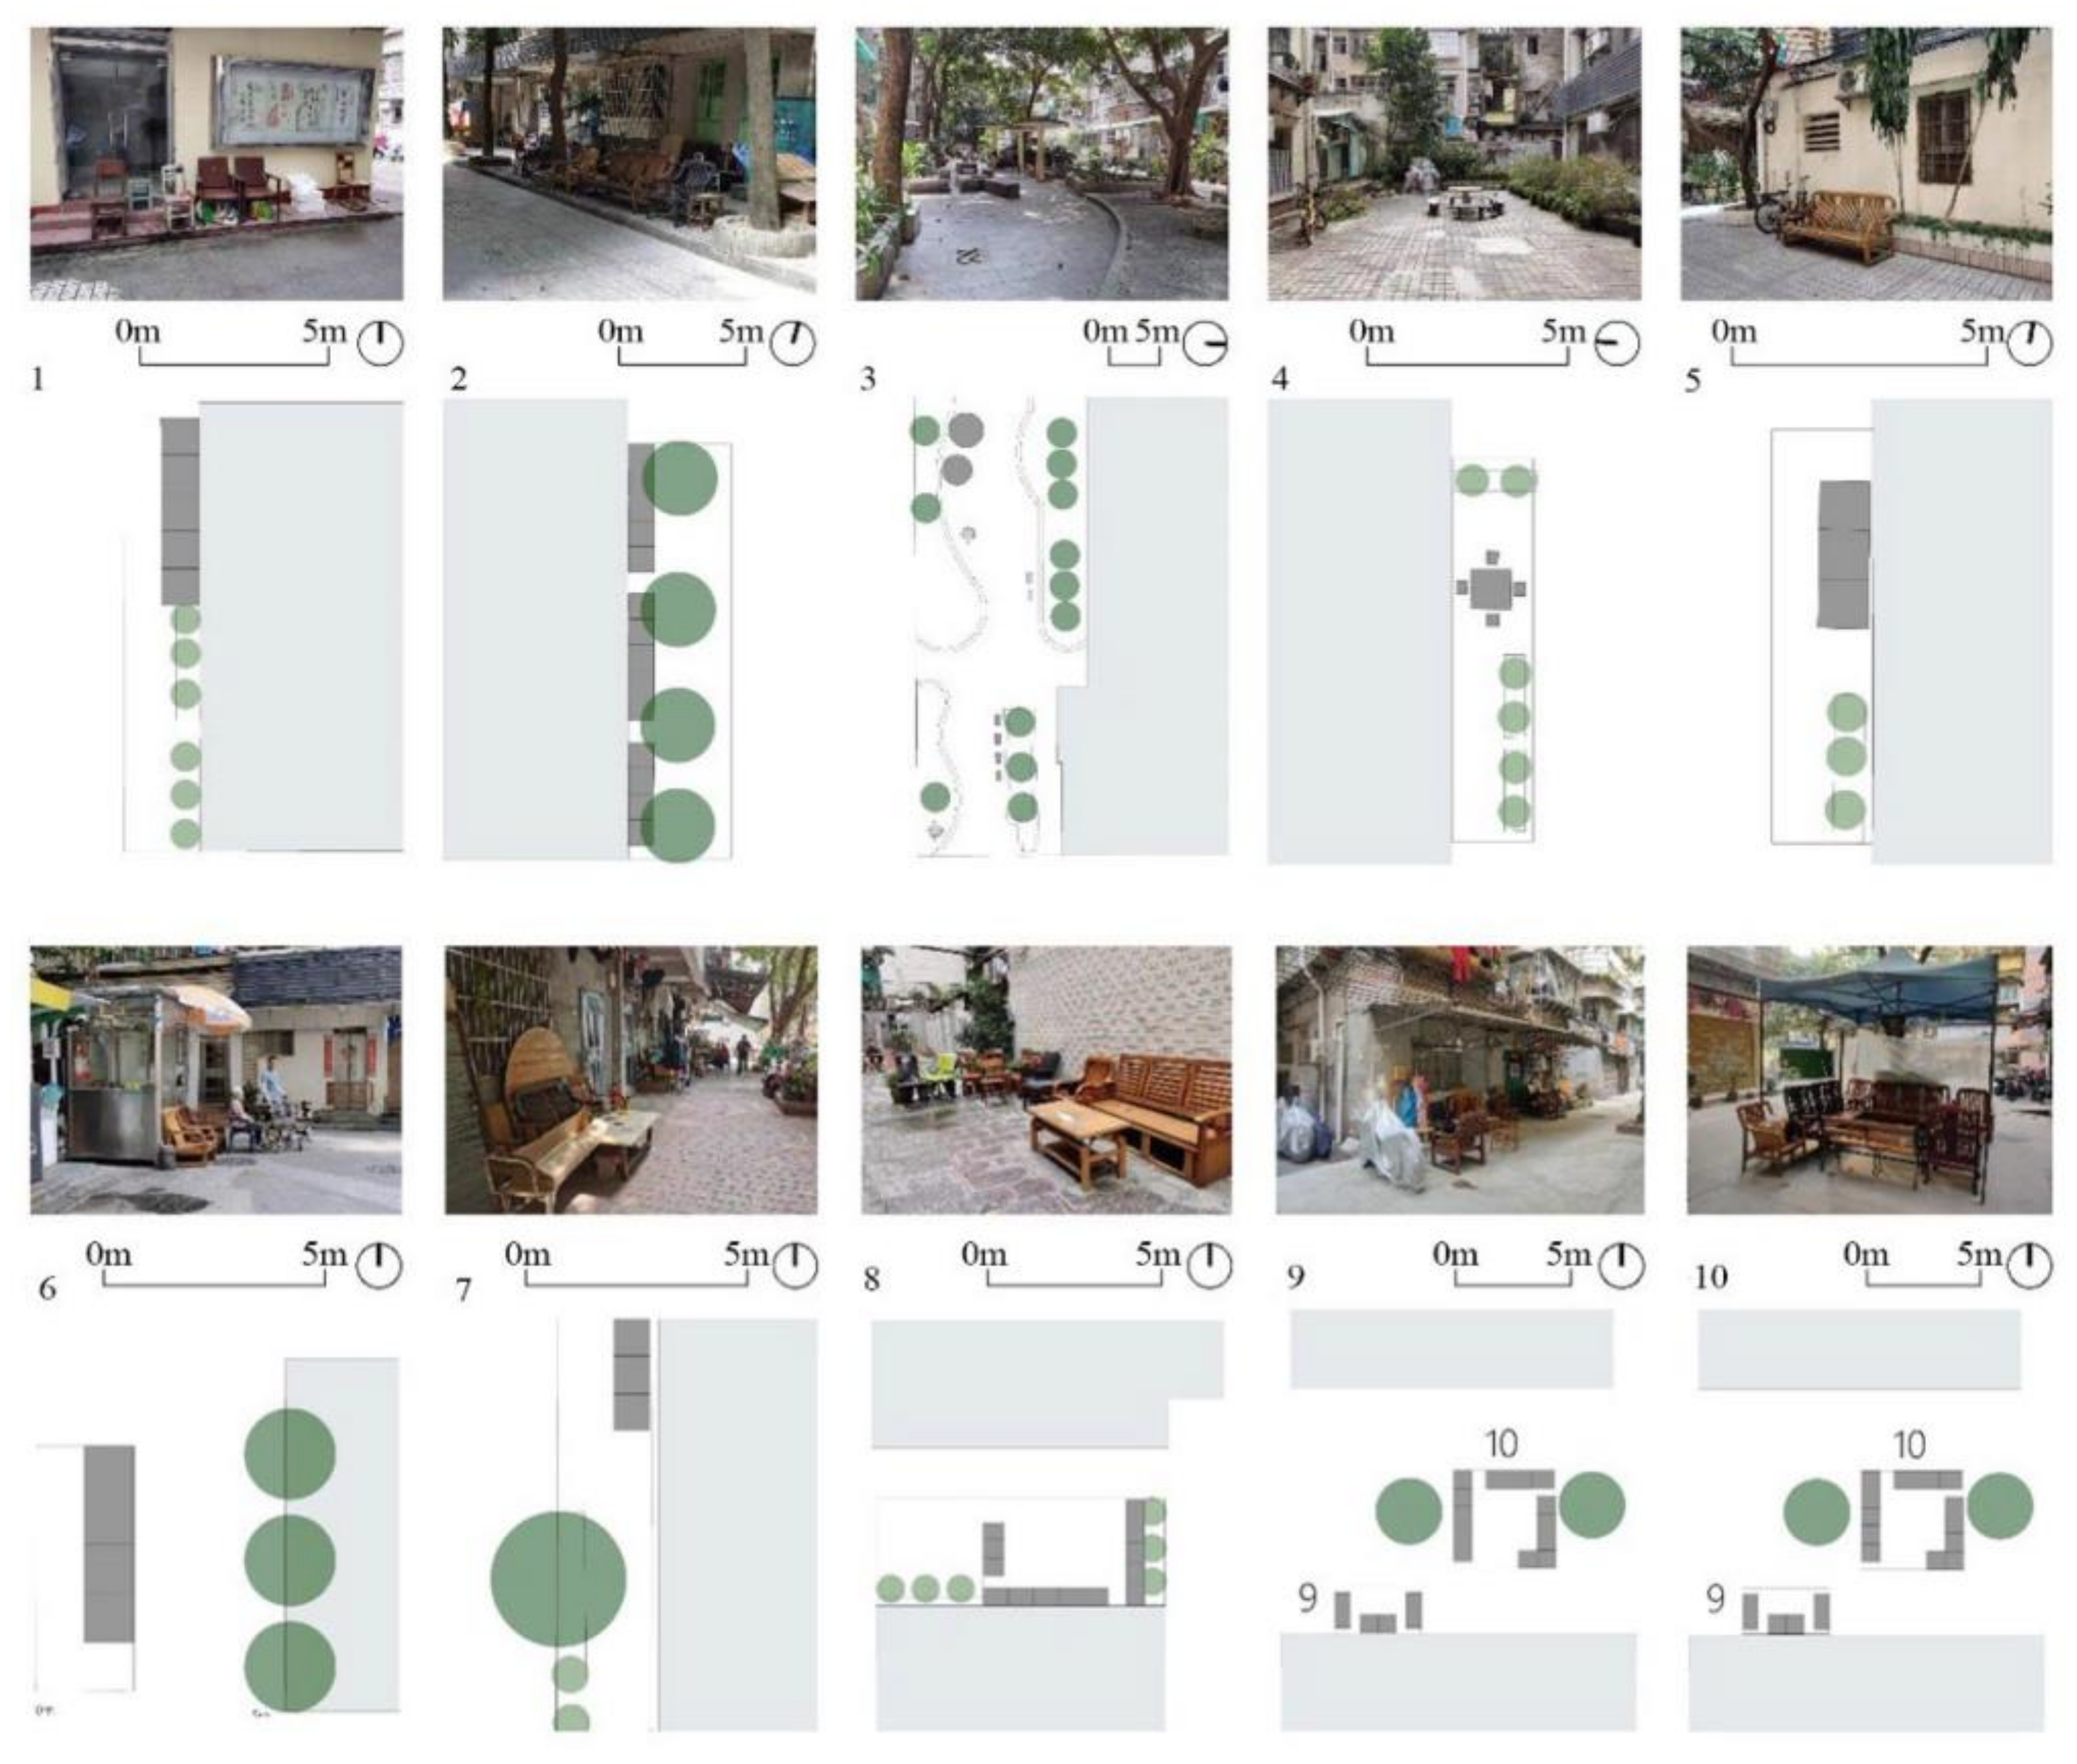
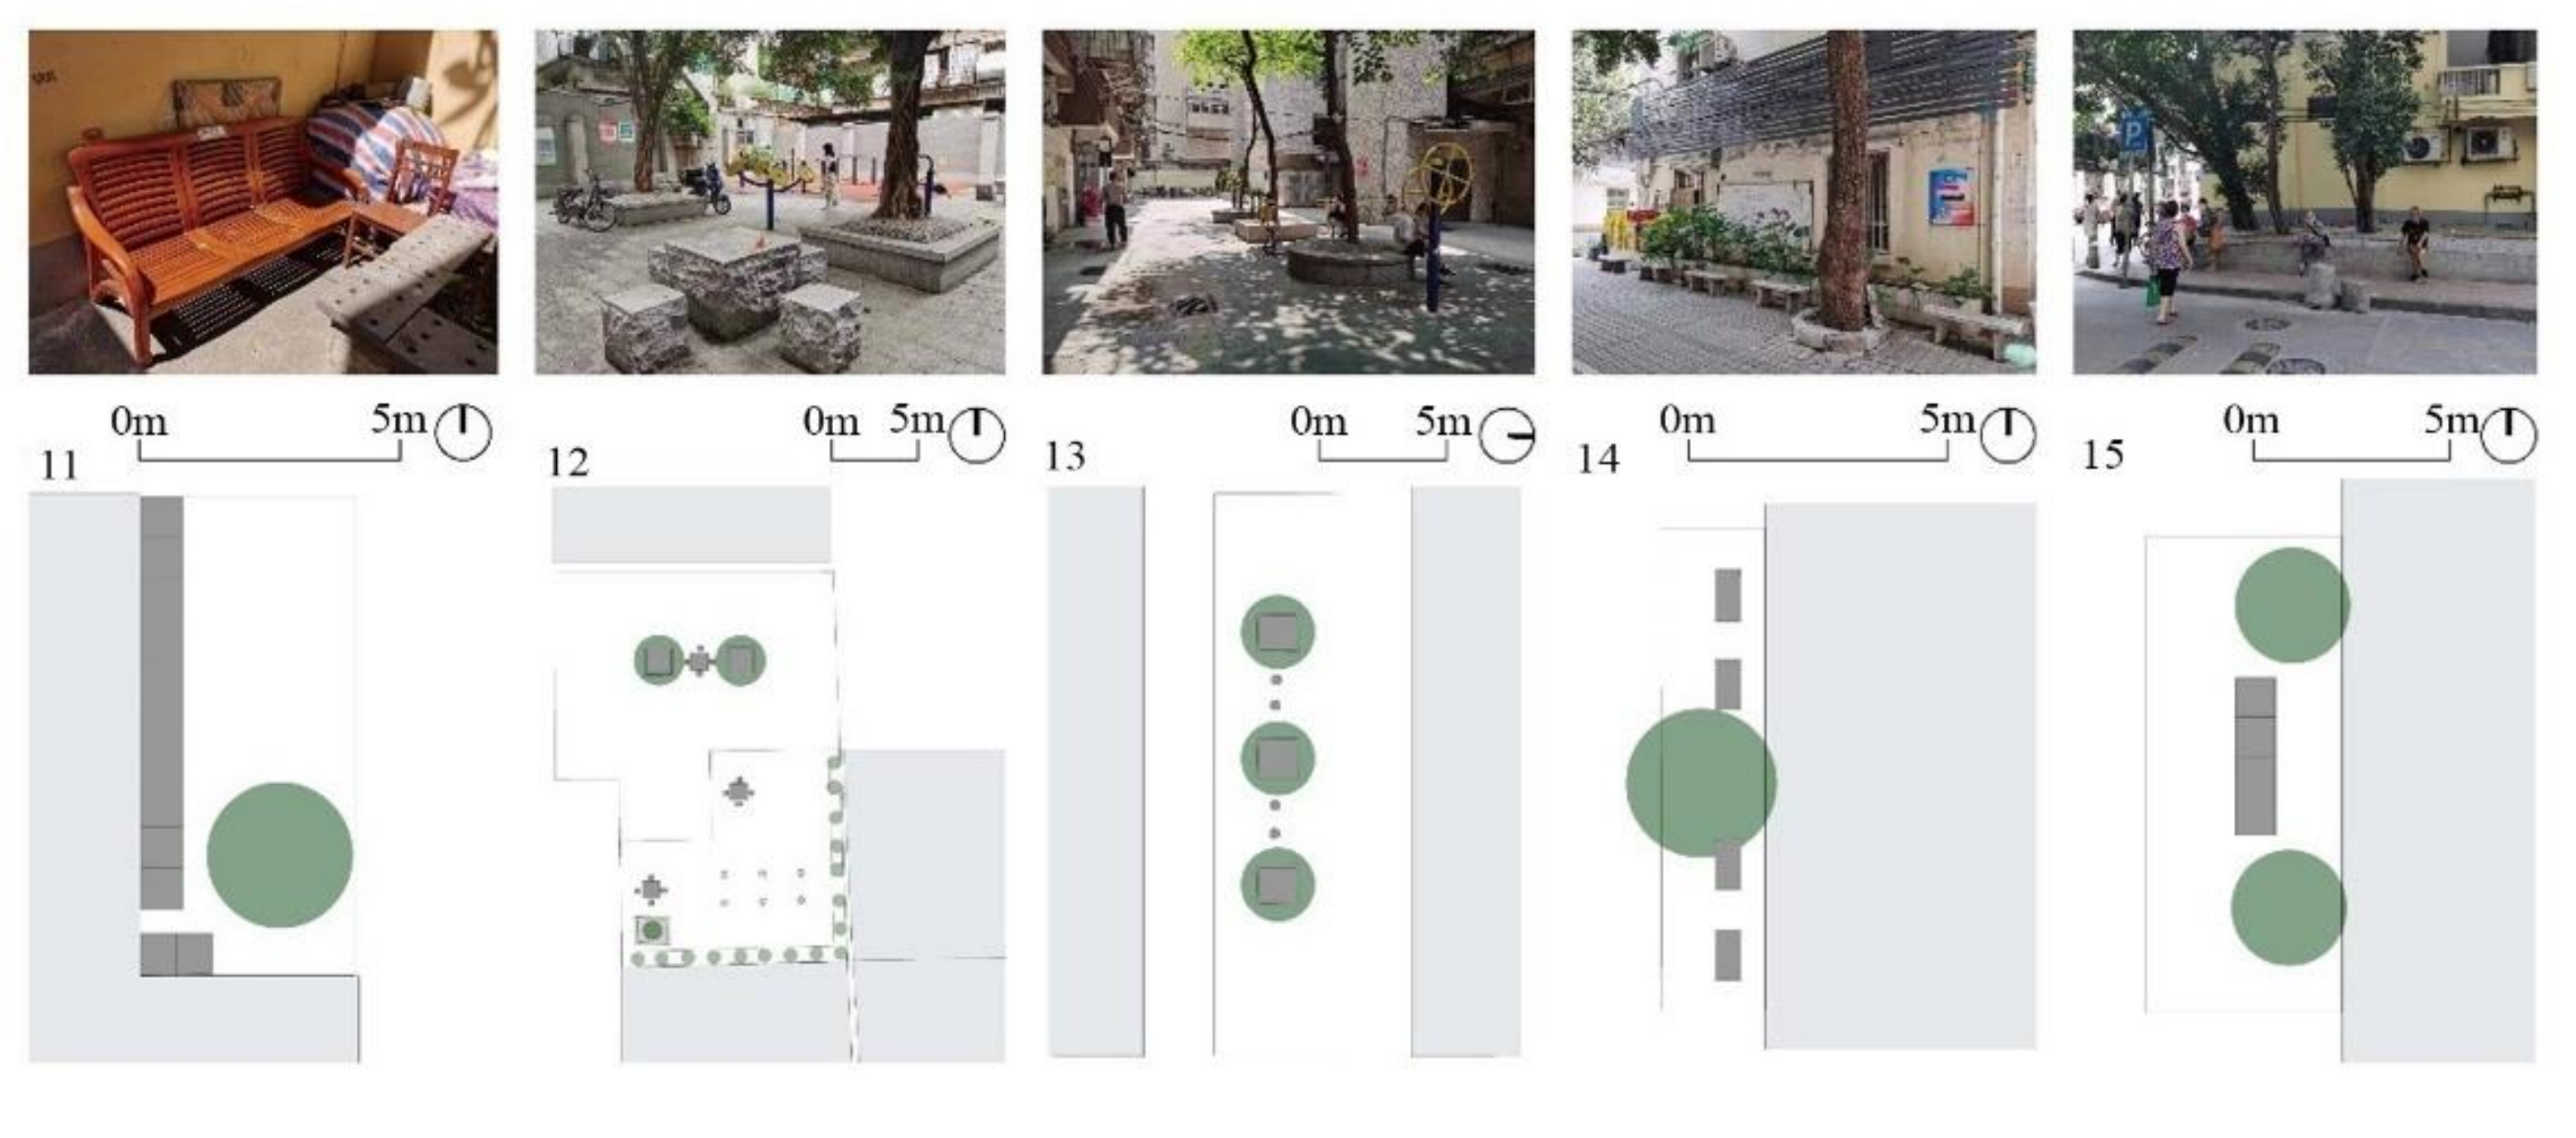
The choice of the Zhuguang community as the subject of this study is informed by several reasons. First, the community experiences severe aging. The proportion of elderly residents in Yuexiu District is 22.25% (over 60 years old) and 15.88% (over 65 years old) [2]. Interview statistics reveal that in the outdoor spaces of the Zhuguang community, 80.42% of the users are over 60 years old, while 57.14% are over 65 years old. This demonstrates that the primary users of these outdoor spaces are the elderly because the accessibility of the open space around the Zhuguang community is relatively low; that is, the closest distance from the neighborhood to the surrounding parks and green spaces is 1.5 km, which takes about 30 min to reach at an elderly walking pace, as it shows in Figure 2. Secondly, the study selected 15 outdoor spaces in the Zhuguang community for investigation. These spaces are frequently used by a high concentration of elderly residents, reflecting their preference for outdoor environmental usage in this community effectively. Lastly, out of the 15 outdoor spaces surveyed, 11 spaces were built spontaneously by the elderly using discarded furniture, indicating an active and positive reflection of their usage preferences for outdoor spaces. Figure 3 and Figure 4 display the locations and site plans of the 15 surveyed outdoor spaces.
According to the survey, the outdoor activities of the elderly in the Zhuguang community are mainly chatting, relaxing, enjoying the cool, strolling, and waiting for their children from school. Due to the limitation of the outdoor space area, few elderly residents participate in sports activities. Some elderly with good physical strength would walk to the Pearl Riverbank or nearby parks for individual or group sports activities, such as sword training, Taijiquan, or square dancing.

3.3. Data Collection

On-site measurements of the number of residents staying, pedestrian flow on surrounding roads, seat numbers, and physical environmental parameters were conducted for the aforementioned 15 outdoor spaces. The survey was conducted on 7–13 September 2022, from 8:00 am to 7:00 pm, the hottest times in Guangzhou, and the data of the two hottest days (12–13 September 2022) were selected for analysis. On 12–13 September 2022, the air temperature ranged from 23.2 to 35.2 °C, the humidity ranged from 37 to 94%, and the maximum daytime wind speed was 3.9 m/s, which were observed by the weather station with the longitude 113.2688 and the latitude 23.12897 in Yuexiu District.
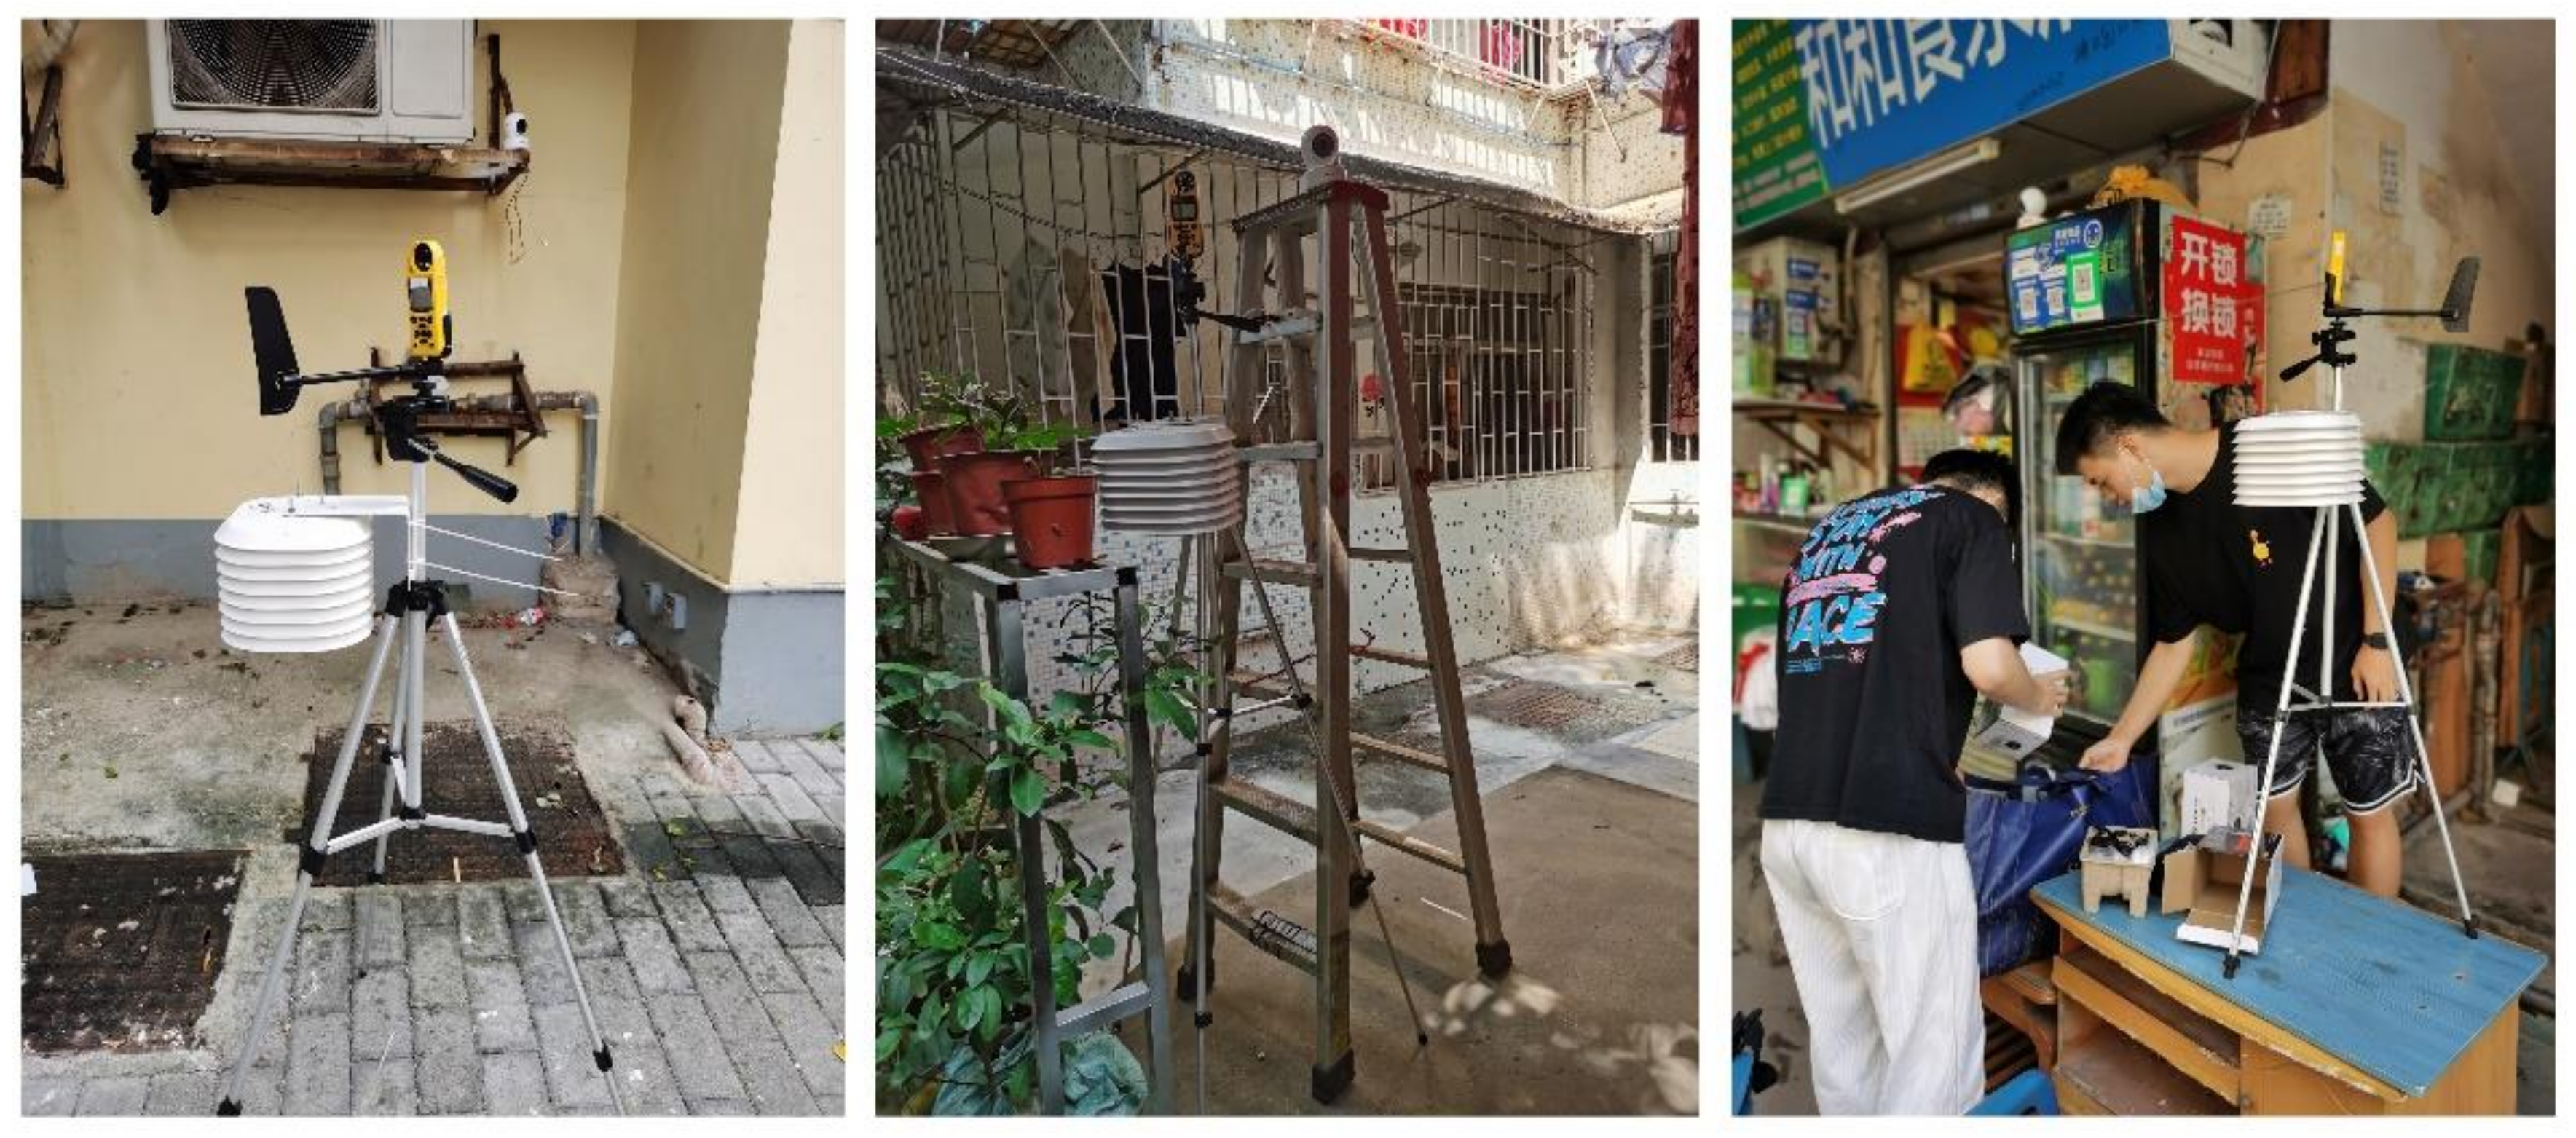
The number of residents staying in the 15 public spaces was recorded at different time intervals. A stay duration of no less than 5 min was counted as valid data. Videos were shot using a multi-function high-definition camera (Magic UC70-4K, Industrial Use, (Philips lighting US, Eindhoven, The Netherlands), with a resolution of 3840 × 2106). The pedestrian flow on the road nearest to the community outdoor spaces was recorded using the same high-definition camera mentioned above. The number of seats in the outdoor spaces was counted. Air temperature, relative humidity, wind speed, and acoustic environment are considered in this study. All data are transformed with a resolution of 20 min. The measuring tools and corresponding models are shown in Table 2. Figure 5 shows photos of the in situ measurement.
4 Physical Environmental Parameters:
T ¯ a —the average temperature, °C, calculated by the following (1):
T ¯ a = i n T a i n
n1 = 60, n2 = 20, minute, T a i —the average temperature per minute measured by the instrument;
R H ¯ a —mean relative humidity, calculated by the following (2):
R H ¯ a = i n R H a i n
n1 = 60, n2 = 20, minute, R H a i —the mean relative humidity per minute measured by the instrument;
V ¯ a —mean wind speed, m/s, calculated by the following (3):
V ¯ a = i n V a i n
n1 = 60, n2 = 20, minute, V a i —the wind speed every minute measured by the instrument;
Leq—equivalent continuous sound level, dB, calculated by the following (4):
Leq = 10 log [(1/T) ∫ 100.1LA dt]
T—time of duration, T1 = 3600, T2 = 1200, s; LA is the instantaneous sound level at time t.
Temperature and humidity were measured using a self-recording hygrothermograph, while wind speed and noise were measured using a multi-functional meteorological anemometer (Kestrel 5500), and noise was further recorded using a sound level meter (AWA5636). The hygrothermograph and the weather station were installed 1.5 m above the ground level, with the data logging interval set to one minute.

3.4. Data Analysis

3.4.1. Image Recognition Technology

This study collected photographs of the public spaces in the case study at fixed time intervals using video recording, then processed these images using FCN image recognition technology. This provided access to data within the images, such as the number of residents, the Sky Visibility Index (SVI), and Green Looking Ratio (GLR).
FCN (Full Convolutional Network) was born based on the development of CNN (Convolutional Neural Network), which belongs to the deep neural network. The network structure of CNN can automatically learn various high-level and abstract features in the image. It is usually constructed by an input layer, a group of hidden layers in the middle, and an output layer, among which the hidden layer includes a convolutional layer, a pooling layer, a fully connected layer, and other types of structures. FCN can predict and detect the semantic labels of each pixel in the image and classify each pixel by processing the image features, in that it has the structural characteristics of image semantic segmentation. The advantages of FCN over CNN include the concept of convolution and up-sampling technology. The combination of multiple convolutional layers is used to improve the actual segmentation definition and effect. Therefore, the recognition accuracy of FCN is higher, and it can accept input images of any size. Figure 6 shows the principle of FCN image operation in deep learning.
The YOLOv5 model was used for object detection on video images, which identified and counted the number of target objects within a specific time period. This information was used to obtain pedestrian flow data for specific sections of road. The RelD_PCB model was utilized to achieve pedestrian re-identification and frame image capture, thereby obtaining the dwell time of residents in selected public spaces. Only those residents who stayed for no less than 5 min within the statistical period were counted.

3.4.2. Correlation Analysis

After conducting research statistics in the case study community, the number of residents staying in each public space was designated as variable X. The corresponding pedestrian flow, spatial capacity, physical environment parameters, sky view index, and green view index were designated as variable Y. The Pearson correlation coefficient was then used to calculate the correlation between X and Y, allowing the quantification of the coupling relationship between the number of residents in a space and the spatial elements. The (5) is:
r = i = 1 n X i X ¯ Y i Y ¯ i = 1 n ( X i X ¯ ) 2 i = 1 n ( Y i Y ¯ ) 2

3.4.3. Model Building

Random forest regression (RF) model is a combination of multiple binary Classification and Regression Tree (CART), and training random forest regression model is to train multiple binary decision trees. In binary decision tree training, an exhaustive approach is employed to select the splitting variables and points by traversing all features and their respective values to identify the optimal splitting variable and point. The mean square error (MSE) was used to measure the quality of nodes after segmentation. The calculation (6) is as follows:
G ( x , v ) = 1 N s ( y i X l e f t ( y i y ¯ l e f t ) 2 + y i X r i g h t ( y i y ¯ r i g h t ) 2 )
where x is segmentation variables; v is the value of the segmentation variables; Xleft, Xright are the training sample set of left and right child nodes; Ns is the number of all training samples of the current node; y ¯ l e f t and y ¯ r i g h t represent the average value of the output data of left and right child nodes.
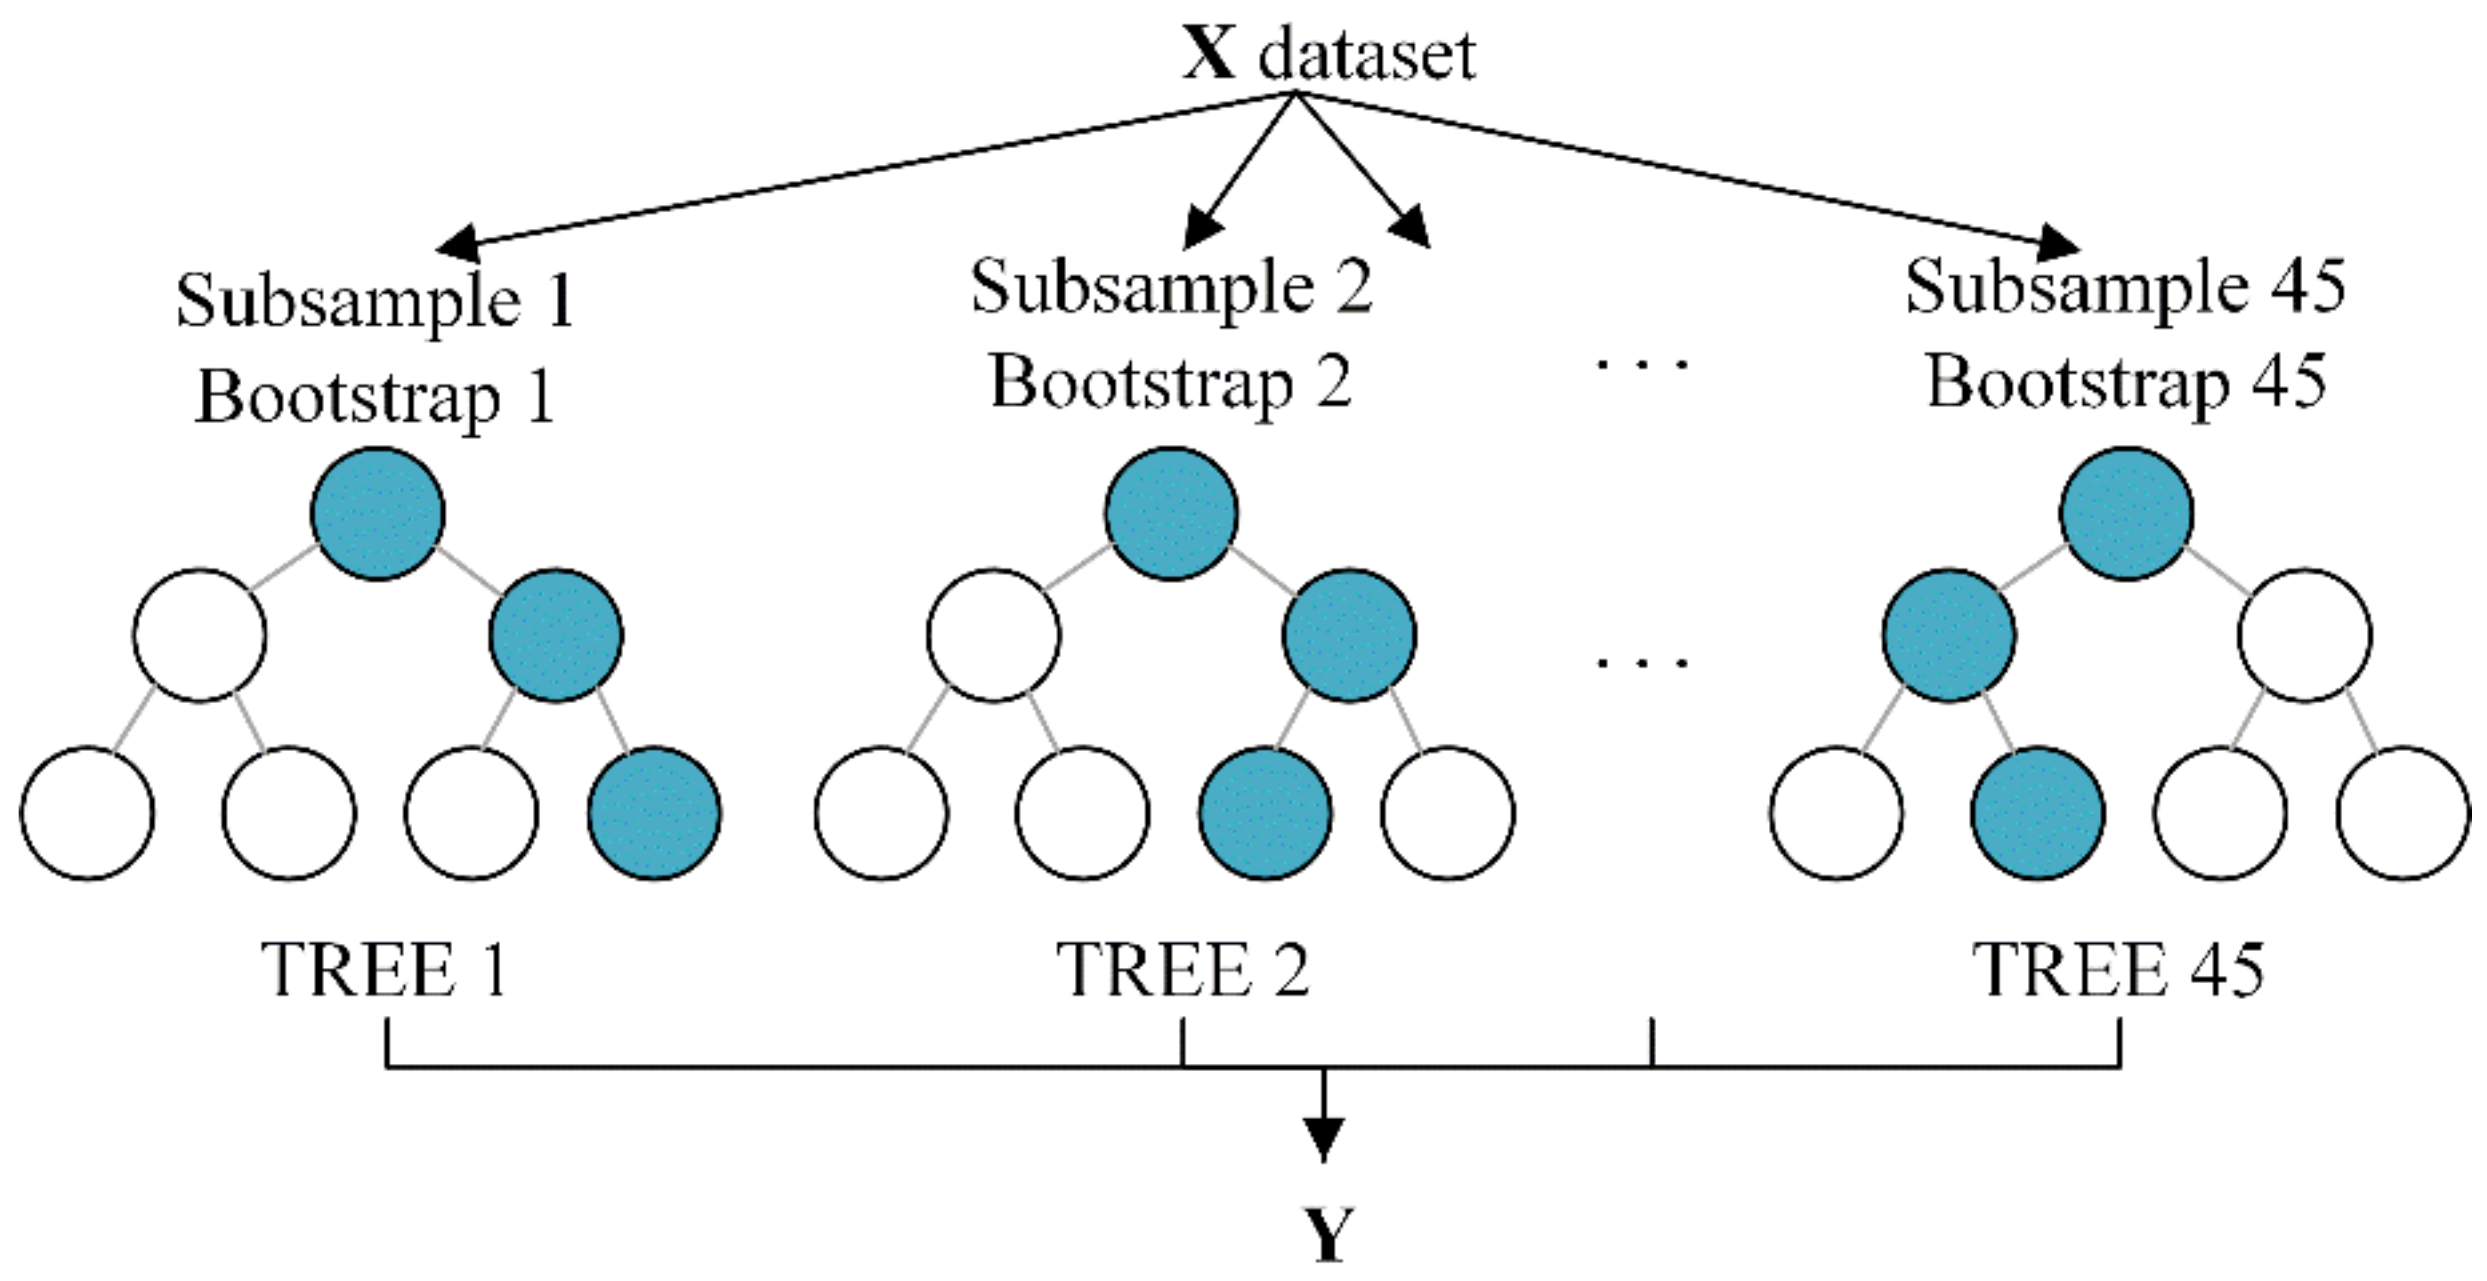
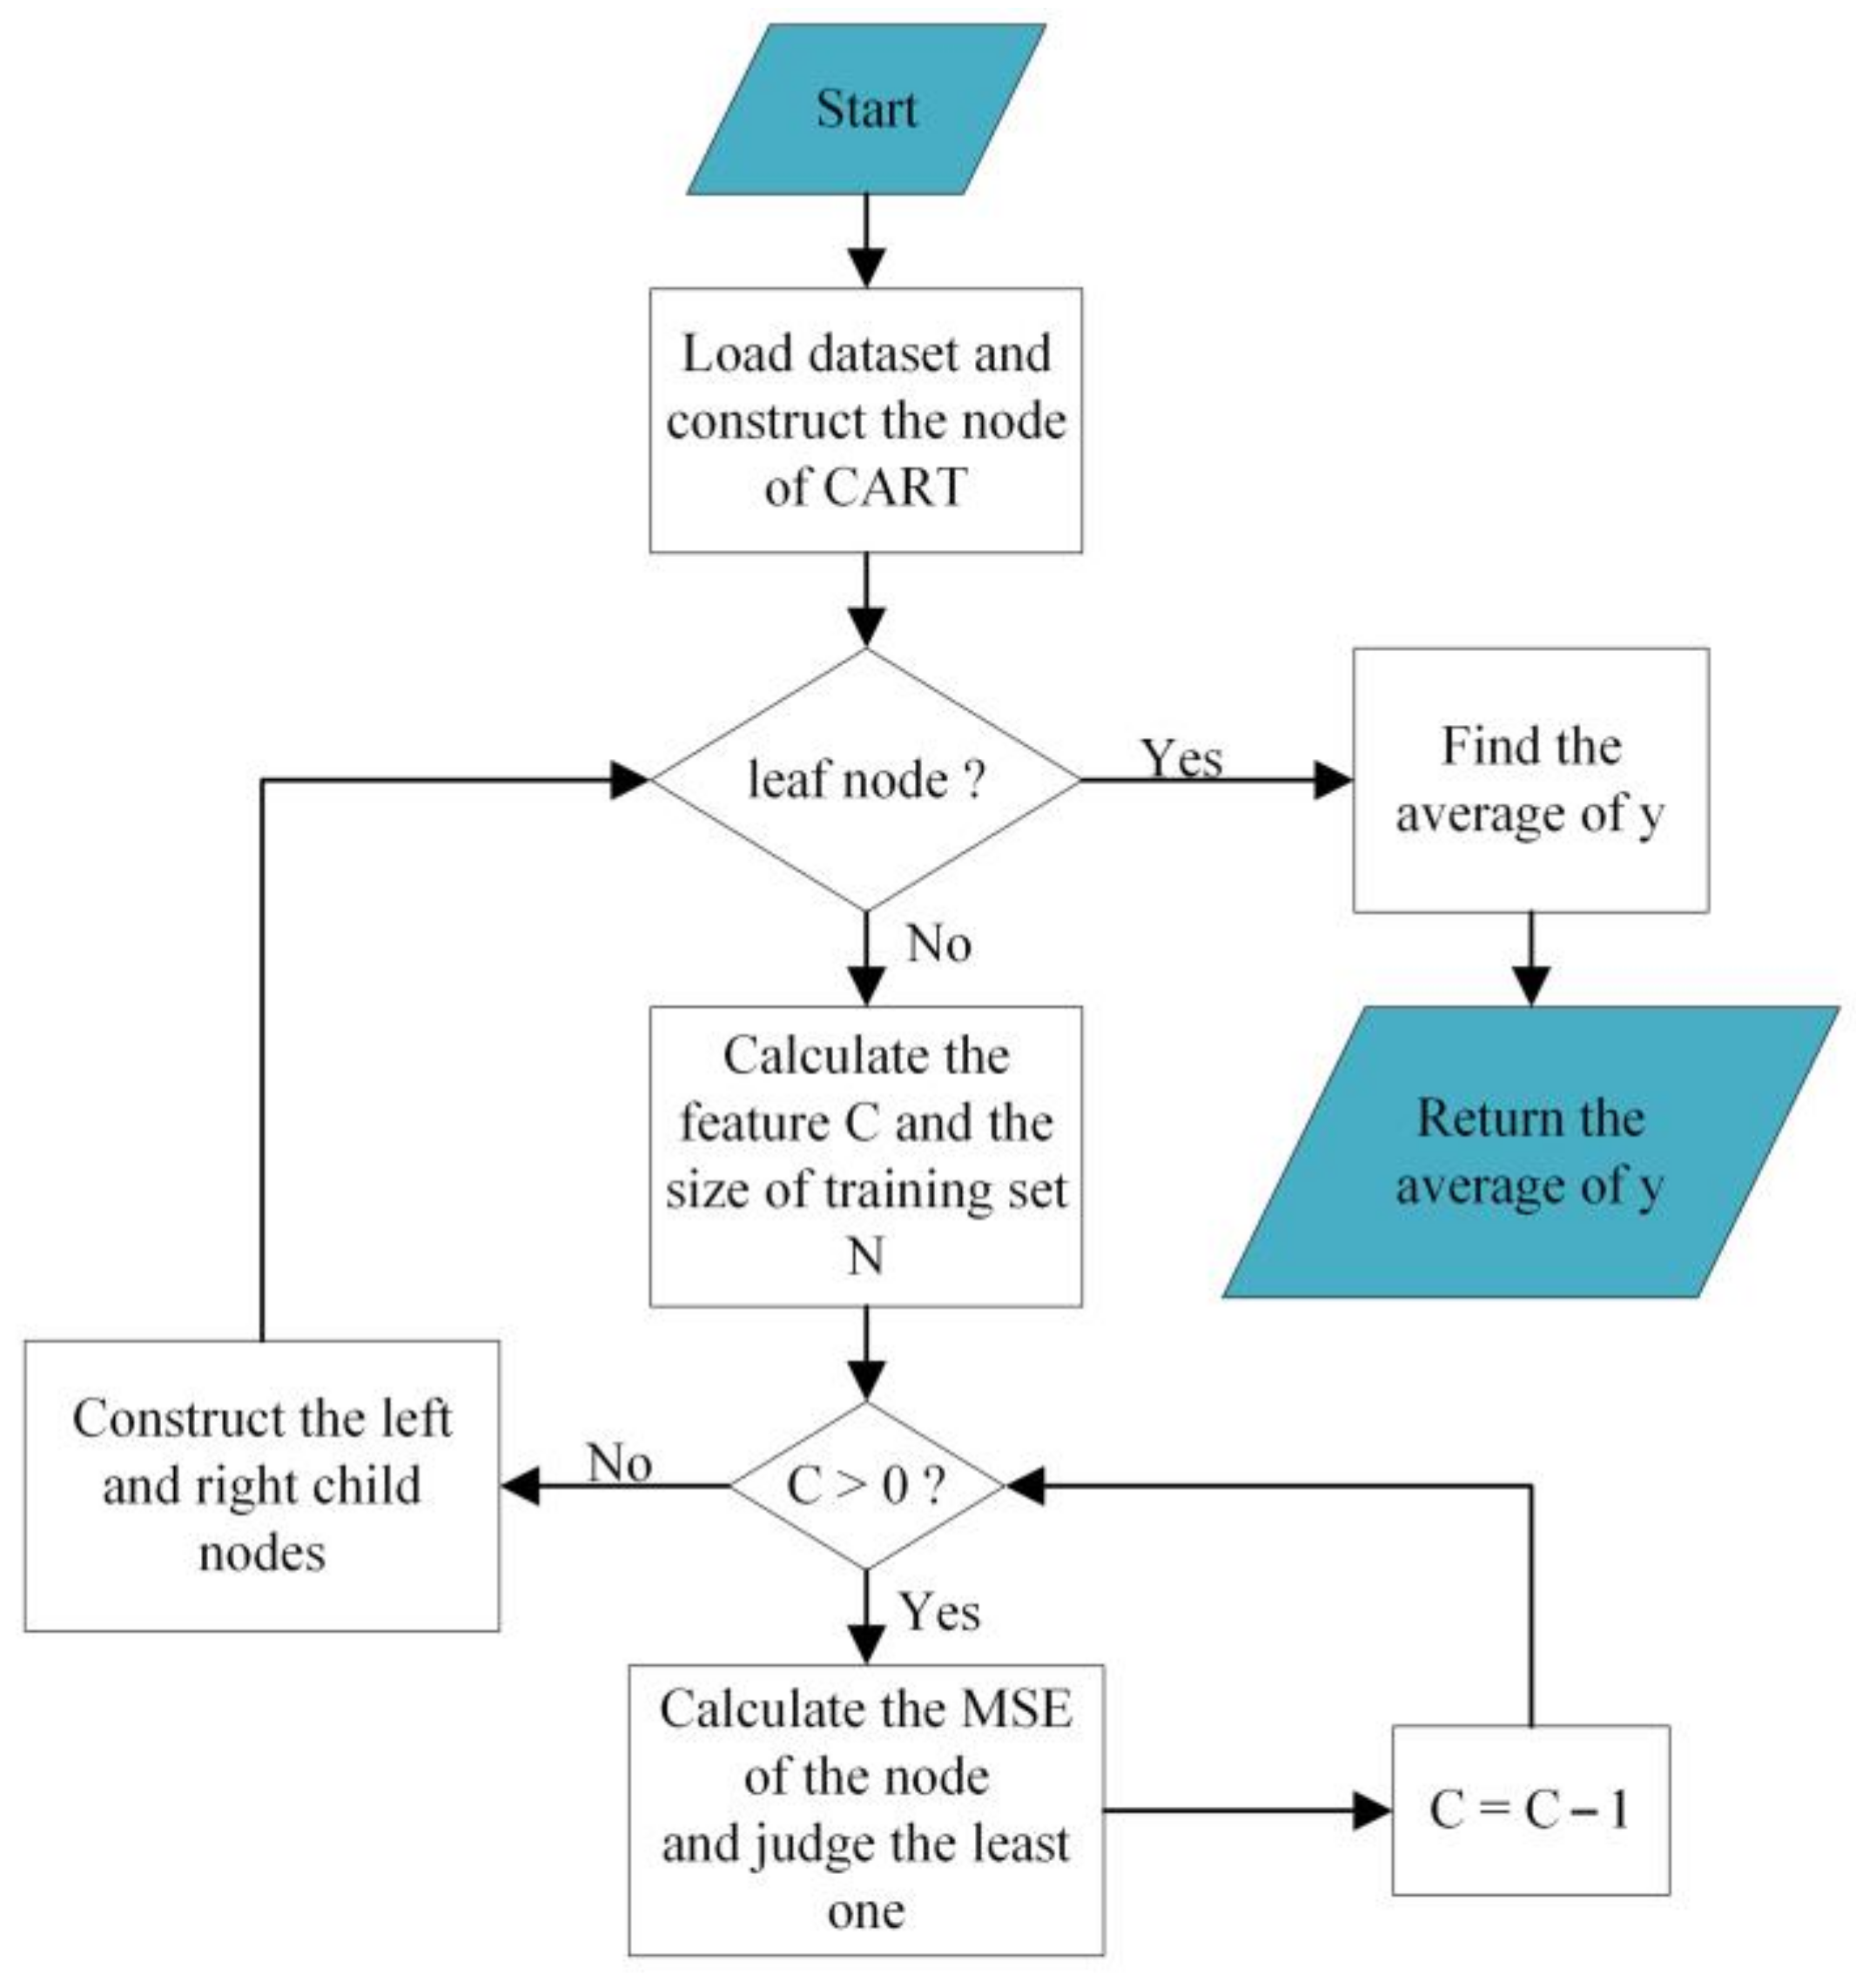
Figure 7 shows the structure of a random forest. After passing the X dataset into the model, the input training set is repeatedly sampled N times with replacement to obtain a bootstrap set. Then, based on the size of the input parameters, a subsample set is obtained and input into different tree structures. After performing calculations on each tree structure, the mean of each tree’s result is taken to obtain the model’s output Y. Figure 8 shows the training process of a tree structure. After inputting the training set, decision tree nodes are constructed, and it is determined whether the node is a leaf node. If it is, the average of all Y values for the current node is taken and used as the output value for that tree structure. Otherwise, the number of features in the training set and the size of the training set are calculated. It is then determined whether the number of features is greater than 0. If it is, the MSE error at the splitting point is calculated and compared with the minimum MSE error at the current node. If it is smaller than the latter, then that splitting point is stored. If there are no more features left, then the training set is divided into two sets, left and right child nodes are constructed, and it is determined again whether they are leaf nodes. This process continues until all nodes are leaf nodes.
To further demonstrate the superiority of this method, there are four baseline models for comparison: K-nearest neighbor (KNN) is a non-parametric algorithm that predicts the value of a target variable by considering the nearest neighbors in the feature space [59]. Support Vector Regression (SVR) is a regression algorithm that uses support vector machines to find the best hyperplane in a high-dimensional space, minimizing the error within a certain margin [60]. Ridge regression (Ridge) is a linear regression algorithm that adds a penalty term to the loss function, allowing for better control of overfitting and improved generalization [61]. Classification and Regression Trees (CART) is a supervised learning algorithm that creates a tree-like model by splitting the data based on different feature conditions to make predictions or classifications [62].

3.4.4. Evaluation Indicators and Datasets

In order to evaluate the performance of the model, the following three evaluation indexes are adopted:
Root Mean Squared Error (RMSE), as shown in (7):
R M S E = 1 n i = 1 n Y t Y t ^ 2
Mean Absolute Error (MAE), as shown in (8):
M A E = 1 n i = 1 n Y t Y t ^
Coefficient of Determination (R2), as shown in (9):
R 2 = 1 i = 1 Y t Y t ^ 2 i = 1 Y t Y t ¯ 2
Specifically, RMSE and MAE are used to measure the error, where smaller values indicate better prediction performance. R2 is used to calculate the correlation coefficient, which measures the ability of the prediction results to represent the actual data. The larger the value of R2, the better the prediction performance.
There are four characteristics in the dataset of the experiment, which are temperature, humidity, the pedestrian volume of the people, and noise. These four features predict the number of residents staying in the outdoor spaces. There were 110 groups of experimental data, and the training set and test set were randomly divided according to the ratio of 8:2. The data in the dataset are used to train the model, and the test set is used to demonstrate the predictive performance of the model.
The data for training were normalized by the method below, as shown in (10):
x i j = x i j min ( x j ) max ( x j ) min ( x j )
where x i j represents the i th row and the jth column x , min x j represents the smallest x in the j th column, and max x j on behalf of the largest x in the j th column.

4. Results

4.1. Measurement Results

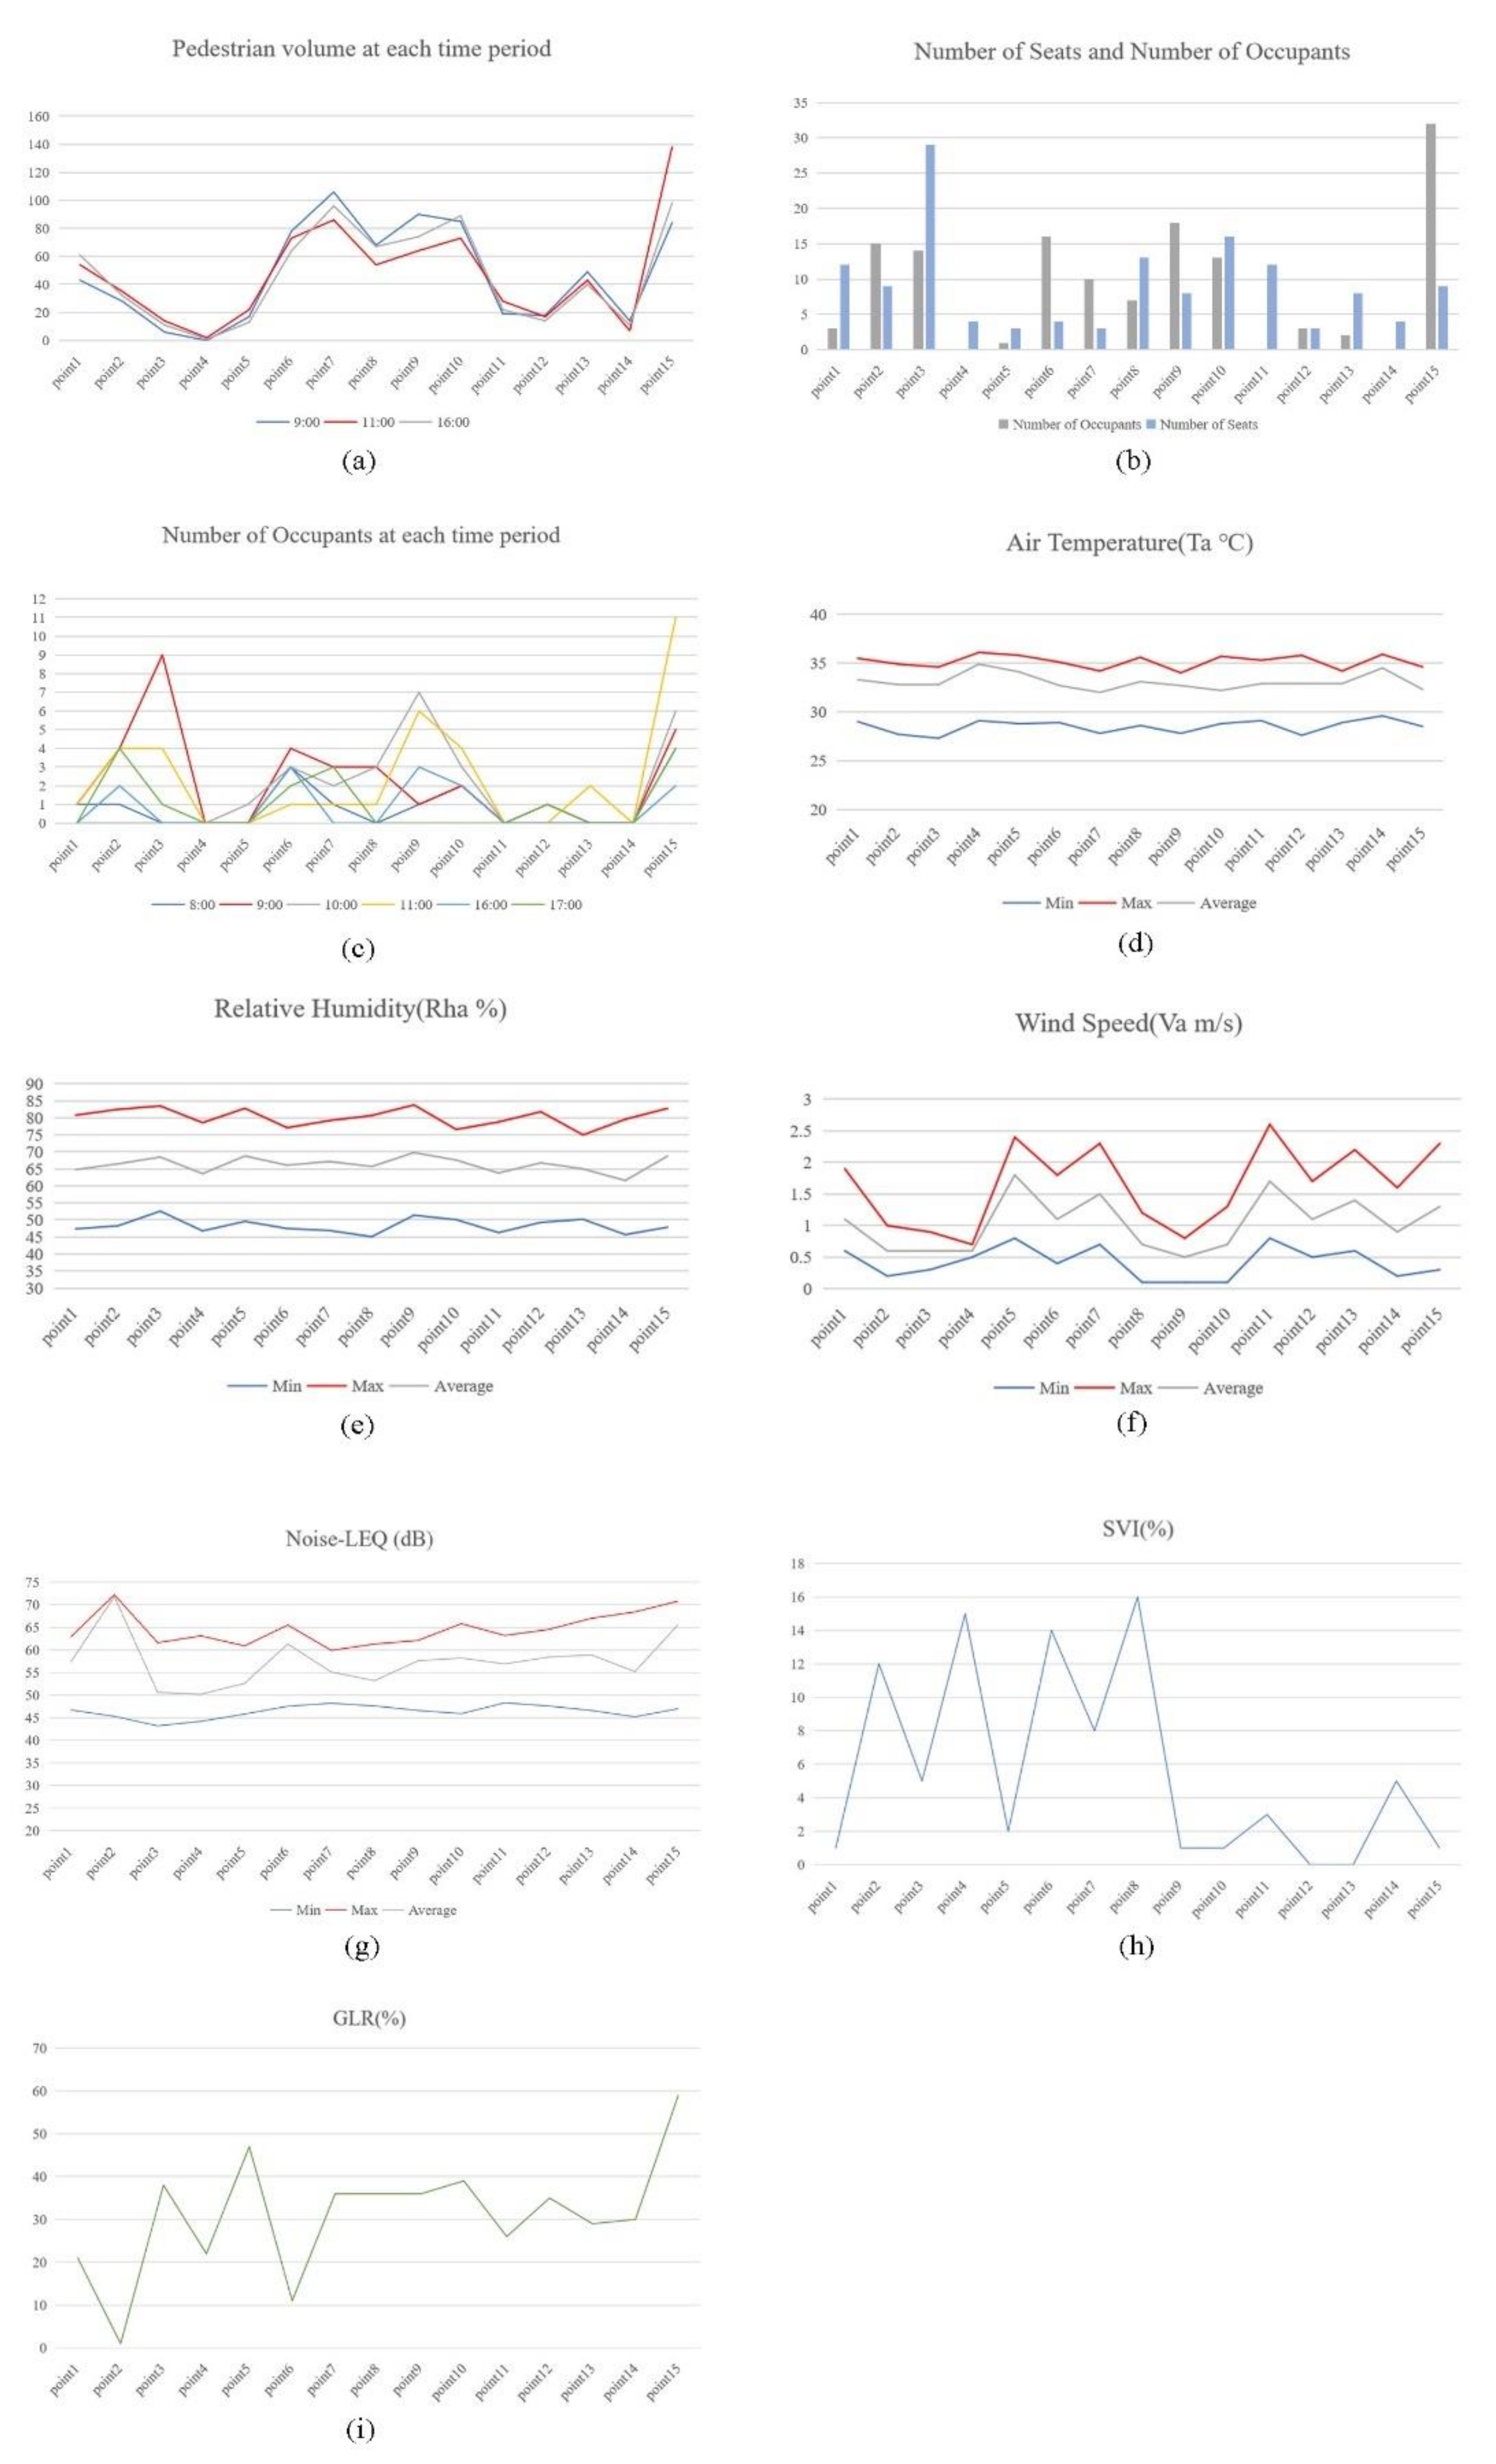
The Figure 9 shows the data of the environmental parameters measured in the 15 outdoor spaces in the Zhuguang community: (a) shows the pedestrian volume in the main periods for residents to go outdoors; (b) compares the number of seats with the number of outdoor space occupants; (c) compares the number of residents in 15 outdoor spaces at different times; (d–g) show the air temperature, relative humidity, wind speed, and noise-LEQ of the outdoor spaces with the minimum, maximum, and average values. (h,i) show the values of the Sky Visibility Index and Green Looking Ratio in the 15 outdoor spaces.

4.2. Correlation Analysis Results

Behavioral and spatial element data of elderly individuals were extracted from 15 outdoor spaces in the Zhuguang community. These included the number of residents staying in high-frequency spaces, pedestrian flow on paths, spatial capacity, physical environmental parameters (temperature, relative humidity, wind speed, noise), sky view index, and green view index. Data were extracted every hour for the high-frequency activity periods of the elderly (8:00–9:00, 10:00–11:00, 16:00–17:00), obtaining a total of 90 datasets in 2 days from the 15 outdoor spaces; the data includes 268 residents who stayed in the community’s outdoor space (usually residents stay no longer than two hours, so this number does not involve double counting) and 12,216 people who walked through nearby roads in the three periods on September 12 and 13. The number of individuals staying in the outdoor spaces was separately analyzed for correlations with the eight corresponding environmental elements. The results are shown in Table 3. Environmental elements with a high correlation with the number of individuals staying in the community’s outdoor spaces included temperature, relative humidity, pedestrian flow, and noise. Of these, temperature had a negative correlation, while the remaining three factors were positively correlated.

4.3. Model Building

Data statistics indicate that three space spots, 6, 10, and 15, in the the Zhuguang community are the sites with high frequency of use and a large number of residents staying, all of which are spontaneously constructed by residents. These can serve as typical spaces for building models. At the same time, the environmental factors highly correlated with the number of residents staying in the outdoor spaces are temperature, relative humidity, pedestrian flow, and noise (Section 4.2).
By taking 20 min intervals, we extracted the number of residents staying, temperature, relative humidity, pedestrian flow, and noise from these three typical outdoor spaces from 8:00 to 19:00. This resulted in a total of 110 sets of valid data, which were used to build the machine learning model as described in Section 3.4.3; the data includes 758 residents who stayed in the community’s outdoor space (residents staying longer than 20 min are double-counted) and 28,865 people who walked through nearby roads from 8:00 to 19:00 on September 12 and 13. In this experiment, the settings of the Hyperparameter of RF are as follows: the number of decision trees is 50, the maximum depth allowed for each decision tree is 500, the minimum number of samples required to split an internal node is 8, and the minimum number of samples required to be at a leaf node is 1. To further demonstrate the superiority of this method, there are four benchmark models for comparison: K-nearest neighbor algorithm model (KNN), Support vector regression algorithm model (SVR), Ridge regression algorithm model (Ridge) and Decision tree algorithm model (DT).
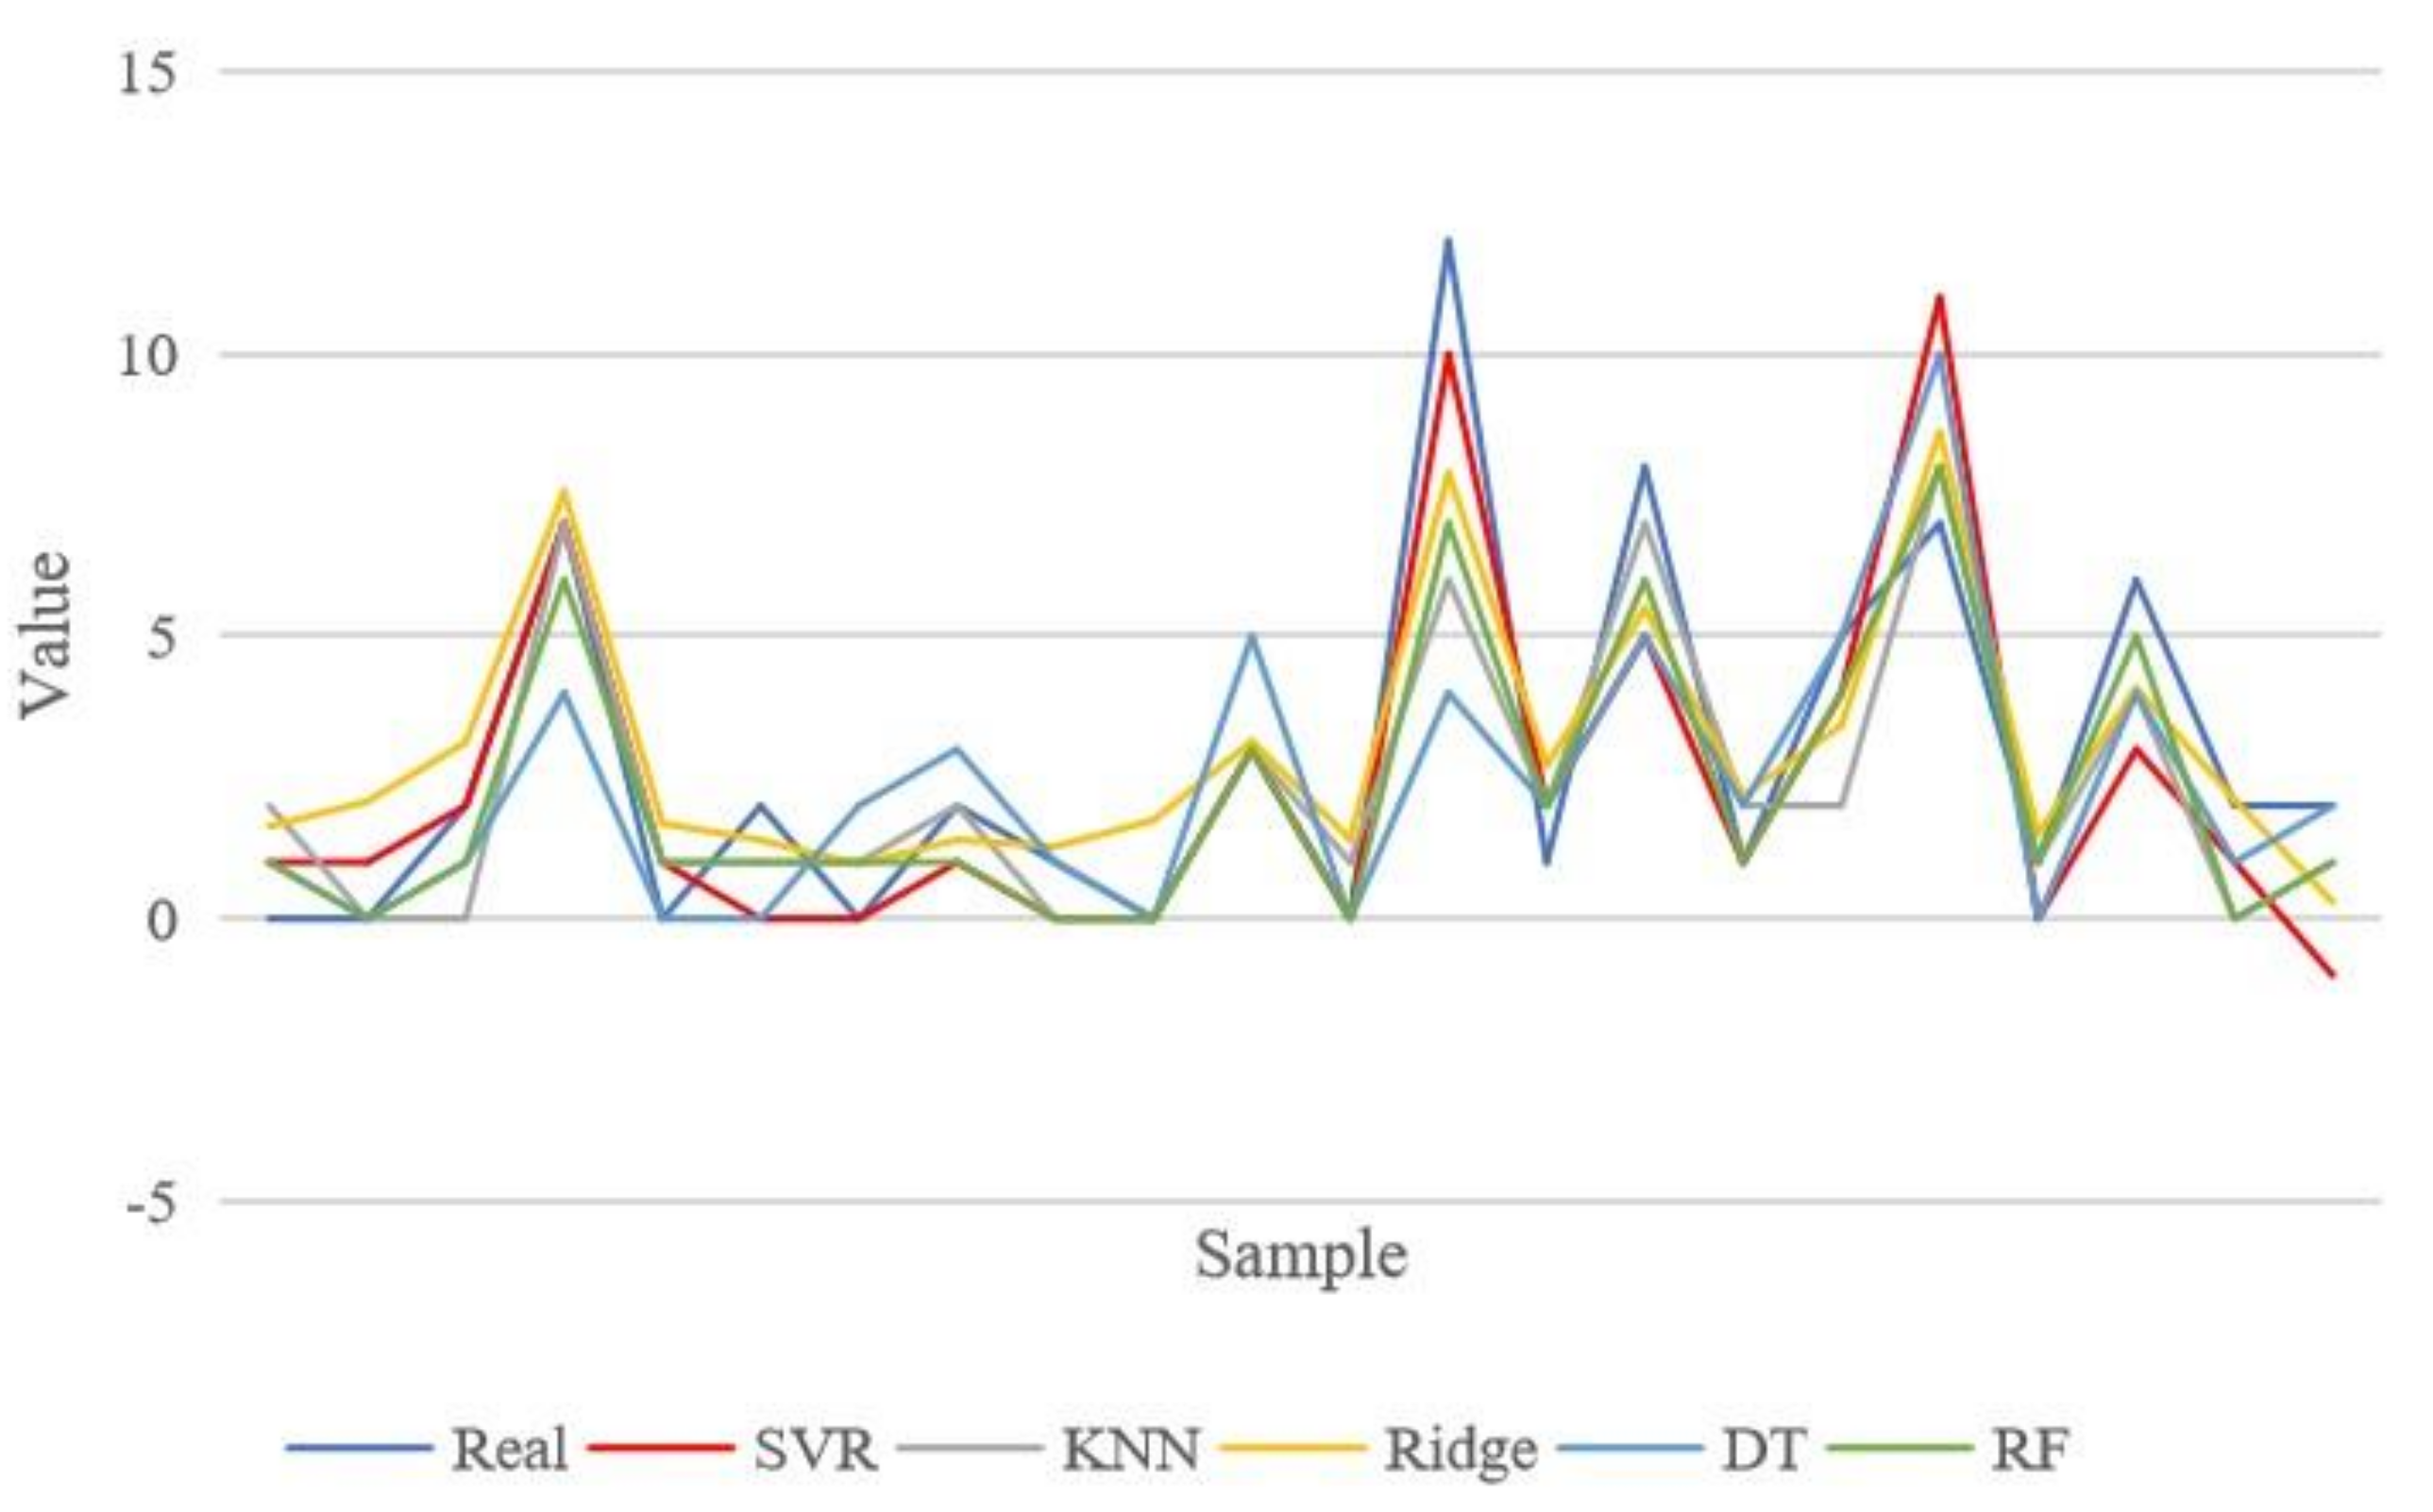
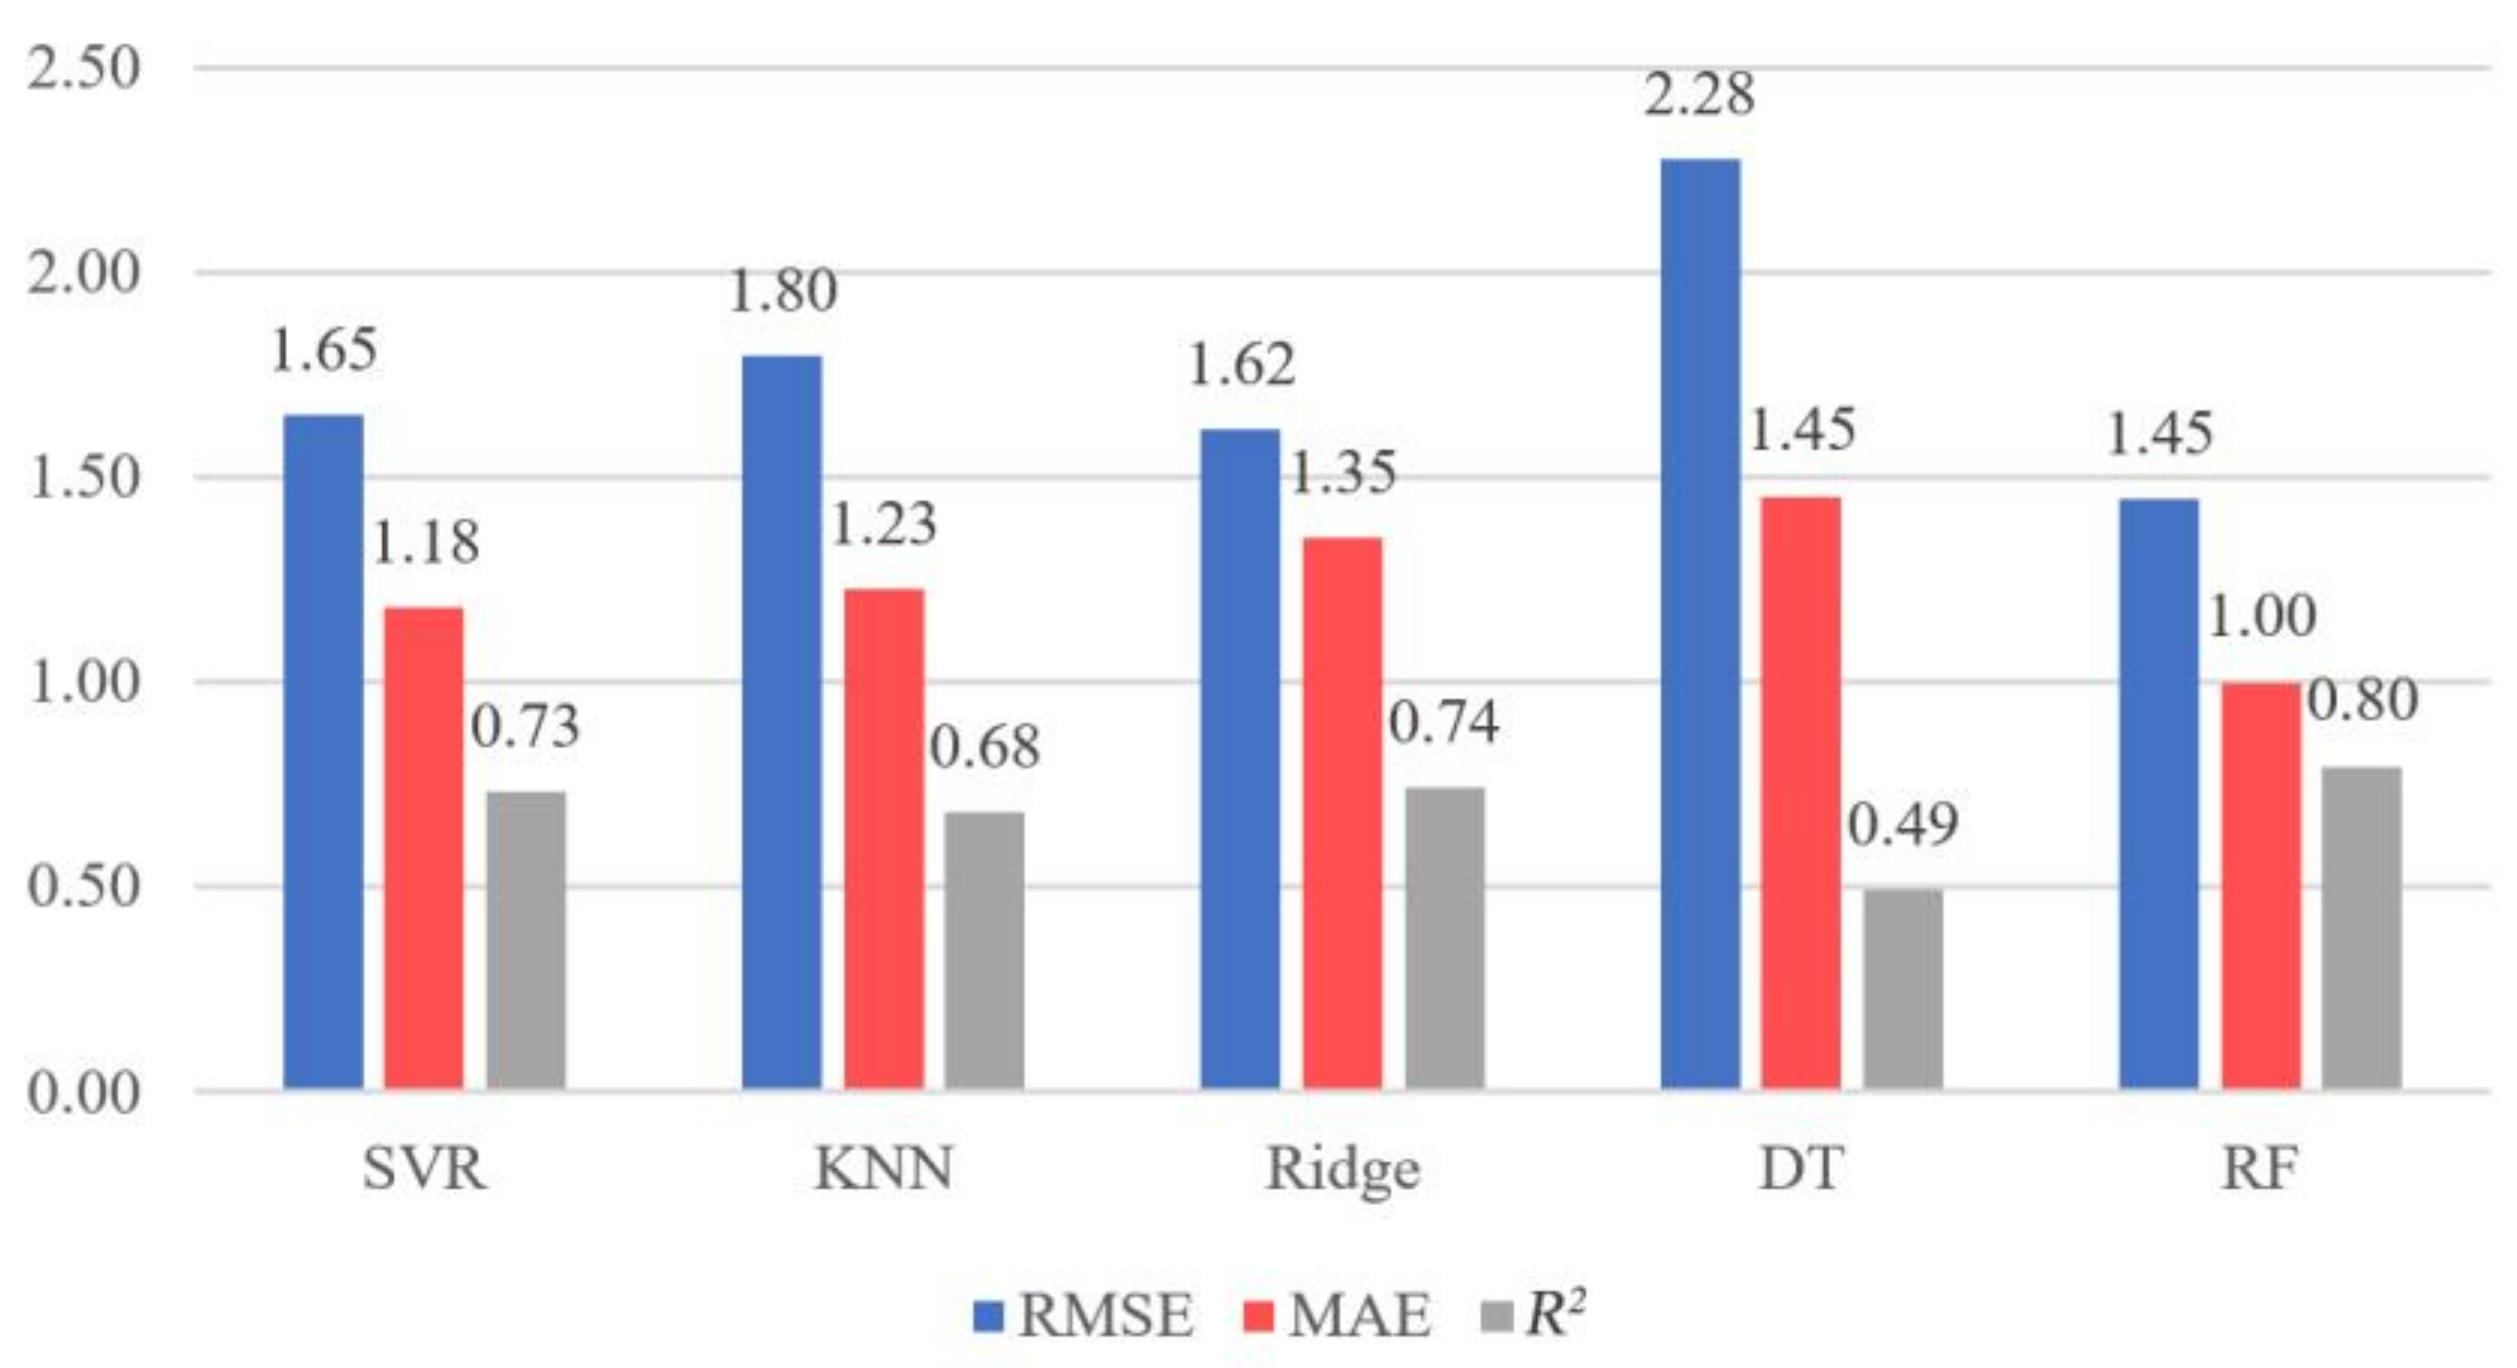
From Figure 10, it can be observed that initially, all models’ predicted values exhibit a relatively small error compared to the real values. However, at the third sample, the Decision Tree (DT) model fails, resulting in a significant deviation between its predicted values and the real values. In contrast, the random forest (RF) model maintains a relatively small error within a certain range. Between the fourth and eleventh samples, the RF model consistently demonstrates smaller prediction errors compared to the ground truth values, and in multiple instances, the predicted values align closely with the real values. At the 12th sample, there is a drastic change in the real value, leading to poor predictions from almost all models. However, at the 13th sample, when the ground truth value quickly returns to its previous level, the RF model promptly captures this change and maintains a small error in subsequent samples. The data in Figure 11 confirm the superiority of the RF model, as it exhibits the smallest RMSE and MAE values while achieving the highest R2 value in its predictions.

5. Discussion

5.1. Age-Friendly Renovation in Community Outdoor Spaces

Typically, priority is given to addressing the physical and safety needs of the elderly in outdoor space planning and design [63], while their social needs and preferences are often overlooked. However, compared to the subjective experience of planners and designers, the actual needs of elderly users should receive more attention [64,65,66]. The views and preferences of the elderly are important factors to consider in the co-design of age-friendly communities, hence the necessity to focus on the role of outdoor spaces in promoting active aging [67]. Furthermore, the perspectives of the elderly are seen as key to understanding age-friendly environments. Plouffe and Kalache (2010) pointed out that the elderly have valuable insights into creating age-friendly urban environments [68]. The experiences of the elderly in using community outdoor spaces and their emotional attachment to the community can provide guidance to planners and designers [69]. In the renovation of outdoor spaces in old communities, the elderly, as the primary residential group, should be taken into full consideration, adopting different standards from the outdoor space design in new communities. Therefore, this study focuses on the preferences of the elderly in the planning and design of outdoor spaces under the context of community renewal.
This paper aims to study the environmental preferences of the elderly when they actively participate in activities in community outdoor spaces. By observing the spaces they autonomously select and modestly modify, we analyze the key environmental elements influencing their choices. The elderly’s active participation in space construction reflects a sense of place and belonging, particularly for those living in urban areas. The self-built outdoor space stimulates their autonomy and increases their motivation for community participation [70]. Compared to traditional studies where the elderly passively use spaces, this research focuses on the environmental characteristics of community outdoor spaces that the elderly spontaneously gather in and autonomously build from a self-built perspective. This study focuses on the subjective spatial environmental preferences of the elderly.
This study emphasizes that the renovation of outdoor spaces in older urban neighborhoods should cater to the unique needs of the relatively concentrated elderly population [66]. Firstly, they need to maintain interaction among themselves to avoid feelings of loneliness [71]. It is shown in this paper that elderly individuals tend to choose self-built outdoor spaces near high-traffic pedestrian routes for two reasons: psychologically, this can satisfy their desire to observe passers-by as there are many people passing by, thus increasing the chance for incidental conversations with acquaintances; from an objective environmental perspective, high pedestrian traffic indicates that there are facilities or spaces nearby that attract people, such as markets or garbage stations, indicating high accessibility and attractive spatial dynamics.

5.2. Strategies for Updating Community Outdoor Spaces

Existing studies often focus on individual activities of the elderly, paying less attention to their social activities [70,72]. Some of the literature suggest that the primary reasons for the elderly to visit outdoor spaces are “socializing and physical activities” [73]. In the surveyed Zhuguang community, the interviewed elderly expressed a clear need for “socializing and chatting”. The 11 spaces spontaneously constructed by residents in the surveyed community are relatively small in area, but they all qualify as conversational spaces that can accommodate 4–12 chairs. In some areas where space is ample, chairs are arranged in an enclosed way, which is more conducive to user interaction. Therefore, the layout of community outdoor spaces should encourage interaction among the elderly rather than solitary use of facilities.
Improving the thermal and noise environments of community outdoor spaces can encourage more elderly residents to stay outdoors [74,75]. In the Zhuguang community, elderly residents tend to use outdoor spaces with lower temperatures and higher relative humidity. Therefore, shading facilities can be added to reduce the temperature of outdoor spaces, and greenery can be planted to increase air humidity. Data analysis shows that the elderly prefer to use outdoor spaces with higher noise levels, which only indicates that they may enjoy relatively lively outdoor spaces. However, it cannot be proven whether excessive noise that causes discomfort is detrimental to the use of space.
In addition to directly improving the environment of outdoor spaces, the random forest model resulting from this study can predict the number of people staying in outdoor spaces based on environmental element values. This application can be used in community renovation planning and design. During community updates, there is often a shortage of outdoor leisure spaces [73]. Therefore, the ability to choose a location that effectively utilizes space holds practical significance. Through the random forest model constructed by this study, it is possible to judge whether a particular space in the community is suitable for elderly activities and how many elderly adults would gather there by measuring environmental parameters. It is also possible to determine the number of seats in the space based on predicted values.
The model established in this study demonstrates good adaptability. It can assist in community update planning and design, help in selecting outdoor spaces, and improve the quality of the outdoor environment. Nevertheless, the fact that the data sample is targeted at elderly residents is a limitation of this study. The model established is only applicable to urban communities with similar climates and similar age structure of the population. However, the methods used in this study can be applied to cities with different climates and different population compositions.

6. Conclusions

This study selected the case of outdoor community spaces organically formed by the elderly and used objective methods to analyze the elderly’s usage preferences for outdoor spaces. The results showed that environmental elements can influence the elderly’s choices for using spaces, thereby affecting their utilization of these spaces. In order to improve the efficiency of outdoor space use, creating a comfortable and friendly environment is crucial.
As a result of this study, some findings and suggestions could be presented as follows:
(1)
This study clearly reveals the relationship between thermal environment, noise, pedestrian traffic, and the number of residents staying in outdoor spaces. The environmental elements affecting the usage of outdoor spaces by community residents, especially the elderly, are temperature, relative humidity, pedestrian traffic, and noise, in that order.
(2)
The temperature is negatively correlated with the elderly’s spontaneous usage of outdoor spaces. Although the elderly’s ability to perceive heat is weakened, they prefer to choose shaded spaces for leisure and communication in summer.
(3)
The pedestrian traffic of the road is positively correlated with the number of residents staying in nearby outdoor spaces, indicating that the elderly prefer to use outdoor spaces in locations such as traffic intersections and roadsides with large pedestrian traffic.
(4)
Noise is positively correlated with the elderly’s usage of outdoor spaces. Elderly residents are not highly sensitive to noise but rather like lively outdoor environments, which may have potential association with their psychological state of loneliness.
(5)
The random forest regression model predicts the number of residents staying in community outdoor spaces with the best effect (R2 = 0.7958), with independent variables being temperature, relative humidity, pedestrian traffic, and noise, in that order.
Although the analysis method selected in this study is objective, social factors were incorporated when selecting cases. All 15 outdoor spaces in the Zhuguang community are areas where elderly individuals are densely active, among which 11 spaces were spontaneously built by the elderly. This not only reflects their preferences for the environment but also expresses the social needs of the group. Therefore, the policy should encourage the elderly to participate in community construction, express their needs and preferences, and plan outdoor spaces, which are of great significance for enhancing the happiness of the elderly and promoting active aging. Furthermore, the communication function of community outdoor spaces is meaningful, especially in communities with a high concentration of the elderly. They spend most of their leisure time resting in community outdoor spaces and chatting with acquaintances. As a result, planning and design should fully consider the communication and interaction function of the space, ensuring the close connection of the elderly with the natural and social environment.

Author Contributions

Conceptualization, X.Y., D.X. and Y.Z.; methodology, X.Y.; software, Y.F. and Y.D.; validation, Y.F. and Y.D.; formal analysis, X.Y.; investigation, X.Y. and Y.F.; resources, X.Y. and Y.F.; data curation, Y.F.; writing—original draft preparation, X.Y.; writing—review and editing, D.X. and Y.Z.; visualization, Y.F. and Y.D.; supervision, D.X.; project administration, Y.Z.; funding acquisition, X.Y. All authors have read and agreed to the published version of the manuscript.

Funding

The work is financially supported by The National Natural Science Foundation of China (grant no. 52208015), the Natural Science Foundation Project of Guangdong Province (2023A1515011364), and the Innovation Training Project of Provincial College Students of Guangzhou University (s202211078176).

Institutional Review Board Statement

The study was conducted in accordance with the Declaration of Helsinki and approved by the Zhuguang Community Committee.

Informed Consent Statement

Informed consent was obtained from all subjects involved in the study.

Data Availability Statement

The data presented in this study are available on request from the corresponding author. The data are not publicly available due to the protection of subjects’ personal information as well as their privacy.

Conflicts of Interest

The authors declare no conflict of interest.

References

  1. Li, J.M.; Han, X.L.; Zhang, X.X.; Wang, S.X. Spatiotemporal evolution of global population ageing from 1960 to 2017. BMC Public Health 2019, 19, 127. [Google Scholar] [CrossRef] [PubMed]
  2. Bulletin of the 7th National Census of Yuexiu District, Guangzhou, China. Available online: http://www.yuexiu.gov.cn/zwgk/sjfb/tjgb/content/post_7326279.html (accessed on 25 June 2023).
  3. Lak, A.; Aghamolaei, R.; Baradaran, H.R.; Myint, P.K. A Framework for Elder-Friendly Public Open Spaces from the Iranian Older Adults’ perspectives: A Mixed-Method Study. Urban For. Urban Green. 2020, 56, 126857. [Google Scholar] [CrossRef]
  4. Chang, P.-J.; Wray, L.; Lin, Y. Social relationships, leisure activity, and health in older adults. Health Psychol. 2014, 33, 516. [Google Scholar] [CrossRef] [PubMed] [Green Version]
  5. Koohsari, M.J.; Mavoa, S.; Villanueva, K.; Sugiyama, T.; Badland, H.; Kaczynski, A.T.; Owen, N.; Giles-Corti, B.J.H. Public open space, physical activity, urban design and public health: Concepts, methods and research agenda. Health Place 2015, 33, 75–82. [Google Scholar] [CrossRef] [Green Version]
  6. Mohammad-Moradi, A.; Yazdanfar, S.-A.; Norouzian-Maleki, S. Technology. Exploring the Sense of Place Components in Historic Districts: A Strategy for Urban Designers and Architects. Iran Univ. Sci. Technol. 2020, 30, 30–43. [Google Scholar]
  7. Motomura, M.; Koohsari, M.J.; Lin, C.-Y.; Ishii, K.; Shibata, A.; Nakaya, T.; Kaczynski, A.T.; Veitch, J.; Oka, K. Associations of public open space attributes with active and sedentary behaviors in dense urban areas: A systematic review of observational studies. Health Place 2022, 75, 102816. [Google Scholar] [CrossRef]
  8. Wei, Z.; Jiejing, W.; Bo, Q.J.L. Quantity or quality? Exploring the association between public open space and mental health in urban China. Landsc. Urban Plan. 2021, 213, 104128. [Google Scholar]
  9. Jian, I.Y.; Chan, E.H.; Xu, Y.; Owusu, E.K. Inclusive public open space for all: Spatial justice with health considerations. Habitat Int. 2021, 118, 102457. [Google Scholar] [CrossRef]
  10. Kemperman, A.; Timmermans, H. Green spaces in the direct living environment and social contacts of the aging population. Landsc. Urban Plan. 2014, 129, 44–54. [Google Scholar] [CrossRef]
  11. Van Melik, R.; Pijpers, R. Older people’s self–selected spaces of encounter in urban aging environments in the Netherlands. City Community 2017, 16, 284–303. [Google Scholar] [CrossRef]
  12. Pijpers, R.; van Melik, R.J.H.D.; Ly Serena, K. Looking, observing, watching: Meaningful contact at a distance. In Age-Inclusive Public Space; Hatje Cantz Verlag: Berlin, Germany, 2020; pp. 81–83. [Google Scholar]
  13. World Health Organization. Global Age-Friendly Cities: A Guide; World Health Organization: Geneva, Switzerland, 2007. [Google Scholar]
  14. Jia, S.; Wang, Y.; Wong, N.H.; Chen, W.; Ding, X. Environment. Influences of the thermal environment on pedestrians’ thermal perception and travel behavior in hot weather. Build. Environ. 2022, 226, 109687. [Google Scholar] [CrossRef]
  15. Liu, J.; Wei, Y.; Lu, S.; Wang, R.; Chen, L.; Xu, F. The elderly’s preference for the outdoor environment in Fragrant Hills Nursing Home, Beijing: Interpreting the visual-behavioural relationship. Urban For. Urban Green. 2021, 64, 127242. [Google Scholar] [CrossRef]
  16. Yung, E.H.K.; Ho, W.K.O.; Chan, E.H.W. Elderly satisfaction with planning and design of public parks in high density old districts: An ordered logit model. Landsc. Urban Plan. 2017, 165, 39–53. [Google Scholar]
  17. Yu, S.; Guo, N.; Zheng, C.; Song, Y.; Hao, J. Investigating the association between outdoor environment and outdoor activities for seniors living in old residential communities. J. Environ. Res. Public Health 2021, 18, 7500. [Google Scholar] [CrossRef] [PubMed]
  18. Böcker, L.; Uteng, T.P.; Liu, C.; Dijst, M. Weather and daily mobility in international perspective: A cross-comparison of Dutch, Norwegian and Swedish city regions. Transp. Res. Part D Transp. Environ. 2019, 77, 491–505. [Google Scholar] [CrossRef]
  19. Labdaoui, K.; Mazouz, S.; Acidi, A.; Cools, M.; Moeinaddini, M.; Teller, J. Utilizing thermal comfort and walking facilities to propose a comfort walkability index (CWI) at the neighbourhood level. Build. Environ. 2021, 193, 107627. [Google Scholar] [CrossRef]
  20. Sugiyama, T.; Gunn, L.D.; Christian, H.; Francis, J.; Foster, S.; Hooper, P.; Owen, N.; Giles-Corti, B. Quality of public open spaces and recreational walking. Am. J. Public Health 2015, 105, 2490–2495. [Google Scholar] [CrossRef] [PubMed]
  21. Močnik, Š.; Moogoor, A.; Yuen, B. Exploring facilitators and barriers of older adults’ outdoor mobility: A walk-along study in Singapore. J. Transp. Health 2022, 26, 101386. [Google Scholar] [CrossRef]
  22. Huang, T.; Li, J.; Xie, Y.; Niu, J.; Mak, C.M. Simultaneous environmental parameter monitoring and human subject survey regarding outdoor thermal comfort and its modelling. Build. Environ. 2017, 125, 502–514. [Google Scholar] [CrossRef]
  23. Nikolopoulou, M.; Steemers, K. Thermal comfort and psychological adaptation as a guide for designing urban spaces. Energy Build. 2003, 35, 95–101. [Google Scholar] [CrossRef]
  24. Nikolopoulou, M.; Lykoudis, S. Use of outdoor spaces and microclimate in a Mediterranean urban area. Build. Environ. 2007, 42, 3691–3707. [Google Scholar] [CrossRef] [Green Version]
  25. Huang, J.; Zhou, C.; Zhuo, Y.; Xu, L.; Jiang, Y. Outdoor thermal environments and activities in open space: An experiment study in humid subtropical climates. Build. Environ. 2016, 103, 238–249. [Google Scholar] [CrossRef] [Green Version]
  26. Lee, L.S.; Cheung, P.K.; Fung, C.K.; Jim, C.Y. Improving street walkability: Biometeorological assessment of artificial-partial shade structures in summer sunny conditions. Int. J. Biometeorol. 2020, 64, 547–560. [Google Scholar] [CrossRef] [PubMed]
  27. Peng, S.; Maing, M. Influential factors of age-friendly neighborhood open space under high-density high-rise housing context in hot weather: A case study of public housing in Hong Kong. Cities 2021, 115, 103231. [Google Scholar] [CrossRef]
  28. Lottrup, L.; Stigsdotter, U.K.; Meilby, H.; Corazon, S.S. Associations between use, activities and characteristics of the outdoor environment at workplaces. Urban For. Urban Green. 2012, 11, 159–168. [Google Scholar] [CrossRef]
  29. Li, K.; Zhang, Y.; Zhao, L. Outdoor thermal comfort and activities in the urban residential community in a humid subtropical area of China. Energy Build. 2016, 133, 498–511. [Google Scholar] [CrossRef]
  30. Lamour, Q.; Morelli, A.M.; Marins, K.R.D.C. Improving walkability in a TOD context: Spatial strategies that enhance walking in the Belém neighbourhood, in São Paulo, Brazil. Case Stud. Transp. Policy 2019, 7, 280–292. [Google Scholar] [CrossRef]
  31. Larriva, M.T.B.; Higueras, E. Health risk for older adults in Madrid, by outdoor thermal and acoustic comfort. Urban Clim. 2020, 34, 100724. [Google Scholar] [CrossRef]
  32. Herranz-Pascual, K.; Iraurgi, I.; Aspuru, I.; Garcia-Pérez, I.; Santander, A.; Eguiguren, J.L. Integrating soundscape criteria in urban sustainable regeneration processes: An example of comfort and health improvement. Sustainability 2022, 14, 3143. [Google Scholar] [CrossRef]
  33. Gamero-Salinas, J.; Kishnani, N.; Monge-Barrio, A.; López-Fidalgo, J.; Sánchez-Ostiz, A. Evaluation of thermal comfort and building form attributes in different semi-outdoor environments in a high-density tropical setting. Build. Environ. 2021, 205, 108255. [Google Scholar] [CrossRef]
  34. Atuoye, K.N.; Luginaah, I.; Hambati, H.; Campbell, G. Politics, economics, how about our health? Impacts of large-scale land acquisitions on therapeutic spaces and wellbeing in coastal Tanzania. Soc. Sci. Med. 2019, 220, 283–291. [Google Scholar] [CrossRef] [PubMed]
  35. Finlay, J.M. ‘Walk like a penguin’: Older Minnesotans’ experiences of (non) therapeutic white space. Soc. Sci. Med. 2018, 198, 77–84. [Google Scholar] [CrossRef] [PubMed]
  36. Triguero-Mas, M.; Anguelovski, I.; García-Lamarca, M.; Argüelles, L.; Perez-del-Pulgar, C.; Shokry, G.; Connolly, J.J.; Cole, H.V. Natural outdoor environments’ health effects in gentrifying neighborhoods: Disruptive green landscapes for underprivileged neighborhood residents. Soc. Sci. Med. 2021, 279, 113964. [Google Scholar] [CrossRef]
  37. Middleton, J. The socialities of everyday urban walking and the ‘right to the city’. Urban Stud. 2018, 55, 296–315. [Google Scholar] [CrossRef]
  38. Cambra, P.; Moura, F. How does walkability change relate to walking behavior change? Effects of a street improvement in pedestrian volumes and walking experience. J. Transp. Health 2020, 16, 100797. [Google Scholar] [CrossRef]
  39. Lee, S.; Talen, E. Measuring walkability: A note on auditing methods. J. Urban Des. 2014, 19, 368–388. [Google Scholar] [CrossRef]
  40. Chen, L.; Lu, Y.; Sheng, Q.; Ye, Y.; Wang, R.; Liu, Y. Estimating pedestrian volume using Street View images: A large-scale validation test. Comput. Environ. Urban Syst. 2020, 81, 101481. [Google Scholar] [CrossRef]
  41. Yıldız, M.; Varol, E.; Elkoca, A.; Yildirim, M.S.; Sarpdağı, Y. Determining the correlation between old age adaptation, aging in place and depression in older adults: A descriptive correlational study. Arch. Psychiatr. Nurs. 2023, 43, 153–161. [Google Scholar] [CrossRef]
  42. Bottini, L. The effects of built environment on community participation in urban neighbourhoods: An empirical exploration. Cities 2018, 81, 108–114. [Google Scholar] [CrossRef]
  43. Zhang, Z.; Feng, L.; Hu, L.; Cao, Y. Older residents’ sense of home and homemaking in rural-urban resettlement: A case study of “moving-merging” community in Shanghai. Habitat Int. 2022, 126, 102616. [Google Scholar] [CrossRef]
  44. Gaikwad, A.; Shinde, K. Use of parks by older persons and perceived health benefits: A developing country context. Cities 2019, 84, 134–142. [Google Scholar] [CrossRef]
  45. Sun, X.; Wang, L.; Wang, F.; Soltani, S. Behaviors of seniors and impact of spatial form in small-scale public spaces in Chinese old city zones. Cities 2020, 107, 102894. [Google Scholar] [CrossRef]
  46. Paukaeva, A.A.; Setoguchi, T.; Luchkova, V.I.; Watanabe, N.; Sato, H. Impacts of the temporary urban design on the people’s behavior-The case study on the winter city Khabarovsk, Russia. Cities 2021, 117, 103303. [Google Scholar] [CrossRef]
  47. Lin, T.-P.; Tsai, K.-T.; Hwang, R.-L.; Matzarakis, A. Quantification of the effect of thermal indices and sky view factor on park attendance. Landsc. Urban Plan. 2012, 107, 137–146. [Google Scholar] [CrossRef]
  48. Mao, Y.; Qi, J.; He, B.-J. Impact of the heritage building façade in small-scale public spaces on human activity: Based on spatial analysis. Environ. Impact Assess. Rev. 2020, 85, 106457. [Google Scholar] [CrossRef]
  49. Blatteis, C.M. Age-dependent changes in temperature regulation–A mini review. Gerontology 2012, 58, 289–295. [Google Scholar] [CrossRef] [PubMed]
  50. Ewing, R.; Clemente, O.; Neckerman, K.M.; Purciel-Hill, M.; Quinn, J.W.; Rundle, A. Measuring Urban Design: Metrics for Livable Places; Springer: Berlin/Heidelberg, Germany, 2013; Volume 200. [Google Scholar]
  51. Kim, S.W.; Brown, R.D. Pedestrians’ behavior based on outdoor thermal comfort and micro-scale thermal environments, Austin, TX. Sci. Total Environ. 2022, 808, 152143. [Google Scholar] [CrossRef]
  52. Rotton, J.; Shats, M.; Standers, R. Temperature and pedestrian tempo: Walking without awareness. Environ. Behav. 1990, 22, 650–674. [Google Scholar] [CrossRef]
  53. Saneinejad, S.; Roorda, M.J.; Kennedy, C. Modelling the impact of weather conditions on active transportation travel behaviour. Transp. Res. Part D Transp. Environ. 2012, 17, 129–137. [Google Scholar] [CrossRef] [Green Version]
  54. Moon, J.W. Performance of ANN-based predictive and adaptive thermal-control methods for disturbances in and around residential buildings. Build. Environ. 2012, 48, 15–26. [Google Scholar] [CrossRef]
  55. Chan, S.Y.; Chau, C.K. Development of artificial neural network models for predicting thermal comfort evaluation in urban parks in summer and winter. Build. Environ. 2019, 164, 106364. [Google Scholar] [CrossRef]
  56. Asur, F.; Deniz, S.S.; Yazici, K. Visual Preferences Assessment of Landscape Character Types Using Data Mining Methods (Apriori Algorithm): The Case of Altinsac and Inkoy (Van/Turkey). J. Agric. Sci. Technol. 2020, 22, 247–260. [Google Scholar]
  57. Bureau of Forestry and Landscaping of Guangzhou Municipality. Available online: http://lyylj.gz.gov.cn/zwgk/sjfb/content/post_8555619.html (accessed on 25 June 2023).
  58. People’s Government of Yuexiu District, Guangzhou. Available online: http://www.yuexiu.gov.cn/zzfw/zfwj/content/post_8768606.html (accessed on 25 June 2023).
  59. Cover, T.; Hart, P. Nearest neighbor pattern classification. IEEE Trans. Inf. Theory 1967, 13, 21–27. [Google Scholar] [CrossRef] [Green Version]
  60. Smola, A.J.; Schölkopf, B. A tutorial on support vector regression. Stat. Comput. 2004, 14, 199–222. [Google Scholar] [CrossRef] [Green Version]
  61. Mason, R.; Brown, W.G. Multicollinearity problems and ridge regression in sociological models. Soc. Sci. Res. 1975, 4, 135–149. [Google Scholar] [CrossRef]
  62. Loh, W.Y. Fifty years of classification and regression trees. Int. Stat. Rev. 2014, 82, 329–348. [Google Scholar] [CrossRef] [Green Version]
  63. Chaudhury, H.; Mahmood, A.; Michael, Y.L.; Campo, M.; Hay, K. The influence of neighborhood residential density, physical and social environments on older adults’ physical activity: An exploratory study in two metropolitan areas. J. Aging Stud. 2012, 26, 35–43. [Google Scholar] [CrossRef]
  64. Scheidt, R.J.; Humpherys, D.R.; Yorgason, J.B. Successful aging: What’s not to like? J. Appl. Gerontol. 1999, 18, 277–282. [Google Scholar] [CrossRef]
  65. Meggiolaro, S.; Ongaro, F. Life satisfaction among older people in Italy in a gender approach–Corrigendum. Ageing Soc. 2015, 35, 1564. [Google Scholar] [CrossRef] [Green Version]
  66. Yung, E.H.; Conejos, S.; Chan, E.H. Social needs of the elderly and active aging in public open spaces in urban renewal. Cities 2016, 52, 114–122. [Google Scholar] [CrossRef]
  67. Kelley, J.; Dannefer, D.; Masarweh, L.; Buffel, T.; Handler, S.; Phillipson, C. Age-Friendly Cities and Communities: A Global Perspective; Bristol University Press: Bristol, UK, 2018. [Google Scholar]
  68. Plouffe, L.; Kalache, A. Towards global age-friendly cities: Determining urban features that promote active aging. J. Urban Health 2010, 87, 733–739. [Google Scholar] [CrossRef] [PubMed] [Green Version]
  69. Aşur, F.; Akpınar Külekçi, E. The Relationship Between the Adorability of Urban Landscapes and Their Users Demographic Variables: The Case of Edremit, Van/Turkey. J. Int. Environ. Appl. Sci. 2020, 15, 19–25. [Google Scholar]
  70. Zhao, M.; Chen, S. A Survey on Senior/Elderly Participation in Leisure Activity in Hong Kong. Asian J. Exerc. Sport. Sci. 2013, 10, 92–101. [Google Scholar]
  71. Yung, E.H.K.; Wang, S.; Chau, C.-K. Thermal perceptions of the elderly, use patterns and satisfaction with open space. Landsc. Urban Plan. 2019, 185, 44–60. [Google Scholar] [CrossRef]
  72. Bhuyan, M.R.; Lane, A.P.; Moogoor, A.; Močnik, Š.; Yuen, B. Meaning of age-friendly neighbourhood: An exploratory study with older adults and key informants in Singapore. Cities 2020, 107, 102940. [Google Scholar] [CrossRef]
  73. Yen, H.-Y.; Lin, L.-J. Quality of life in older adults: Benefits from the productive engagement in physical activity. J. Exerc. Sci. Fit. 2018, 16, 49–54. [Google Scholar] [CrossRef] [PubMed]
  74. Liddle, J.; Ireland, D.; McBride, S.J.; Brauer, S.G.; Hall, L.M.; Ding, H.; Karunanithi, M.; Hodges, P.W.; Theodoros, D.; Silburn, P.A.; et al. Measuring the lifespace of people with Parkinson’s disease using smartphones: Proof of principle. JMIR mHealth uHealth 2014, 2, e2799. [Google Scholar] [CrossRef] [PubMed] [Green Version]
  75. Douma, L.; Steverink, N.; Meijering, L. Geographical life-space and subjective wellbeing in later life. Health Place 2021, 70, 102608. [Google Scholar] [CrossRef]
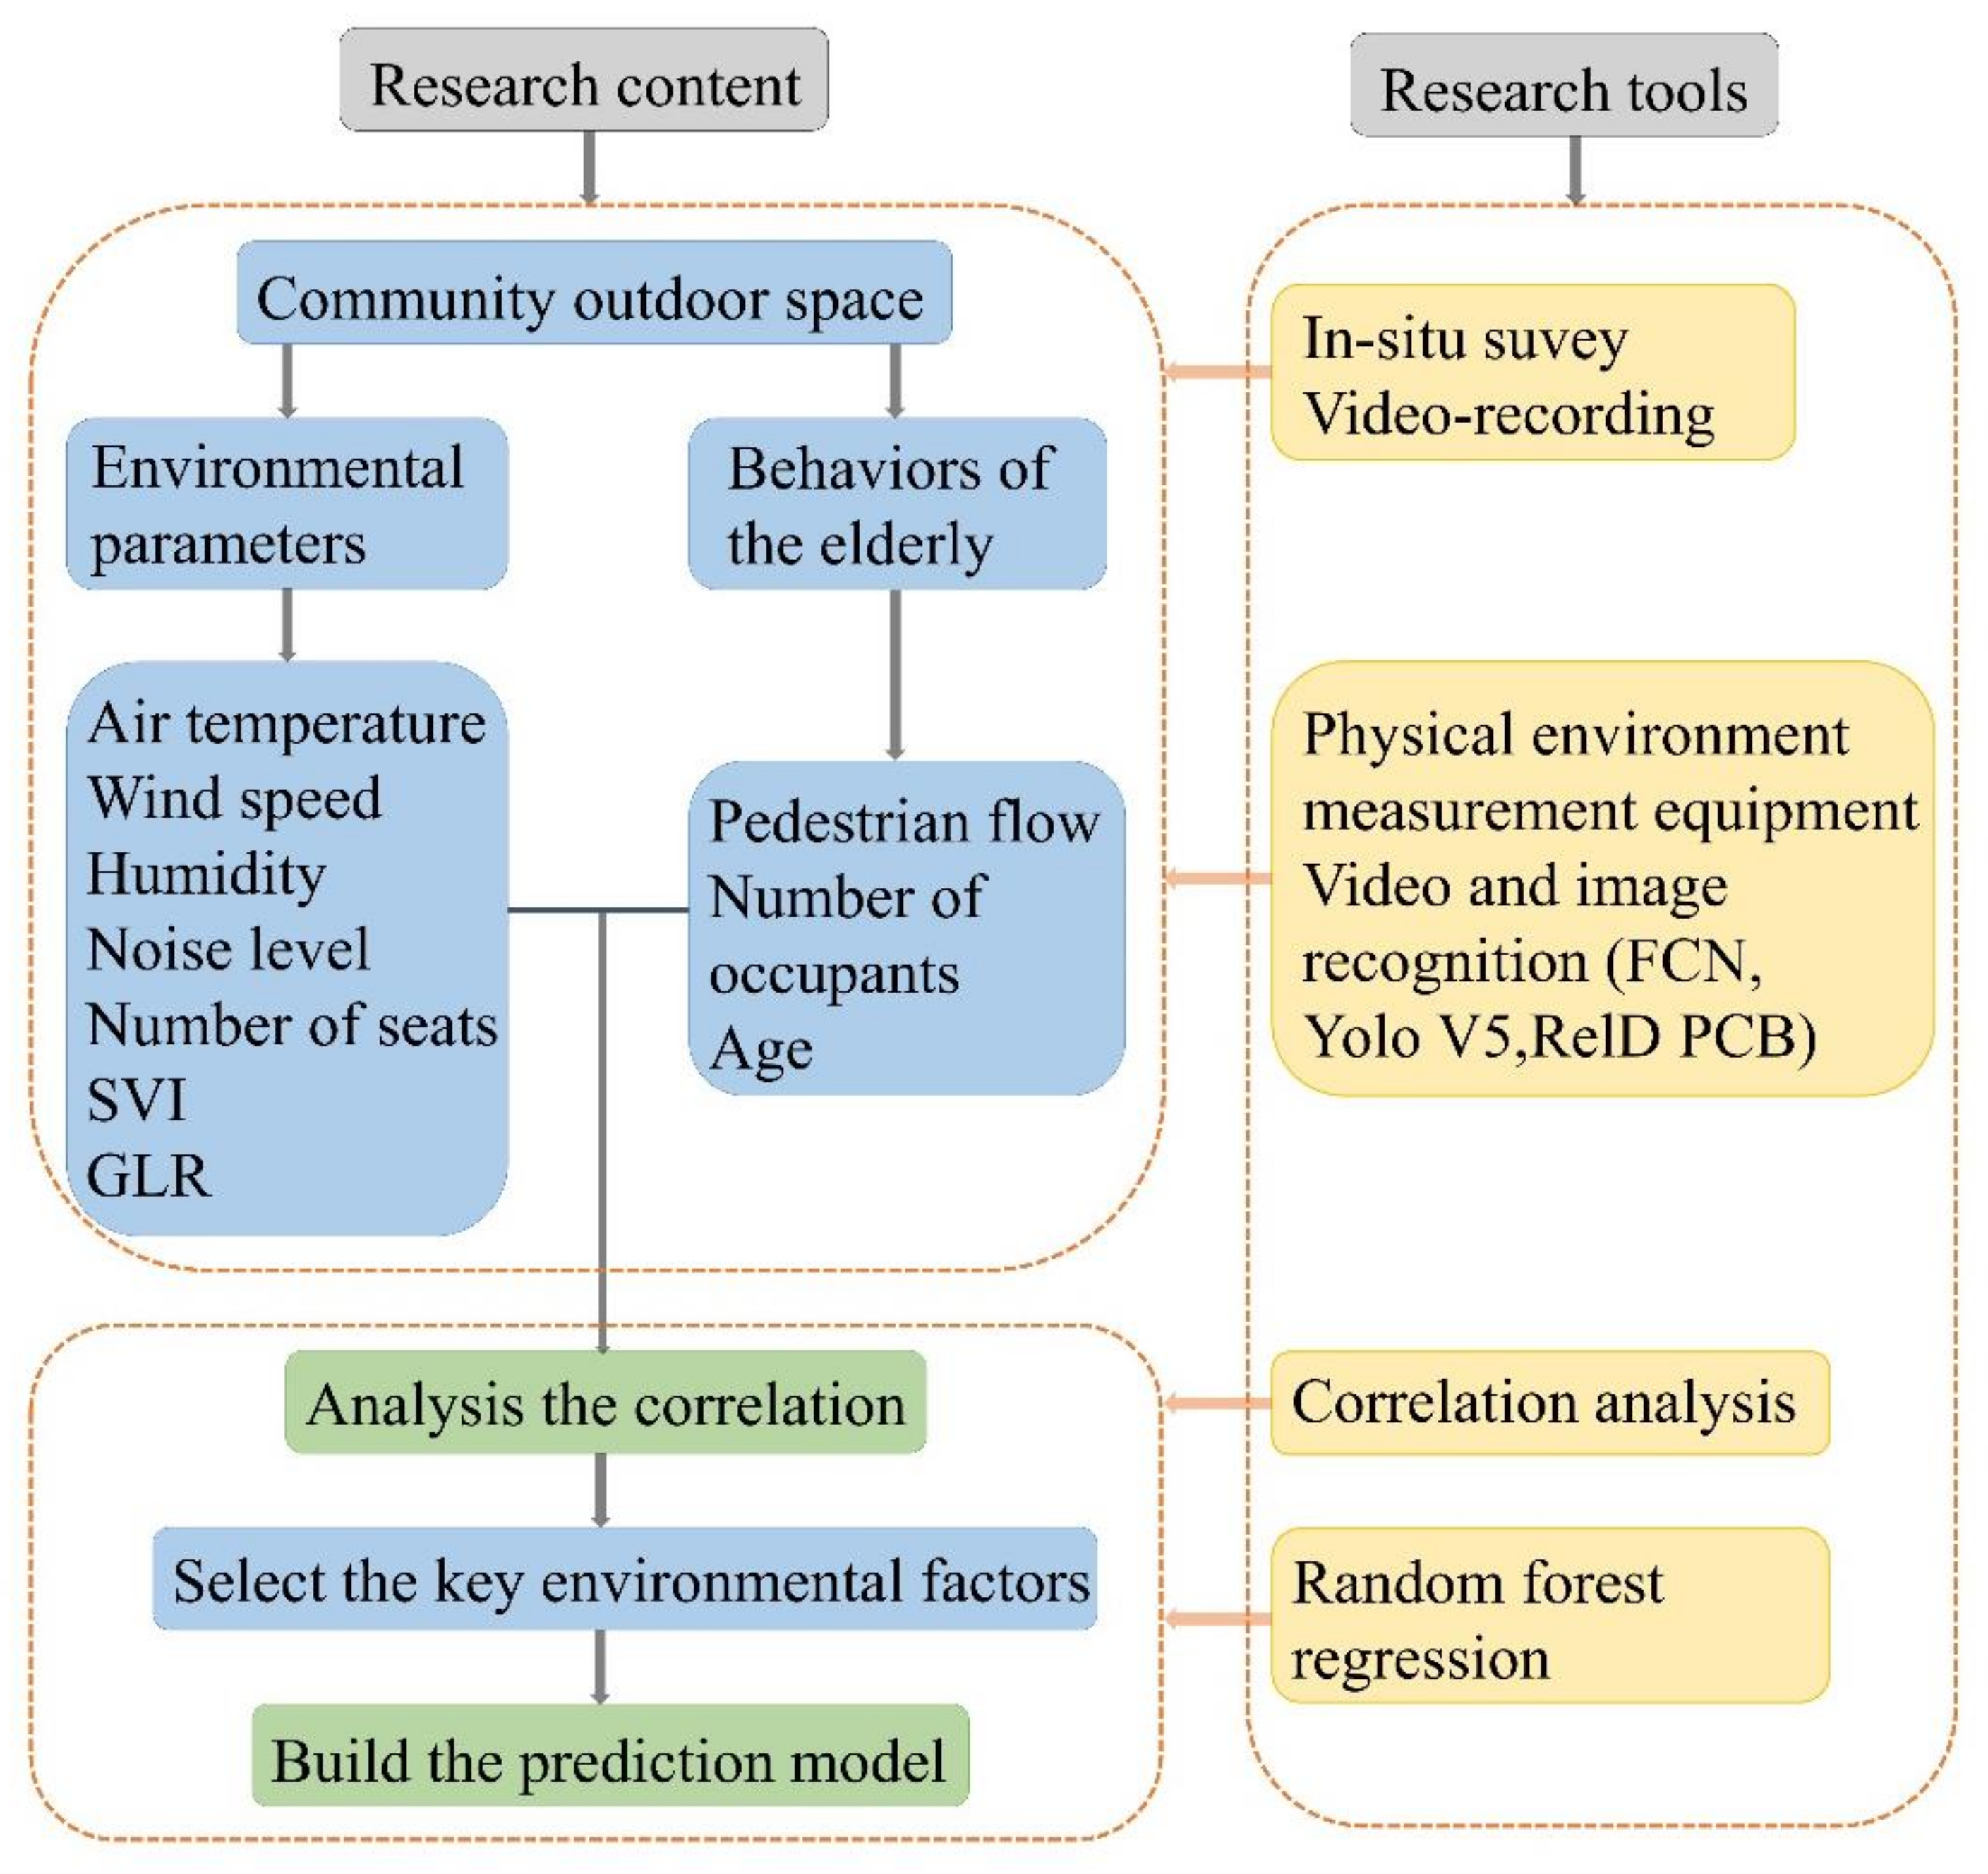
Figure 1. Research framework.
Sustainability 15 11264 g001
Figure 2. The distribution of parks and green spaces around the Zhuguang community.
Sustainability 15 11264 g002
Figure 3. The locations and site plans of the 15 surveyed outdoor spaces.
Sustainability 15 11264 g003
Figure 4. Realistic view and floor plan of each public space node of the Zhuguang community.
Sustainability 15 11264 g004aSustainability 15 11264 g004b
Figure 5. Research community data collection site.
Sustainability 15 11264 g005
Figure 6. Principle of FCN Image Operation in Deep Learning.
Sustainability 15 11264 g006
Figure 7. The structure of random forest regression.
Sustainability 15 11264 g007
Figure 8. The training process of the decision tree.
Sustainability 15 11264 g008
Figure 9. Representative environmental parameters of the 15 site surveys. (a) Pedestrian volume at each time period; (b) Number of seats and number of occupants; (c) Number of occupants at each time period; (d) Air temperature; (e) Relative humidity; (f) Wind speed; (g) Noise-LEQ; (h) SVI; (i) GLR.
Sustainability 15 11264 g009
Figure 10. Comparison between the predicted results of the random forest model and other benchmark models and the real values.
Sustainability 15 11264 g010
Figure 11. Evaluation index values of all mode l prediction results.
Sustainability 15 11264 g011
Table 1. Population and green space data of Guangzhou and Yuexiu District (2021) [57,58].
RegionArea (km2)PopulationBuilt Green Space Rate (%)Green Coverage Rate (%)Per Capita Green Space (m2)
Guangzhou7434.4018,734,10039.2643.617.33
Yuexiu District33.81,174,50029.1235.365.69
Table 2. Physical environmental parameters and survey tools.
ParametersMeasurement ToolModelManufacturer, City, CountryUnitResolution
Air temperatureTemperature/Relative Humidity Data LoggerOnset HOBO
U23-001A
Onset Computer Corporation, Bourne, MA, USA°C±0.21 °C
(0~50 °C)
Relative humidityTemperature/Relative Humidity Data LoggerOnset HOBO
U23-001A
Onset Computer Corporation, Bourne, MA, USA%±2.5% RH
Wind speedMultifunctional Meteorological AnemometerKestrel NK5500NIELSEN-KELLERMAN, Boothwyn, PA, USAm/sLarger than record by 3%
Noise (Leq)Noise recorderTES-52ATES Electrical Electronic Crop, Taipei, ChinadB±1.5 dB
Table 3. Correlation between number of residents staying in the Zhuguang community outdoor spaces and environmental parameters.
Spatial ElementsCorrelation AnalysisSpace CapacitySky View IndexGreen View IndexNoiseWind SpeedTemperatureRelative HumidityPedestrian Flow
Number of residents stayingPearson0.263−0.1830.3090.581 *−0.211−0.723 **0.627 *0.712 **
Sig.0.3440.0540.2620.0230.2870.0020.0120.003
* Represents 0.01 < Sig. < 0.05, indicates significant correlation; ** Represents Sig. < 0.01, indicates highly significant correlation.
Disclaimer/Publisher’s Note: The statements, opinions and data contained in all publications are solely those of the individual author(s) and contributor(s) and not of MDPI and/or the editor(s). MDPI and/or the editor(s) disclaim responsibility for any injury to people or property resulting from any ideas, methods, instructions or products referred to in the content.