1. Introduction
Turkey is one of the fast-developing countries; therefore, its electricity demand has continuously increased in recent decades, and it is expected that this trend will continue in the future. Considering the 10 years covering years 2006–2015, it is seen that consumption has increased by 5.1% every year [
1]. As shown in
Figure 1, when the moving averages of the previous 5 years are calculated for the last 10 years, it is seen that consumption has increased by 5.78 percent on average every year [
2].
In this study, the efficiencies of wind power plants are examined in the Marmara Region of Turkey. Conventional carbon-fueled power plants are not capable of meeting the growing demand for electricity both economically and environmentally [
3]. Considering energy efficiency and climate change, the traditional methods of conventional carbon-fueled power plants are changing. Consequently, renewable energy sources are becoming increasingly popular because of this change. In addition, renewable energy sources are becoming increasingly accessible in terms of price and quantity, and their inputs are clean and continuous.
Renewable energy can be briefly defined as the type of energy that continuously comes from the natural environment or is obtained from sources that are accessed repeatedly [
4]. Renewable sources of energy are accepted as sustainable energy sources, as well as being obtained from natural sources, such as solar, wind, hydraulic, biomass, geothermal and wave energy. In accordance with the Turkish Ministry of Energy and Natural Resources Wind Yearly Report, wind energy is ranked as the second most preferred source of renewable energy. Approximately 2% of the world’s electricity is produced from wind energy. In addition to being clean and efficient, wind energy is also a highly economical source of renewable energy. Wind energy has become increasingly popular due to its economic and environmental benefits, as well as its cost effectiveness. Turkey’s wind power capacity has been calculated as 8832 MW as of December 2020. Wind energy accounts for 8.09% of the total electricity production [
2]. Moreover, wind energy projects are usually completed in less time compared to other renewable sources, such as solar, making it a cost-effective and viable option for countries such as Turkey.
Figure 2 illustrates the change in power generated over time.
The Turkish Ministry of Energy and Natural Resources conducted research, which found that regions 50 m above ground level with wind speeds over 7.5 m/s might accommodate 5 MW wind power plants per square kilometer. As a result of these assumptions, the Wind Energy Potential Atlas (REPA), which is shown in
Figure 3, has been developed to provide information about the wind resource available based on the weather forecast model and the wind flow model. The REPA Atlas provides regional maps of the average wind power density, as well as information on the possible generation capacity, energy production and availability of wind turbines in that region.
According to
Table 1, Turkey has a wind energy potential of 48,000 MW. Turkey has already installed 272 wind power plants. According to
Figure 4 and
Figure 5, 40.09 percent of wind power plants are in the Marmara Region [
2]. The Marmara Region is also home to 80% of the total number of wind power plants under construction [
1,
5]. In order to evaluate the current and future project investments, it is important to assess wind power efficiency in the Marmara Region [
2,
5].
Using the data envelopment analysis (DEA) with the intuitionistic fuzzy COPRAS (IF-COPRAS) method, this study examines whether the wind farms in the Marmara Region are efficient. IF-COPRAS is used to enhance the DEA method by qualitative performance measures. Therefore, one of the innovations of this paper involves multiple inputs and multiple outputs as qualitative and quantitative variables to compare and evaluate several wind farms in the Marmara Region. The results of this paper include not only a quantitative ranking of efficiency but also qualitative variables, which have never appeared in the literature. The relationship between the efficiency scores of each decision-making unit and multiple input and output factors is also examined. Therefore, this paper aims to develop a systematized, sustainability-oriented evaluation framework for determining the efficiency of wind farms in Turkey.
The remainder of this paper is organized as follows. DEA applications for energy studies and integrated DEA applications with MCDM are discussed in
Section 2.
Section 3 shows the proposed methodology with DEA and fuzzy MCDM method.
Section 4 presents the case study, which includes the Marmara Region wind farms. In
Section 5, the study concludes with Conclusions and Future Work.
2. Literature Review
2.1. Renewable Energy Efficiency
The demand for energy increases daily in parallel with the growing demand for energy. However, due to the increase in energy production costs and the environmental impact, energy efficiency has become increasingly important and inevitable. There are several methods to calculate energy efficiencies in the literature, including total factor energy efficiency (TFEE) [
3,
6] and stochastic frontier analysis [
3]. DEA outperforms TFEE and SFA because of its ability to work with multiple inputs and multiple outputs [
7].
2.2. DEA Applications in Energy Efficiency
Data envelopment analysis (DEA) is a useful tool for measuring energy efficiency because it is more accurate than other methods. Charnes et al. [
8] proposed DEA as a mathematical model. It is used to determine the relative effectiveness of homogeneous decision-making units (DMUs). The benefits of DEA include (i) not having to create a production function; (ii) dealing with multiple inputs and multiple outputs; and (iii) working on a convex feasible space. By avoiding the need to construct a production function and instead working on a convex feasible space, DEA is considered more accurate than other methods in measuring energy efficiency. Different areas of DEA research are explored. Xu et al. [
7] provided a literature review of DEA in terms of energy. Kohl et al. [
9] demonstrated the application of DEA in healthcare units, and Dutta et al. [
10] presented a survey on the selection of suppliers utilizing DEA. Kaffash et al. [
11] present a literature review regarding the application of DEA in the insurance [
1,
2,
3,
4,
5,
6,
7,
8,
9].
As a widely used method for calculating energy efficiency, the data envelopment analysis method (DEA) appears in the literature. The demand for energy is increasing day by day in parallel with the growing demand for energy. However, due to the increase in energy production costs and the environmental impact, energy efficiency has become increasingly important and inevitable. As a widely used method for calculating energy efficiency, the data envelopment analysis method (DEA) appears in the literature. DEA is a non-parametric method, which aims to measure the relative performance of decision-making units (DMUs) and to identify inefficient units. It has been widely used in various fields of energy-related studies and applications, such as power systems, renewable energy sources, thermal energy systems and economic analyses.
DEA is used to evaluate the energy efficiency of renewable energy power plants. Cihen and Hu [
12] evaluated renewable energy sources based on their technical efficiency [
12]. According to the study, technical efficiency is related to the availability of renewable energy sources. DEA is used to determine the optimal network design for renewable energy plants not only in terms of economic factors but also from an environmental and social perspective [
13]. A variety of efficiency assessments have used the DEA method, including those for wind power generation [
14], rice husk power generation [
15] and solar power generation [
16]. DEA is also the preferred method for representing the advantages of a combination of energy sources [
17]. As a result, DEA is a useful tool for evaluating energy efficiency [
8,
18].
In the last decade, wind power plants have developed significantly, which has led to an increased evaluation of wind power plants. For the analysis of the efficiency of wind power plants, DEA is the preferred method, as it is in other application areas. According to the literature, DEA is used to address two types of efficiency problems in wind power plants. The first problem relates to the comparison of wind power technology with other renewable technologies. The second problem consists of the efficiency evaluation of a group of wind power plants. Examples of DEA studies on wind power plants are shown in
Table 2. Seventy-one wind power plants were evaluated by applying the DEA-CCR model, and it was found that the evaluated plants had 87% efficiency under the determined criteria. Some researchers use DEA to try to convert renewable energy sources into hydrogen energy by evaluating the efficiency of renewable energy power plants. According to the DEA findings, wind energy is the best source of energy to convert into hydrogen [
19]. Additionally, the environmental effects of wind power plants are analyzed using DEA. In this context, the environmental performance of Taiwanese offshore wind energy businesses is examined [
20]. Wind energy is also an area, which has seen the successful application of DEA. The use of DEA in wind energy studies provides an objective evaluation of the relative performance of different wind farms, with consideration of the limited availability and high cost of data acquisition [
6].
2.3. Literature Gap and Research Objectives
MCDM is one of the most used techniques for evaluating or ordering the alternatives. In this context, MCDM is utilized in renewable energy applications, such as wind power plants, in order to define their efficiency criteria [
37]. As shown in
Table 2, many research works apply DEA to evaluate wind power plants’ efficiency under the quantitative criterion. There are few studies using qualitative data through MCDM techniques. However, there are very limited studies that integrate fuzzy logic and MCDM techniques with DEA. Thus, this research is one of the first attempts to extend the DEA with intuitionistic fuzzy logic integrated into MCDM [
38].
Most DEA research energy applications assume that all parameters in the models are quantitative, as is the case with other DEA applications in different research areas. According to the literature, some researchers have applied fuzzy logic to enhance DEA models based on qualitative parameters. However, fuzzy logic increases the computational complexity of solving a DEA model. Some of the studies applied fuzzy mathematical modeling to find the best supplier, and a fuzzy data envelopment analysis (FDEA) model was created. The input criteria consisted of the production costs, lead time and supply chain carbon footprints, while the output criteria included quality and demand quantity [
39]. In the literature, AHP, DEA and TOPSIS were discovered to be the most widely used decision-making models for addressing the evaluation and selection of green suppliers [
40]. In this study, MCDM is used to rank the qualitative data of multiple inputs and outputs of DEA models numerically. Researchers will be able to use qualitative data evaluations in DEA applications because of this numerical order. Therefore, researchers are no longer limited to using only quantitative data but will also be able to apply fuzzy logic or qualitative evaluation methods to a DEA model. By introducing qualitative data into DEA models, fuzzy logic will expand the scope and applicability of the DEA technique. This opens exciting opportunities for DEA research, as qualitative data can provide additional information about the inputs and outputs of a given model. The novelty of this paper involves multiple inputs and multiple outputs as qualitative and quantitative variables to compare and evaluate several wind farms in the Marmara Region.
DEA stands out in handling multiple inputs, outputs and performance measures, but it has limitations, such as assuming identical technology, efficiency and measurable inputs and outputs without external factors affecting the performance. On the other hand, DEA may have biases, such as assuming equal efficiency for all DMUs, which may not be true due to factors such as better management practices or resource access. Additionally, identifying data challenges, such as missing data or measurement errors, is crucial for accurate DEA results. Thus, further research on DEA can incorporate environmental factors and enhance accuracy using sophisticated statistical techniques.
3. Methodology
3.1. Proposed Methodology
In this study, 10 wind power plants from the Marmara Region are evaluated using quantitative and qualitative data through the use of the IF-COPRAS and DEA models, as shown in
Figure 5. The criteria derived from the literature review, as stated in
Table 2, are crucial for evaluating the performance and effectiveness of the wind power plants. Qualitative data are explained as (i) flexibility for future expansions,
C1; (ii) working conditions refer to employee job satisfaction,
C2; (iii) environmental effects imply environmental damage,
C3; (iv) social effects refer to the impact of lifestyle habits,
C4; and (v) visual effects refer to damage to the scenery,
C5. The qualitative data are defined by applying intuitionistic fuzzy sets. Through the application of IF-COPRAS, the qualitative data are used to calculate the performance index of each DMU, and then, the DMUs are sorted numerically from highest to lowest. Therefore, at the end of the IF-COPRAS, DMUs are sorted based on their qualitative features.
C1 and
C2 are assumed as beneficiary criteria, but
C1,
C2 and
C3 are assumed as cost criteria for IF-COPRAS. The results of IF-COPRAS are implemented using DEA as one of the input parameters (
a3). On the other hand, quantitative data are explained as (1) the number of wind turbines in each wind power plant (
a1); (2) the investment cost of each wind power plant (
a2); and (3) the amount of daily production capacity (
y1).
The number of wind turbines (
a1), investment cost (
a2) and IF-COPRAS results (
a3) are assumed as input variables of the DEA; in contrast, the daily production capacity (
y1) is assumed as the output variable. The number of DMUs should be sufficient in the DEA. Cooper et al., [
41] suggest that the number of DMUs (
O) should be at least two times bigger than the sum of inputs (
at) and outputs (
yr), (
) [
41]. Therefore, in the case study of this research, 11 wind power plants are selected from the Marmara Region.
Traditional fuzzy numbers (TFN) and generalized fuzzy numbers differ in that TFN’s height is equal to unity, while IT2FN’s height ranges from zero to one. The geometrical interpretation of IT2FN is shown in
Figure 6.
Definition 1. Type 2 fuzzy set is denoted as A on the universe; is given by
where
known as the lower and upper fuzzy sets, respectively,
and
.
Definition 2. Let denote the heights of
respectively. Let
represent the non-negative real values. Then, A is defined as the interval value type 2 fuzzy set as follows:where . Moreover, if and only if . The definitions of arithmetic operations between GTFNs can be found in [
42,
43].
As a result, IT2FS provides more flexibility, resulting in a much more thorough and advantageous information transfer [
44,
45].
3.2. Intuitionistic Fuzzy COPRAS Method
In the uncertain decision-making procedure, the fuzzy sets doctrine was pioneered by Zadeh in 1965 and received much attention from decision makers [
46]. To deal with uncertainty, various approaches and doctrines have been introduced in recent years. In fuzzy sets, the membership of an element is defined as a number in the range [0, 1], and non-membership is simply its complement. As a solution to the shortcomings of fuzzy sets, Atanassov in 1986 extended the concept of fuzzy sets to intuitionistic fuzzy sets by extending a single membership function to three functions. Since intuitionistic fuzzy sets are more capable of handling uncertainty than fuzzy sets, many authors have focused on heuristic fuzzy sets and their applications [
47].
The complex proportional assessment (COPRAS) method, developed by Zavadskas and Kaklauskas in 1996, is based on the logic of evaluating and ranking alternatives according to their importance and benefit values [
48]. The aim of the method could be defined as maximizing the profit values and minimizing the cost values, which are derived from the criterion values used in the evaluation of alternatives. COPRAS is an effective and simple technique for overcoming MCDM problems. The main benefits of the COPRAS method are as follows [
49]:
- (1)
being very easy and understandable,
- (2)
assuming the proportions of ideal and anti-ideal solutions simultaneously, and
- (3)
achieving the results can be achieved in a short time.
Considering these benefits, the COPRAS approach has been expanded by a number of authors from various perspectives over the past few years. However, in the COPRAS method, alternative and criterion values are considered certain or adequate values. In the real world, this situation creates a disadvantage for decision-making problems when there is no definite and sufficient information at hand. To eliminate this uncertainty and inadequacy, the intuitionistic fuzzy COPRAS (IF-COPRAS) method has been developed [
48]. The solution steps of the IF-COPRAS method are as follows [
48,
49,
50].
Step 1: Select the linguistic ratings for the criteria and alternatives by using
Table 3.
Step 2: Create the fuzzy decision matrix, as shown in Equation (1):
where
ij represent the linguistic terms to evaluate
ith alternative under
jth criteria (
ij= (
μ(
ij),
π(
ij), ν(
ij));
m and
n represent the number of alternatives and criteria, respectively (
i = 1, …,
m and
j = 1, …,
n). The criterion weights (
wi) are assigned by the decision makers for each criterion, (
W = (
w1, …,
wn)).
Step 3: De-fuzzify
by calculating the best non-fuzzy performance (BNP) value, as shown in Equation (2):
Step 4: Create the normalized decision matrix as follows:
Step 5: Calculate the weighted normalized decision matrix based on the criterion weights (
wj):
Step 6: Calculate the
Pi and
Ri values for profit and cost criteria as follows:
where
k represents the number of criteria, which are maximized.
where there are (
m - k) criteria to be minimized.
Step 7: Calculate the relative weight of each alternative,
Qi:
where
Rmin represents the minimum value of the
Ri.
Step 8: Calculate the performance index values of the alternatives,
Ni:
where
Qmin represents the maximum value of the
Qi.
3.3. Data Envelopment Analysis (DEA)
Charnes, Cooper and Rhodes have developed the CCR model, which allows measuring the relative efficiency of units in a multiple input and multiple output environment. According to the CCR model, the scale returns are constant [
8]. There are separate
z values for each
DMUo case in the linear program solution for each DMU.
s.t.
where
defines the efficiency score of
DMUo;
shows the weight of
rth output;
shows the amount of
rth output
DMUo;
defines the weight of
tth input; and
shows the amount of
tth input
DMUj. According to the model, if the decision-making unit
o is effective, the value of the objective function
z, which is shown in Equation (9), is equal to 1. If the objective function value is less than 1, the decision-making unit is not efficient. As a result of applying the proposed linear model to each DMU, the solution of each model represents the relative efficiency of each DMU.
4. Case Study
Four experts from one of the leading wind power plant companies in Turkey with more than 10 years of experience were interviewed to determine the factors influencing wind power plant deployment to evaluate the 10 wind power plants based on the criteria (C1, C2, C3, C4 and C5), which are given as qualitative data. The MCDM and DEA methodologies offer a structured approach to decision making, considering all the relevant factors, identifying the important criteria, weighing them appropriately, identifying the trade-offs and reducing personal biases. However, they can be complex, time consuming, require significant data, be sensitive to criteria and weights, and they may not always produce clear or unambiguous results.
4.1. Fuzzy COPRAS Method
Based on the linguistic term tables and fuzzy decision matrices created using Equation (1), the experts provide their opinions based on
Table 4 and
Table 5.
By applying Equation (2), the intuitionistic fuzzy decision matrix is de-fuzzified, as shown in
Table 6.
The de-fuzzified decision matrix is converted to the normalized decision matrix by applying Equation (3), as shown in
Table 7.
According to the experts’ opinion, the criterion weights are assumed as
wj = (0.15, 0.18, 0.20, 0.17, 0.30). By applying Equation (4), the weighted normalized decision matrix is created, as shown in
Table 8.
The weighted normalized decision matrix is used to calculate
Pi,
Ri,
Qi and
Ni by applying Equations (5)–(8). The
Pi,
Ri,
Qi and
Ni values are presented in
Table 9.
4.2. Data Envelopment Analysis (DEA)
Based on the qualitative data, F-COPRAS indicates that DMU
4 has the highest performance index. Additionally, the results are presented numerically. As a result, the results could now be applied to DEA as an input value with other quantitative data. Therefore, all the inputs and outputs are quantitative data, as shown in
Table 10.
The DEA model is created by applying Equations (9)–(12) for
DMU1 as follows:
For each DMU, a DEA model must be created. After creating DEA models for the DMUs, the efficiency scores were obtained, as shown in
Table 11.
Table 11 indicates that
DMU3,
DMU5,
DMU6 and
DMU7 are found to be efficient wind power plants. The other DMU is not efficient. The less efficient
DMUs’ reference sets are shown in
Table 11. The reference sets indicate the efficient
DMUs used for comparison.
Figure 7 indicates that there is a significant difference between efficient and less efficient
DMUs. Insufficient investment plans for wind power plants may explain why there is such a large difference. The outcomes of this research reveal that (1) there is a potential to increase the efficiency of wind power plants; (2) the investment plan for wind power plants should be prepared carefully; and (3) it can be said that the relative efficiency of wind farms with similar capacities is higher if they have a small number of turbines. Moreover, this research also indicates that the optimal operation strategy is to allocate turbines of larger capacities on the downwind side and to employ smaller ones on the upwind side in order to improve efficiency. In conclusion, the findings of this research can be used to inform decision-making processes related to investment and operational strategies for wind power plants. Additionally, this research combines qualitative and quantitative data simultaneously to evaluate the
DMUs. Efficiency is not solely determined by quantitative features but also by qualitative characteristics. By incorporating qualitative data, this research enhances the generic CCR-DEA model. As a result of this research, the results contain qualitative features of efficiency and demonstrate how qualitative data influence DMU efficiency scores.
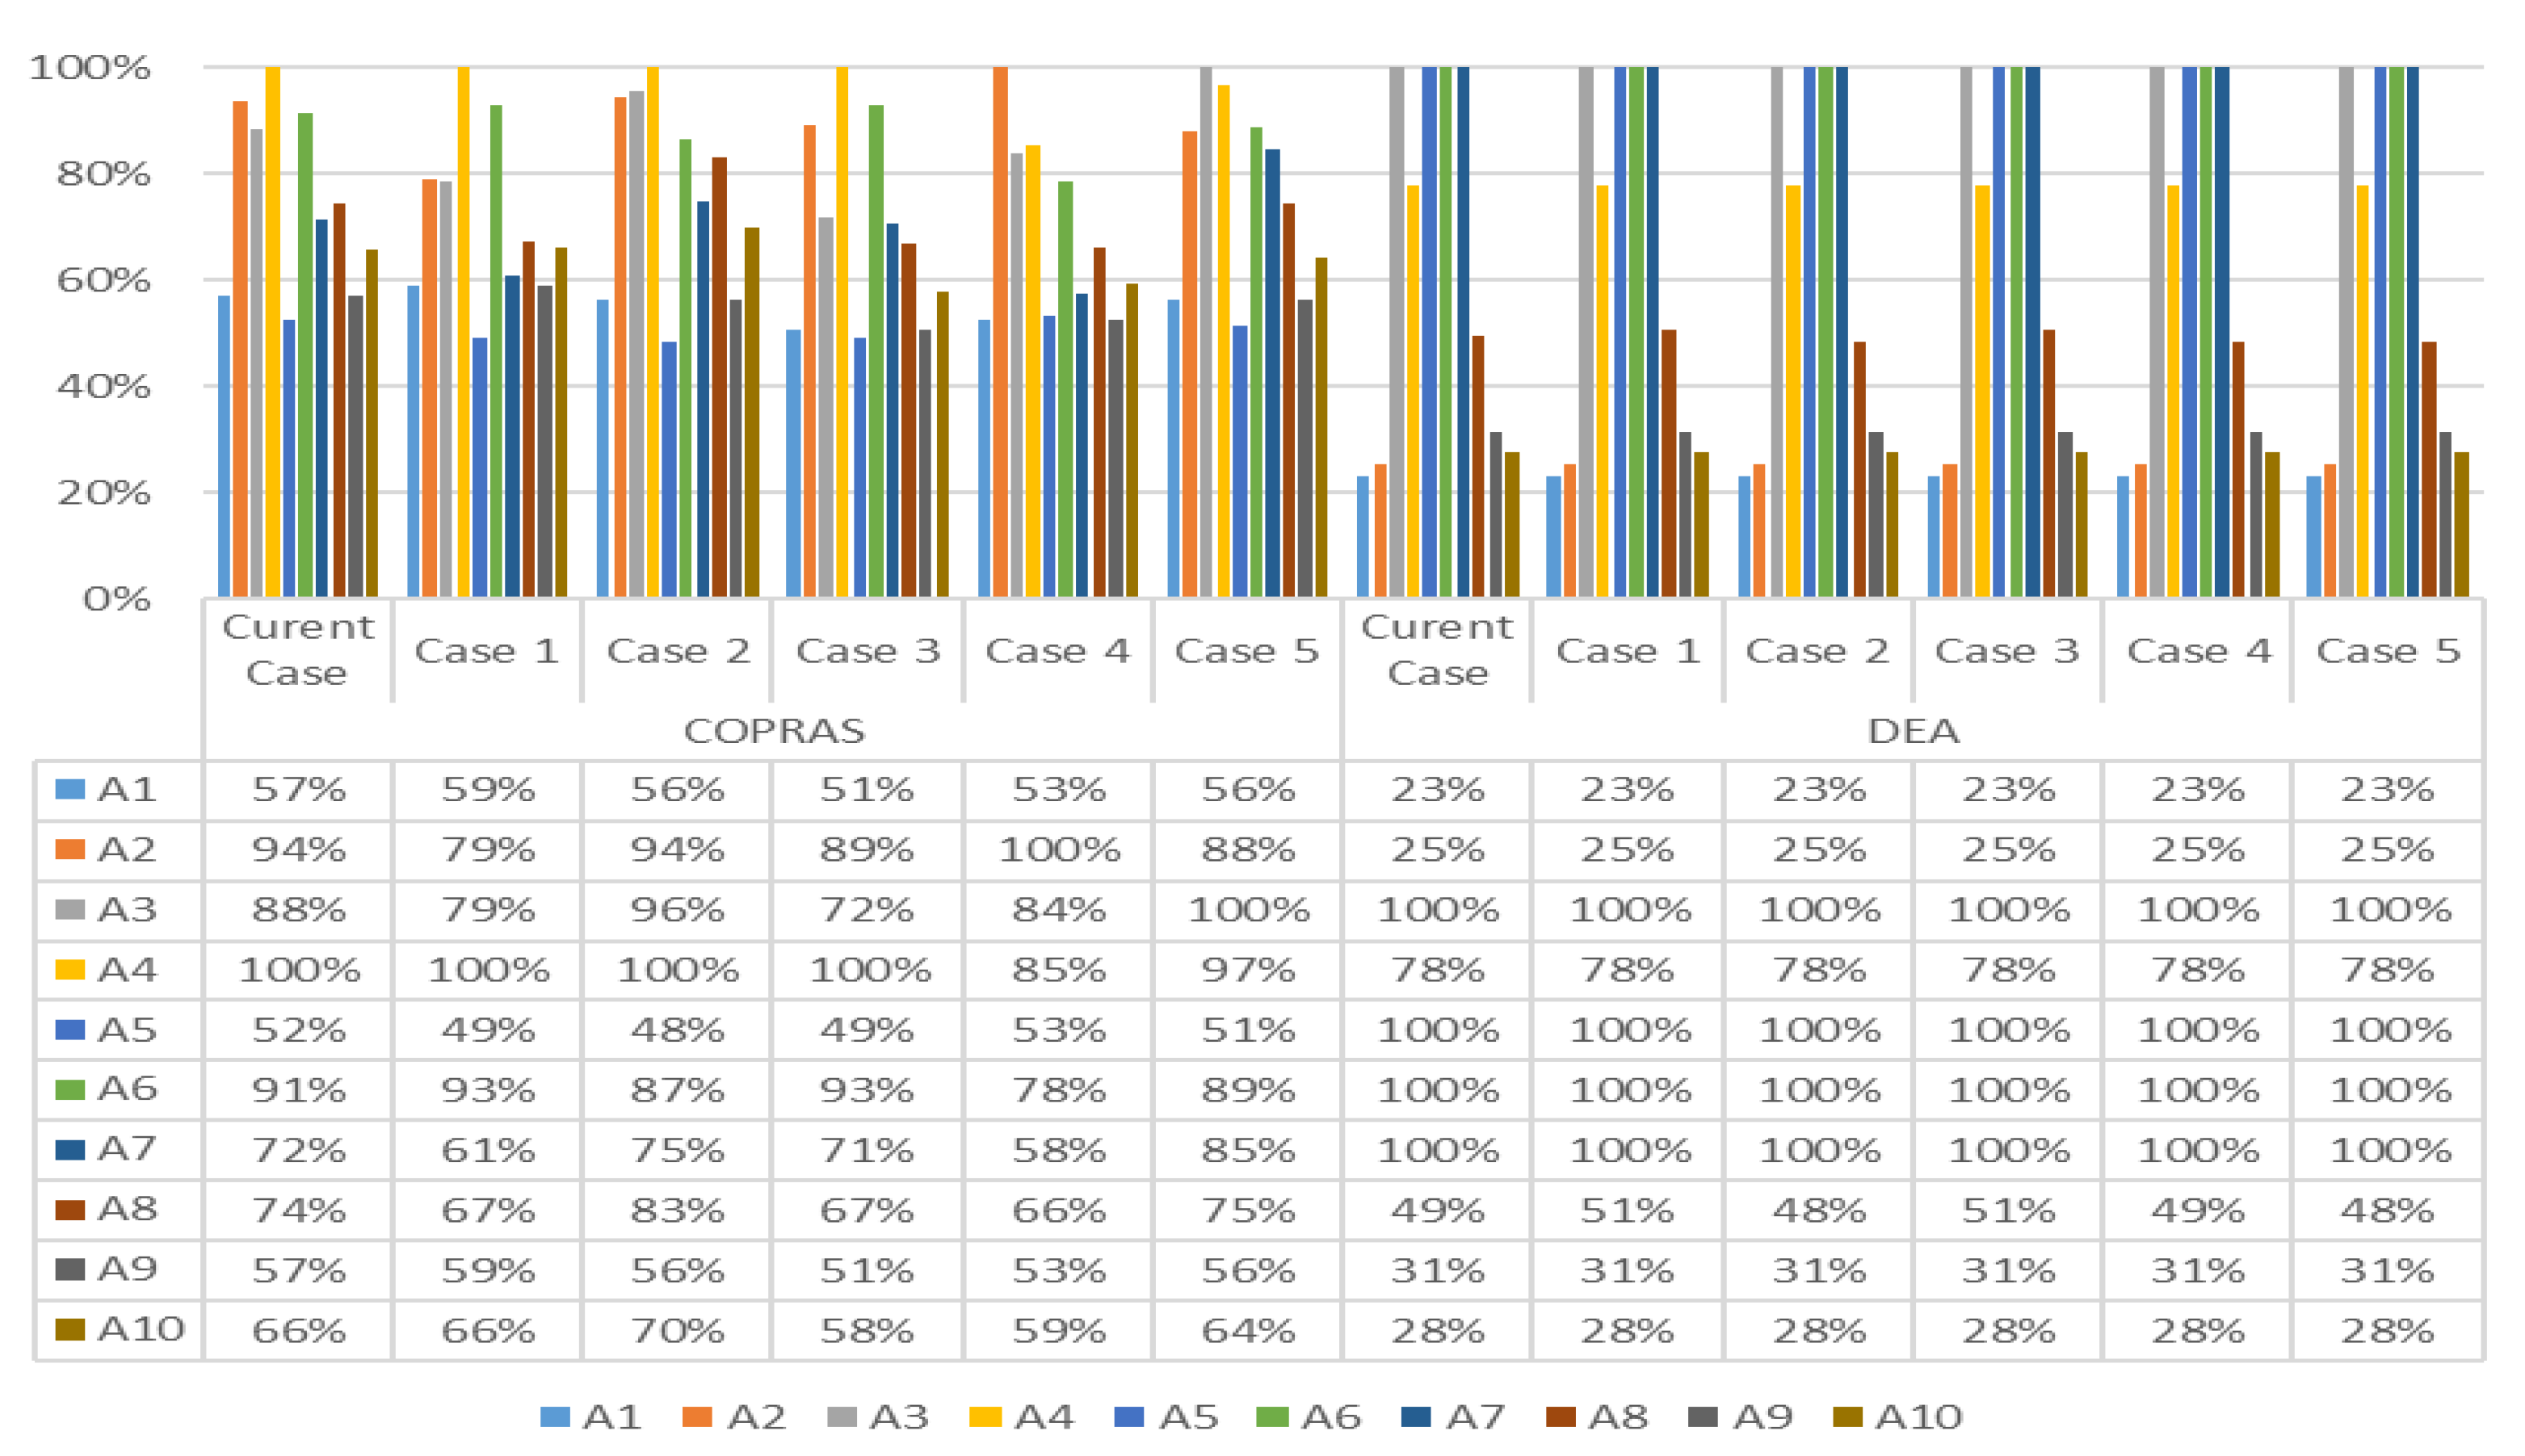
4.3. Sensitivity Analysis
A sensitivity analysis of the criteria is conducted to determine whether the results changed qualitatively when the weights of the criteria varied, and the analysis is performed to assess the adjustments for the various weight scenarios by using the linguistic variables from
Table 3.
Table 12 displays the various weight situations, which will be employed in the sensitivity analysis.
Figure 8 shows the computed criterion weights for several scenarios. In the current case,
DMU3,
DMU5,
DMU6 and
DMU7 are found to be efficient, as shown in
Figure 8. In each case, the importance of one criterion is assumed to be higher than the other criteria, as shown in
Table 12.
A sensitivity analysis of the criteria is conducted to determine whether the results changed qualitatively when the weights of the criteria varied.
Figure 8 shows that the final ranking results of the 10 wind plant efficiencies are stable even if the qualitative evaluations are changed. Therefore, the ranking results can be considered robust and reliable. This indicates that the MCDA method used in this study is suitable for decision-making problems where the criterion weights may fluctuate. It also highlights the importance of considering both quantitative and qualitative data in decision-making processes. This can lead to more comprehensive and accurate decision-making outcomes. Furthermore, it allows for a more well-rounded assessment of the situation and potential solutions. It also ensures that decision making is not solely based on numbers and statistics but also takes into account the human factor and other important factors, which may not be quantifiable. This holistic approach can lead to more effective and sustainable outcomes in the long run. According to the sensitivity analysis, the ranking outcomes of the alternatives remain similar despite weight fluctuations, and the suggested model shows stability and applicability.
5. Managerial and Practical Implications
5.1. Managerial Implications
Qualitative DEA can have major managerial implications for wind power project evaluations. It can provide a more thorough understanding of the elements that influence plant performance by combining both quantitative and qualitative data. Wind power plant managers can benefit from qualitative DEA to find opportunities for improvement in their operations. They can uncover both technical and non-technical aspects, which contribute to plant performance by studying both quantitative and qualitative data. This can include aspects such as maintenance methods, turbine technology and the quality of wind resources. Managers may undertake specific activities to improve plant performance and maximize energy generation once these areas for improvement are identified. DEA is a technique used to assess the effectiveness of wind energy for electricity generation. DEA can also help identify the areas where wind energy efficiency or CO2 emission reduction efficiency can be improved. Some strategies or actions that can be implemented to increase the efficiency of wind energy, according to DEA findings, include improving the turbine technology, increasing the turbine size, enhancing maintenance practices and increasing the capacity factor.
Qualitative DEA can allow managers to engage with stakeholders, such as local communities and regulatory bodies. Managers can better grasp their issues and goals by incorporating their qualitative opinions on plant performance and taking targeted actions to address them. This can be particularly crucial in circumstances where there is local opposition to the wind power project, as interacting with stakeholders can assist in creating positive connections and improve the plant’s social license to operate. Furthermore, qualitative DEA can assist managers in prioritizing plant investments. In this way, managers could maximize the return on investment for the plant and ensure that resources are being used effectively. Therefore, qualitative DEA can help wind power plant managers improve performance and maximize energy production by combining quantitative and qualitative data.
5.2. Practical Implications
By combining quantitative data on energy generation and qualitative data on the variables that affect plant performance, qualitative DEA can be used to assess the performance of wind power plants. Different viewpoints reveal the practical implications of employing qualitative DEA in wind power plant evaluations. Qualitative DEA can be used to pinpoint the essential elements for wind power project success. These may consist of elements such as the caliber of the available wind resources, maintenance procedures and turbine technology. Wind power plant operators can concentrate their efforts on enhancing these critical areas to increase overall plant performance by recognizing these aspects. Additionally, qualitative DEA can be used to compare the performance of a wind power station with benchmark data from other facilities operating in the same region or sector. This can assist plant managers in identifying the areas where they are underperforming relative to their peers and in taking action to improve their performance in these areas. Qualitative DEA can be used to engage with stakeholders, such as local communities and regulatory agencies, to better understand their priorities and concerns related to wind power plant performance. These outcomes can assist plant operators in addressing these concerns and developing strong relationships with stakeholders, which is critical for the facility’s long-term survival. A qualitative DEA can be used to discover the potential for improvement in wind power projects. It may disclose, for example, that specific maintenance methods or equipment changes can greatly increase plant performance. Plant operators can improve plant performance and optimize energy generation by finding these possibilities. In conclusion, by including both quantitative and qualitative data, qualitative DEA can be a beneficial tool for evaluating wind power plant performance. This can aid in identifying important success drivers, comparing the performance with industry benchmarks, engaging stakeholders and identifying the possibilities for improvement.
6. Conclusions and Future Work
The purpose of this study is to demonstrate how qualitative data can be used to extend DEA. An analysis of the efficiency of 10 wind power plants from the Marmara Region in Turkey is presented as a case study. Sensitivity analysis is anticipated to verify the proposed method and to show the scalability and applicability of research objectives. As the energy demands increased, the interest in renewable energy has increased day by day in recent years. Therefore, wind energy, which is one of the renewable energy sources, is the preferred means of meeting the energy demands of communities. The DEA and IF-COPRAS models are proposed in this study to evaluate the efficiency of 10 wind power plants located in the Marmara Region. The number of wind turbines, investment cost and outcomes of IF-COPRAS are selected as the inputs. The produced electricity is assumed as the output. The proposed model aims to remove the disadvantages of conventional DEA methods by adding fuzzy logic and being able to make better decisions in an uncertain environment. Fuzzy logic helps improve the accuracy of decision making by considering imprecise and vague information. By leveraging fuzzy logic, the decision makers can make informed choices, which account for uncertainties and improve the overall efficiency of renewable energy systems. Therefore, DEA brings about the ability to work under imprecise and vague environments. The results show that there is a substantial efficiency gap between wind power plants in the Marmara Region. The results could help decision makers in the creation of a new investment plan.
It is possible to assess the relative effectiveness of the decision-making units (DMUs) that transform inputs into outputs using the data envelopment analysis (DEA) technique. Although DEA frequently incorporates quantitative analysis, qualitative evaluations can offer significant context and insights, which can guide how DEA results are interpreted. For instance, determining the input and output variables for each DMU is one of the crucial tasks in DEA. While qualitative data may be helpful in discovering pertinent characteristics, which are difficult to quantify, quantitative data may also be helpful in this process. For instance, a qualitative evaluation of the operation of a wind power plant may reveal elements such as flexibility, social, visual or environmental effects, which are difficult to quantify through quantitative data alone.
DEA assumes that the DMUs operate in a similar context, and it does not explicitly account for environmental factors, which may alter their performance. Such elements can be found and put into context via qualitative evaluations, which can then be used to interpret DEA results. Additionally, DEA assumes that the DMUs are making rational decisions in order to maximize performance. However, qualitative analyses can be used to evaluate the DMUs’ decision-making procedures and give background information for interpreting their efficiency ratings. Engaging with stakeholders and seeking their opinions on how well the DMUs are performing can also be accomplished through qualitative evaluations. This can give vital insights into the issues that are significant to the stakeholders, and it can help ensure that the DEA analysis is in line with their objectives and values.
While different DEA types might be employed to show the impact of qualitative data on efficiency ratings, the CCR-DEA approach is chosen in this study to evaluate the DMUs. The suggested methodology could also be expanded with additional descriptive techniques. By expanding the input and output variables, the new input and output might be described, aiding in the development of recommendations for wind power facilities, which are less efficient. In addition, many multicriteria approaches and other fuzzy logic ideas could be helpful in assessing qualitative data and gathering details about unpredictable settings. Furthermore, incorporating uncertainty into the cooperative game theory might lengthen the decision-making process. In the real world, for instance, ambiguity regarding the preference structures and decision making, noise in the observation and experimental design, and incomplete information are all common. DEA evaluates the decision-making efficiency with imprecise or uncertain data. However, it faces limitations, such as limited access to accurate results due to production process complexity, external factors and large data size. Additionally, fuzzy DEA models may struggle with complex decision-making problems with multiple criteria. Stochastic optimization techniques, cooperative fuzzy bubble games or Stackelberg games, where the value of each coalition is a fuzzy value rather than an interval, could be a natural extension of cooperative bubble games in this situation. Individual biases, limited perspectives or specific organizational interests may influence the research findings. To improve the study’s reliability and validity, it is planned to involve a larger and more diverse panel of experts from various wind power plant companies, academic institutions, research organizations and relevant stakeholders in future research. The proposed methodology could also be expanded to other energy sources, such as hydropower and thermal power plants. Furthermore, the proposed methodology could be used to compare different power plants from a global perspective by considering both qualitative and quantitative factors. The proposed methodology would allow for a more comprehensive analysis of the power plants in terms of their efficiency, environmental impact and cost.
.jpg)


