1. Introduction
Good planning and construction of urban lighting (specifically during the night) can not only improve urban functions and enhance economic vitality [
1,
2], but can also improve people’s quality of life at night [
3,
4,
5]. These are key factors in effectively meeting “human needs” [
6,
7,
8] and achieving “urban sustainable development” [
9,
10,
11]. In contrast, unreasonable lighting planning and construction often have counterproductive effects, especially in public spaces [
12], adversely affecting people and the environment in areas of concern [
13,
14,
15]. For example, lighting construction is excessive in many cities [
16], resulting in nuisance caused by light pollution [
17], or energy waste [
18]. On 1 August 2022, the new Shanghai Environmental Protection Regulation came into force. It introduced the prevention of nighttime light pollution and became the first local environmental protection law in China to include light pollution control. Studies have shown that urban interventions in lighting can produce positive results [
19,
20,
21,
22,
23]. Considering the many remediation projects that aim to address dark areas in streets that have been carried out in major cities in recent years, urban lighting construction has attracted increasing social attention.
The First United Nations Conference on the Human Environment, initiated by the United Nations, was held in Stockholm, Sweden, from 5 to 16 June 1972. The conference, which produced the famous Declaration of the United Nations Conference on the Human Environment, was the first conference in human history to study the protection of the human environment on a global scale. In 2007, the United Nations Environment Programme introduced the concepts of a “low-carbon economy” and “low-carbon living” for the first time, with the aim of preserving Earth through environmental protection, energy conservation [
24,
25], and the use of renewable resources [
26]. At present, low-carbon living has become a new way of life [
27,
28,
29] and has gained increasing recognition and support [
30].
In China, especially in the current era of ecological civilization, green ecological low-carbon construction has been incorporated into the basic national policy implemented by the government. The concept of dual carbon development, which has been deeply rooted in people’s hearts, has become a guideline for urban construction [
31,
32]. Urban lighting planning should actively practice the concept of dual carbon development, and existing studies have shown a correlation between urban lighting and carbon emissions. This correlation can be obtained by comparing the nighttime lighting image data of urban clusters, represented by DMSP/OLS or NPP-VIIRS data, with the CO
2 emissions of the corresponding areas. It appears that the brightness level [
33], range, and (mainly electrical) energy consumption of nighttime lighting are positively correlated with carbon emissions [
34,
35,
36]. Urban light pollution is mainly determined by the brightness and range of lighting [
37]; if the brightness and range of lighting at night are significantly beyond reasonability in an area of a city, it increases the city’s carbon emissions. In July 2022, the Chinese Ministry of Housing and Urban-Rural Development and the Chinese Development and Reform Commission therefore issued a document to launch a comprehensive urban and rural low-carbon construction initiative (hereinafter “the initiative”), which clearly proposed that integrated research on future urban lighting planning and construction and carbon emissions should focus on how to control light pollution and excessive brightness through planning. Urban lighting planning should meet the needs of urban people and functions and put into practice a low-carbon approach to maintaining a balance between supply and demand without excessive construction. This paper presents a comparative study of supply and demand for nighttime urban lighting planning and construction, and a scientific assessment of urban lighting demand is a precondition for the study of the supply-and-demand balance. Quantitative accounting of urban lighting not only effectively assesses the reasonability of the current lighting plan, but also provides basic guidelines for scientific decision-making in future planning.
The significance of artificial light to people is self-evident [
38,
39,
40], and artificial lighting has been integrated into people’s daily lives since humans began to use fire [
41,
42]. artificial lighting has been gradually developed over time. However, in recent decades, the relationship between lighting, people, and cities has received more widespread attention. Existing studies have emphasized the impact of urban light pollution [
43,
44], while few researchers have used quantitative methods to study urban lighting demand. There are also relatively few studies on low-carbon urban lighting planning and construction. We examined the literature related to quantitative research on urban lighting demand, and then, summarized four representative research types according to our research methods and objectives. Typical case articles were selected for each type (Ye et al. [
45], Beccali et al. [
46], Hammad et al. [
47], and Gao et al. [
48]), from which the main ideas and the advantages and limitations of the various types of research are summarized in
Table 1.
From the above table, we can see that the four types of research had their own advantages and limitations. Overall, the research had the following characteristics: (1) none of the lighting demand research was directly aimed at urban areas, but it reflected a certain degree of lighting demand; (2) the research scale was either macroscopic or microscopic, but there was a lack of research aimed at the urban mesoscale; and (3) none of the research observed lighting demand from the perspective of urban planning. Nevertheless, a set of mature research ideas can still be summarized; that is, by focusing on the roles of parameters and data, as well as adopting the method of conducting a superimposed analysis by selecting multiple factors and constructing a mathematical model, we can improve the research on urban lighting demand. Moreover, questionnaires and interviews can be used as auxiliary methods of research.
It is difficult to study the mesoscale lighting demands of urban areas, which requires an operating platform that can enable data collection, calculation, and feasibility control. Fortunately, several members of our research team once participated, as key personnel, in the compilation of the Hangzhou Urban Lighting Overall Plan (2019–2025), led by the government. In the process of compilation and research, a research method similar to that used in this paper was adopted to conduct experiments on small urban areas. According to the changes in the development of lighting in Hangzhou in recent years, this method has been judged to have good operability.
In addition, we found that relatively little research has been conducted on low-carbon urban lighting planning and construction, with papers mainly published in the areas of low-carbon architectural lighting, green space lighting, road lighting, and the low-carbon design and manufacturing of lamps. For example, Li et al. [
49] analyze the energy consumption of architectural lighting to explore energy saving potential; they find that personnel behavior, control mode, and luminaire type all affect energy consumption. Łopuszyńska and Bartyna-Zielińska [
50] discuss urban green space lighting its and associated factors to explore how to achieve a balanced relationship between nighttime lighting and darkness. Casavola et al. [
51] design an adaptive urban smart lighting framework that can automatically adjust the brightness of street lights according to the needs of moving vehicles, with the sole purpose of reducing urban energy consumption on streets or specific road sections. Thurairajah et al. [
52] study a pre-qualification mechanism to review energy-efficient light-emitting diode (LED) luminaires that can be used for outdoor lighting, with the aim of reducing or avoiding urban light pollution. Although the above research has a certain degree of operability, from the perspective of this study, it has varying degrees of limitations owing to its excessive focus on a small-scale single field and the lack of research on urban lighting needs.
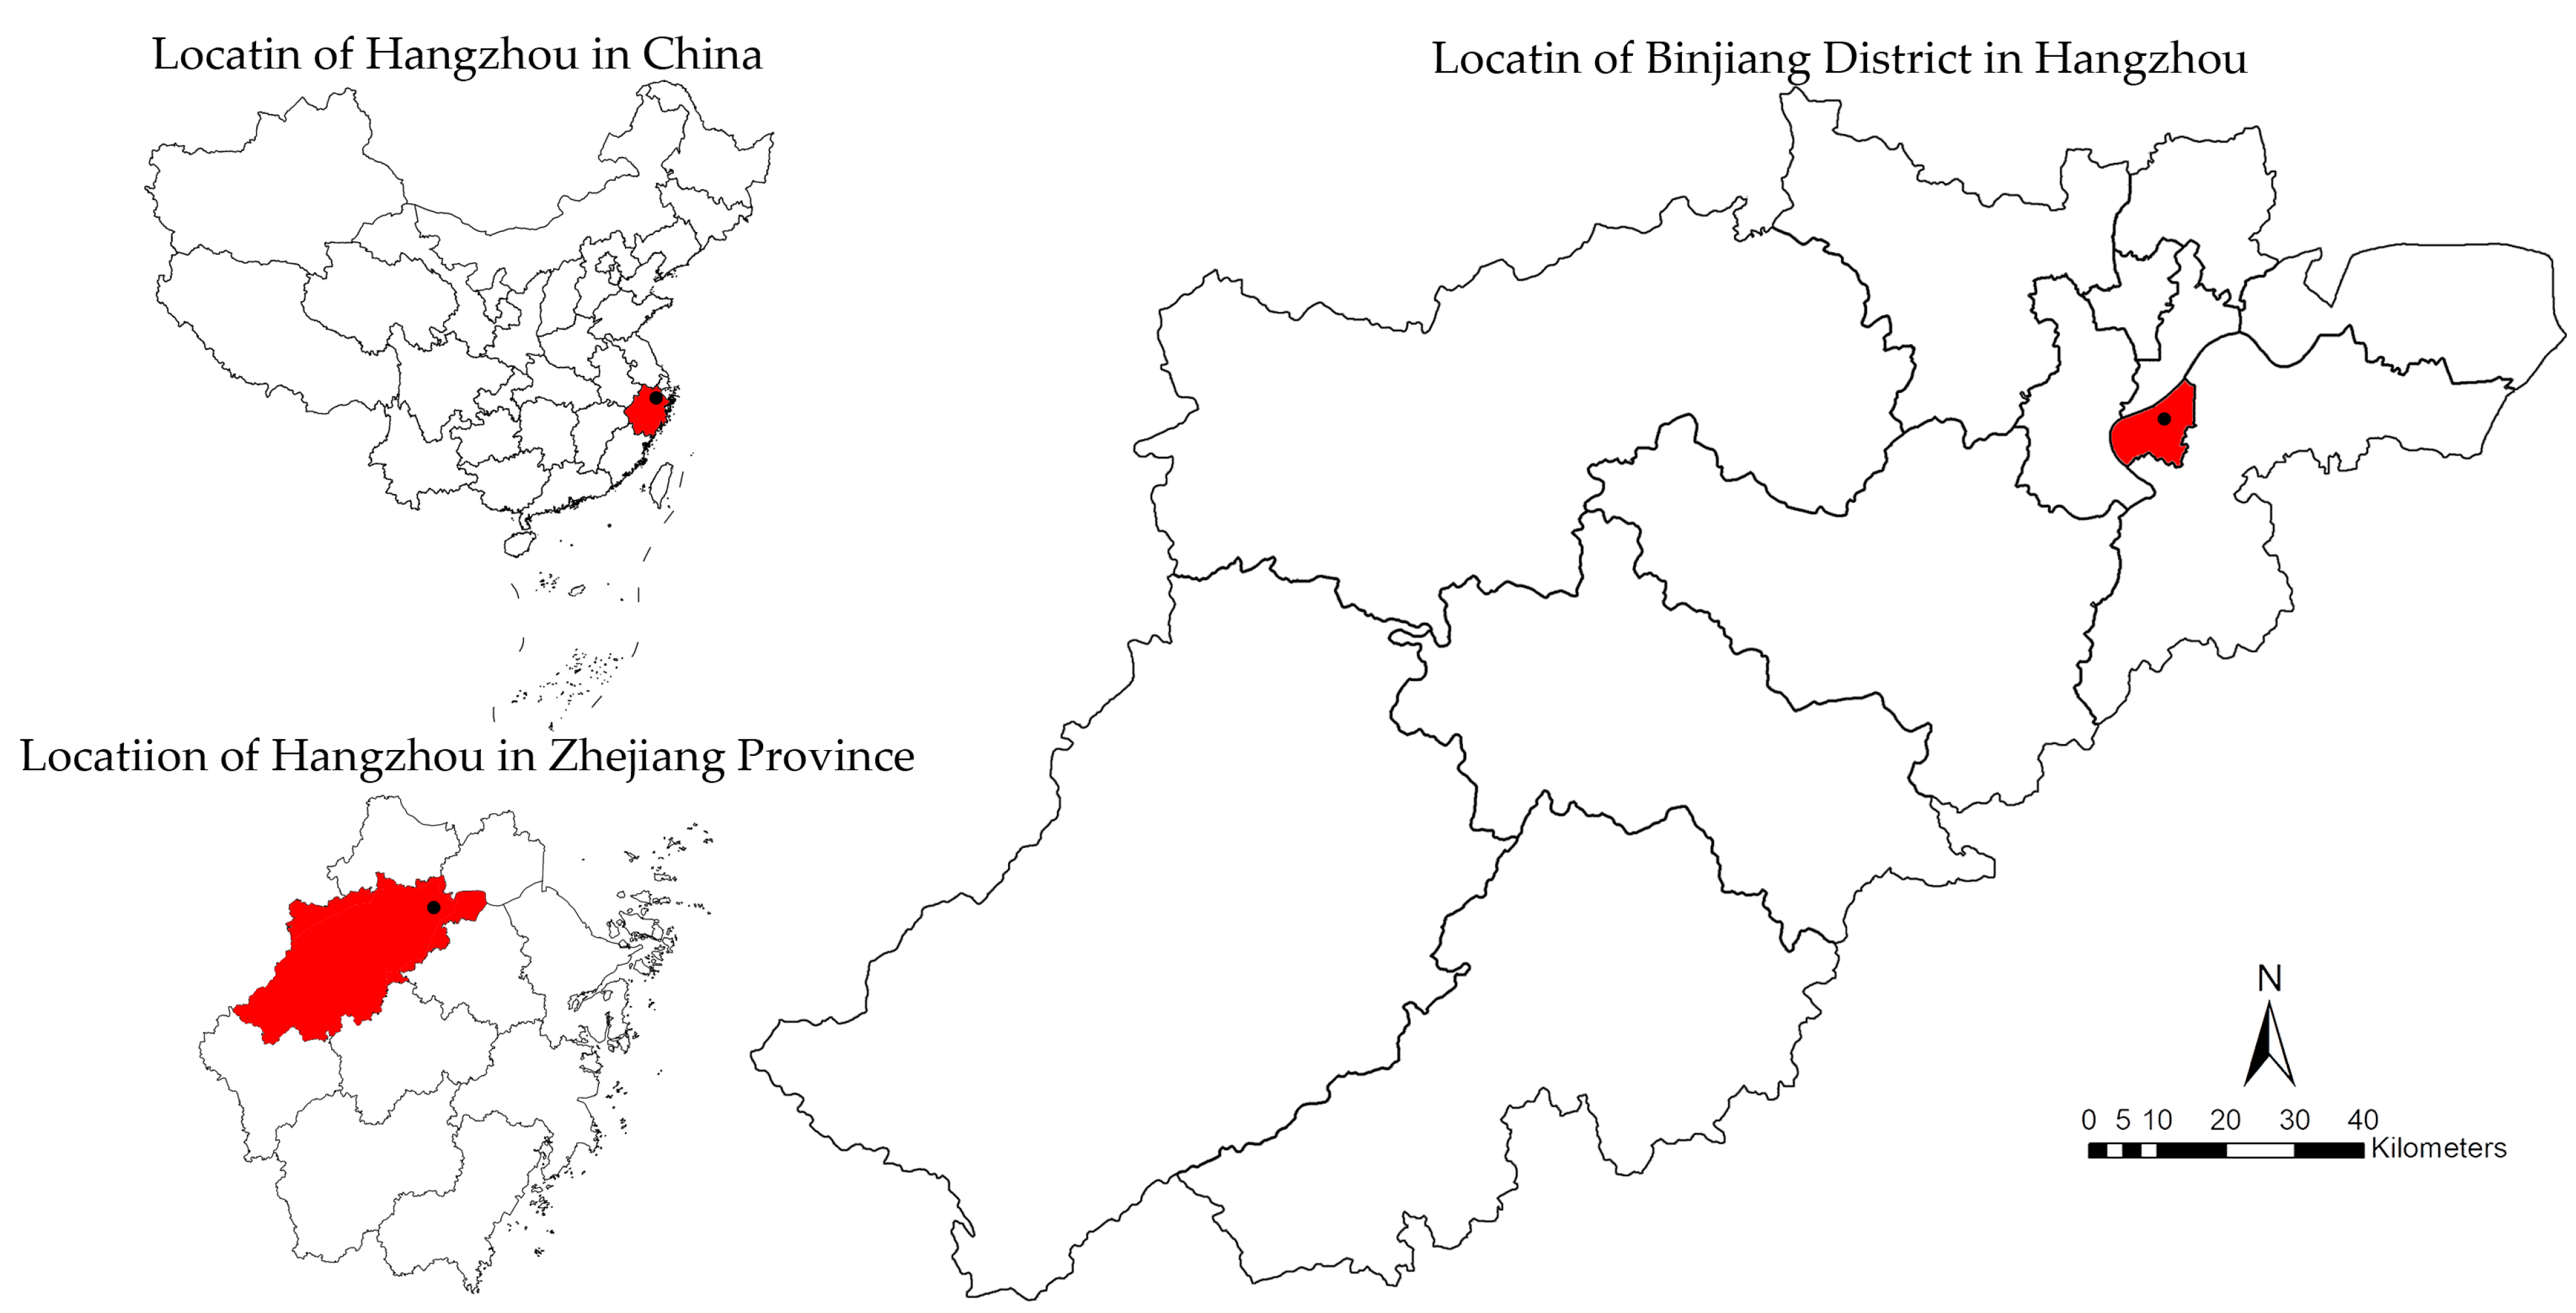
In sum, in the field of urban planning, there have been few studies that systematically analyze the overall lighting supply and demand in urban outdoor spaces from a low-carbon perspective and use this as an entry point to support spatial and temporal planning. In this paper, first, four main factors are selected to provide a quantitative accounting method for urban lighting demand; next, Binjiang District in Hangzhou is taken as the study area for empirical research, and the results from the calculation of lighting demand are measured by combining temporal and spatial geographical data; finally, the lighting images of urban lighting in Binjiang District are introduced as the lighting supply, and a spatial distribution pattern matching supply and demand is obtained to assess the reasonableness of the current state of lighting and make suggestions for optimization.
3. Methodology
In this paper, we study the relationship between supply and demand in urban lighting planning through model construction. The relevant literature indicates that urban spatial form can have a root effect on urban carbon emissions [
54,
55,
56]. This effect is derived from the general concepts considered when measuring spatial form, such as centrality, density, aggregation, accessibility, continuity, and mixed use [
57,
58]. The spatial and temporal factors involved influence nighttime urban human activities and parcels. The demand for urban lighting, in fact, represents the human demand for lighting in urban parcels. Lighting, from spatial and temporal standpoints, affects people’s perceptions of a city [
59], as well as their activities and spatial distribution [
60]. This, in turn, exerts an influence on the final formation of nighttime urban spatial forms to varying degrees. Thus, considering the above, as well as the interrelationship between energy consumption and carbon emissions, and with reference to the links between people and lighting planning in the urban lighting master plan of Hangzhou, we determine the factors that can directly or indirectly affect nighttime lighting demand, people, and energy consumption in district parcels.
We first determined the relationships between the target parcel attributes and lighting demand. At present, dividing urban lighting control zoning according to different target parcel functional attributes is still the prevailing global mainstream method for determining urban lighting demand [
61,
62]. Different lighting planning control levels determine parameters such as the selection of lighting brightness, illuminance, and color temperature within that level of zoning, which also affect energy consumption and reflect carbon emissions. The road grade attributes around the target parcel also affect lighting demand in the target parcel [
63]. The buildings and structures on both sides of the road present different lighting demands because of the different road grades around them. Parcel volume may also reflect the construction intensity of a parcel [
64], which can be seen as another way to distinguish the differences between parcels from a lighting perspective. Finally, a nighttime crowd’s travel activity directly reflects the crowd’s demand for lighting in a target parcel [
65]. Our comparison of functional spaces of the same nature shows that the larger the crowd that gathers, the greater the demand for lighting in a given parcel space [
66].
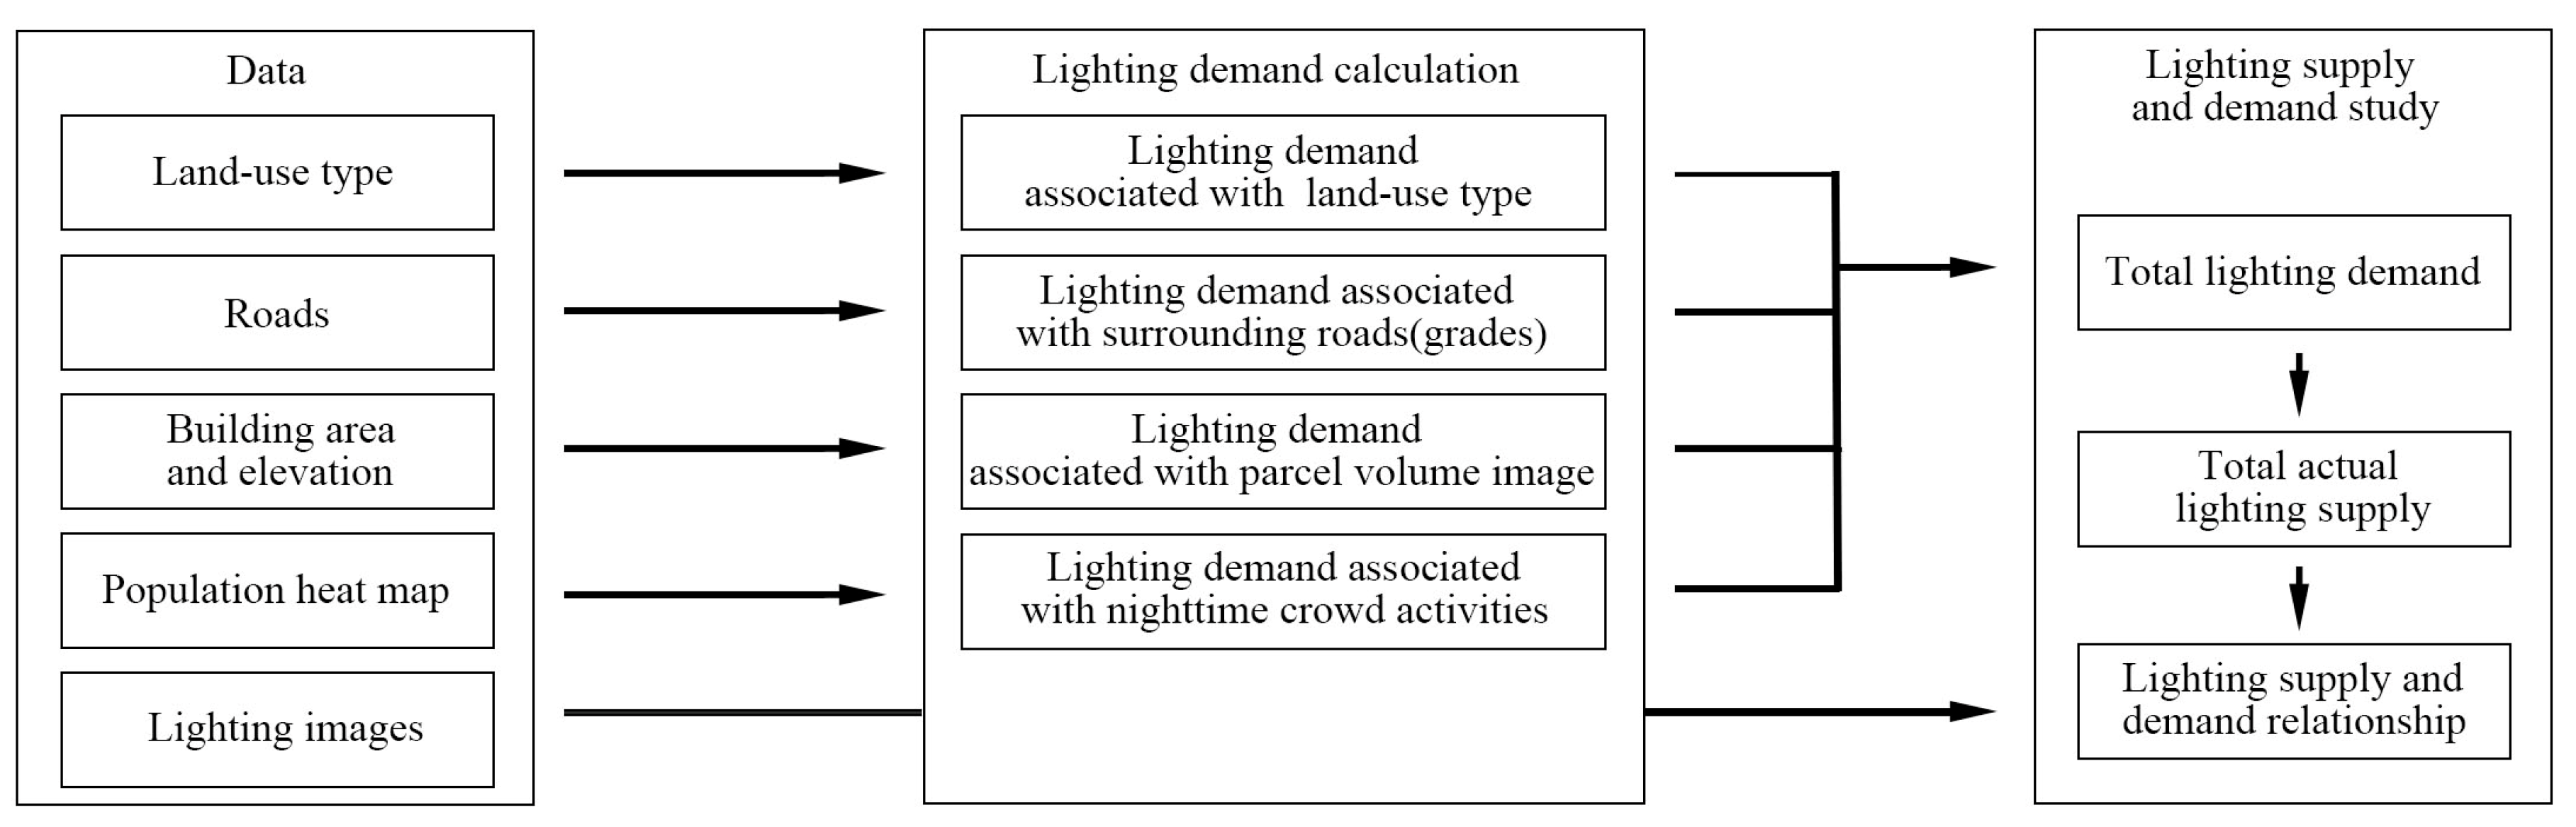
To calculate the lighting supply comparison, we introduce a light image of urban lighting in the current year, use the luminance data of the current light image as the lighting supply, convert it into the current nighttime urban parcel lighting demand value, and then, compare it with the newly calculated lighting demand to determine whether the supply matches the demand. This study is divided into the following two steps: in step 1, a quantitative model of nighttime urban lighting demand in Binjiang District is constructed, and in step 2, the relationships between the supply and demand for lighting construction in the district are calculated and compared. This study also provides ideas for how to optimize the lighting pattern and balance carbon emissions (see
Figure 2 for a flow chart of the study).
3.1. Method for Calculating Lighting Demand
3.1.1. Derivation of the Lighting Demand Calculation Model
The factors associated with the lighting demand and energy consumption of a parcel (i.e., the energy consumption required for lighting) are quantified separately to obtain the lighting demand created by each factor. The total lighting demand of a parcel is the sum of the lighting demand of all of the factors. The total lighting demand is set as
, which is calculated using Equation (1):
where
is the total number of factors, and
is the
-th factor.
As mentioned above, there are four main factors influencing the lighting demand of an urban target parcel; thus,
, and the factors are target parcel attributes (
), roads (grades) around the parcel (
), parcel volume (
), and nighttime crowd activity characteristics (
). The lighting demand formed by each factor can be set as
,
,
, and
. The total demand is the sum of the demand of each factor, as shown in Equation (2):
where
is the total lighting demand,
is the lighting demand associated with the parcel’s land-use type,
is the lighting demand associated with the surrounding roads (grades),
is the lighting demand associated with the volume of the parcel, and
is the lighting demand associated with the characteristics of the nighttime crowd travel activities. The lighting demand for each factor can be viewed as the product of the factor and the corresponding coefficient and weight, which leads to Equation (3):
where
is the lighting demand corresponding to each factor,
;
is the weight;
is the coefficient corresponding to each of the four factors; and
denotes the factor.
3.1.2. Description of Model Factors and Parameter Assignment
In the measurement model,
Table 1 shows lighting demand associated with land-use type (
) and lighting demand associated with surrounding roads (grades) (
). When assigning values to the product of the above two factors and the corresponding coefficients (
×
,
×
), reference is made to the overall urban planning of Hangzhou and the Hangzhou city lighting master plan. In terms of the lighting demand associated with parcel volume (
) and lighting demand associated with nighttime crowd activities on a given land-use type (
), value assignment to
×
and
×
was performed according to the actual needs in the research practice of urban lighting planning engineering. In
Table 1, the coefficient values (1, 2, 3, 4, 5) of the four factors were only used to distinguish the differences in the degree of influence, not the absolute value of the scale of demand.
The values of
×
represent the five levels of the luminance control zones. The luminance control zoning groups spaces with similar brightness together. In lighting planning, different luminance control zones reflect the different needs of people or plots for lighting. In the current mainstream research methods of urban lighting planning, urban areas or plots with the same function are usually regarded as being in the same luminance control zone. Establishing different control zones is conducive to the formulation of different lighting luminance control indicators and strategies [
67].
The weights of the factors were implemented using the expert scoring method. Specific descriptions are provided in
Table 2.
×
represents the different lighting requirements of buildings and structures on both sides of different levels of roads [
68,
69]. Due to a major initiative issued by the State Council to activate nighttime businesses and markets and develop a nighttime economy—coupled with the 2022 Asian Games renovation activities—the city of Hangzhou has been prompted to carry out a new round of planning and updating of a larger range of neighborhood landscape lighting, led by the government and businesses. The most important renovation strategy has been to enhance lighting for buildings and structures along the streets according to demand. Determination of the extent to which lighting should be enhanced is based on the road grade, traffic flow, pedestrian flow, and size of the buildings in the parcel on both sides of the road. Specific descriptions are provided in
Table 3.
The elevation data of buildings and structures within the parcel are incorporated into the lighting demand assessment by parcel volume (
); that is, the parcel volume is a product of the parcel construction area and the average height of the buildings within the parcel (
×
). Compared with a flat, two-dimensional concept of land-use type, the parcel volume calculation makes the target parcel more three-dimensional [
70]. The calculation results for the volume data result in characteristics similar to the Zipf distribution; that is, the frequency of the parcel volume distribution is inversely proportional to the size. The threshold value of parcel volume is thus suitable for the quantile division method. From the median value, the values are divided into five levels upward and downward. This allows for better differentiation of different volumes of the parcels in Binjiang District, so that the calculation of total lighting demand can be more scientific. Specific descriptions are provided in
Table 4.
The inclusion of lighting demand associated with nighttime human activities (
) in the calculation is attributed to the importance of the human-centered concept of lighting planning and construction [
71]. This importance can be briefly described as attention to social elements that reflect people’s quality of life [
72]. In recent years in China, new evaluation systems in urban development have emerged, such as the Harmonious Society Index System and the Scientific Evaluation Criteria for Livable Cities, and their focus has shifted from the early measurement of material inputs to the evaluation of quality of life [
73]. The results of resident satisfaction surveys in China have increasingly been incorporated into the evaluation of urban planning and construction [
74] as an important part of the measurement criteria. According to the density distribution characteristics of the population heat map data, threshold division was carried out after the relative rounding of the natural breaks method division results. In the process of the weighted addition of factors to form the total lighting demand, the population heat map data were analyzed separately according to land-use type by multiplying the population heat map results with the land-use type attribute coefficients (
×
). In general, for a given land-use type, a higher population aggregation indicates higher parcel lighting demand. Specific descriptions are provided in
Table 5.
3.1.3. Result of Calculation
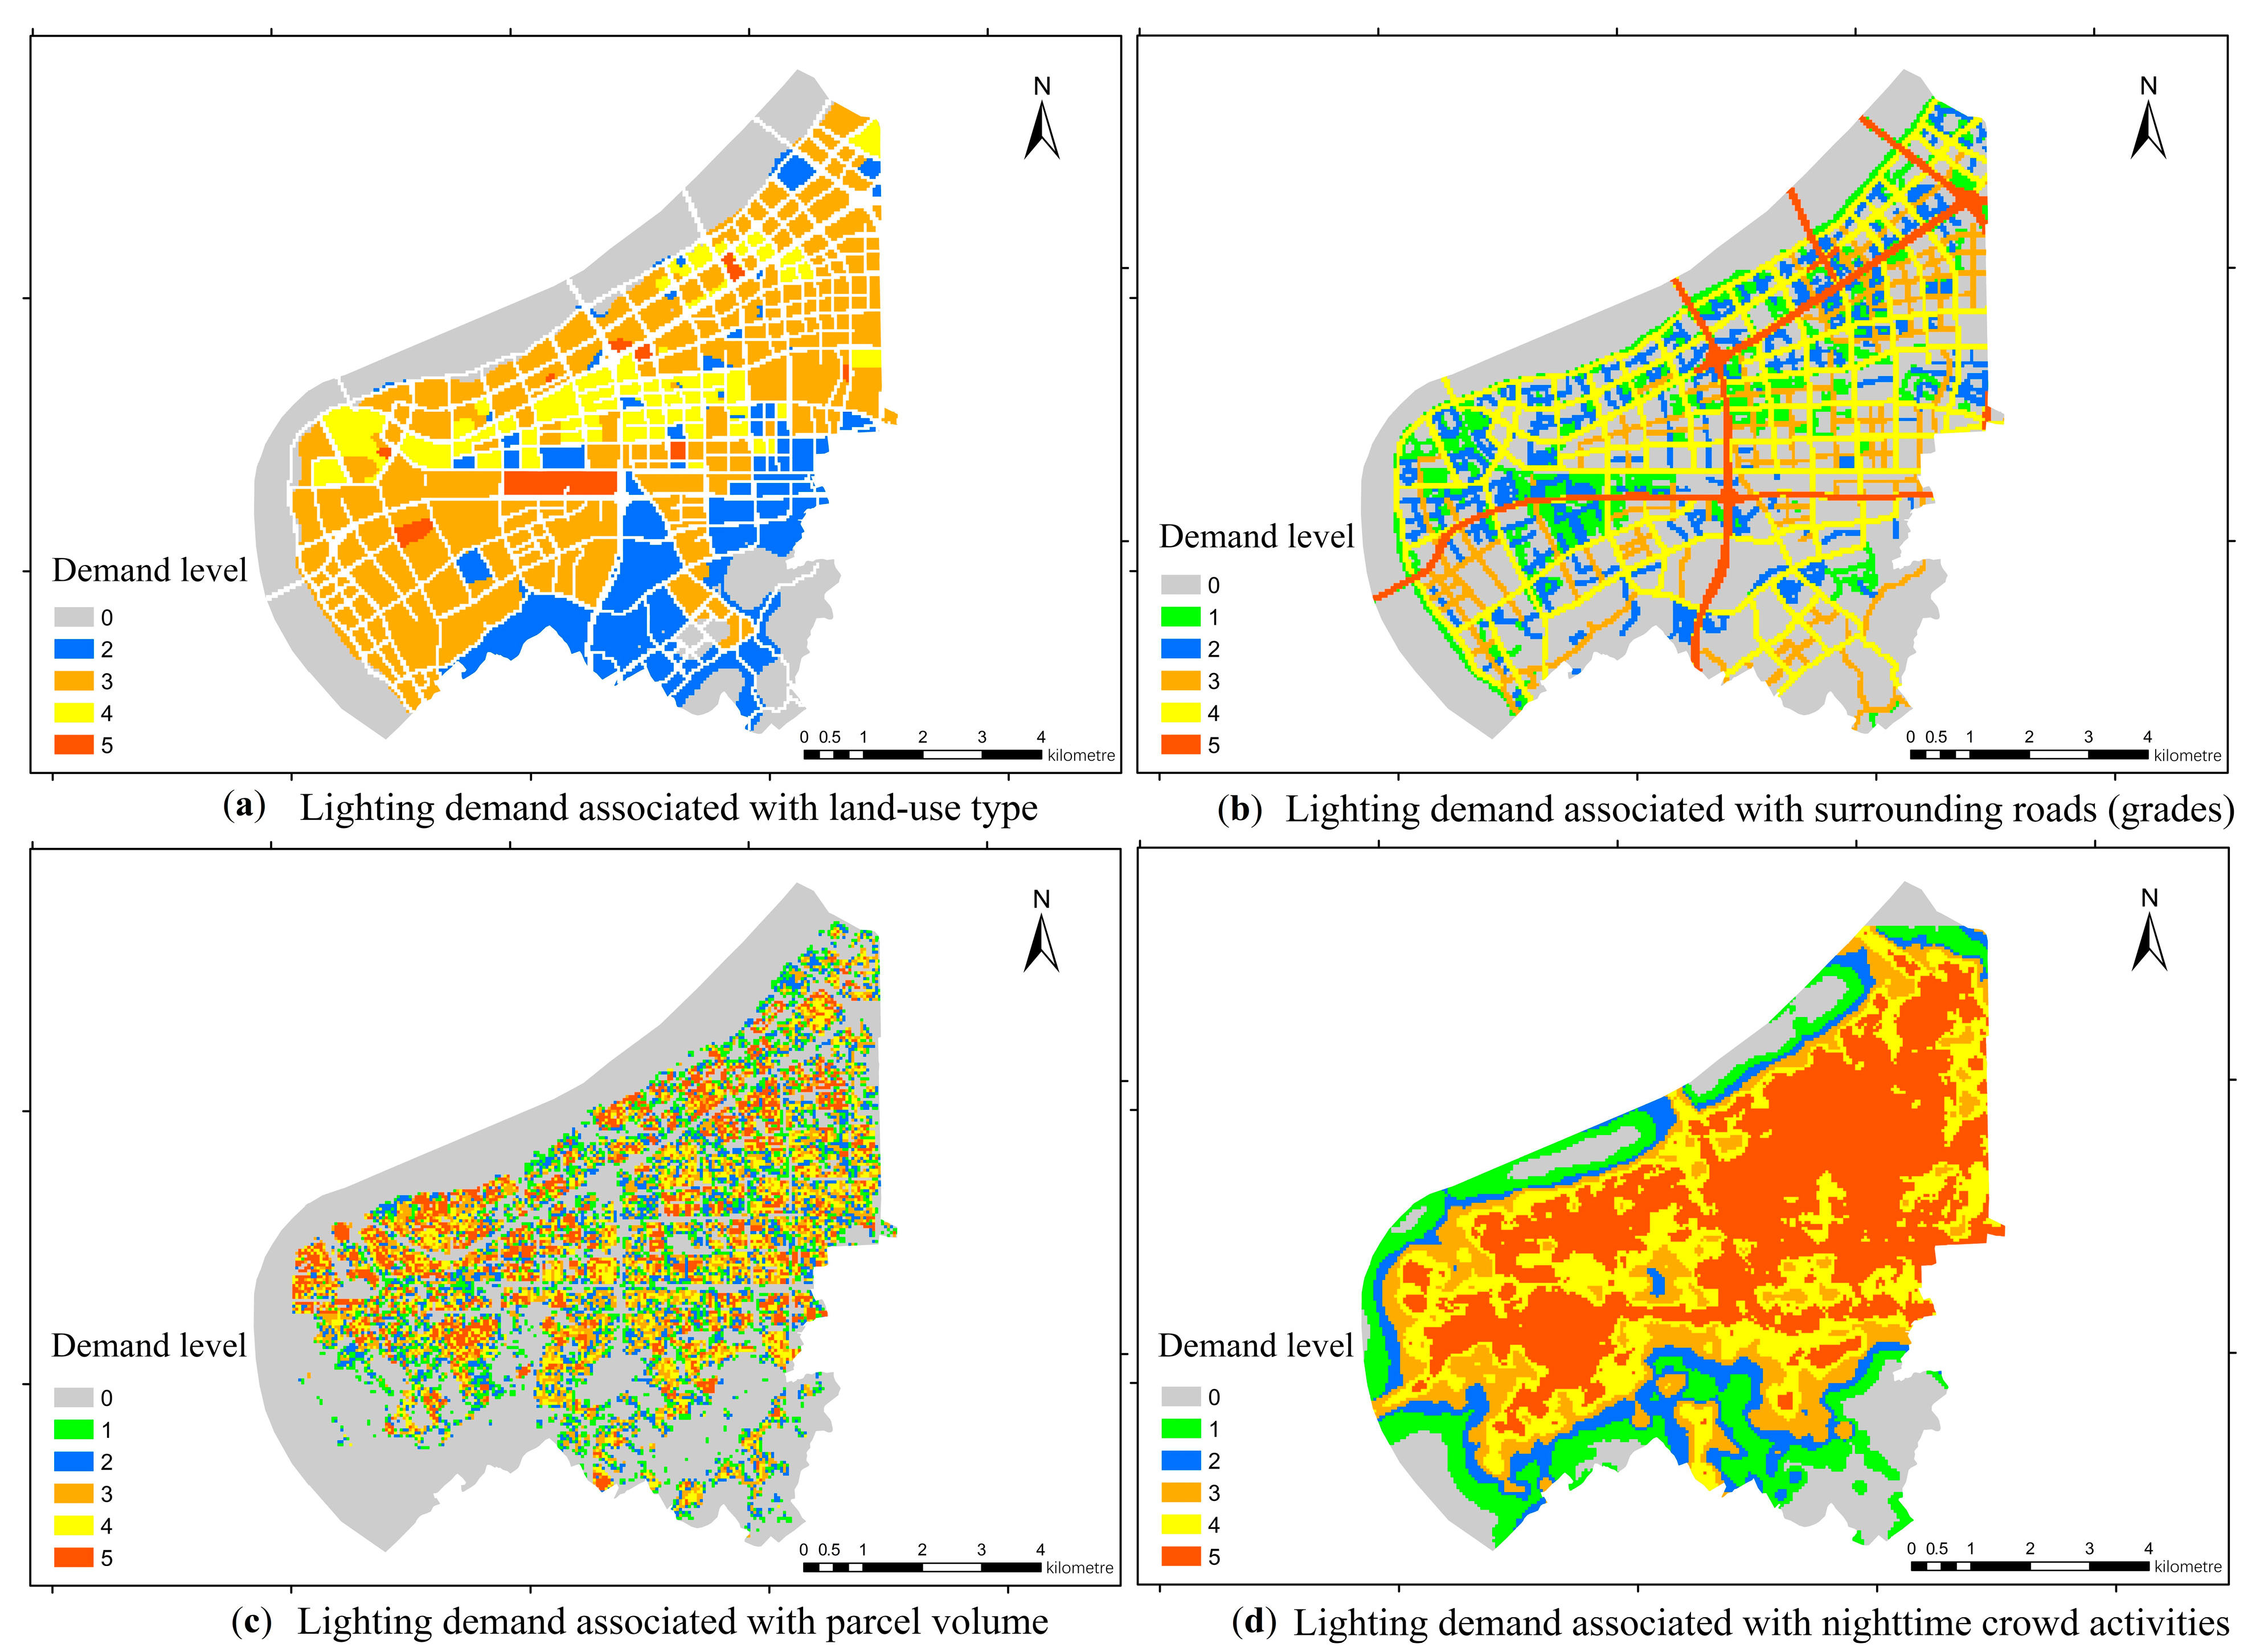
After the value assignment of parameters and factors for the calculation model, the parcels within the whole Binjiang District were divided into a grid map of 50 m × 50 m grid cells with the help of ArcGIS10.5, and this grid was used as the base map for the subsequent study. In this paper, the size of the grid cell was 50 m × 50 m for the following reasons. Lighting planning tends to be conducted at the macro level, and the planning unit of luminance control zones is usually the community, a city’s functional plate range with the public consensus, or other large-scale ranges. A luminance control zone is generally composed of one or more grid cells. Micro-level designs, such as for a building, a street, or a shop, should be completed by planning and management departments below the district level or planning or construction companies responsible for project implementation. According to the derivation formula,
,
,
, and
were calculated first using the parameters in
Table 1,
Table 2,
Table 3 and
Table 4, and
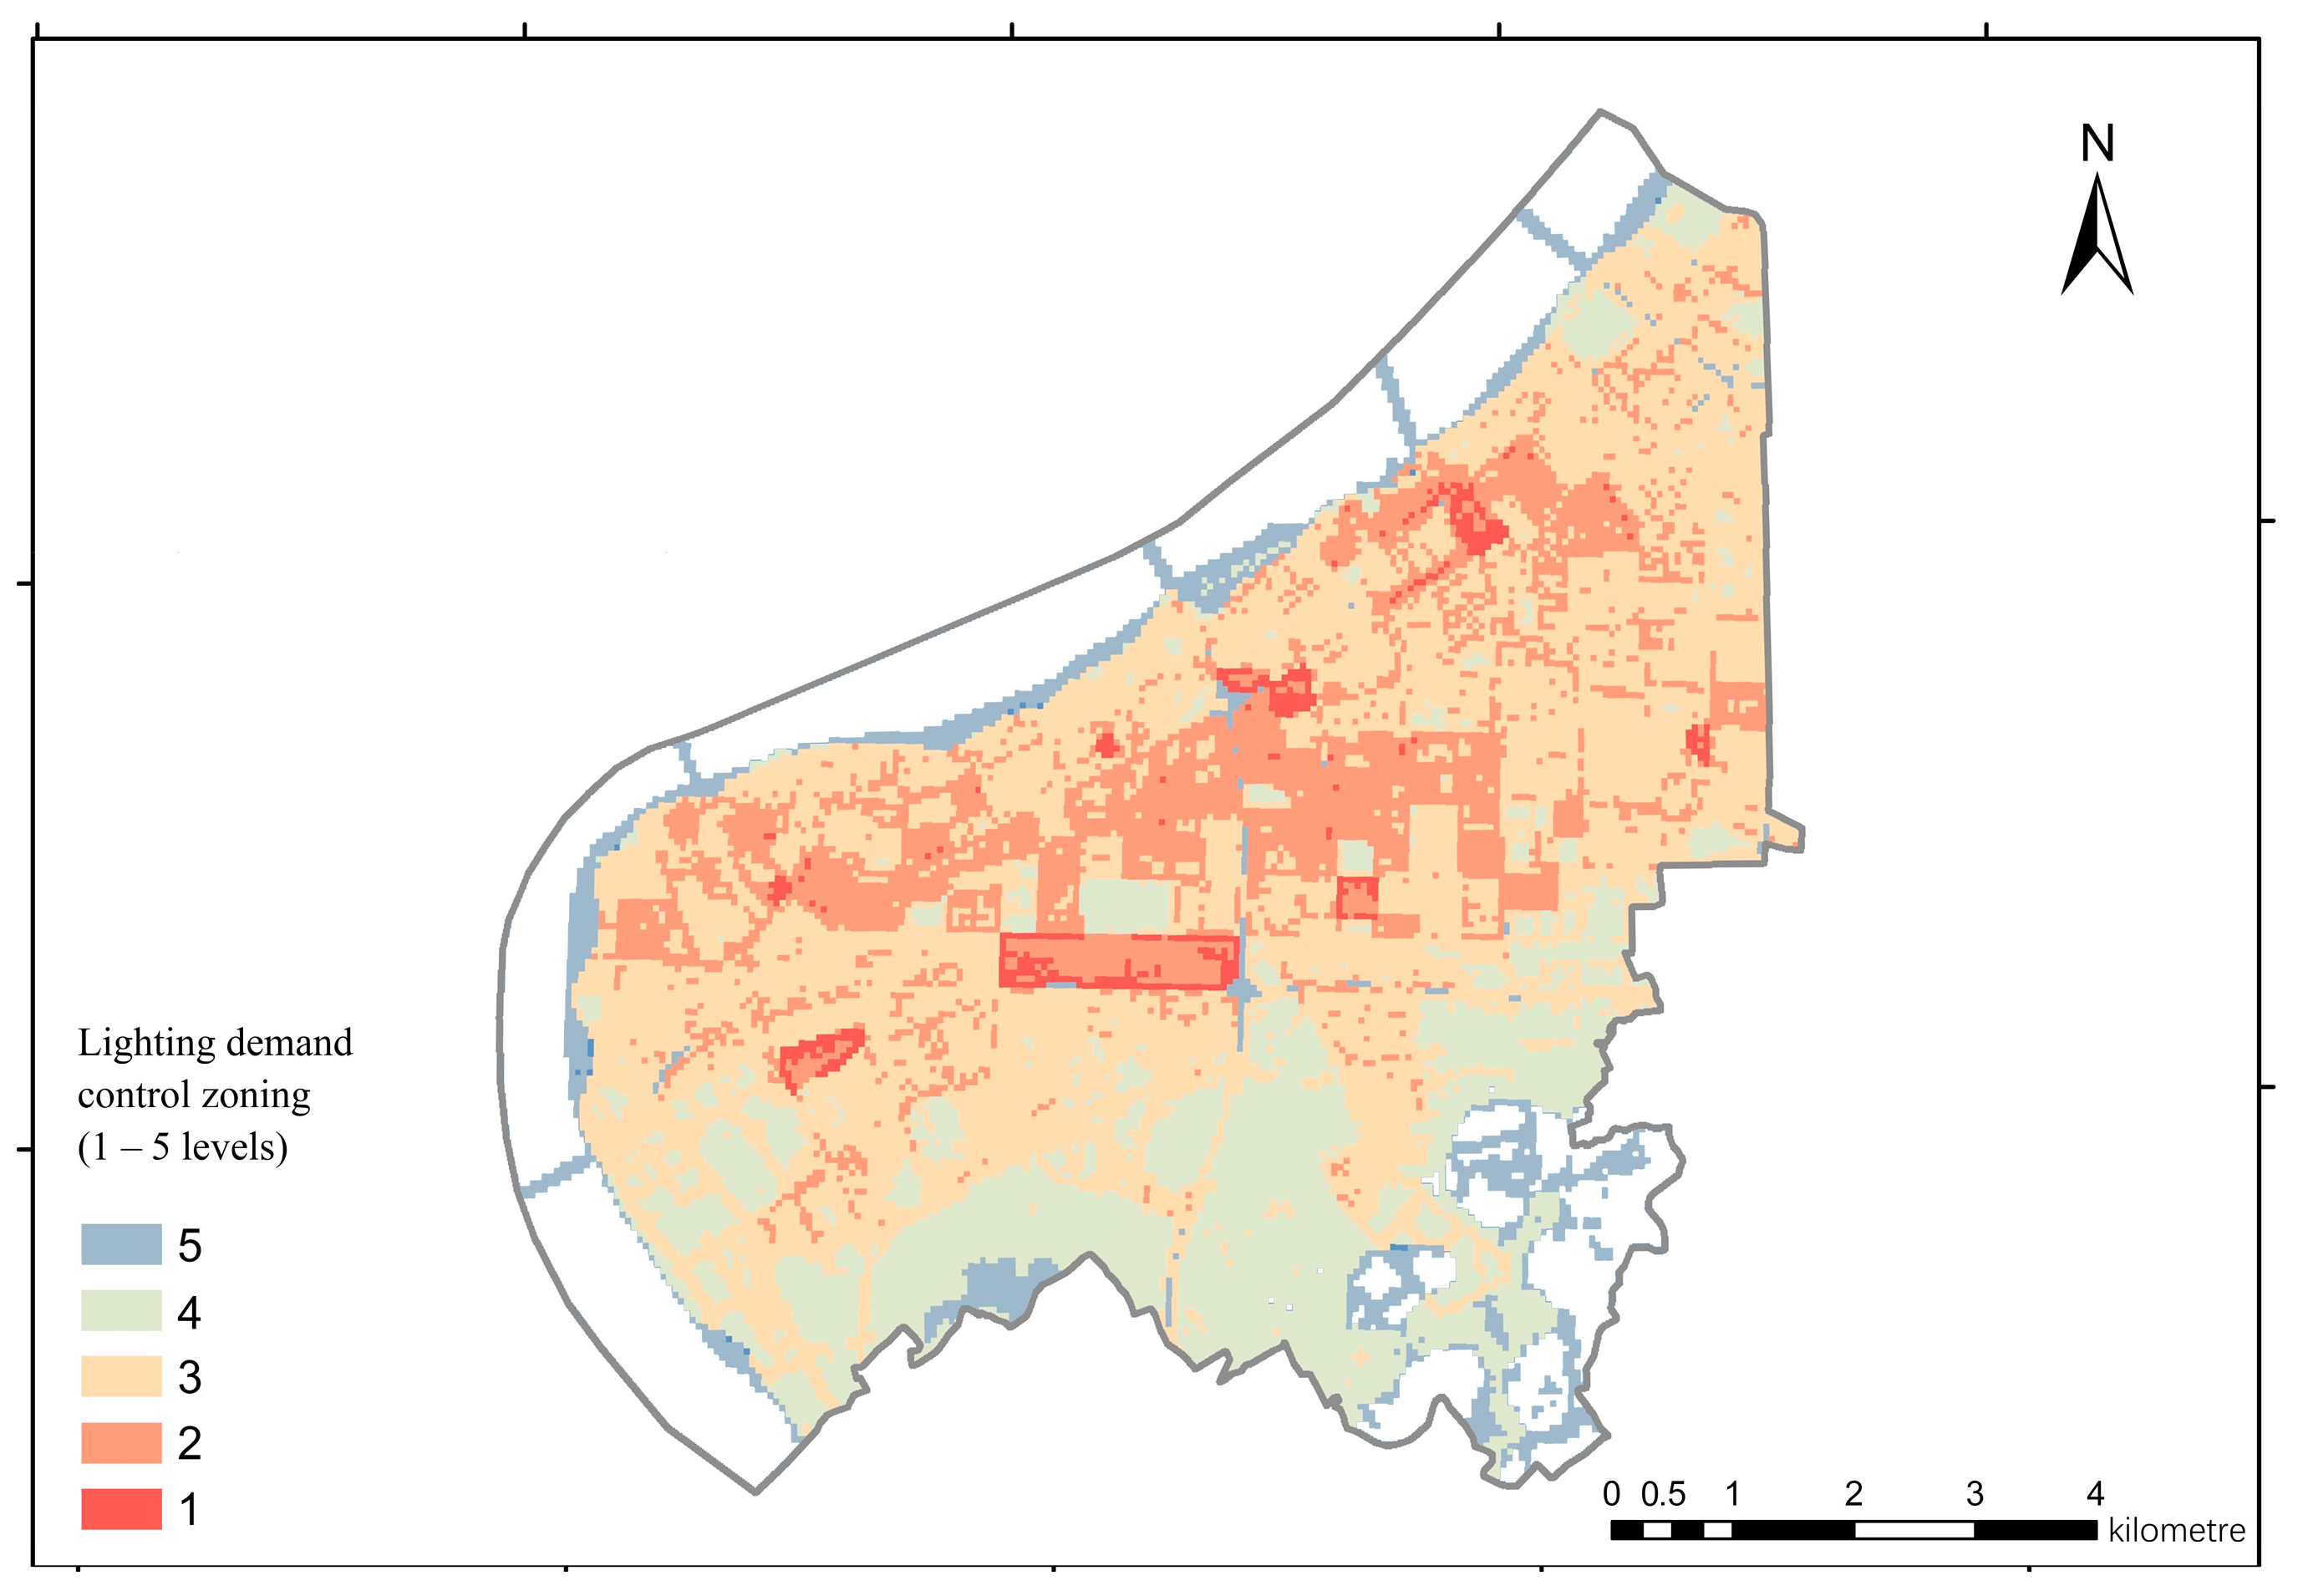
Figure 3a–d are generated in turn. The results were substituted into Equation (3) to obtain the total lighting demand (see
Figure 4). The lighting demand levels were then reclassified according to the total lighting demand.
3.2. Comparison between Supply and Demand in Lighting Planning and Construction
3.2.1. Current Supply-and-Demand Comparison Measurement Method in Lighting Planning and Construction
The nighttime lighting images acquired for Binjiang District’s (proportional to the actual carbon emissions) were compared to the total lighting demand calculation results to assess the match between lighting supply and demand in different urban areas from a low-carbon perspective. The analysis process and steps are as follows:
In step 1, the nighttime urban lighting image data and the total lighting demand calculation result data of Binjiang District were read by ArcGIS10.5. The WGS-84 geocentric coordinate system was used as the reference system to project all of the data in Mercator. Incidental noise such as clouds and fires were filtered out from the city light image data, and the grayscale range of the data was set to 1–63 to generate luminance images. To correspond to the accuracy of the grids divided by the lighting demand calculation results, the light image grids were subdivided and transformed from 500 m × 500 m grids to 50 m × 50 m grids.
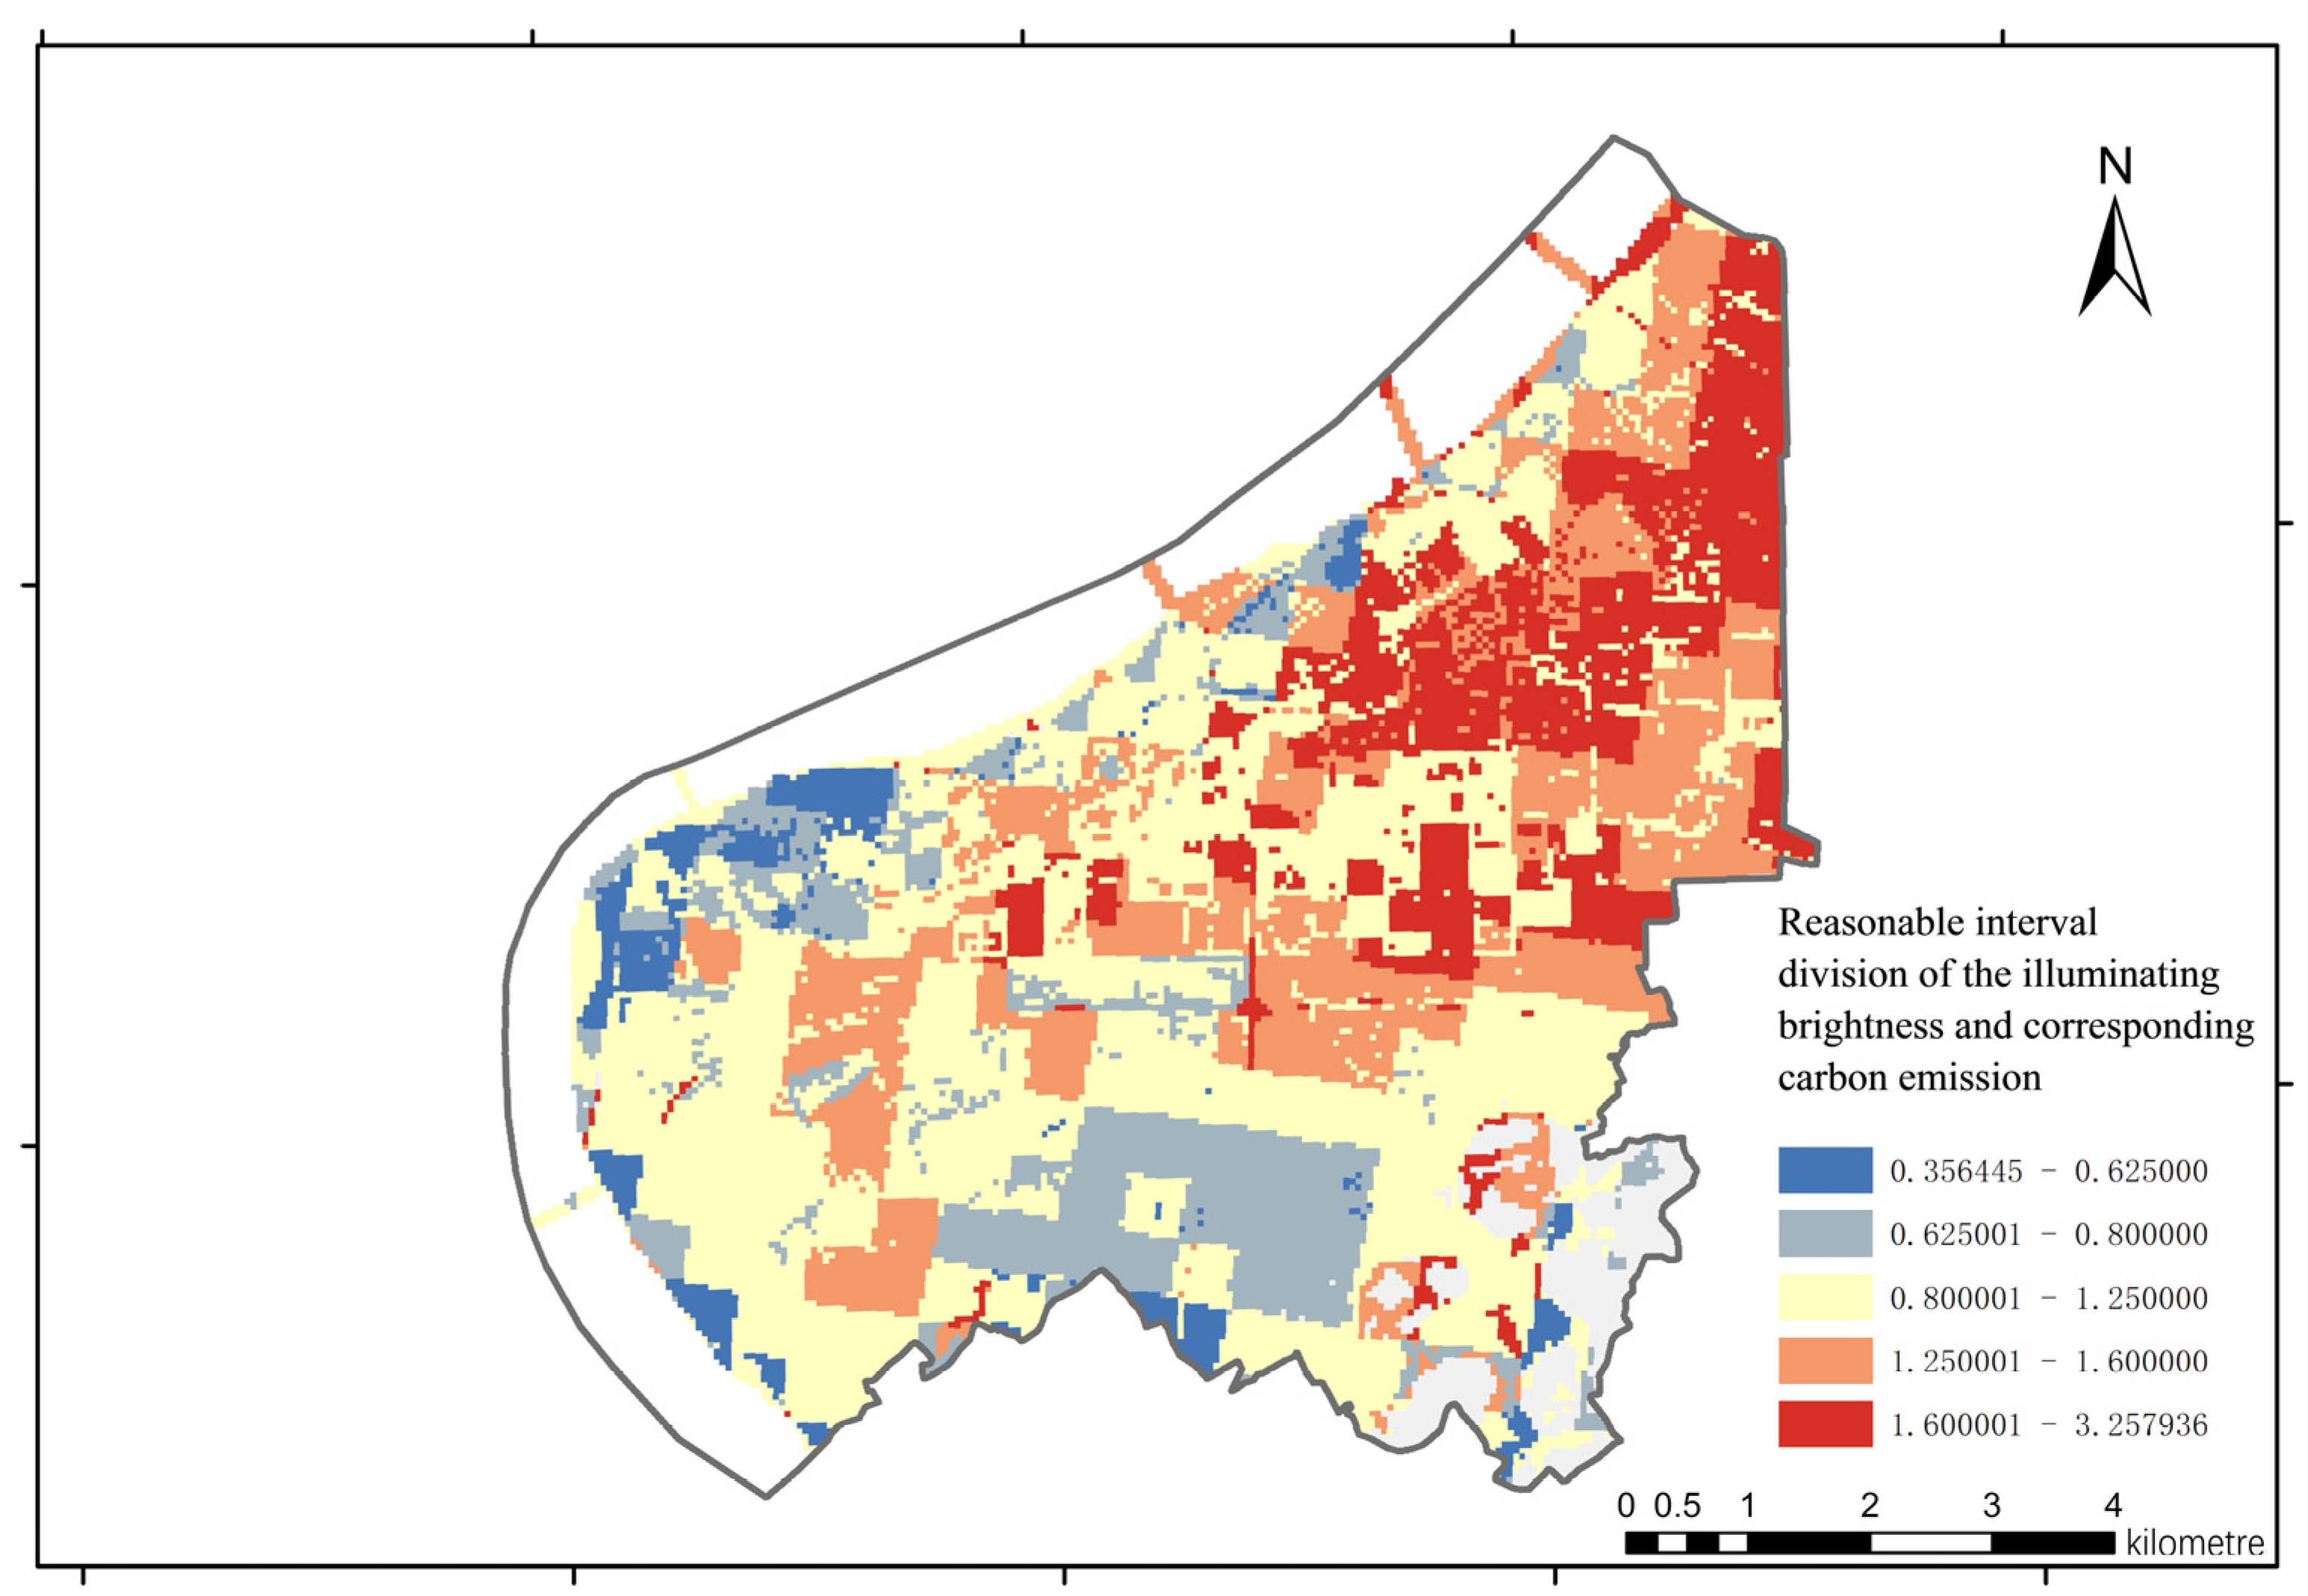
In step 2, the quotient was calculated for the image brightness of each grid in the light image of the district and the corresponding lighting demand to define the ratio of the brightness supply for each grid (representing the actual carbon emissions) and the lighting demand (representing the carbon emission demand), as shown in Equation (4):
where
is the quotient of the image brightness of the
-th grid and the corresponding lighting demand;
is the light image value of the
-th grid; and
is the calculated value of the corresponding lighting demand of the
-th grid. The results were classified according to the brightness level control zoning.
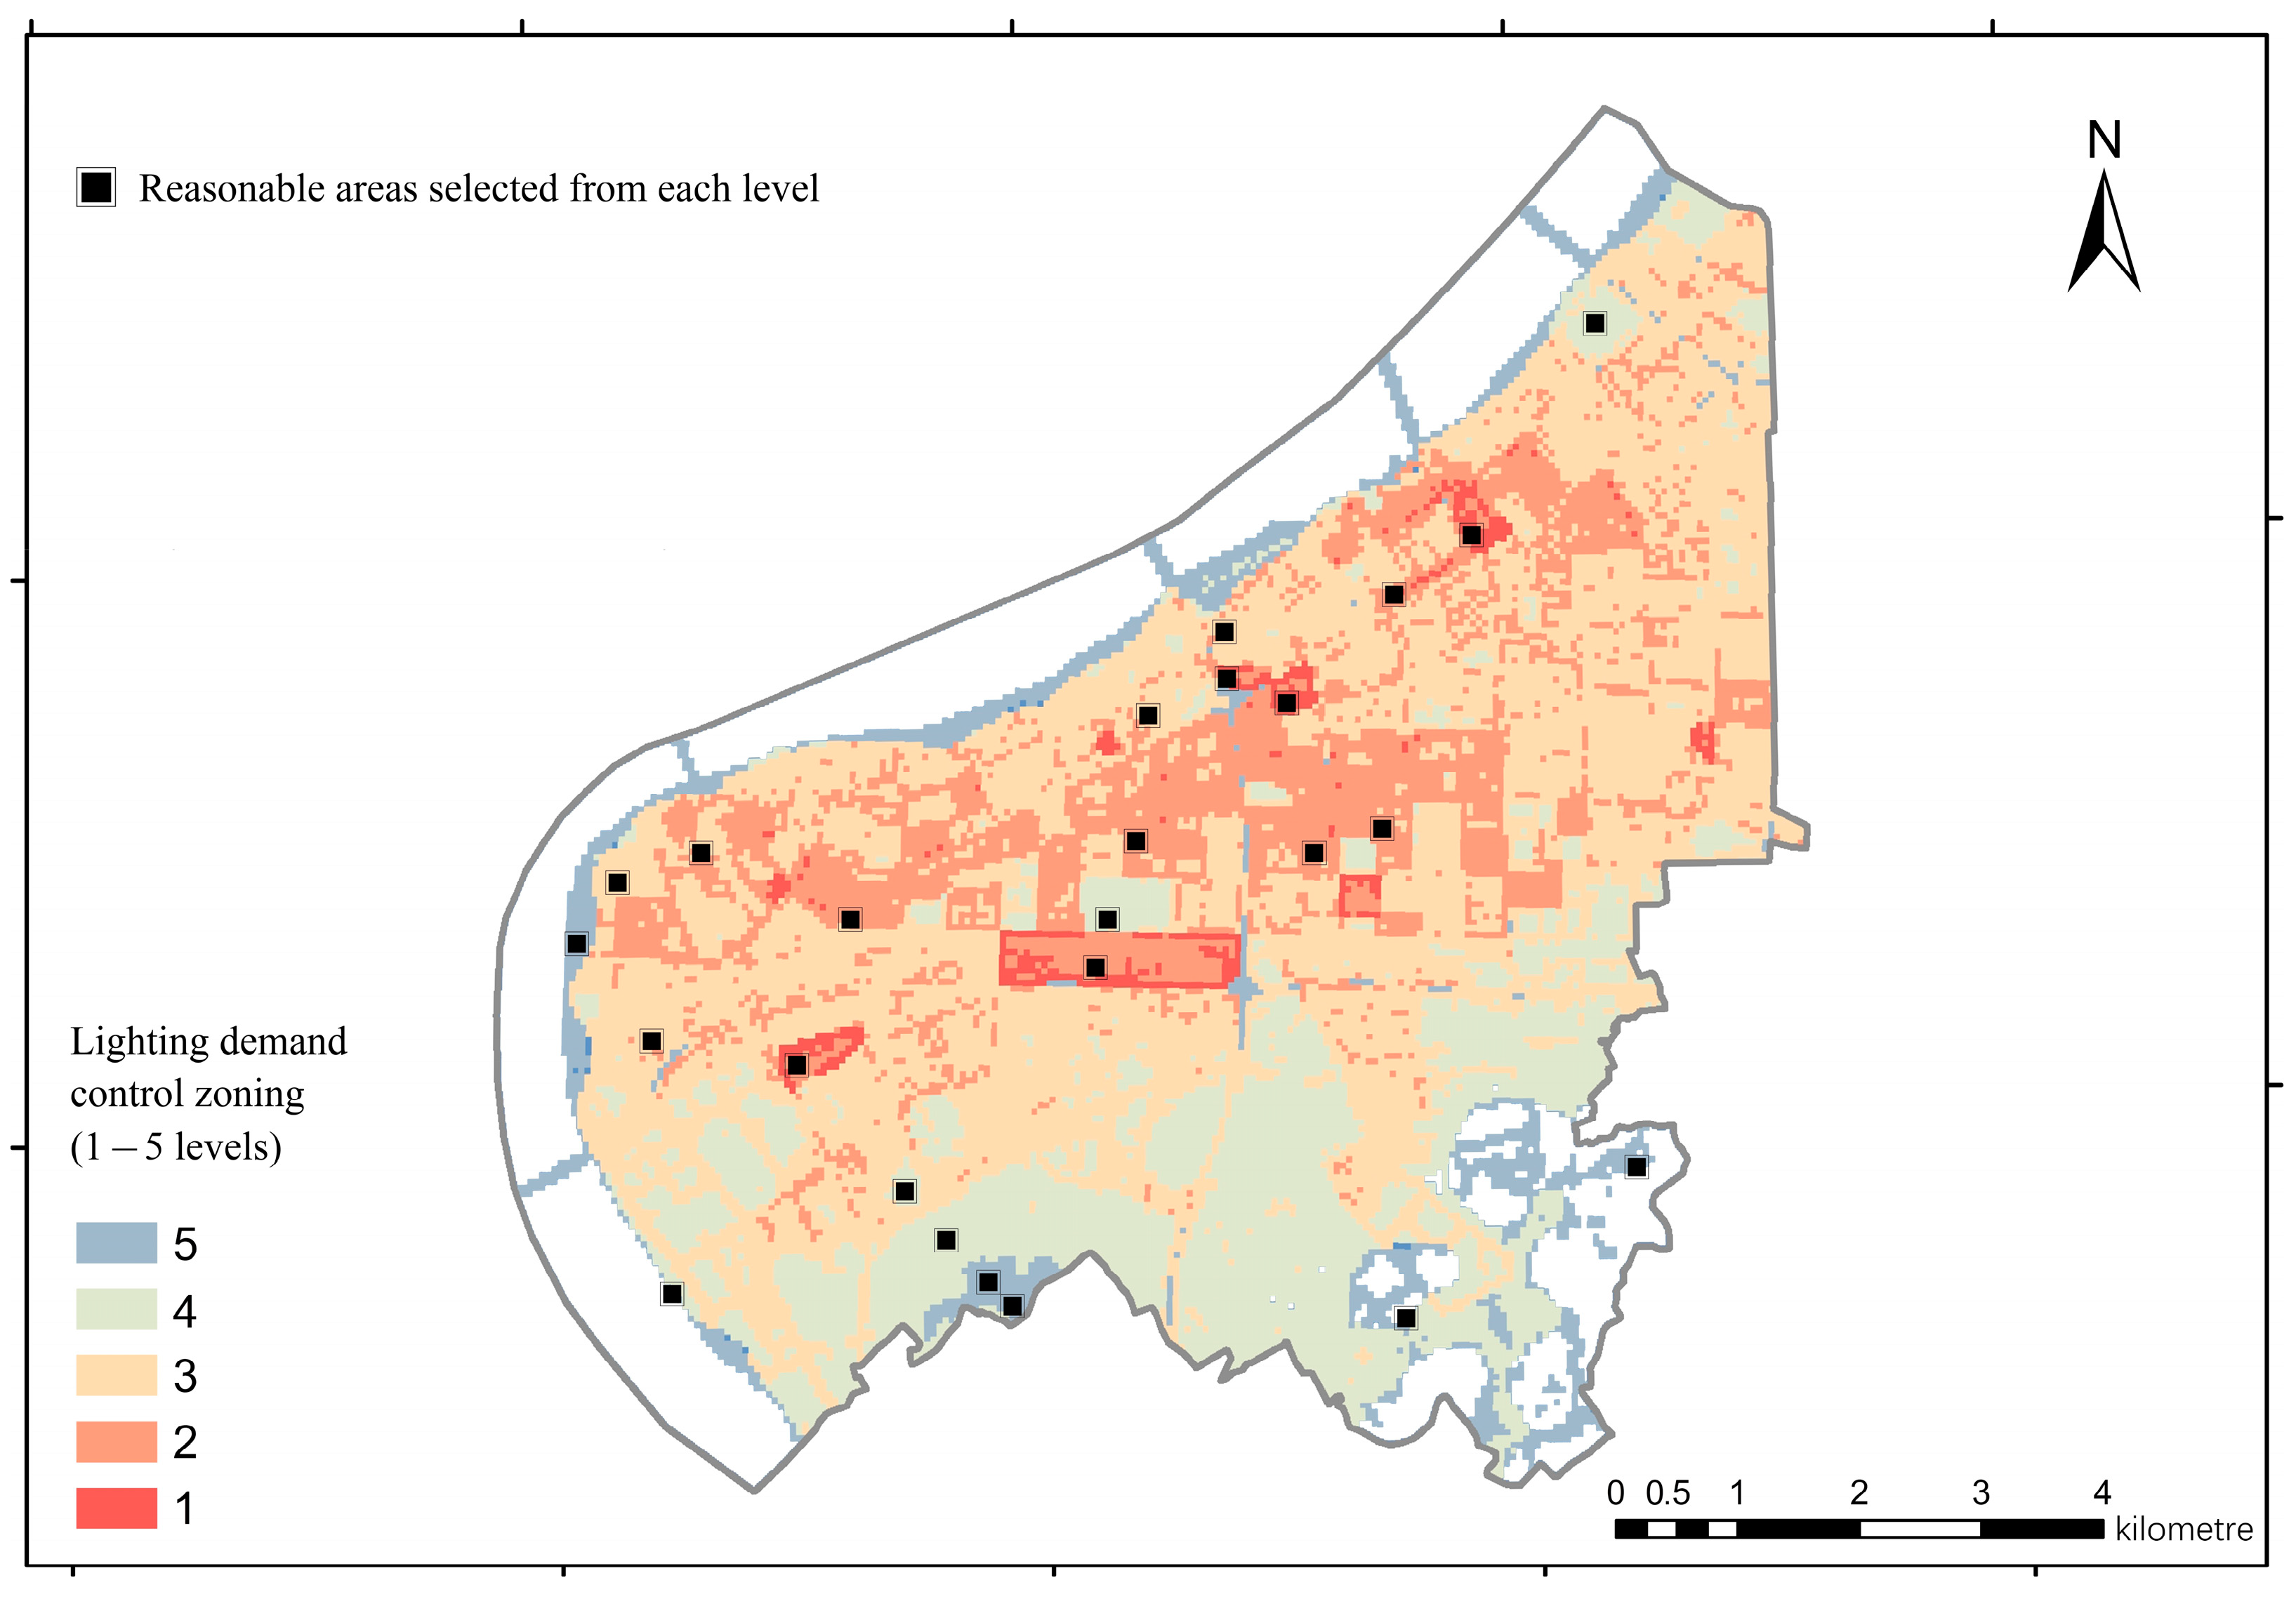
In step 3, expert scoring was used to identify realistic brightness in multiple places in each level-based lighting zone and areas with reasonable carbon emissions relative to the carbon emissions demand. Specifically, for each type of level-based lighting zone, multiple (about 10) sampling spaces were first selected to measure field illuminance and brightness as well as to record images. Second, five lighting experts in the industry were invited to participate in the review and score all sampling spaces. The total score was then used to calculate the average of the experts’ scores. Third, the scoring content included personal feelings about whether the measured light environment in the gridded area is comfortable and meets the needs of the scene, whether the illuminance and brightness measurement values in the main scene in the gridded area are in line with the specification, and whether the lighting design in the gridded area is in line with the three requirements for Hangzhou’s lighting planning. Fourth, the maximum score for each sub-item was set to five, and the total score was then calculated by adding up the scores obtained. A sampling space with a total score of 17.5 or more was considered a reasonable area. Fifth, considering the complexity of space, the scale of the district, and the actual sampling workload, five corresponding reasonable areas were selected for each type of lighting level-based lighting zone (see
Figure 5).
In step 4, the average value of the ratio of light images to the total lighting demand in a reasonable area was calculated according to different lighting level control zones as the benchmark value for the supply-and-demand relationship. That is, in the calculation results of equation 4, with reference to a reasonable area, the ratios of reasonable areas of the same level of control zone were added up, and then, divided by the number of grids in the reasonable areas to derive the benchmark value for the supply-and-demand relationship for each level of lighting control zone, as shown in Equation (5):
where
is the benchmark value,
is the number of levels of lighting demand, and
= 1, 2, 3, 4, and 5 correspond to the five lighting control zone levels.
is the lighting image value of the
-th grid in a reasonable area,
is the calculated value of the lighting demand corresponding to the
-th grid in a reasonable area, and
is the number of grids in a reasonable area. For each lighting control zone,
(benchmark value) was calculated.
In step 5, the concept of the supply–demand ratio was introduced to calculate the ratio
, which is the ratio between the supply of luminance (representing actual carbon emissions) and the demand for lighting (representing the demand for carbon emissions) for each grid in each lighting control zone at various levels. This calculation leads to Equation (6):
where
is the quotient value,
is the quotient value of the image brightness of the
j-th grid and the corresponding lighting control level zone, and
. is the benchmark value for the corresponding control level.
3.2.2. The Logic of Comparative Analysis of Lighting in Planning and Construction for Different Zones
From the above calculations, it is possible to determine the reasonableness of the carbon emission scale relative to demand in the gridded area of each lighting control zone level based on . A value closer to 1 indicates greater reasonableness. Conversely, a value farther away from 1 indicates lower reasonableness. When > 1, the actual light image value of the area is too high, which suggests that the actual lighting brightness is greater than the demand, and carbon emissions are too high; the area’s carbon emissions should thus be adjusted and optimized through lighting planning to become reasonable. When < 1, it means the actual light image value of the region is too low, which suggests that the actual brightness is less than the demand, so the problem should be identified, and the gap should be filled according to the demand.
5. Discussion
5.1. Innovation of Research
Compared with the existing relevant quantitative research (the four types of research listed in
Table 1), the uniqueness and innovations of this research can be summarized as follows: (1) Different research position and scale. From the standpoint of urban lighting planning, this research looked at the lighting demand of Binjiang District at night from a mesoscopic perspective, while existing relevant studies have often been based on the measurement of various parameters of microscopic scenes such as lamps, to optimize lighting design schemes. (2) Different research methods and processes. This research built a calculation model based on the actual situation of urban lighting development in China, as well as Hangzhou Binjiang District, so it had a theoretical and practical basis, while existing relevant research has been conducted in a manner closer to quantitative simulation methods, with different factors chosen for the research. (3) Different purpose and significance. The purpose of this research was to calculate the supply–demand relationship between urban lighting planning and construction by building a model. Additionally, at the planning level, the model’s important practical significance is that it can provide a research basis for the relationship between supply and demand to assist in the formulation of urban lighting planning. Although existing research has solved the problem of insufficient lighting in some existing scenes to varying degrees, as well as partly improving the demand for urban lighting, it has not taken the supply–demand relationship as its main theme or focus, so its significance is naturally different from that of this research. The above three innovation points represent the main contributions of this paper; that is, a calculation model based on different factors was created, which makes up for the deficiency in the research field pertaining to the supply-and-demand relationship in urban lighting planning and construction.
5.2. Suggestions for the Optimization of the Urban Lighting Planning Pattern
The process, methods, and conclusions of this research can provide support for urban lighting planning formulation and management. Understanding the current demand for night lighting in the city and clarifying the relationship between lighting supply and demand is conducive to coordinating the balance between supply and demand, guiding the adjustment of lighting planning structure, and continuously improving the quality of the lighting supply system. Through this research, we found that the main problem in Binjiang District at night is that light pollution in the middle and eastern areas is prominent, and that there are some overly dark areas near the administrative boundary of Binjiang District in the west, northwest, and southwest. In this regard, our optimization suggestions are as follows: (1) Investigate areas where the lighting construction is unreasonable within the jurisdiction. The relevant department of the sub-district office of Binjiang District Government should be responsible for further investigation of the streets and buildings in the areas with unreasonable lighting construction within their jurisdiction. This investigation can be conducted by measuring the installed lamps and lanterns and the installation layout on the spot using light measurement instruments, and the measurement results should be compared with the lighting specifications and standards. Testing personnel should accurately record the location of unreasonable lighting, the size of lighting parameters exceeding the standard, and the causes; the government should also invite relevant experts to formulate a transformation scheme. (2) On weekdays, it is recommended to turn off unnecessary lighting equipment or devices and strictly control the “weekday lighting mode” and the “festival lighting mode”. That is, only the most basic functional lighting should be used on weekdays, and all the lighting can be used on weekends or festivals so that the lighting on weekdays is darker than that on weekends and during festivals. (3) For those buildings, structures, and landscapes that are unessential but need to implement high-brightness lighting for some reason (e.g., nighttime city image projects), planning records and explanations should be provided, and the time of lighting should be strictly controlled.
From the perspective of macro-policy adjustment, our optimization suggestions are as follows. One idea is to optimize lighting control zoning reasonably. According to the lighting demand of Binjiang District calculated in this paper, the lighting control zones can be re-classified into five levels. Control indicators and requirements, such as a the reasonable clarification of lighting brightness and range supplied to each zone, can be established for zones with different levels of demand. Zoning adjustments may also affect the original landscape lighting pattern. In the framework of the original landscape pattern, it is therefore necessary to make fine adjustments according to the brightness requirements of the control zone. Another idea is to carry out lighting optimization and transformation projects from a humanistic perspective to match lighting demands in each area. Efforts should be made not only to keep an eye on the light pollution of the central and eastern areas of Binjiang District (to reduce the brightness to a reasonable level), but also to focus on the transformation of the city’s dark areas. In areas that are too dark, it is necessary to appropriately increase the brightness to enhance the safety and beauty of the nighttime environment. Furthermore, urban development can be achieved using a combination of questionnaires, visits, and other ways to understand local people’s views and needs regarding nighttime city lighting construction; strengthening the “public participation” system; and engaging the public. The third idea is to conduct lighting pattern optimization using a closed-loop mechanism. The analysis of the supply-and-demand relationship for nighttime lighting can be seen as a kind of evaluation study for lighting planning. This relationship can be regularly evaluated to guide adjustments to lighting zoning and provide a reference for the subsequent revision of urban lighting planning.
5.3. Possible Directions for Improvement
This paper involved an empirical study conducted in Binjiang District, Hangzhou, to provide a reference methodology for comparative studies of urban lighting supply and demand. However, there is room for improvement. First, the data were collected from heat maps of crowd activities in Binjiang District for one week in the spring and one week in the autumn to calculate the average. This may add randomness to the derivation of the study results. Because the basis of classification by crowd size/grid area is influenced by the data, more than 60 people were automatically grouped into one category when generating the results. However, Hangzhou is a relatively large city, so most areas of the district show a high demand for lighting. This is due to the low accuracy of data acquisition. Future studies could expand the channels of data acquisition to obtain data that are more precise or editable according to actual demand to improve the accuracy of the research results. Second, the parameters of the empirical research part of this paper primarily refer to Hangzhou’s urban plan and expert scoring opinions. Because conditions vary from city to city, it may be necessary to make different adjustments to the method, such as adding other factors, when calculating nighttime lighting supply and demand for other cities. More cities should be selected for study in subsequent work to further summarize the mathematical and physical patterns of urban lighting supply-and-demand calculations. Third, due to its space limitations and research directions, this study does not include field investigation and research on the causes of the supply–demand relationship for specific parcels in Binjiang District from a microscopic perspective. It also does not include questionnaires, which would make the research results richer and could be discussed in depth in subsequent research. Fourth, again, due to its space limitations and research directions, this study does include an in-depth analysis of the carbon emissions generated by lighting at night, based on the relationship between supply and demand. Follow-up research should establish a balanced relationship between lighting demand, energy consumption, and carbon emissions in Binjiang District as soon as possible, and research on low-carbon methods of satisfying lighting demand should be incorporated into the field of urban lighting planning. Fifth, the study scale was mesoscopic, and the model still had errors when viewed from a microscopic scale. Thus, the size of the study plot grid can also be subdivided according to the needs of the study, such as from the original 50 m × 50 m to 10 m × 10 m or even smaller. The basis of the plot grid size selection was explained in the paper. Finally, the paper investigated the temporal and spatial aspects of people’s activities and included them as important factors associated with urban lighting demand. Future studies should pay more attention to nighttime crowd activities, considering the importance of the “human-centered concept” in urban lighting planning and construction.
6. Conclusions
This study conducts an empirical study of Binjiang District in Hangzhou to provide a reference methodology for the comparative study of urban lighting supply and demand. The process consists of two parts. In the first part, four factors that can affect urban lighting demand are selected. The total lighting demand for a parcel is calculated and categorized into lighting level control zones according to demand by establishing mathematical models. In the second part, image maps of Hangzhou Binjiang District are introduced to calculate and compare the lighting brightness and range in different areas, as well as the reasonableness of the supply and demand for carbon emissions. A comparative analysis is then conducted on the calculation results.
This study can draw four main conclusions. First, the areas with unreasonable lighting brightness account for 20.8% of the total statistical area of the study district, of which dark areas account for 4.51%, occurring mainly in the southwest and northwest, the northern area along the Qiantang River, and the southern area near the edge of the district. Areas prone to light pollution account for 16.29% of the total area, and are mainly concentrated in the central, southeastern, and eastern areas. Second, according to lighting demand, areas in the Level 1 lighting control zone account for 1.84% of total land, which is the smallest proportion of the total area for the five lighting level control zones. Most parcels belong to the Level 3 lighting control zone, which accounts for 49.61%, and is mainly distributed in large areas of the central, southern, and eastern part of the district. Third, the planning and construction of urban lighting is closely related to carbon emissions. Rationalizing nighttime lighting demand in Binjiang District will greatly help to adjust and optimize regional carbon emissions, which can be balanced by reducing unnecessary lighting or increasing lighting construction. A lighting demand–carbon emission balancing mechanism should be established for nighttime lighting in Binjiang District as soon as possible. Fourth, this study constructs a research method to calculate the comparative relationship between lighting supply and demand, which provides a reference for future research on the planning and construction of urban lighting.
The process, methods, and conclusions of this study provide support for the preparation and management of urban lighting planning. An accurate grasp of current urban nighttime lighting demand and clarification of the relationship between lighting supply and demand will help to coordinate this balance, guide the structural adjustment of lighting planning, and continuously improve the quality of the lighting supply system.


 ,
, 


