Article

Machine-Learning-Based Electric Power Forecasting

1
Lingnan College, Sun Yat-sen University, Guangzhou 510275, China
2
Guangdong Electric Power Development Co., Ltd., Guangzhou 510630, China
*
Author to whom correspondence should be addressed.
Sustainability 2023, 15(14), 11299; https://doi.org/10.3390/su151411299
Submission received: 31 May 2023 / Revised: 5 July 2023 / Accepted: 17 July 2023 / Published: 20 July 2023
(This article belongs to the Special Issue Sustainable Production and Operations Management)

Abstract

:
The regional demand for electric power is influenced by a variety of factors, such as fluctuations in business cycles, dynamic linkages among regional development, and climate change. The valid quantification of the impacts of these factors on the demand for electric power poses significant challenges. Existing methods often fall short of capturing the inherent complexities. This paper addresses these limitations by proposing a framework, which integrates machine-learning techniques into regional electricity demand forecasting. Regional electricity generation firms could then leverage the power of machine learning and improve the accuracy and robustness of electric power forecasting. In this paper, we conduct extensive numerical experiments using an actual dataset from a large utility firm and other public data sources. The analysis indicates that the support vector regression model (the SVR model) has high accuracy in predicting the demand. The results show that socio-economic development is the major driver of growth in electricity demand, while weather variability is a key contributor to the seasonal fluctuations in electricity use. Furthermore, linkages among regional development and the status of development of the green economy become increasingly important influencing factors. The proposed forecasting approach helps the regional electricity generation firms reduce a large amount of carbon dioxide emissions.

1. Introduction

The electric power industry provides an essential service for residents and their livelihoods. It is also a pillar industry for the manufacturing and service sectors in a national economy. However, in recent years, power generation firms have commonly faced substantial pressures in a variety of aspects. The supply of raw materials for electricity generation is highly uncertain because of unexpected and disruptive events, such as changes in international relations and soaring shipping rates in cross-border transport. The price of coal remains at a high level in many regions and countries. At the same time, electricity generation firms must adhere to national and worldwide policies on carbon neutrality and carbon emissions. To better respond to supply uncertainty and satisfy production regulations, firms must have a good demand forecast for electric power.
Commonly, electricity demand fluctuates with the cyclical expansion and contraction of socio-economic development. The fluctuation of social demand for electric power places higher requirements on electric power systems in general and on electricity generation firms in particular. During the contraction period of electricity demand, if firms produce excess power, this wastes many resources and considerably increases operating costs, such as procurement costs. During the expansion period, if firms cannot expend the capacity accordingly, this leads to a shortage of power, which has a significant negative impact on socio-economic development and urban residents’ livelihoods. However, accurate electricity demand forecasting is challenging due to the uncertain influencing factors and the complex mechanisms involved.
Moreover, different regions have different economic structures, industrial layouts, consumption habits, and climates, etc., resulting in different characteristics of electricity demand in each region. For example, the southern region requires a large amount of electric power for air conditioning in the summer, while the northern region requires a large amount of power for heating in the winter. Furthermore, governmental policies, such as carbon emissions reduction policies, considerably affect regional electricity demand. Conventional forecasting methods are often developed based on subjective experiences and many assumptions and simplifications of real-world scenarios. Such models are not suitable for today’s complex and changing power market scenario.
To improve the accuracy of regional electricity demand forecasting, scholars have proposed a variety of forecasting models and methods. Dougherty [1] classified forecasting methods based on the types of data used, the forecasting range, and the potential uses. Conventional forecasting models include regression models [2] and autoregressive moving average models [3], etc. The models are applicable only if the associated statistical assumptions are satisfied. With the development and maturity of big data analysis technology in recent years, some researchers have attempted to use machine-learning techniques in electricity demand forecasting, such as artificial neural network models [4] and support vector regression models [5]. In practice, some firms have started to apply machine-learning techniques for generating regional demand forecasts for electric power. For example, the New York Independent System Operator (NYISO) developed a forecasting model using historical demand data and weather data for the regions over the years; the model considerably improved the efficiency and stability of the power system.
Hosting China’s largest regional economy, Guangdong Province must satisfy both the urban residents’ consumption demand and the manufacturing enterprises’ production demand for electric power while approaching China’s carbon neutrality and carbon emissions targets. The electricity consumption of Guangdong Province reached as high as 786.6 billion kilowatt-hours in 2021 (Guangdong provincial Bureau of Statistics. 18 July 2023. http://stats.gd.gov.cn/gmjjzyzb/content/post_3803415.html); however, the consumption demand for electric power fluctuates significantly. To reduce the fluctuations, the government did not have much choice but to implement time-of-use pricing policies for electric power. On the other hand, Guangdong’s economic activities continue to be buoyant, and the industrial upgrading and rapid development of smart manufacturing create more energy demands. The regional power generation firms must cater for both the consumption demand and the production demand while balancing social and economic benefits with their own cost effectiveness.
To develop an applicable electricity demand forecasting method, this paper initially specifies a variety of influencing factors, which affect the regional electricity demand. Machine-learning techniques, such as support vector machines, are then used to develop regional demand forecasting models. Using the historical data of Guangdong Province, this research further assesses the plausible models in terms of prediction accuracy and specifies the best-fit forecasting model for making regional electricity demand forecasts. Furthermore, this paper considers linkages among regional development and the effects of carbon neutrality and carbon emissions policies.
The rest of this paper is structured as follows. Section 2 reviews the current scientific methods for electricity demand forecasting and summarizes key research on the factors affecting electricity demand. In Section 3, a research framework is proposed, and the related forecasting models, which are plausible in this study, are introduced. In Section 4, we present a case study of Guangdong Province using real-life data, examine the effect of the proposed models on reducing carbon dioxide emissions, and extend the discussion to the medium- and long-term electricity demand fluctuations. Section 5 provides the main managerial implications of this study. Lastly, in Section 6, the research is concluded, and future research directions are specified.

2. Literature Review

2.1. Power Forecasting Methods

The conventional methods for predicting electricity demand mainly include intuitive analysis, statistical analysis, terminal energy analysis, and econometric analysis. A conventional and effective method could be the wavelet analysis, which was initially applied for short-term load forecasting by Granger [6]. The proposed method could capture the periodicity of electricity load, but it did not consider such crucial factors as climate. From the power supply perspective, Uri [7] proposed a method to calculate energy consumption demand based on the utilization rates and production efficiency of terminal equipment, which largely determines energy consumption. The method did not require complicated mathematical models. However, because of the difficulties in collecting data on indicators, such as equipment utilization rates, the use of this method was limited. Multiple linear regression was a widely utilized multi-variate analysis technique, which employed an extended linear model to effective model datasets [8]. This approach has gained popularity worldwide due to its ability to provide accurate representations of the underlying processes and variability in error distribution. Consequently, it enhances the management of applied mathematics for likelihood analysis involving a broad range of unfavorable factors. Mohamed and Bodger [9] introduced GDP, electricity price, and total population into a multiple linear regression model to predict electricity consumption in New Zealand from 2000 to 2005. However, these models did not perform well when handling over- and under-dispersion, as they assumed an equal mean and variance. The performance of these models could be affected by low sample means, leading to biased outcomes in case studies with small sample sizes [10].
With the development and maturity of artificial intelligence technology, researchers have started to apply the techniques in making power forecasts. The neural model can forecast the most critical variable using a normalized importance approach, such as the regression model. Fitting a relapse model is proportional to getting a neuronal system ready. This could be achieved by iteratively changing masses, to the point where the system’s yields had a negligible chance of being incorrect [11]. Teimeh et al. [12] reviewed 77 relevant studies on electricity load forecasting published in academic journals from 2010 to 2020 and found that 90% of the models used for electricity prediction were based on artificial intelligence, among which artificial neural networks accounted for 28%, and the root mean square error (RMSE) was the most used error indicator among electricity predictors. Hu et al. [13] proposed a decomposition-based combination forecasting model using a dynamic adaptive entropy-based weighting. Compared with an autoregressive integrated moving average and artificial neural network, the proposed method had higher prediction accuracy and better stability. Ahmed et al. [14] proposed a deep neural network model based on a long short-term memory network (LSTM) and recursive neural network (RNN) for short-term electricity demand forecasting, but they did not consider factors such as weather and holidays. Ensemble methods, optimization algorithms, time-series decomposition, and weather clustering were identified as important techniques, which could be used to enhance forecasting performance [15]. Shi et al. [16] used an ensemble learning method combined with multiple predictors for electricity load forecasting, which had high prediction accuracy in dealing with complex multi-source problems.
Compared with the above-mentioned methods, machine-learning models can achieve a high prediction accuracy with smaller data scales when predicting electricity demand. Waheed et al. [17] used an improved artificial intelligence algorithm, which combined fuzzy logic, genetic algorithm, and support vector machine for short-term electricity load forecasting. The model could accommodate uncertainties, nonlinearities, and multi-variate problems, and improve the global search capability, sparse solution characteristics, and generalization ability of predictions. Support vector regression (SVR) has also been identified as a suitable approach for the task at hand. In a study conducted by Al-Musaylh et al. [18], SVR was compared with statistical models, such as the autoregressive integrated moving average (ARIMA) and multi-variate adaptive regression spline (MARS). Al-Musaylh et al. [19] also employed SVR in conjunction with particle swarm optimization, incorporating an enhanced version of empirical mode decomposition with adaptive noise. The innovative technique facilitated the decomposition of previous load data into intrinsic mode functions (IMFs), which were subsequently aggregated to generate predictions. Dong and Zhang [20] introduced the cuckoo search (CS) algorithm combined with the SVR model, implementing a seasonal data processing approach. To diversify the exploration of the CS space, they incorporated a tent chaotic mapping function. Zhang and Hong [21] utilized the same tent chaotic mapping strategy, integrating it with variational mode decomposition to address nonlinearity in the data. Additionally, they employed a self-recurrent mechanism to incorporate the concept of memory within the model.
In Son and Kim [22], SVR was applied to forecast energy demand in the residential sector. The model exhibited excellent performance by incorporating a wide range of weather and social variables alongside load data. Notably, the inclusion of weather and other exogenous variables demonstrated the robustness of SVR models, even when working with limited datasets [23]. Based on the pigeon-inspired optimization algorithm, Tian et al. [24] applied the support vector machine method to predict the future power demand in China. The proposed model could efficiently make predictions by forming the feature vector from the past power consumption data. Therefore, in this paper, we use machine-learning techniques to analyze the electricity demand in Guangdong Province, China, and to develop an applicable demand forecasting model for electric power.

2.2. Factors Influencing the Demand for Power

Academic scholars and industrial practitioners have specified a variety of factors, which influence the regional electricity demand, including socio-economic development, geographical climate, and state policies.
Regarding socio-economic development, Kenneth [25] studied the terminal energy consumption of countries in the Asia–Pacific region, Europe, the U.S., and Canada. The study demonstrated that there was a nonlinear growth relationship between per-capita income and electricity consumption and that the growth rate of electricity consumption slowed down as per-capita income increased. Cheung and Thomson [26] performed a cointegration test to examine the correlation between GDP and electricity demand and showed that China’s economic growth is positively related to electricity consumption, while China’s price reforms of electric power have a suppressive effect on demand. Costantini and Martini [27] conducted a panel data analysis on the relationship between electricity demand and economic growth. The research found a positive correlation between electricity demand and economic growth in developed EU countries, while a negative correlation existed in non-developed countries.
In addition to the economic factors, Jovanovic [28] examined the influencing factors at the national level and identified national economic governance, population size, and weather as the most influential factors. Sheng et al. [29] studied the impact of urbanization on energy consumption using the national data for the period of 1995–2012. The research showed that the process of urbanization leads to substantial increases in actual energy consumption but a decrease in the efficiency of energy use. Mir et al. [30] provided a comprehensive literature review on electricity demand determinants and performed a comparative analysis of forecasting methods. The study argued that time-series modeling methods are widely used in medium- and long-term forecasting, while artificial intelligence techniques dominate in short-term forecasting. Nkengfack et al. [31] analyzed the causal relationship among power consumption, economic growth, and carbon emissions for Algeria, Egypt, and South Africa over the period 1971–2015. The results showed that aggregate power consumption and economic growth have positive and significant impacts on carbon dioxide (CO2) in both the short and long run in those countries. Alasali et al. [32] explored the impact of the COVID-19 pandemic on electricity demand and load forecasting in Jordan. Three methods—the gray model, the exponential smoothing model, and the artificial neural network—were used to forecast the electricity demand from January 2020 to June 2020. The results showed that the COVID-19 pandemic reduced electricity demand in Jordan by about 10%, with the artificial neural network performing best among the three methods. To provide a better overview, this paper summarizes the related literature in terms of the influencing factors (Table 1).
The regional electricity demand in Guangdong Province exhibits some unique characteristics, which must be considered in the demand forecasting. For example, the electricity loads at the peak periods are significantly different to those at the off-peak periods, and the rate of load change is quite high at the peak-to-off-peak transitions. This could be caused by the strategic deployment of the west-to-east power transmission. Generally, the regional demand of Guangdong Province could be affected by a variety of influencing factors in the regional power system, the economy, the weather, and the social structure. Furthermore, in China, the impact of the carbon neutrality and carbon emissions policies on regional electricity demand may vary due to the status of economic development and urbanization. This paper aims to quantify the influencing factors in the regional demand for electric power in a scientific way, considering both the common factors and region-specific factors.

3. Research Framework and Forecasting Methods

3.1. The Research Framework

In practice, regional electricity demand forecasting involves multiple stakeholders, such as power generation firms and power grid corporations. Furthermore, to make a good regional electricity demand forecast, one must consider such factors as socio-economic development, weather variability, and policy adjustments involving multiple regions. Electricity consumption depends on different factors, which have to be identified and implemented programmatically in order to build relevant forecasting models. This could rely on pure mathematical techniques or artificial intelligence methods [49]. To ensure the quality of electricity demand forecasts, it is necessary to set up a research framework, which is scientific and comprehensive. The framework allows the embedding of latest machine-learning techniques and configuration of research activities in line with our case study of Guangdong Province.
Specifically, the research framework structures the research process as four successive steps (Figure 1). In Step 1, data are collected using both the interview and secondary data collection methods. In Step 2, the preliminary processing of data is performed to ensure that the dataset is fit for subsequent processing using machine-learning techniques. In Step 3, such forecasting models as support vector regression and random forest are trained and tuned. In Step 4, cross-validation is performed to evaluate the plausible forecasting models.
Step 1. Collection and collation of data. This paper examines a real-life case to establish an in-depth understanding of the influencing factors, which affect regional electricity demand.
We primarily interviewed industrial stakeholders in Guangdong Province, including power generation firms, power fuel suppliers, power grid corporations, and business and residential users, in order to have a better understanding of their respective needs and views on the supply and demand of electric power. The interview process spanned a period of three months from August 2022 to November 2022. Industrial interviewees were carefully selected based on their expertise and leadership roles in the electricity sector. The interviewees comprised top-level executives and department heads who have worked for five to ten years or more for power generation firms, power fuel suppliers, or residential users. The interviews employed a semi-structured approach, which allowed for open-ended discussions and the exploration of various dimensions related to the supply and demand of electric power. The interview arrangements aimed to capture a wide range of perspectives and ensure the inclusion of diverse viewpoints.
Following these, with the help of the largest power generation firm in the region, we collected secondary actual data from Wind, a leading data service provider in China. Wind specializes in collecting, analyzing, and providing economic and financial data, and it provides a wide range of information on the energy sector. Leveraging Wind’s large-scale database, we obtained historical data specific to the regions. Recognizing the influence of weather conditions on electricity demand, regional weather data were collected from the Guangdong Meteorological Bureau, which has officially recorded data, such as temperature, humidity, precipitation, and other meteorological information.
A simple check was conducted to ensure data integrity and consistency. A preliminary data filtering process was performed to identify and address any anomalies or inconsistencies within the datasets. This process involved identifying the missing values, outliers, and data entry errors, which were subsequently addressed through appropriate data cleansing techniques. After the cross-validation exercises, comparing the information collected from stakeholder interviews with the secondary data, multiple sets of data related to the demand forecasting of Guangdong Province were collected, such as the monthly power used by residents, the power used in enterprise production through the west-to-east power transmission method (The west-to-east power transmission is China’s energy dispatch policy. It is employed to balance the supply and demand across multiple provinces and regions in China. China’s western provinces are rich in coal and hydropower resources, while in China’s eastern provinces, the dense urban agglomerations and thriving economic production activities require large amounts of electric power. In this study, the west-to-east power transmission refers to delivering the electric power from Yunnan Province and Guizhou Province to Guangdong Province.), regional economic statistical data, and weather data. There are 14 indicators, covering the time range from February 2007 to October 2022.
Step 2. Preprocessing the data. We performed a preliminary descriptive statistical analysis of the datasets to address the issues of missing values and outliers. To intuitively understand the distribution of data, we conducted a basic visual processing of the datasets and analyzed the correlation between variables using a heat map. To accommodate the missing values, we used the feature engineering technique and leveraged the trend extrapolation method.
When processing the data, the scale and magnitude of the data may not be consistent. Thus, we also standardized the secondary data collected, following the Z-score standardization formula [50] in the data standardization process below:
x ¯ i j = x i j M e a n i S t d i
where x i j represents the j th observation data of the i th variable in the dataset, M e a n i and S t d i represent the mean and standard deviation of the i th variable in the dataset, and x ¯ i j represents the standardized data after processing.
Step 3. Training and tuning the regional electricity demand forecasting models. Based on the existing literature, we used three machine-learning models, i.e., the linear regression model, support vector regression model, and random forest regression model. The training datasets of the models were all selected from the datasets preprocessed in Step 2.
To improve the models’ predictive performance, we carefully tuned the models and found the best combination of model parameters using a grid search method, i.e., an exhaustive search for the optimal solution of parameters. Compared with other tuning methods, the grid search method is suitable for various models and algorithms, but it also allows users to independently evaluate each combination of parameters, resulting in higher reliability.
Step 4. Evaluating the forecasting models. Currently, there are various error standards used to evaluate the accuracy of predictive models [51,52]. To evaluate the plausible models in terms of predictive performance and accuracy, we used the following indicators [53,54], i.e., the mean squared error (MSE), mean absolute error (MAE), Nash–Sutcliffe coefficient ( E n s ), and Legates–McCabe index ( E l m ):
M S E = 1 n i = 1 n ( y ^ i y i ) 2
M A E = 1 n i = 1 n | y ^ i y i |
E n s = 1 i = 1 n ( y ^ i y i ) 2 i = 1 n ( y i y ¯ ) 2
E l m = 1 i = 1 n ( y ^ i y i ) 2 i = 1 n ( | y ^ i y ¯ | | y i y ¯ | ) 2
where n is the number of data points; y ^ i and y i , respectively, represent the predicted value and true observed value of the data point; and y ¯ is the mean value of the true observed value.
Cross-validation is a common method for evaluating model performance. It usually divides a dataset into several subsets and uses one subset for training and another subset(s) for model validation or evaluation. By repeating this process several times, cross-validation can effectively reduce the influence of randomness. In this paper, we used cross-validation to calculate the predictive performance of the models, to assess the quality of the datasets, and to determine the applicability of the models. The analysis helps in specifying the best-fit electricity demand forecasting model for the region.

3.2. The Support Vector Regression Model

The support vector machine was originally introduced by Vapnik in 1992 [55] to solve classification problems, but it was later extended to handling regression problems [56]. Support vector regression (SVR) is a machine-learning-based nonlinear regression model, which uses the support vector machine algorithm in the regression analysis. Compared with conventional linear regression models, the SVR model can investigate nonlinear relationships and handle high-dimensional data.
In the monthly electricity consumption dataset ( X , y ) = { ( X 1 ,   y 1 ) ,   ( X 2 ,   y 2 ) ,   ,   ( X n ,   y n ) } , the ith row input vector X i contains a variety of features in the four major aspects, i.e., regional electricity consumption U , regional power generation P , regional economy E , and regional weather W . The objective of the SVR model is to find out a function f ( X ) , which can predict the corresponding output value y i , i.e., regional electricity consumption. Subsequently, under the SVR model, this nonlinear regression problem can be defined as
y = f ( X ) = ω Φ ( X ( U , P , E , W ) ) + b
where ω is the weighted vector, b is the constant term, and Φ ( X ( U , P , E , W ) ) represents the mapping function established in the feature space of ( U , P , E , W ) . To determine f ( X ) , this paper specifies an optimal hyperplane on the dataset, so that the distance between all sample points and the hyperplane does not exceed a certain threshold. The coefficient ω and the constant term b can be obtained from the following optimization formulations:
m i n     1 2 || ω || 2 + C 1 N i = 1 N ( ξ i + ξ i * )
subject to
y i ( ω Φ ( X ( U , P , E , W ) ) + b ) ε + ξ i
( ω Φ ( X ( U , P , E , W ) ) + b ) y i ε + ξ i *
ξ i ,   ξ i * 0
where || ω || 2 is the length of the hyperplane, ξ i and ξ i * are the upper and lower bounds of the error terms, and the accuracy and complexity of the model can be balanced by adjusting the constants C and ε . By introducing Lagrange multipliers and optimization conditions, the following nonlinear equation can be obtained:
f ( X ) = i = 1 N ( α i + α i * ) K ( X i , X j ) + b
where α i and α i * are Lagrange multipliers, K ( x i , x j ) is the kernel function, which describes the inner product in the multi-dimensional feature space with X i , X j X . Under the KKT condition, there exist a finite number of nonzero coefficients α i and α i * . The corresponding data points, namely support vectors, will lie on the hyperplane. The kernel function used in this article is the linear function, which can be expressed as
K ( X i , X j ) = X i T X j
where X i and X j are input vectors. During the model training phase, the impact of support vectors on the input data is mainly determined by constant C , and these parameters can be adjusted through the grid search to improve the accuracy of the model.

3.3. The Random Forest Model

Random forest is an ensemble learning method, which consists of multiple decision trees and is commonly used for classification and regression problems [57,58]. In a random forest, the output of each decision tree is regarded as a vote, and the final output is the majority decision of these votes. Random forest can effectively handle high-dimensional data and large sample sizes while maintaining robustness and generalization. Additionally, random forest can identify the important features in the forecasting through the feature importance measure.
For the monthly electricity consumption dataset ( X , y ) = { ( X 1 ,   y 1 ) ,   ( X 2 ,   y 2 ) ,   ,   ( X n ,   y n ) } , each sample X i is a multi-dimensional feature vector, and y i is the target value of that sample. Thus, the regression model can be represented as
h ( x ; Θ ) = 1 B b = 1 B h b ( x ; Θ b )
where h b ( x ; Θ b ) is the b th decision tree, and Θ b is the parameter of the tree.
In this study, the training process of the above regression model is as follows:
Step 1. For each decision tree h b ( x ; Θ b ) , a new training set D b is formed by randomly sampling k samples with replacement from the training set ( X , y ) . This process is called bootstrap sampling.
Step 2. Randomly select m features, where m is less than the total number of features, as the feature set for the tree. This process is called feature bagging.
Step 3. For each node, select the optimal feature from the feature set and split the node into two child nodes based on the value of that feature until a stopping condition is met (e.g., the number of samples in the node is less than a certain threshold).
Step 4. Repeat Step 3 until the size of the tree reaches a predetermined value or cannot be split further.
After training, for a new data sample x * , each decision tree in the model can obtain a corresponding predicted value T b ( x * ) . The predicted value of the random forest regression model is the average of all the decision tree predicted values, i.e.,
y = 1 B b = 1 B T b ( x * )
Note that the training and prediction time of the random forest model is relatively long, especially when the number and depth of the trees are large. When there is a high degree of correlation between the sample features, the performance of the random forest model may not be better than that of other algorithms.

3.4. The Remarks

Both the SVR and random forest models, while effective in forecasting tasks, are not immune to limitations. One major concern is the sensitivity of these models to certain parameters and assumptions. For SVR, the choice of the kernel function and its associated hyperparameters can significantly impact the model’s performance [59]. Similarly, in random forest models, the number of trees, the depth of each tree, and the selection of the splitting criteria are crucial factors, which may influence forecasting accuracy [57]. To carefully select optimal parameter settings, in this paper, we conduct rigorous experimentation and optimization processes, leveraging techniques such as grid search and cross-validation, in order to identify the most suitable parameter configurations for the specific forecasting task.
Another limitation inherent to machine-learning models, including SVR and random forest, is their relatively low interpretability compared to traditional statistical models. In this paper, we acknowledge the trade-off between interpretability and accuracy, and we propose feature importance analysis to interpret the outputs of the machine-learning models. By supplementing the model outputs with interpretability techniques, this paper enhances the understanding of the factors driving electricity demand and enables stakeholders to make informed decisions based on the forecast results.
In this research, we focus on regional electricity demand forecasting to assist generation firms in quantifying the impacts of various factors on the demand for electric power. By leveraging machine-learning methods, we can capture the intricate relationships and nonlinearities present in the data, enabling a more accurate and comprehensive understanding of the influences of these factors [60,61].
Machine-learning models offer the advantage of incorporating a wide range of input features, including weather data, economic indicators, and other relevant factors, which may exhibit complex interactions [62,63]. By integrating these factors into the forecasting models, we can uncover hidden patterns and dependencies, which may not be easily captured by traditional statistical techniques.

4. Case Analysis

4.1. Dataset

In order to build an electricity demand prediction model, a large amount of relevant data is needed, including but not limited to economic data, weather data, and business operational data. Regarding the case of Guangdong Province, this study collected monthly electricity consumption data and various related data from February 2007 to October 2022 (Table 2).
In this study, we take the electricity consumption of Guangdong Province as the dependent variable y. Based on the interviews with industrial stakeholders and the review of the literature, we specify a list of plausible influencing factors and collect the corresponding data. Economic factors have been widely recognized as significant drivers of electricity demand. Previous literature suggests certain indicators, such as the regional GDP, regional industrial structure, and consumer price index (CPI), as relevant variables. CPI partially measures the price movement of residential energy items used for heating, cooling, lighting, cooking, and others. Note that in Guangdong Province, the statistical cycle of GDP is usually once a year, while the cycle of the consumer price index is relatively short, usually once a month.
The industrial stakeholders interviewed argue that power generation firms in the region commonly develop monthly power generation plans, and such historical information as power consumption and power generation is helpful in creating the plans. Moreover, Guangdong Province is one of the power-receiving regions under the west-to-east power transmission policy, whereas Yunnan Province and Guizhou Province are both power-exporting regions. This policy apparently builds up a linkage within the regions, thus affecting the power generation plans.
In addition, Guangdong Province has a subtropical monsoon climate, and the wind speed and precipitation often affect the temperature. Industrial stakeholders commonly believe that variables such as wind speed, precipitation, and temperature fluctuations [64] considerably impact electricity consumption. Given the statistical cycles, the seasonal climate changes, and the firms’ planning practices in the region, this research initially examines the regional power production and consumption, regional consumer price, and regional weather variations while ignoring such long-term indicators as GDP and population for the time being.
In summary, the selection of features aims to capture the most influential factors, which are both readily available and have a direct impact on electricity consumption in Guangdong Province. Here, the feature selection process is driven by the practical considerations of data availability, temporal relevance, and the specific context of the region under study.
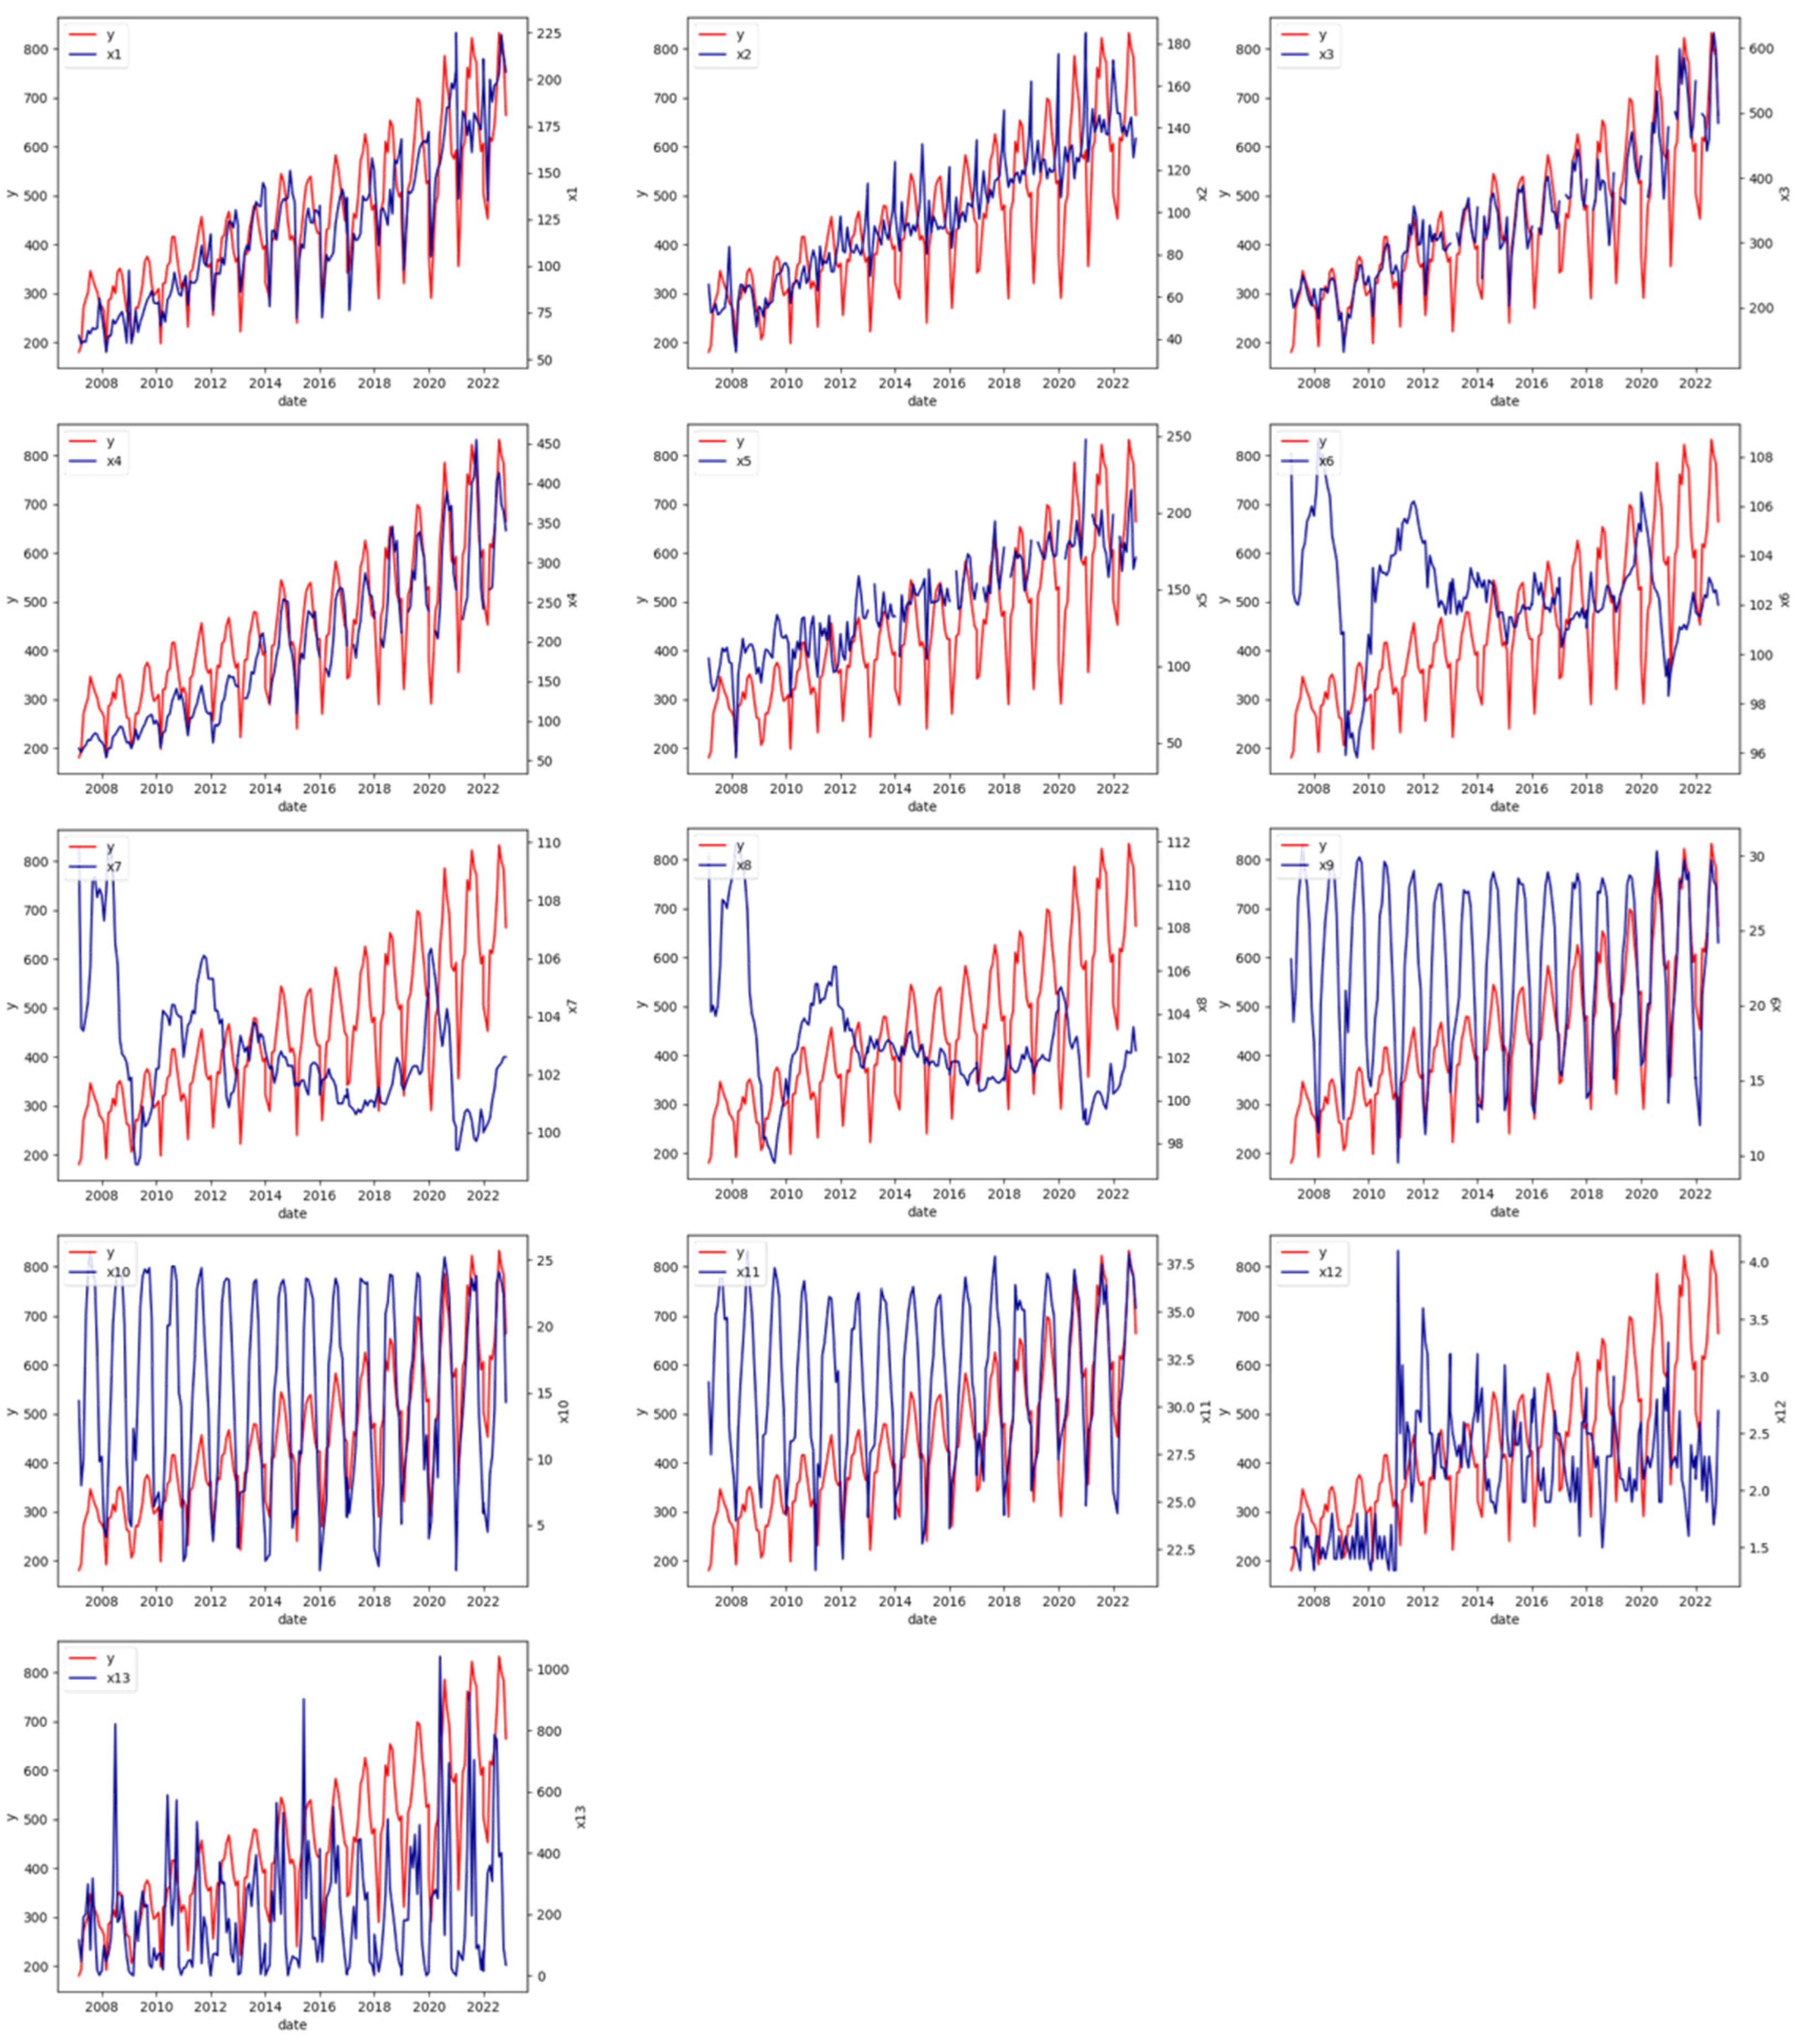
The collected monthly data are time-series data, and some exhibit a certain periodicity in time (Figure 2). Taking electricity consumption in Guangdong Province as an example, from February 2007 to October 2022, the power consumption data show an upward trend, while within a year, they show a cyclical trend of first increasing and then decreasing, reaching a peak in July and August. This trend is also reflected in many other variables.
The temperature fluctuations in recent years have been relatively stable in terms of cycles and peaks (x9, x10, x11), while the peak value of electricity consumption data has been increasing year by year under the same periodic fluctuations. A possible reason is that the regional economic level has improved year by year, and industrial power consumption and residential power consumption have increased accordingly. Among them, the trend of power consumption and power generation data in the Yunnan–Guizhou region is highly consistent with that in the Guangdong region (x1, x2), indicating that the power fluctuations present a certain periodicity, and the west-to-east power transmission may affect the electricity consumption and power generation in Guangdong Province.
Based on Pearson’s correlation coefficient [65], a correlation heat map demonstrates the quantitative correlation between each variable and the dependent variable (Figure 3). The correlation is ranked from high to low. Here, the analysis indicates that regional electricity generation (x3) is most closely related to regional electricity consumption. In addition, electricity generation and consumption (x4, x5, x1, x2) in Yunnan and Guizhou Provinces are highly correlated with electricity consumption in Guangdong Province. Such weather factors as temperature (x11, x9, x10), precipitation (x13), and wind speed (x12) affect regional electricity consumption to some extent. During the summer in Guangdong Province, the electricity consumption rises, most likely due to the increased use of air conditioners. Lastly, regional CPI variables (x8, x7, x6) have a negative correlation with regional electricity consumption. This is probably because the excessive rise in CPI is manifested in consumer goods’ prices, inflation, and currency depreciation, which diminishes people’s incomes and reduces their purchasing power. Therefore, during an economic downturn, the demand for electric power in the region diminishes accordingly.

4.2. Parameter Setting

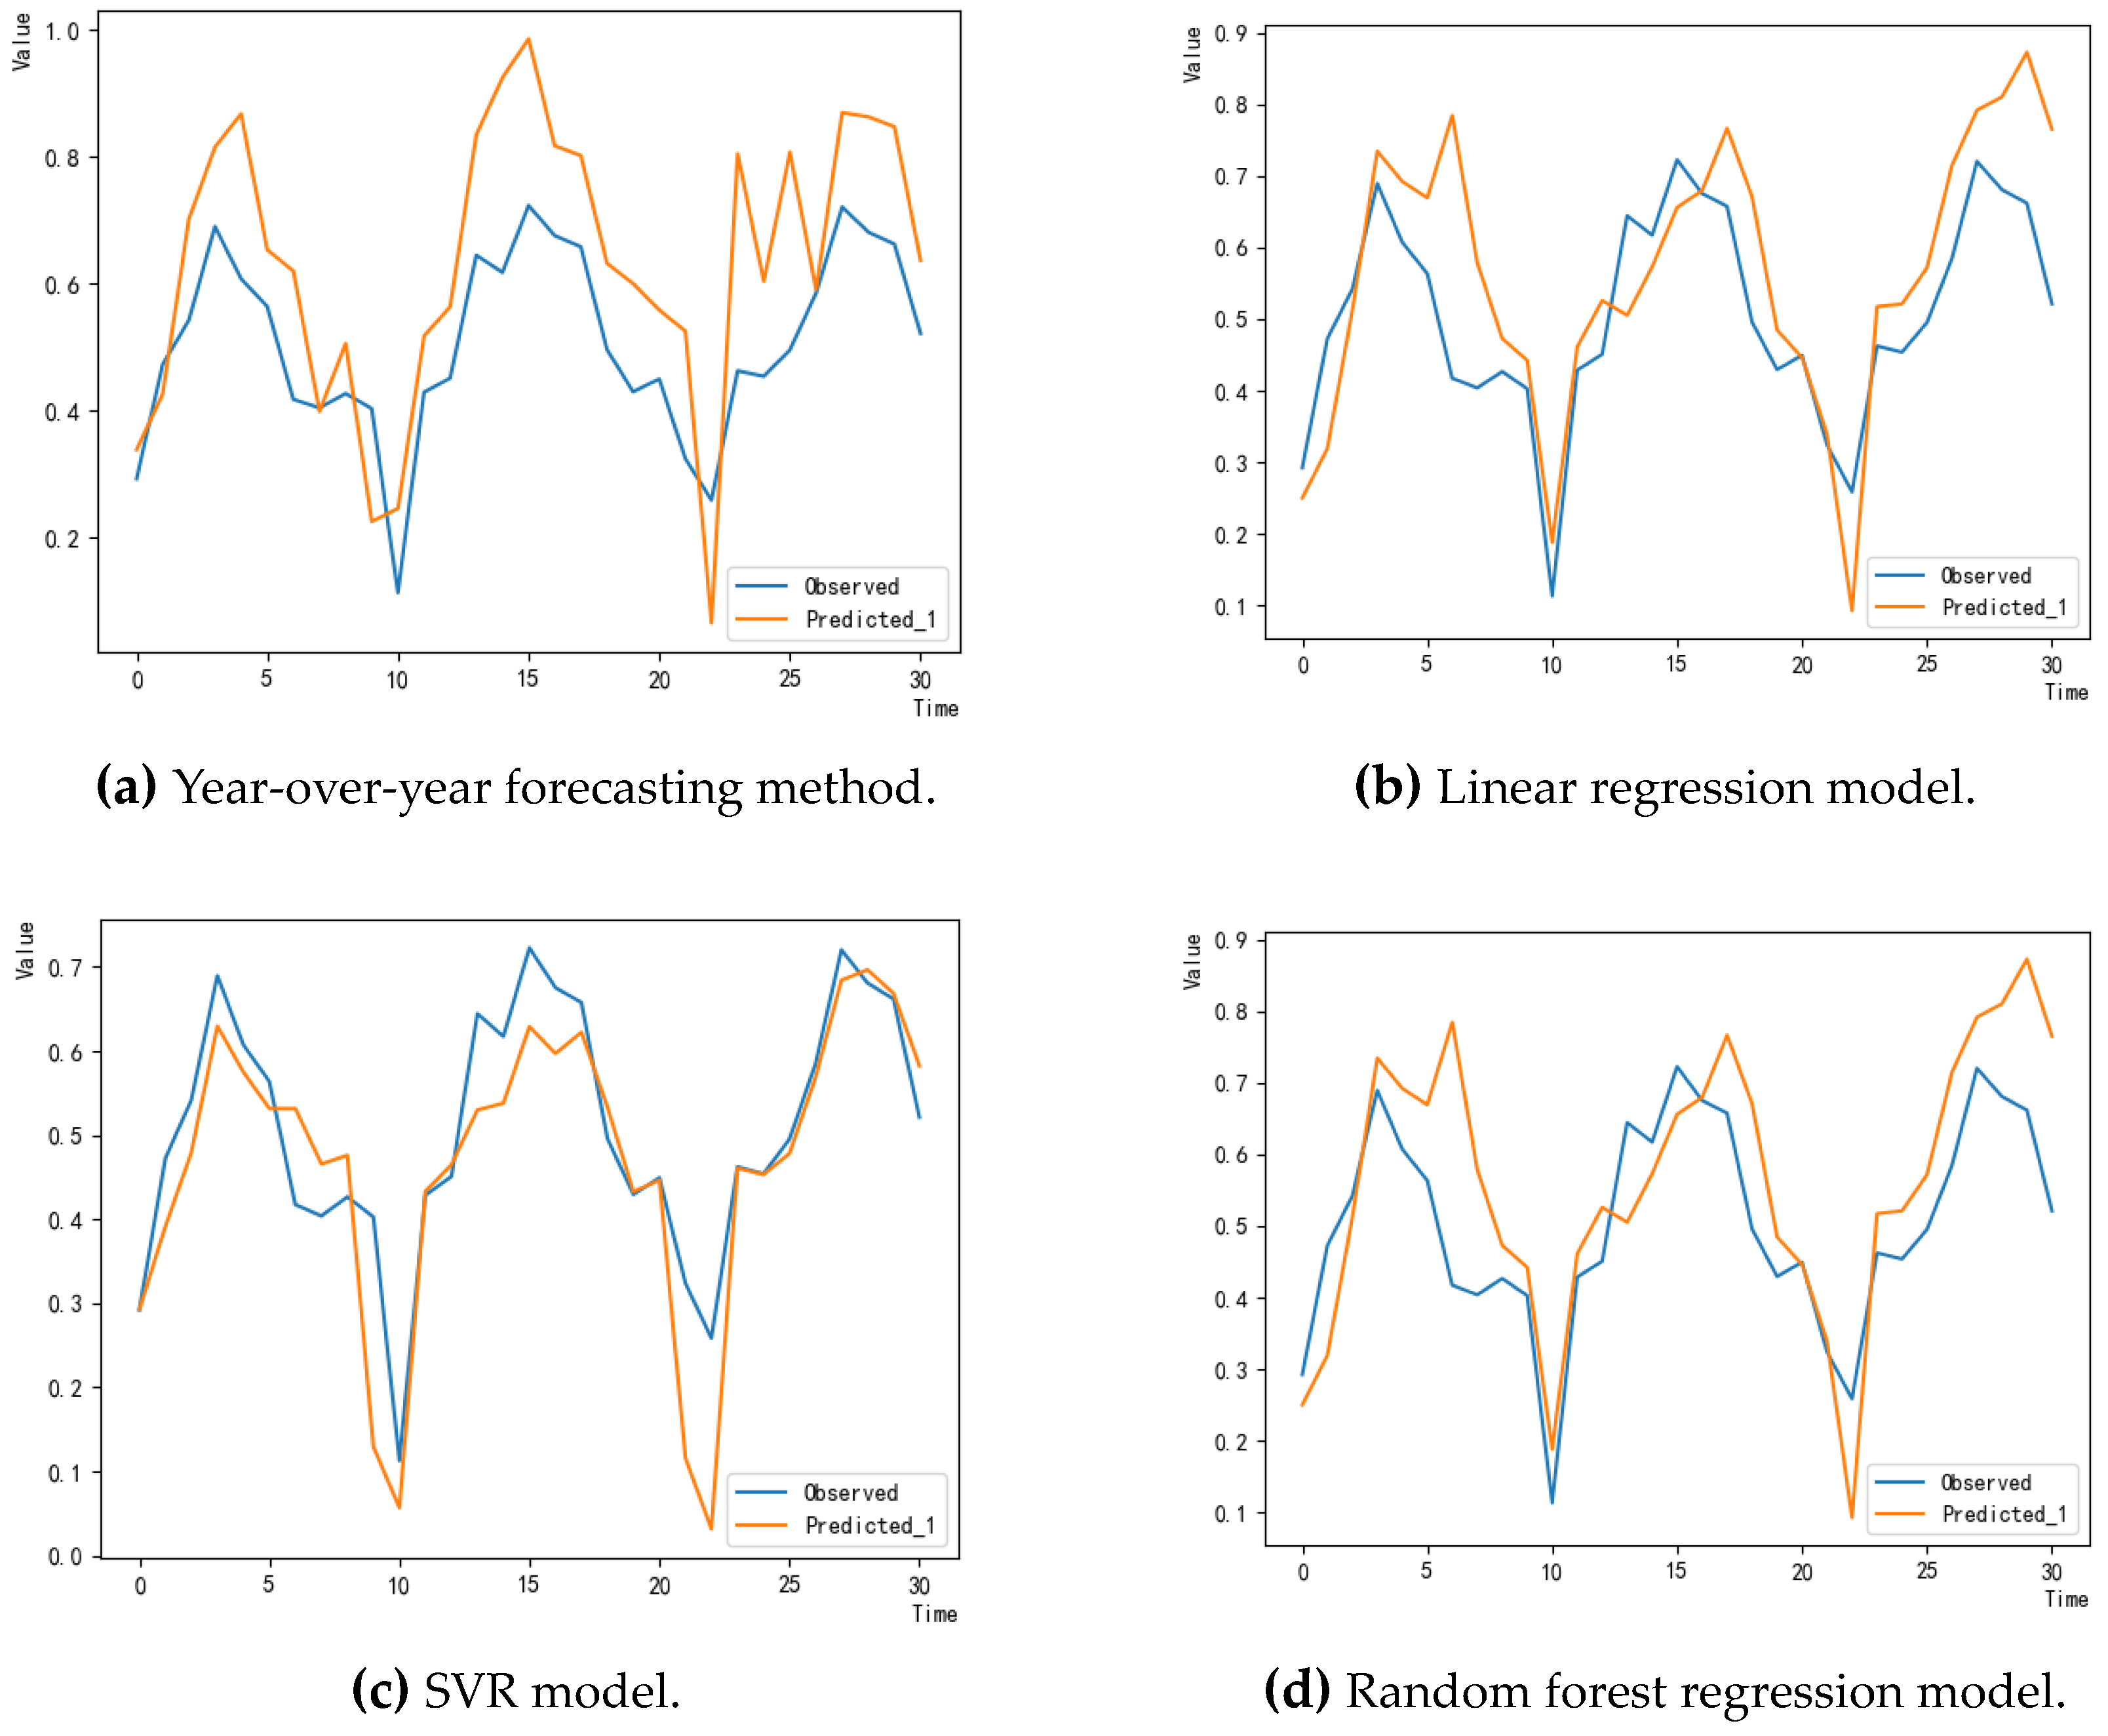
In this paper, we processed the collected time-series dataset to build the training data for predictive models. Following Waheed et al. [16], we used the linear regression model, support vector regression model, and random forest regression model for predicting the regional power demand. Regarding the support vector regression model, we used the grid search method for optimizing the model parameters. The values of the parameters of the SVR model and the random forest model are shown in Table 3 and Table 4, respectively. Note that a large power generation firm in Guangdong Province employs a simple year-over-year method for creating the regional electricity demand forecast. The method examines the year-over-year changes from the previous month to estimate the year-over-year variation for the current month. We take this method as a benchmark.
By comparing the predicted values of the models with the actual values (Figure 4), we observed that the predictive ability of the selected models is satisfactory.

4.3. The Assessment of Forecasting Methods

To examine the accuracy of the models, we performed cross-validation to evaluate the models using four indicators, i.e., the mean squared error (MSE), mean absolute error (MAE), Nash–Sutcliffe efficiency coefficient ( E n s ), and Legates–McCabe index ( E l m ). The mean squared error (MSE) is commonly used for measuring the deviation of the prediction results. Generally, the smaller the MSE, the smaller the difference between the predicted results and the true values, and the better the performance of the prediction model. The MAE represents the average absolute error between the predicted value and the observed value. The smaller the MAE, the better the model fit with the data. An E n s closer to 1 indicates a better predictive performance of the model, while an E n s closer to 0 indicates a poorer predictive performance of the model. The range of E l m is [−∞, 1]. The closer the E l m is to 1, the better the predictive performance of the model, and vice versa.
Table 5 shows the accuracy performance of the three models. The results indicate that, in terms of MSE and MAE, the SVR model performs the best, the random forest regression model is second, and the linear regression model has the largest prediction error. In terms of E n s and E l m , the SVR model is still the best, with E l m as high as 0.944. Overall, the SVR model has the best predictive performance with the dataset.

4.4. Forecasting Findings

For the electricity generation companies in Guangdong Province, the SVR model provides a simple and effective method for electricity demand forecasting. In this paper, we set the kernel function parameter as “linear” and train the SVR prediction model, and we analyze the contribution of each influencing indicator for predicting the regional electricity demand, that is, the importance of each variable in the SVR model.
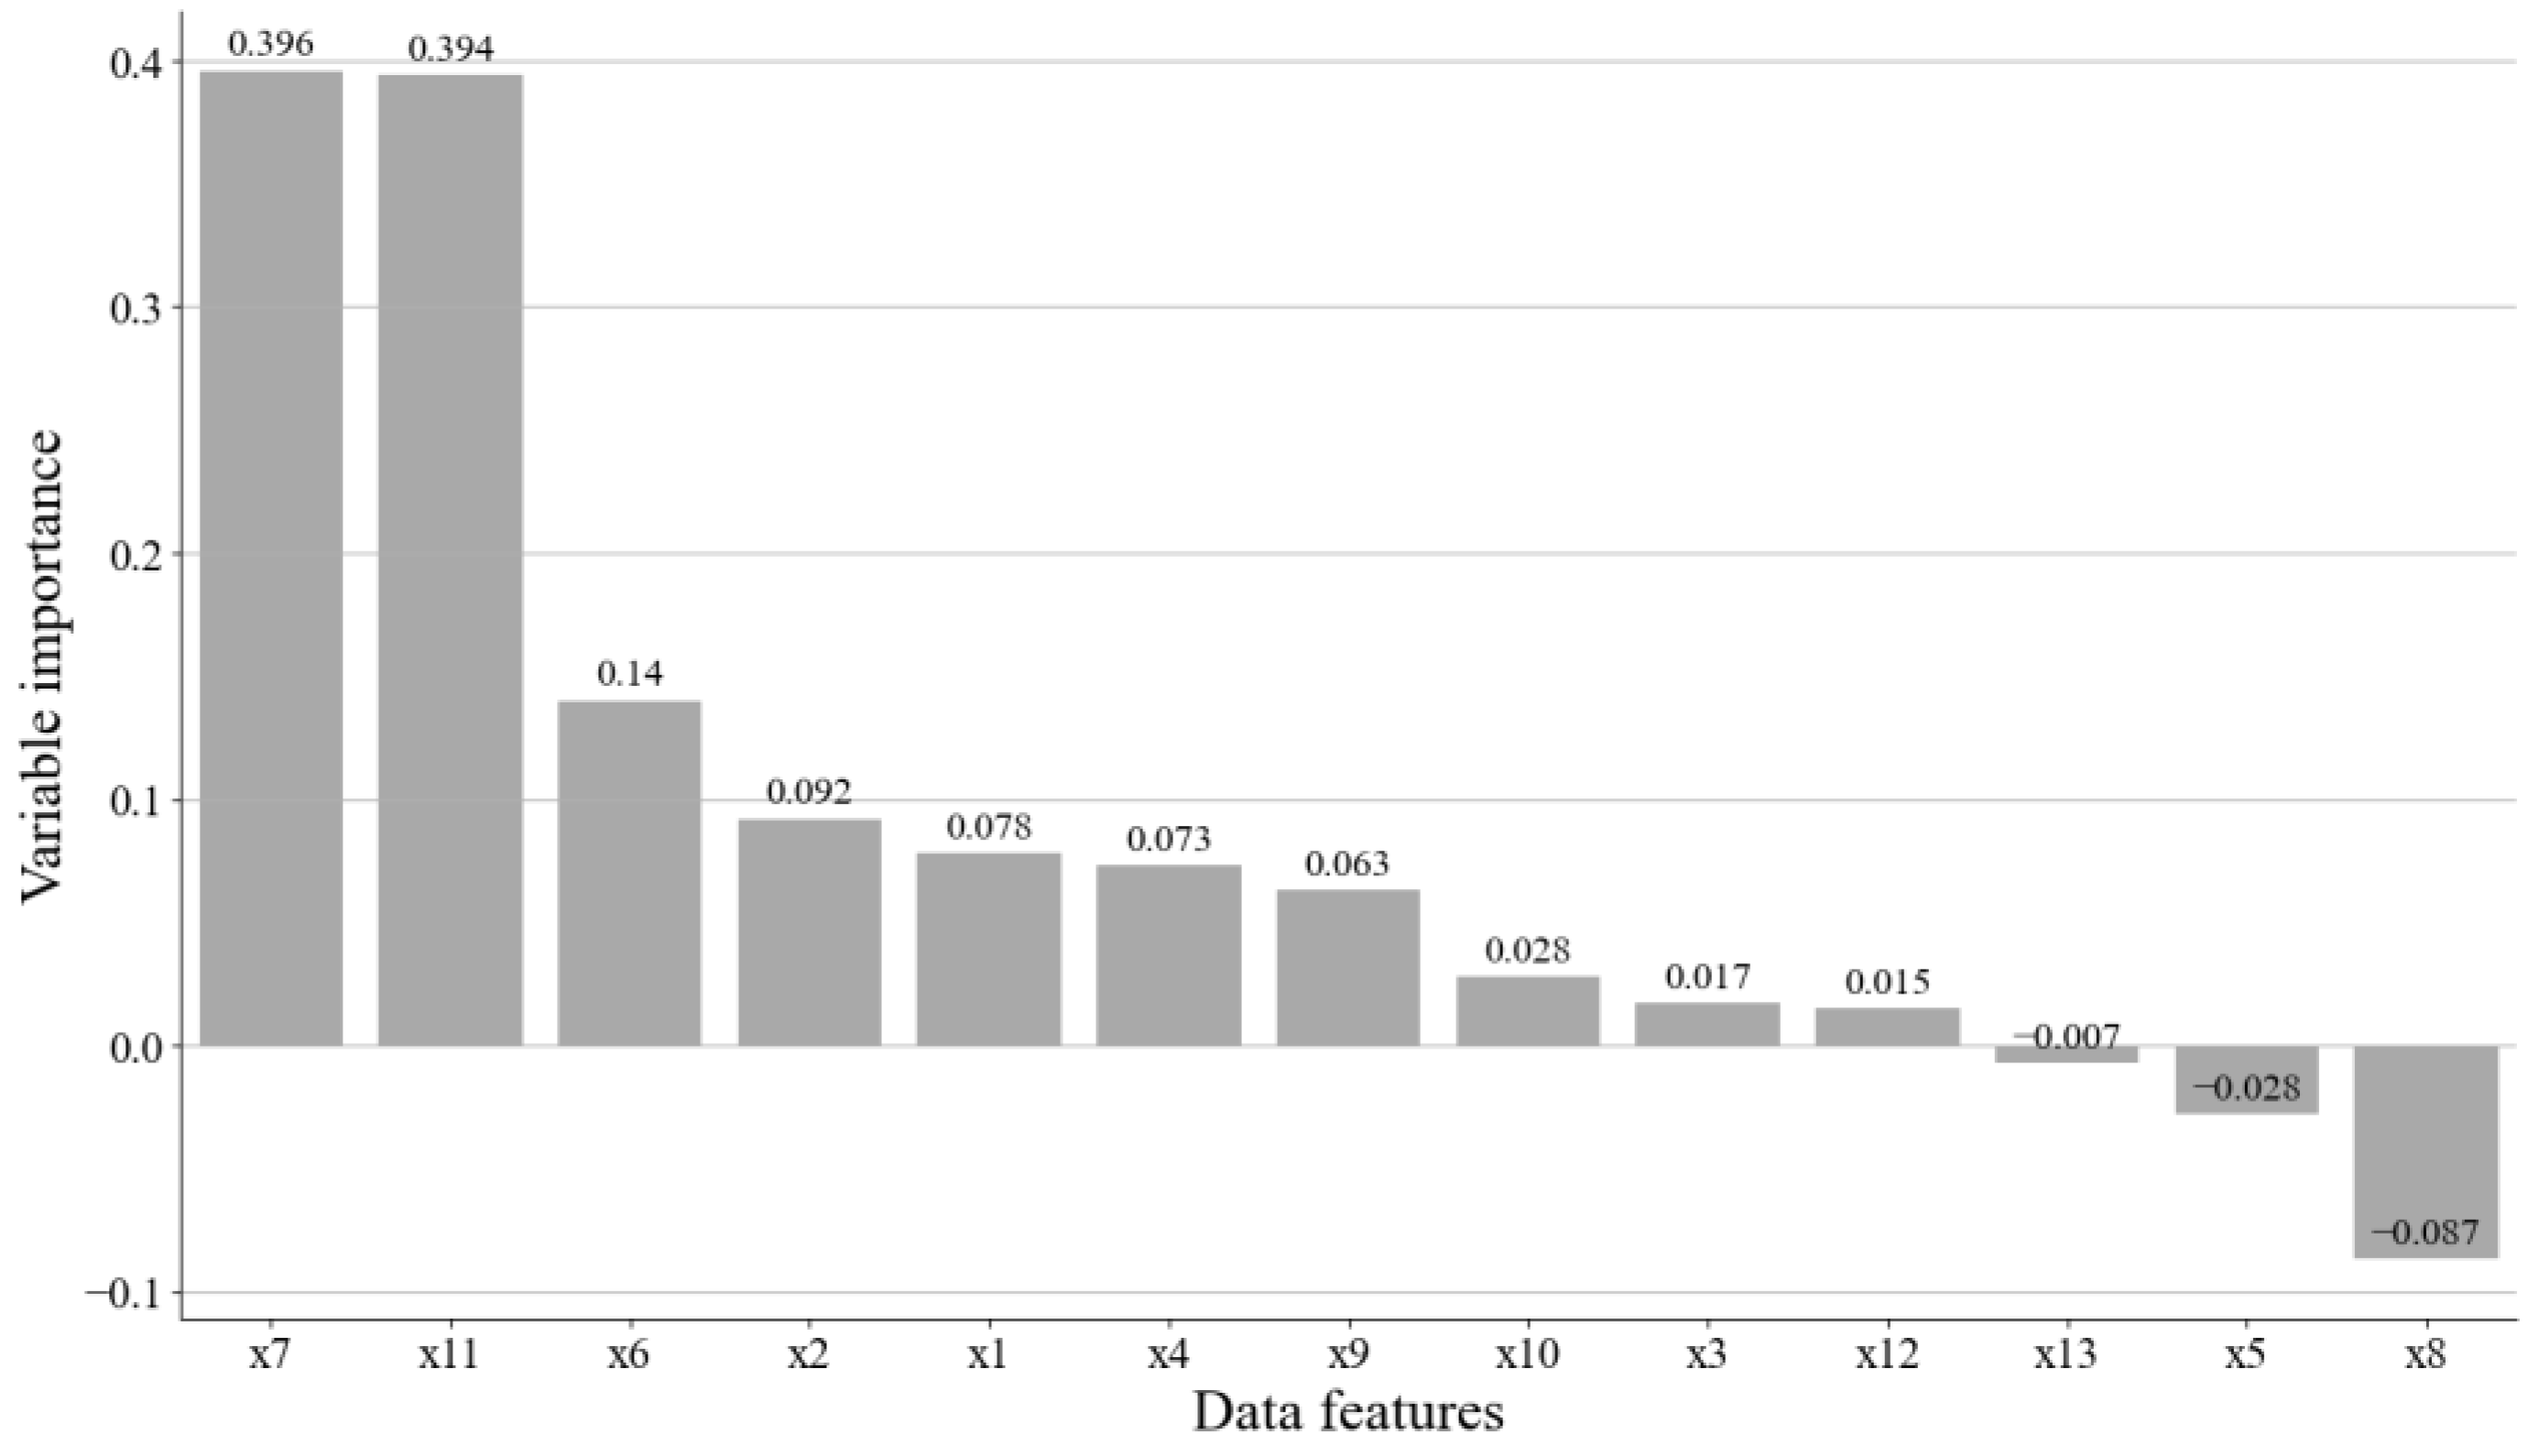
Figure 5 shows that the variable importance of Yunnan CPI (x7) is the highest, followed by Guangdong with the highest temperature (x11), Guangdong CPI (x6), Guizhou power consumption (x2), and Yunnan power consumption (x1). Compared with the previous correlation analysis results (Figure 3), many independent variables with high correlations weakly contribute to predicting the demand or even have a negative impact on the prediction. For example, there is a high correlation between monthly electricity generation and electricity consumption in Guangdong Province (x3), but the variable importance is quite small in the SVR model, which means that these features bring little boost to the SVR forecasting model. In addition, the analysis shows that indicators such as precipitation in the region (x13) can even be ignored in the model, as the variable importance of these features is almost zero.
Based on the variable importance analysis, the electricity generation firms in Guangdong Province are recommended to carefully consider the economic factors when predicting regional electricity demand, especially the linkages among regional economies. In addition, to generate better short-term forecasts, the firms should remain aware of the highest temperatures in the region rather than the lowest. This is largely determined by the location and climate characteristics of Guangdong Province. It is also worth mentioning that the interaction between regional power systems plays an important role in the forecasting. Due to the west-to-east power transmission strategic deployment, the power demand in Guangdong Province is highly related to the power supply in Yunnan Province and Guizhou Province, and thus, the electricity consumption amount in the two provinces is an important indicator of the electricity demand in Guangdong Province.

4.5. Carbon Emissions and A Longer Horizon Forecast

Carbon emissions. Frequently, regional greenhouse gas emissions considerably relate to the production of regional power generation firms, involving carbon dioxide emissions from fossil fuel combustion, carbon dioxide emissions from the desulfurization process of coal-fired power generation, and carbon dioxide emissions from the use of electricity by the firms. In this paper, electricity demand forecasting models are proposed for electric power generation firms to better plan their power production. According to the Accounting Methods and Reporting Guidelines of Greenhouse Gas Emissions of Power Generation Enterprises issued by a national committee in China, carbon dioxide emissions can be estimated as shown below:
W c o 2 = ρ y ^
where W c o 2 is the amount of carbon dioxide emissions, y ^ is the amount of electricity consumption, and ρ is the average emission factor of the regional power grid, which measures the carbon emissions generated in the use of electric power. Note that the above guidelines suggest the value of ρ as 0.5810 t/MWh.
Regarding the case of Guangdong Province, the proposed SVR forecasting model provides better demand forecasts and thus reduces power generation. The estimated savings of power generation are 120,630 MWH between February 2007 and October 2022. That is, 7338 tons of carbon dioxide emissions could be reduced.
Medium- and long-term forecasts. For electricity generation firms, the above short-term monthly power forecasts support effective decisions concerning power generation. In practice, medium-to-long-term electricity demand forecasting is also indispensable. When planning a power system, such as investing in new power generation facilities and infrastructure, decision makers need medium- and long-term electricity demand forecasts. When developing energy policies and emission reduction plans, the government and energy-related institutions also need the corresponding decision-making support.
This paper discusses the fluctuations of medium-to-long-term electricity demand in Guangdong Province and considers the influencing factors in regional economic development (D), international trade (T), regional population (S), and green economy development (G). Accordingly, this paper specifies a list of indicators relative to collecting the yearly data for recent years (Table 6).
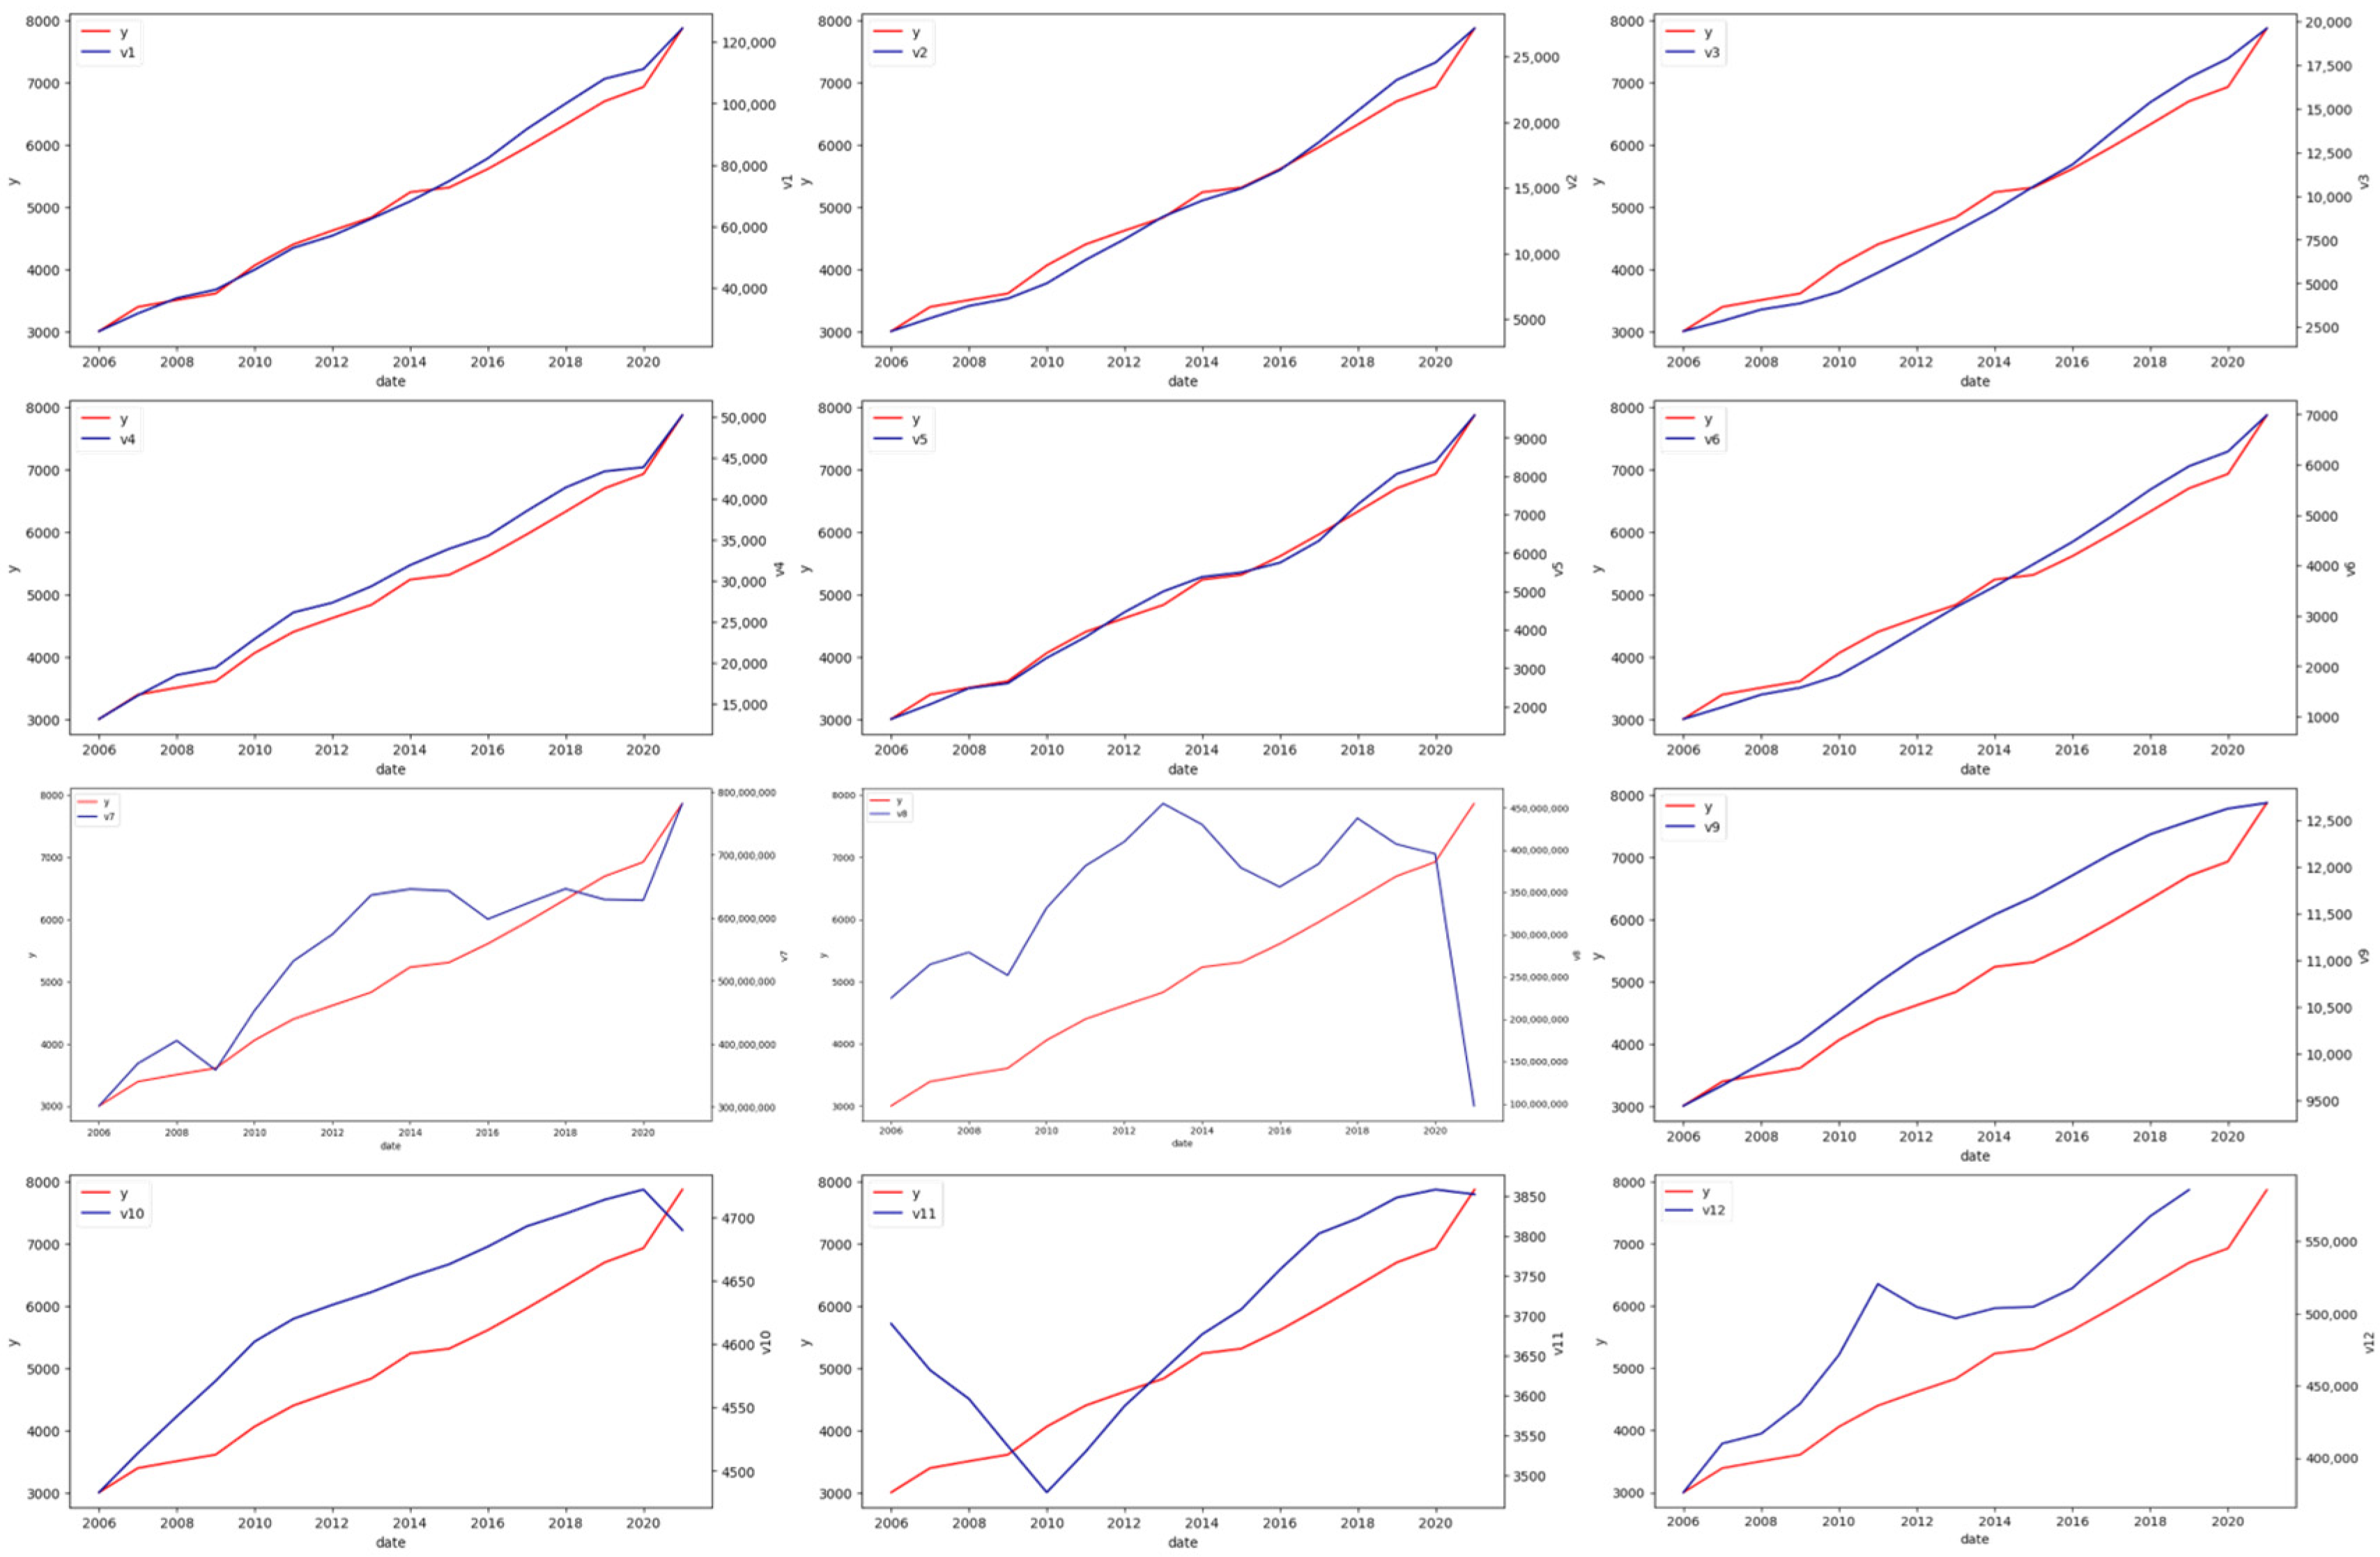
The time-series graphs show that electricity consumption is positively correlated with all the medium-to-long-term variables (Figure 6). Considering the domestic products and services produced and sold in a year (v1), the electricity consumption of Guangdong Province is closely related to the economic activities. When the regional economy is on the rise, the regional demand for electric power will show an upward trend. When economic activities in adjacent areas are frequent and close (v2, v3), the electricity consumption in a region will follow a similar trend to the economic activities in another region. Furthermore, the regional industrial structure also matters when considering the electricity consumption of Guangdong Province. The regional electricity consumption increases as the regional added value of the secondary sector increases (v4, v5, v6).
Moreover, the time-series graphs show that the export level of Guangdong (v7) and electricity consumption have similar trends, while the import volume (v8) has little correlation with consumption. This observation is in line with the fact that Guangdong is a major export trade province, and many productions and services are export-oriented. From the perspective of the social structure, it is evident that a higher population generally leads to a higher electricity consumption in this region (v9, v10, v11).
In addition, we found a positive correlation between electricity consumption in Guangdong and carbon emissions in the region (v12). For a considerable time previously, the regional economy has often adopted an extensive development model. Under these circumstances, the increase in the economic aggregate was often accompanied by a large amount of carbon emissions from factories and enterprises. In 2011, China introduced a series of carbon emission policies. Now, each region has clear carbon emission standards and emission reduction policies, and the effect of carbon emissions on electricity power consumption forecasts will change. Electricity generation firms must consider carbon emissions when making business decisions.

5. Implications and Recommendations

5.1. Major Findings and Managerial Implications

The above case study shows that economic development is the major driver in the growth of regional electricity consumption. Based on historical data from the past decade, there is an obvious positive correlation between the regional economy and the power demand. As the economic situation improves, regional electricity power consumption increases year by year. With the relaxation of domestic epidemic prevention and control, China’s economic activities in various regions will resume steadily. Correspondingly, the electricity consumption in Guangdong Province will show a slow growth trend along with China’s economic recovery.
In addition, the impact of weather changes on the electricity demand is mainly reflected in temperature changes. The periodic change in electricity consumption is basically consistent with the trend of temperature change in Guangdong Province. Temperature changes affect residents’ consumption of electric power. When the summer exceeds 26 degrees Celsius, the commercial and residential electricity consumption and load will show a significant upward trend. Furthermore, temperature changes will indirectly affect industrial and agricultural electricity consumption by affecting the demand for certain products.
Linkages among the regional economies also affect regional electricity power consumption. The study shows that Guangdong’s electricity consumption maintains a relatively consistent fluctuation trend with the electricity consumption and generation of Yunnan and Guizhou provinces. This finding is largely due to the strategic deployment of the west-to-east electricity transmission.
It is notable that there is a correlation between regional electricity consumption and carbon emissions. China is moving toward energy saving, emission reduction, and a low-carbon economy. At the micro level, under the requirements of environmental protection, energy saving, and low-carbon production, enterprises will deploy production energy-saving technologies and upgrade the equipment to reduce electricity consumption and carbon emissions. At the macro level, the regional industrial structure will face upgrading and adjustment, and the inefficient and highly polluting industries will be transformed or eliminated. Thus, the regional electricity consumption will tend to decrease. Emerging industries, such as the clean energy industry, new energy automobile industry, and electronic information industry, will increase. When electricity generation firms need to predict the medium- and long-term electricity demand, they can use such indicators as carbon emission quotas or carbon emission intensity to estimate the status of development of the green economy.

5.2. Practical Recommendations

Electricity demand forecasting is important to the construction of the smart grid. The accurate prediction of electricity consumption is beneficial to electricity generation firms for fulfilling their supply responsibilities. It is also closely related to the production efficiency of power plants. Based on our research findings, electricity generation firms are strongly recommended to develop and adopt a multi-factor forecasting method.
In particular, the new forecasting method must capture the periodicity of power loads. Note that in the real world, the load may fluctuate on a daily, weekly, monthly, and yearly basis, with larger cycles nested in smaller ones. Moreover, the method must consider a variety of influencing factors, such as socio-economic development, industrialization, industrial structure, population, and weather variability. Valid indicators must be specified based on the characteristics of the region in terms of the society, economy, and climate. Furthermore, the forecasting method must incorporate the effects of related national and regional policies, such as the strategic deployment of the west-to-east electricity transmission in this study.
As a reminder to the practitioners, the new forecasting method may not work in all scenarios and forever. In practice, electricity generation firms should establish effective working mechanisms for performing valid demand forecasts and periodically reviewing and refining the forecasting method. Such professionals as data engineers and data analysts with industry knowledge background are needed.

6. Concluding Remarks

This study is motivated by the real-life case of Guangdong Province, China, where electricity generation firms must cater for the regional electricity demand while balancing the social benefits with their own cost effectiveness. In this paper, we studied the electricity demand forecasting problem, considering both the common influencing factors and regionally specific predictor variables. The development of an applicable demand forecasting method is proposed using a research framework introducing three plausible forecasting models. Based on interviews with the practitioners and the review of the literature, this paper then identifies the key influencing factors. Using the collected data of Guangdong Province, we examine the plausible models and establish that the SVR-based model has the best predictive capability among the three models.
Furthermore, we examined the quantitative correlation between the prediction variables in the short term, using machine-learning techniques, and extended the discussion to the medium- and long-term scenarios. Regarding the case of Guangdong Province, the factors influencing the short-term and long-term power consumption variations may vary. The SVR-based analysis shows that the linkages between regional economies are the most important contributor to fluctuations in the short-term demand. For example, Yunnan CPI comes with the highest variable importance for predicting Guangdong electricity consumption. Temperature, the regionally specific weather factor, is the second contributor, while interaction within the regional power systems is the third contributor. The electricity fluctuations generally exhibit a certain periodicity, and the strategic deployment of the west-to-east power transmission considerably affects the regional electricity consumption.
The analysis also shows that in the long term, the trend of electricity consumption is in line with the socio-economic development in the region. Furthermore, the consumption is related to regional economic activities and the industrial structure. It is worth noting that China’s carbon neutrality and carbon emissions policies will lead to industrial upgrading and restructuring, thereby affecting regional electricity demand.
This study proposes an SVR-based electricity demand forecasting method and contributes to exploring the factors influencing regional electricity demand using practical data. Compared with the SVR-based forecasting literature (e.g., Mei et al. [38]; VanDeventer et al. [42]; Waheed et al. [16]), this paper newly incorporates the key factors influencing the power systems and economic development. One extension of this study would be to incorporate other machine-learning techniques to empower the forecasting framework. It is important to balance predictive accuracy, computational complexity, and practical applicability while considering data availability. One direction for future research is to accumulate sufficient relevant industrial data and further quantify the impact of low-carbon economic development on the demand for regional electricity.

Author Contributions

Conceptualization, G.C. and J.W.; Methodology, G.C. and Y.Z.; Software, Y.Z.; Validation, Y.Z.; Investigation, G.C., X.W. and Y.Z.; Resources, J.W. and X.W.; Data curation, Q.H., X.W. and Y.Z.; Writing—original draft preparation, G.C. and Y.Z.; Writing—review and editing, G.C., Q.H. and Y.Z.; Visualization, Y.Z.; Supervision, G.C. and J.W.; Project administration, Q.H. and X.W.; Funding acquisition, J.W. All authors have read and agreed to the published version of the manuscript.

Funding

This research was funded by the National Natural Science Foundation of China, grant number 72171240, and the Humanities and Social Sciences Research Projects of the Ministry of Education of China, grant number 19YJA630006.

Institutional Review Board Statement

Not applicable.

Informed Consent Statement

Not applicable.

Data Availability Statement

Not applicable.

Acknowledgments

We would like to thank Dapeng Zheng for his technical support in the research.

Conflicts of Interest

The authors declare no conflict of interest.

References

  1. Dougherty, S.M. Investigation of Network Performance Prediction Literature Review (Technical Note 394); Institute for Transport Studies, University of Leeds: Leeds, UK, 1996. [Google Scholar]
  2. Bunn, D.; Farmer, E.D. Comparative Models for Electrical Load Forecasting; Wiley: Hoboken, NJ, USA, 1985. [Google Scholar]
  3. Chen, J.F.; Wang, W.M.; Huang, C.M. Analysis of an adaptive time-series autoregressive moving-average (ARMA) model for short-term load forecasting. Electr. Power Syst. Res. 1995, 34, 187–196. [Google Scholar] [CrossRef]
  4. Hsu, C.C.; Chen, C.Y. Regional load forecasting in Taiwan—Applications of artificial neural networks. Energy Convers. Manag. 2003, 44, 1941–1949. [Google Scholar] [CrossRef] [Green Version]
  5. Niu, D.; Wang, Y.; Wu, D.D. Power load forecasting using support vector machine and ant colony optimization. Expert Syst. Appl. 2010, 37, 2531–2539. [Google Scholar] [CrossRef]
  6. Granger, C.W.J. Combining forecasts-twenty years later. J. Forecast. 1989, 3, 167–173. [Google Scholar] [CrossRef]
  7. Uri, N.D. A note on energy demand estimation. Int. J. Energy Res. 1993, 3, 747–758. [Google Scholar] [CrossRef]
  8. Edwards, D.J.; Holt, G.D.; Harris, F.C. A comparative analysis between the multilayer perceptron “neural network” and multiple regression analysis for predicting construction plant maintenance costs. J. Qual. Maint. Eng. 2000, 6, 45–61. [Google Scholar] [CrossRef]
  9. Mohamed, Z.; Bodger, P. Forecasting electricity consumption in New Zealand using economic and demographic variables. Energy 2005, 30, 1833–1843. [Google Scholar] [CrossRef] [Green Version]
  10. Lord, D. Modeling motor vehicle crashes using Poisson-gamma models: Examining the effects of low sample mean values and small sample size on the estimation of the fixed dispersion parameter. Accid. Anal. Prev. 2006, 38, 751–766. [Google Scholar] [CrossRef]
  11. Aishwarya, S.; Balasubramanian, M. A comparative study on regression model and artificial neural network for the prediction of wall temperature in a building. J. Eng. Res. 2022, 10, 1–13. [Google Scholar]
  12. Nti, I.K.; Teimeh, M.; Nyarko-Boateng, O.; Adekoya, A.F. Electricity load forecasting: A systematic review. J. Electr. Syst. Inf. Technol. 2020, 7, 13. [Google Scholar] [CrossRef]
  13. Hu, Z.; Ma, J.; Yang, L.; Li, X.; Pang, M. Decomposition-Based Dynamic Adaptive Combination Forecasting for Monthly Electricity Demand. Sustainability 2019, 11, 1272. [Google Scholar] [CrossRef] [Green Version]
  14. Ul Islam, B.; Ahmed, S.F. Short-Term Electrical Load Demand Forecasting Based on LSTM and RNN Deep Neural Networks. Math. Probl. Eng. 2022, 2022, 2316474. [Google Scholar] [CrossRef]
  15. Dimd, B.D.; Voller, S.; Cali, U.; Midtgard, O. A Review of Machine Learning-Based Photovoltaic Output Power Forecasting: Nordic Context. IEEE Access 2022, 10, 26404–26425. [Google Scholar] [CrossRef]
  16. Waheed, W.; Xu, Q. Optimal Short Term Power Load Forecasting Algorithm by Using Improved Artificial Intelligence Technique. In Proceedings of the 2020 2nd International Conference on Computer and Information Sciences (ICCIS) 2020, Sakaka, Saudi Arabia, 13–15 October 2020; pp. 1–4. [Google Scholar]
  17. Shi, J.; Li, C.; Yan, X. Artificial intelligence for load forecasting: A stacking learning approach based on ensemble diversity regularization. Energy 2023, 262, 125295. [Google Scholar] [CrossRef]
  18. Al-Musaylh, M.S.; Deo, R.C.; Adarnowski, J.F.; Li, Y. Short-term electricity demand forecasting with MARS, SVR and ARIMA models using aggregated demand data in Queensland, Australia. Adv. Eng. Inform. 2018, 35, 1–16. [Google Scholar] [CrossRef]
  19. AL-Musaylh, M.S.; Deo, R.C.; Li, Y.; Adamowski, J.F. Two-phase particle swarm optimized-support vector regression hybrid model integrated with improved empirical mode decomposition with adaptive noise for multiple-horizon electricity demand forecasting. Appl. Energy 2018, 217, 422–439. [Google Scholar] [CrossRef]
  20. Dong, Y.; Zhang, Z.; Hong, W. A Hybrid Seasonal Mechanism with a Chaotic Cuckoo Search Algorithm with a Support Vector Regression Model for Electric Load Forecasting. Energies 2018, 11, 1009. [Google Scholar] [CrossRef] [Green Version]
  21. Zhang, Z.; Hong, W.; Li, J. Electric Load Forecasting by Hybrid Self-Recurrent Support Vector Regression Model with Variational Mode Decomposition and Improved Cuckoo Search Algorithm. IEEE Access 2020, 8, 14642–14658. [Google Scholar] [CrossRef]
  22. Son, H.; Kim, C. Forecasting Short-term Electricity Demand in Residential Sector Based on Support Vector Regression and Fuzzy-rough Feature Selection with Particle Swarm Optimization. Procedia Eng. 2015, 118, 1162–1168. [Google Scholar]
  23. Lusis, P.; Khalilpour, K.R.; Andrew, L.; Liebman, A. Short-term residential load forecasting: Impact of calendar effects and forecast granularity. Appl. Energy 2017, 205, 654–669. [Google Scholar] [CrossRef]
  24. Tian, S.; Zhou, Q.; Cheng, H.; Liu, L.; Lu, L.; Jiang, L. Application of pigeon-inspired optimization algorithm based SVM in total power demand forecasting. Electr. Power Autom. Equip. 2020, 40, 173–179. [Google Scholar]
  25. Kenneth, B. Economic Development and End-Use Energy Demand. Energy J. 2001, 22, 2–5. [Google Scholar]
  26. Cheung, Y.K.; Thomson, E. Electricity Consumption and Economic Growth in China: A Cointegration Analysis. Pac. Asian J. Energy 2001, 2, 99–102. [Google Scholar]
  27. Costantini, V.; Martini, C. The causality between energy consumption and economic growth: A multi-sectoral analysis using non-stationary cointegrated panel data. Energy Econ. 2010, 32, 591–603. [Google Scholar] [CrossRef] [Green Version]
  28. Jovanovic, S.; Savic, S.; Bojic, M.; Djordjevic, Z.; Nikolic, D. The impact of the mean daily air temperature change on electricity consumption. Energy 2015, 88, 604–609. [Google Scholar] [CrossRef]
  29. Sheng, P.; He, Y.; Guo, X. The impact of urbanization on energy consumption and efficiency. Energy Environ. 2017, 28, 673–686. [Google Scholar] [CrossRef]
  30. Mir, A.A.; Alghassab, M.; Ullah, K.; Khan, Z.A.; Lu, Y.; Imran, M. A Review of Electricity Demand Forecasting in Low and Middle Income Countries: The Demand Determinants and Horizons. Sustainability 2020, 12, 5931. [Google Scholar] [CrossRef]
  31. Nkengfack, H.; Fotio, H.K. Energy Consumption, Economic Growth and Carbon Emissions: Evidence from the Top Three Emitters in Africa. Mod. Econ. 2019, 10, 52–71. [Google Scholar] [CrossRef] [Green Version]
  32. Alasali, F.; Nusair, K.; Alhmoud, L.; Zarour, E. Impact of the COVID-19 Pandemic on Electricity Demand and Load Forecasting. Sustainability 2021, 13, 1435. [Google Scholar] [CrossRef]
  33. Doveh, E.; Feigin, P.; Greig, D.; Hyams, L. Experience with FNN models for medium term power demand predictions. IEEE Trans. Power Syst 1999, 14, 538–546. [Google Scholar] [CrossRef]
  34. Kandil, M.S.; El-Debeiky, S.M.; Hasanien, N.E. Long-term load forecasting for fast developing utility using a knowledge-based expert system. IEEE Trans. Power Syst. 2002, 17, 491–496. [Google Scholar] [CrossRef]
  35. Daneshi, H.; Shahidehpour, M.; Choobbari, A.L. Long-term load forecasting in electricity market. In Proceedings of the 2008 IEEE International Conference on Electro/Information Technology, Ames, IA, USA, 18–20 May 2008; pp. 395–400. [Google Scholar]
  36. Zhang, Z.; Ye, S. Long term load forecasting and recommendations for china based on support vector regression. In Proceedings of the 2011 Fourth International Conference on Information Management, Innovation Management and Industrial Engineering (ICIII 2011), Shenzhen, China, 26–27 November 2011; pp. 597–602. [Google Scholar]
  37. Guan, C.; Luh, P.B.; Michel, L.D.; Wang, Y.; Friedland, P.B. Very Short-Term Load Forecasting: Wavelet Neural Networks with Data Pre-Filtering. IEEE Trans. Power Syst. 2013, 28, 30–41. [Google Scholar] [CrossRef]
  38. Mei, F.; Pan, Y.; Zhu, K.; Zheng, J. A Hybrid Online Forecasting Model for Ultrashort-Term Photovoltaic Power Generation. Sustainability 2018, 10, 820. [Google Scholar] [CrossRef] [Green Version]
  39. Bae, K.Y.; Jang, H.S.; Jung, B.C.; Sung, D.K. Effect of Prediction Error of Machine Learning Schemes on Photovoltaic Power Trading Based on Energy Storage Systems. Energies 2019, 12, 1249. [Google Scholar] [CrossRef] [Green Version]
  40. Nespoli, A.; Ogliari, E.; Leva, S.; Pavan, A.M.; Mellit, A.; Lughi, V.; Dolara, A. Day-Ahead Photovoltaic Forecasting: A Comparison of the Most Effective Techniques. Energies 2019, 12, 1621. [Google Scholar] [CrossRef] [Green Version]
  41. Zhou, H.; Zhang, Y.; Yang, L.; Liu, Q.; Yan, K.; Du, Y. Short-term photovoltaic power forecasting based on long short-term memory neural network and attention mechanism. IEEE Access 2019, 7, 78063–78074. [Google Scholar] [CrossRef]
  42. VanDeventer, W.; Jamei, E.; Thirunavukkarasu, G.S.; Seyedmahmoudian, M.; Soon, T.K.; Horan, B.; Mekhilef, S.; Stojcevski, A. Short-term PV power forecasting using hybrid GASVM technique. Renew. Energy 2019, 140, 367–379. [Google Scholar] [CrossRef]
  43. Maitanova, N.; Telle, J.; Hanke, B.; Grottke, M.; Schmidt, T.; von Maydell, K.; Agert, C. A Machine Learning Approach to Low-Cost Photovoltaic Power Prediction Based on Publicly Available Weather Reports. Energies 2020, 13, 735. [Google Scholar] [CrossRef] [Green Version]
  44. Wang, F.; Xuan, Z.; Zhen, Z.; Li, K.; Wang, T.; Shi, M. A day-ahead PV power forecasting method based on LSTM-RNN model and time correlation modification under partial daily pattern prediction framework. Energy Convers. Manag. 2020, 212, 112766. [Google Scholar] [CrossRef]
  45. Eom, H.; Son, Y.; Choi, S. Feature-selective ensemble learning-based long-term regional PV generation forecasting. IEEE Access 2020, 8, 54620–54630. [Google Scholar] [CrossRef]
  46. Rana, M.; Rahman, A. Multiple steps ahead solar photovoltaic power forecasting based on univariate machine learning models and data re-sampling. Sustain. Energy Grids 2020, 21, 100286. [Google Scholar] [CrossRef]
  47. Zang, H.; Cheng, L.; Ding, T.; Cheung, K.W.; Wei, Z.; Sun, G. Day-ahead photovoltaic power forecasting approach based on deep convolutional neural networks and meta learning. Int. J. Electr. Power 2020, 118, 105790. [Google Scholar] [CrossRef]
  48. Bendaoud, N.M.M.; Farah, N.; Ben Ahmed, S. Applying load profiles propagation to machine learning based electrical energy forecasting. Electr. Power Syst. Res. 2022, 203, 107635. [Google Scholar] [CrossRef]
  49. Yildiz, B.; Bilbao, J.I.; Sproul, A.B. A review and analysis of regression and machine learning models on commercial building electricity load forecasting. Renew. Sustain. Energy Rev. 2017, 73, 1104–1122. [Google Scholar] [CrossRef]
  50. Pearson, K. Breakthroughs in Statistics; Springer: New York, NY, USA, 1992. [Google Scholar]
  51. Willmott, C.J. Some Comments on the Evaluation of Model Performance. Bull. Am. Meteorol. Soc. 1982, 63, 1309–1313. [Google Scholar] [CrossRef]
  52. Willmott, C.J. On the validation of models. Phys. Geogr. 1981, 2, 184–194. [Google Scholar] [CrossRef]
  53. Chai, T.; Draxler, R.R. Root mean square error (RMSE) or mean absolute error (MAE)?—Arguments against avoiding RMSE in the literature. Geosci. Model. Dev. 2014, 7, 1247–1250. [Google Scholar] [CrossRef] [Green Version]
  54. Krause, P.; Boyle, D.P.; Baese, F.; Krause, P.; Bongartz, K.; Fluegel, W.A. Comparison of different efficiency criteria for hydrological model assessment. Adv. Geosci. 2005, 5, 89–97. [Google Scholar] [CrossRef] [Green Version]
  55. Vapnik, V. The Nature of Statistical Learning Theory; Springer: Berlin/Heidelberg, Germany, 1995. [Google Scholar]
  56. Awad, M.; Khanna, R. Efficient Learning Machines: Theories, Concepts, and Applications for Engineers and System Designers; Springer: Berlin/Heidelberg, Germany, 2015. [Google Scholar]
  57. Breiman, L. Random Forests. Mach. Learn. 2001, 45, 5–32. [Google Scholar] [CrossRef] [Green Version]
  58. Raschka, S.; Mirjalili, V. Python Machine Learning: Machine Learning and Deep Learning with Python, Scikit-Learn, and TensorFlow; Packt Publishing Ltd.: Birmingham, UK, 2017. [Google Scholar]
  59. Cortes, C.; Vapnik, V. Support-vector networks. Mach. Learn. 1995, 20, 273–297. [Google Scholar] [CrossRef]
  60. Craven, M.W.; Shavlik, J.W. Extracting Thee-Structured Representations of Thained Networks. Adv. Neural Inf. Process. Syst. 1996, 8, 24–30. [Google Scholar]
  61. Lundberg, S.M.; Lee, S. A Unified Approach to Interpreting Model Predictions. In Proceedings of the Advances in Neural Information Processing Systems 30 (NIPS 2017), Long Beach, CA, USA, 4–9 December 2017. [Google Scholar]
  62. Hong, T.; Fan, S. Probabilistic electric load forecasting: A tutorial review. Int. J. Forecast. 2016, 32, 914–938. [Google Scholar] [CrossRef]
  63. Hong, T.; Pinson, P.; Fan, S.; Zareipour, H.; Troccoli, A.; Hyndman, R.J. Probabilistic energy forecasting: Global Energy Forecasting Competition 2014 and beyond. Int. J. Forecast. 2016, 32, 896–913. [Google Scholar] [CrossRef] [Green Version]
  64. Kang, J.; Reiner, D.M. What is the effect of weather on household electricity consumptions? Empirical evidence from Ireland. Energy Econ. 2022, 111, 106023. [Google Scholar] [CrossRef]
  65. Liu, Y.; Wang, W.; Ghadimi, N. Electricity load forecasting by an improved forecast engine for building level consumers. Energy 2017, 135, 18–30. [Google Scholar] [CrossRef]
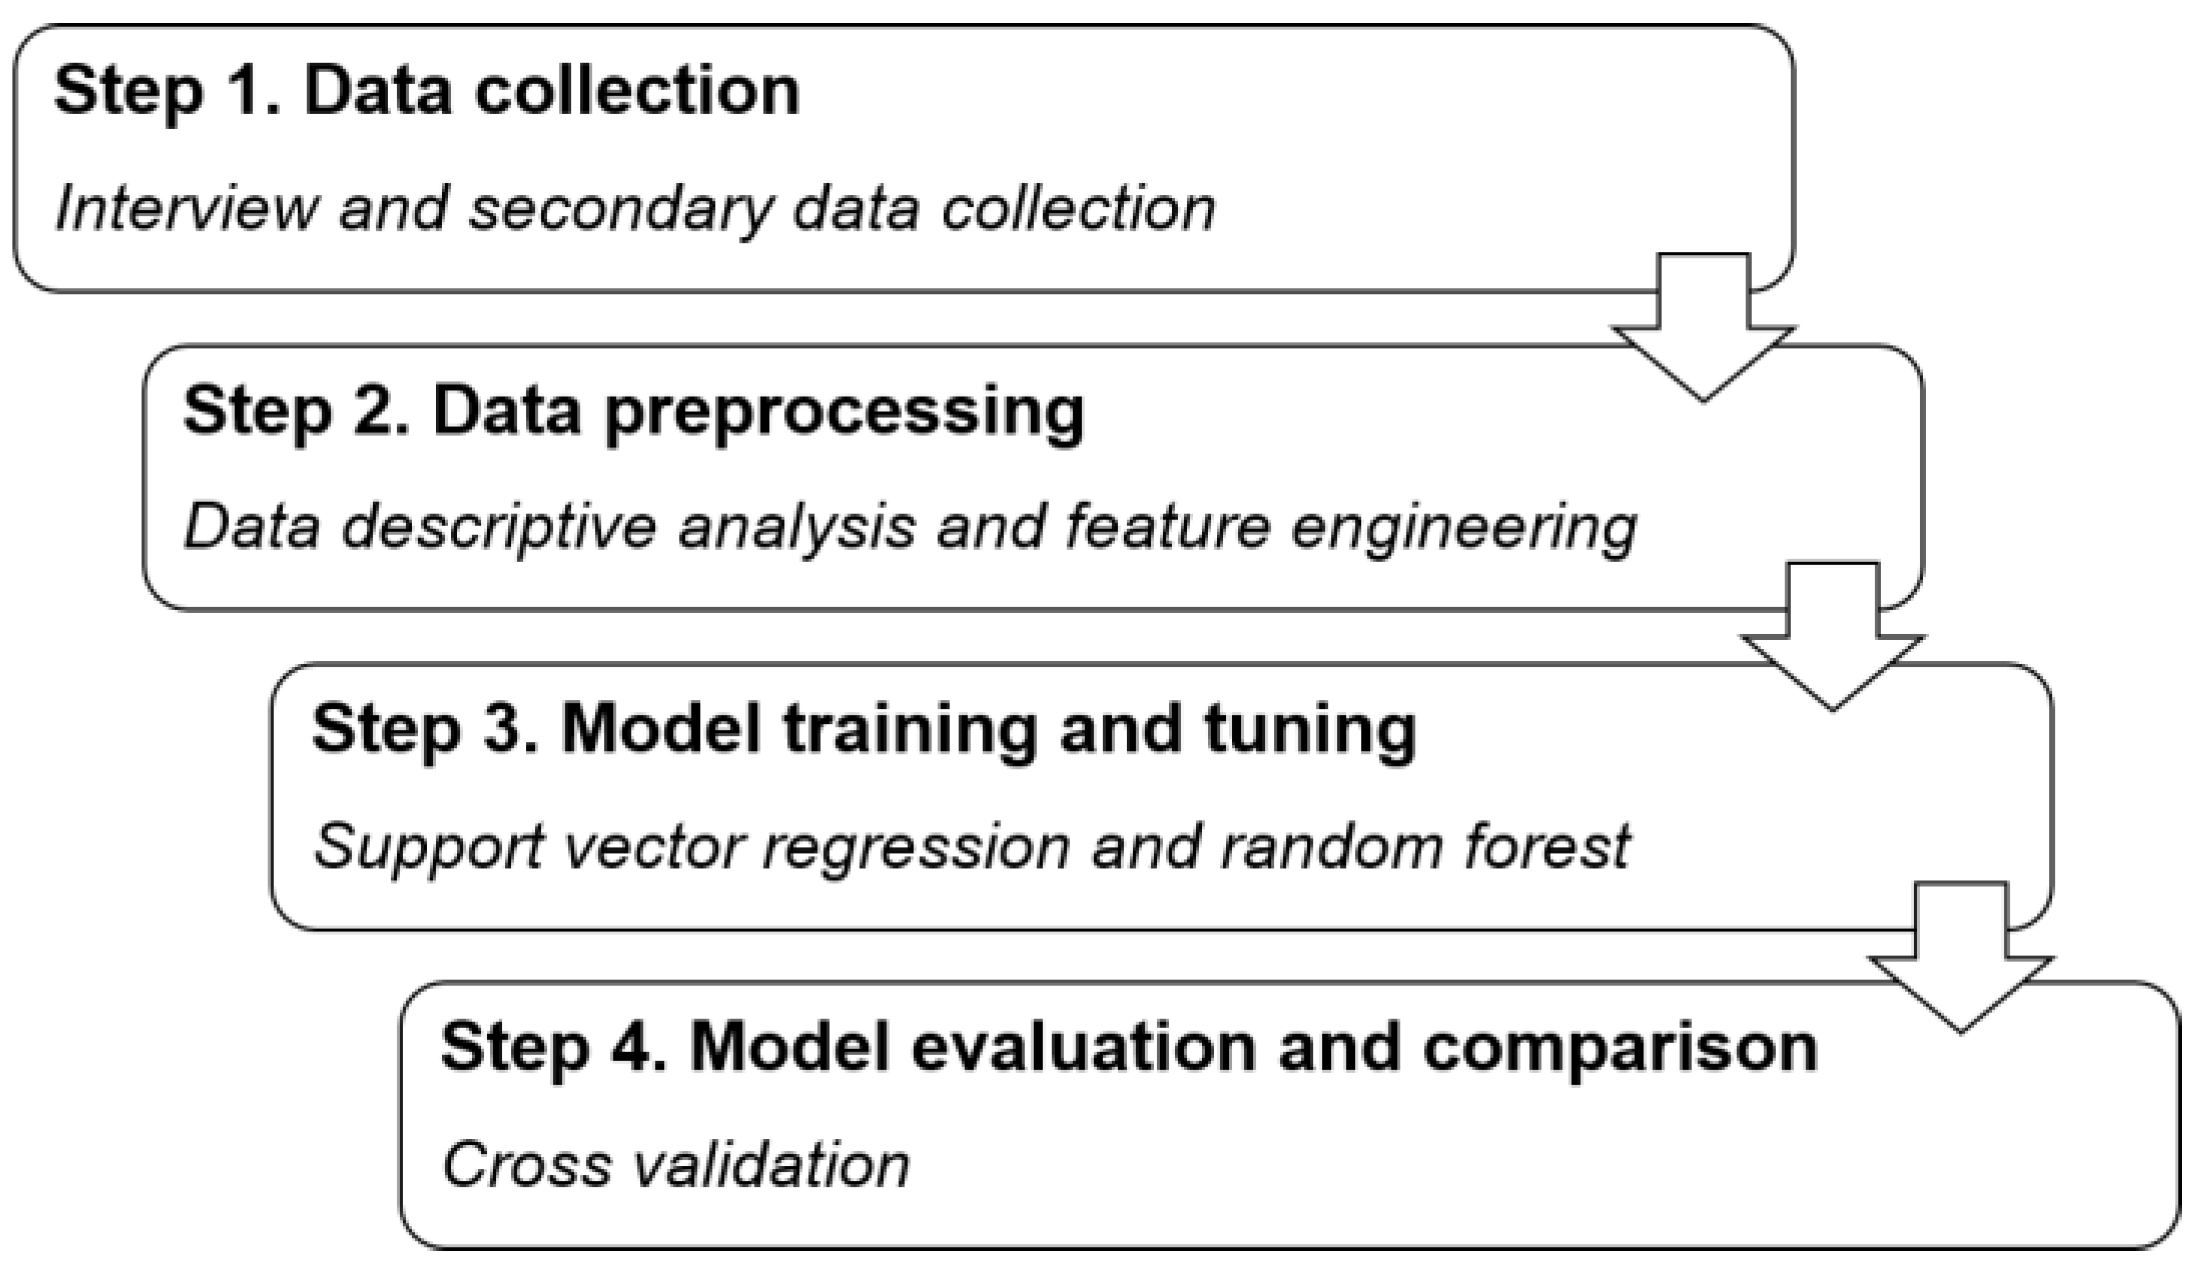
Figure 1. The research framework for the power demand forecasting study.
Sustainability 15 11299 g001
Figure 2. Time-series graphs of monthly variables.
Sustainability 15 11299 g002
Figure 3. A heat map of monthly variables.
Sustainability 15 11299 g003
Figure 4. Comparison charts of the prediction results.
Sustainability 15 11299 g004
Figure 5. Variable importance in the SVR model.
Sustainability 15 11299 g005
Figure 6. Time-series graphs of yearly variables.
Sustainability 15 11299 g006
Table 1. A summary of power demand forecasting literature.
LiteratureMethodsInfluencing Factors
Power
System
EconomyWeatherSociety
Total LoadPeak LoadGDPGrowth RateIndustrial StructureOthersTemperatureOthersPopulationOthers
Granger [6]wavelet transform
Uri [7]terminal energy analysis
Doveh et al. [33]wavelet transform
Cheung and Thomson [26]statistical analysis
Kenneth [25]statistical analysis
Kandil et al. [34]expert system
Mohamed and Bodger [9]statistical analysis
Daneshi et al. [35]statistical analysis
Costantini and Martini [27]statistical analysis
Zhang and Ye [36]artificial neural network
Guan et al. [37]wavelet neural network
Jovanovic [28]statistical analysis
Mei et al. [38]support vector machine and autoregressive integrated moving average
Hu et al. [13]ensemble learning
Bae et al. [39]artificial neural network and support vector machine
Nespoli et al. [40]artificial neural network
Zhou et al. [41]ensemble learning
William et al. [42]support vector machine and genetic algorithm
Maitanova et al. [43]long short-term memory
Wang et al. [44]long short-term memory and recurrent neural network
Eom et al. [45]ensemble learning
Rana and Rahman [46]univariate machine-learning models
Zang et al. [47]convolutional neural networks
Waheed et al. [16]support vector regression
Alasali et al. [32]statistical analysis
Ahmed et al. [14]artificial neural network
Bendaoud et al. [48]load profiles and random forest
Shi et al. [17]ensemble learning
This manuscriptsupport vector regression and random forest
Table 2. Factors and indicators for short-term forecasting.
FactorsIndicatorsExplanations
Power   consumption   U
x1
Yunnan power consumption
Monthly power consumption amount in a region.
x2
Guizhou power consumption
Power   generation   P
x3
Guangdong power generation
Monthly power generation amount in a region.
x4
Yunnan power generation
x5
Guizhou power generation
Regional   economy   E
x6
Guangdong CPI
Monthly CPI in a region.
x7
Yunnan CPI
x8
Guizhou CPI
Regional   weather   W
x9
Guangdong average temperature
Monthly measures of regional weather variations.
x10
Guangdong lowest temperature
x11
Guangdong highest temperature
x12
Guangdong average wind speed
x13
Guangdong total precipitation
Table 3. Parameter setting of the SVR model.
ParameterExplanationThe Set Value
kernelThe kernel function in SVR “linear”
tolThe training threshold of the error term 0.001
CThe penalty factor for the error term1.0
epsilon ε   for balancing model accuracy and complexity0.1
max_iterMaximum number of iterations; −1 means no limit−1
Table 4. Parameter setting of the random forest model.
ParameterExplanationThe Set Value
n_estimatorsNumber of decision trees in the forest43
max_featuresNumber of features in a randomly selected tree model13
max_depthMaximum depth of the treeNone
min_samples_splitMinimum number of samples for node segmentation1.0
bootstrapBootstrap modeTrue
Table 5. Accuracy statistics of the models.
ModelMSEMAE E n s   E l m  
Year-over-year forecasting0.0310.155−0.4900.843
Linear regression0.0160.0980.2440.909
SVR0.0080.0610.6080.944
Random forest regression0.0090.0680.5670.924
Table 6. Yearly data definitions and explanations.
FactorsIndicatorsExplanations
Economic development D
v1
Guangdong GDP
Yearly indicators of regional economic development.
Compared with the primary sector and the tertiary sector, the secondary sector contributes the most to the economy of Guangdong Province.
v2
Yunnan GDP
v3
Guizhou GDP
v4
Guangdong added value of secondary sector
v5
Yunnan added value of secondary sector
v6
Guizhou added value of secondary sector
International trade T
v7
Guangdong export volume
Guangdong Province is China’s largest foreign trade province.
v8
Guangdong import volume
Social structure S
v9
Guangdong population
Yearly indicators of the regional population.
v10
Yunnan population
v11
Guizhou population
Green economy G
v12
Guangdong carbon emissions
The amount of greenhouse gas emissions each year.
Disclaimer/Publisher’s Note: The statements, opinions and data contained in all publications are solely those of the individual author(s) and contributor(s) and not of MDPI and/or the editor(s). MDPI and/or the editor(s) disclaim responsibility for any injury to people or property resulting from any ideas, methods, instructions or products referred to in the content.