1. Introduction
With the acceleration of global warming, the risk of extreme weather events is further exacerbated. Global attention is primarily on the fight against global warming and the reduction of carbon emissions. The Paris Agreement proposed the goals of controlling the global temperature rise within 2 °C and striving to limit the temperature rise to 1.5 °C by the end of the 21st century when compared to the pre-industrialization period. This means more than one third of global carbon emissions will be subject to tougher climate commitments in the future. China, the biggest emitter and greatest developing nation in the world, has pledged to achieve carbon peak by 2030 and carbon neutrality by 2060. However, compared to other economies, China’s emission reduction is much larger, which places on them significant pressure and challenge.
Carbon neutrality is when global anthropogenic carbon dioxide emissions and carbon dioxide removal (CDR) reach a balance in a certain period [
1], that is, net zero CO
2 emissions. Carbon neutrality attempts to solve the symbiotic contradiction between human society and the ecological environment, which will reshape global production and lifestyle. Currently, scientific and technological innovation has become an important support for nations to achieve carbon neutrality [
2], which includes vigorously promoting clean energy, long-term energy storage, smart grid, and carbon capture utilization and storage (CCUS) technology. Although artificial emission reduction technology has advanced significantly, there are still several practical challenges. By comparison, ecosystems not only have great potential for carbon sequestration but are also more cost-effective and sensitive to greenhouse gas control [
3]. Moreover, they can provide more diversified ecosystem services [
4], which creates fewer barriers to social implementation [
5]. Therefore, achieving carbon neutrality requires coupling development for carbon sink increase and carbon emission reduction [
6]. Some studies believe that after reducing carbon emissions by 70% through energy transformation, the remaining part concentrated in the industrial sectors that cannot achieve decarbonization will be offset by natural carbon sinks and negative emission technologies [
7]. Therefore, natural ecosystems are irreplaceable in carbon neutrality, which should not be underestimated or ignored due to the development of emission reduction technologies.
Ecosystems are the main force behind carbon sinks, and human activities are the main sources of carbon emissions. The research on the two has always been cored in carbon neutrality [
8,
9]. It has made great achievements in the estimation of carbon sinks or the sequestration of ecosystems, as well as the measurement and prediction of carbon emissions. However, it is rare to compare the roles of ecosystem carbon sinks and anthropogenic carbon emissions under the same carbon sector in the same emission reduction system. What kind of emission reduction potential or contribution do they have? What kind of bridging effect do they have? And what kind of emission reduction responsibilities can they assume? These problems need to be solved and reasonably arranged in the process of achieving carbon neutrality, because this not only affects how to formulate the next round of emission reduction plans, but also determines the carbon mechanism of ecology–society symbiosis work in the future. This is a topic that deserves to be pondered under the pressure of “3060”, which is also discussed in this paper.
Chongqing, as China’s strategic reserve of freshwater resources, the national important biological gene pool and the Yangtze River ecological risk prevention barrier, has significant ecosystem service value. But it still has perennial water and soil problems in the drawdown zone. This symbiosis and competition state of the social–ecological system offers adequate support for research on the carbon relationship between the ecosystem and the human system. In consequence, taking Chongqing as an example, this paper explores the bridging effect and the carbon-neutral contribution of terrestrial ecosystem carbon sinks and anthropogenic carbon emissions.
Firstly, the study calculates terrestrial ecosystem carbon sinks and anthropogenic carbon emissions to compare their contribution and efficacy in the carbon cycle system. Secondly, the emission reduction effect in 2030 and 2060 are explored through scenario assumptions to provide strong path support for achieving carbon neutrality.
The remainder of the paper is structured as follows.
Section 2 presents the literature review.
Section 3 refers to the materials and methods.
Section 4 shows the key findings.
Section 5 describes the scenario assumptions, and
Section 6 presents conclusions and provides policy implications.
2. Literature Review
The combination of natural factors and human activities affects the carbon cycles [
10]. The previous research on terrestrial ecosystem carbon sinks and anthropogenic carbon emissions concentrated more on the fundamental work of estimating carbon sinks and emissions. With the gradual deepening of low carbon, many researchers have conducted in-depth verification of the role in carbon neutrality and whether carbon neutrality can be achieved as scheduled.
Scholars carried out detailed research on carbon sinks and carbon emissions, which also laid a foundation for the subsequent prediction. On the one hand, the research on terrestrial ecosystems mainly focused on their intensity, distribution, change, and mechanism [
11]. Many researchers assessed the carbon density and carbon storage of forest ecosystems [
12], cropland ecosystems [
13], grassland ecosystems [
14], and wetland ecosystems [
15]. Moreover, fire [
16], climate change [
17], nitrogen deposition [
18], CO
2 fertilization [
19], land use [
20] and ecological restoration [
21] are major ecological mechanisms that influence the carbon budget of the terrestrial ecosystem. Piao et al. [
22] proposed that the effect of CO
2 fertilization on enhancing the terrestrial carbon sink will diminish with the slowing down of CO
2 growth. Although this indicates that the carbon sinks induced by the ecosystem will decrease after entering the maturity stage, the terrestrial ecosystem is still the main force in the process of carbon neutrality.
On the other hand, much literature calculated and predicted carbon emissions in different space-time dimensions. Zhao and Huang [
23] calculated carbon emission by energy consumption and analyzed the carbon footprint of land use types. Yang et al. [
24] explored the CO
2 emission reduction potentials from urban construction land. Hong et al. [
25] presented that land use emissions were about 25 percent of total anthropogenic GHG emissions. Furthermore, many researchers also compare carbon emissions with carbon sinks. Piao et al. [
26] estimated that China’s terrestrial ecosystems absorbed 28–37 percent of the cumulated fossil carbon emissions, of which forest vegetation absorbed 22.14% [
27]. Li et al. [
10] found that radiative forcing caused by CO
2 absorption in China’s terrestrial ecosystem accounted for 20.27% of the warming effect in 2015. Keenan and Williams [
28] also indicated that terrestrial carbon sinks can remove 33.7% of anthropogenic emissions, but this value was slightly different from 45% from Wang [
20]. However, they all revealed the huge carbon sink function of China’s terrestrial ecosystem. Keenan [
29] even found that during the recent global warming slowdown, the continued enhancement of the terrestrial carbon sinks led to a pause in CO
2 growth rate and a decline in the proportion of residual anthropogenic emissions in the atmosphere.
With the globalization of carbon neutrality, researchers have shifted attention from the prediction of carbon emissions [
30] to the verification of whether and how carbon peak [
31] and carbon neutrality can be achieved on schedule [
32,
33]. It is generally believed that the carbon peak can be achieved on schedule or even ahead of schedule [
34], but carbon neutrality requires more effort from human society because it is affected by the scale effect, structure effect, technology effect, and factor substitution effect [
35]. Li et al. [
10] concluded that the energy consumption in 2030 should be limited to the peak of six billion tons of coal equivalent, and the post-peak emission reduction rate should be 8% per year. However, it is unlikely to achieve carbon neutrality by 2060 without CCUS [
32]. Fang et al. [
36] also reached a similar conclusion that China’s total greenhouse gas emissions will still be about 3.74 billion tons in 2060, requiring forestry carbon sinks and negative emission technology to achieve neutrality. And negative emission technology will be effective only on the premise of achieving rapid and deep emission reduction [
37].
In conclusion, a significant number of studies have been done on terrestrial ecosystem carbon sinks and anthropogenic carbon emissions. Ecosystems and human social systems are usually regarded as independent systems to conduct separate carbon function research. However, in the process of integrated emission reduction, we need to identify and compare the two under the same carbon sector in the same emission reduction system. This is conducive to further deepening their emission reduction responsibilities, division of labor, and layout strategies for carbon neutrality. These discussions are not adequately and systematically elaborated on by the current research. Therefore, the paper tries to recognize the roles of terrestrial ecosystem carbon sinks and anthropogenic carbon emissions in the emission reduction system, so as to reasonably arrange their division of labor in promoting carbon neutrality.
3. Materials and Methods
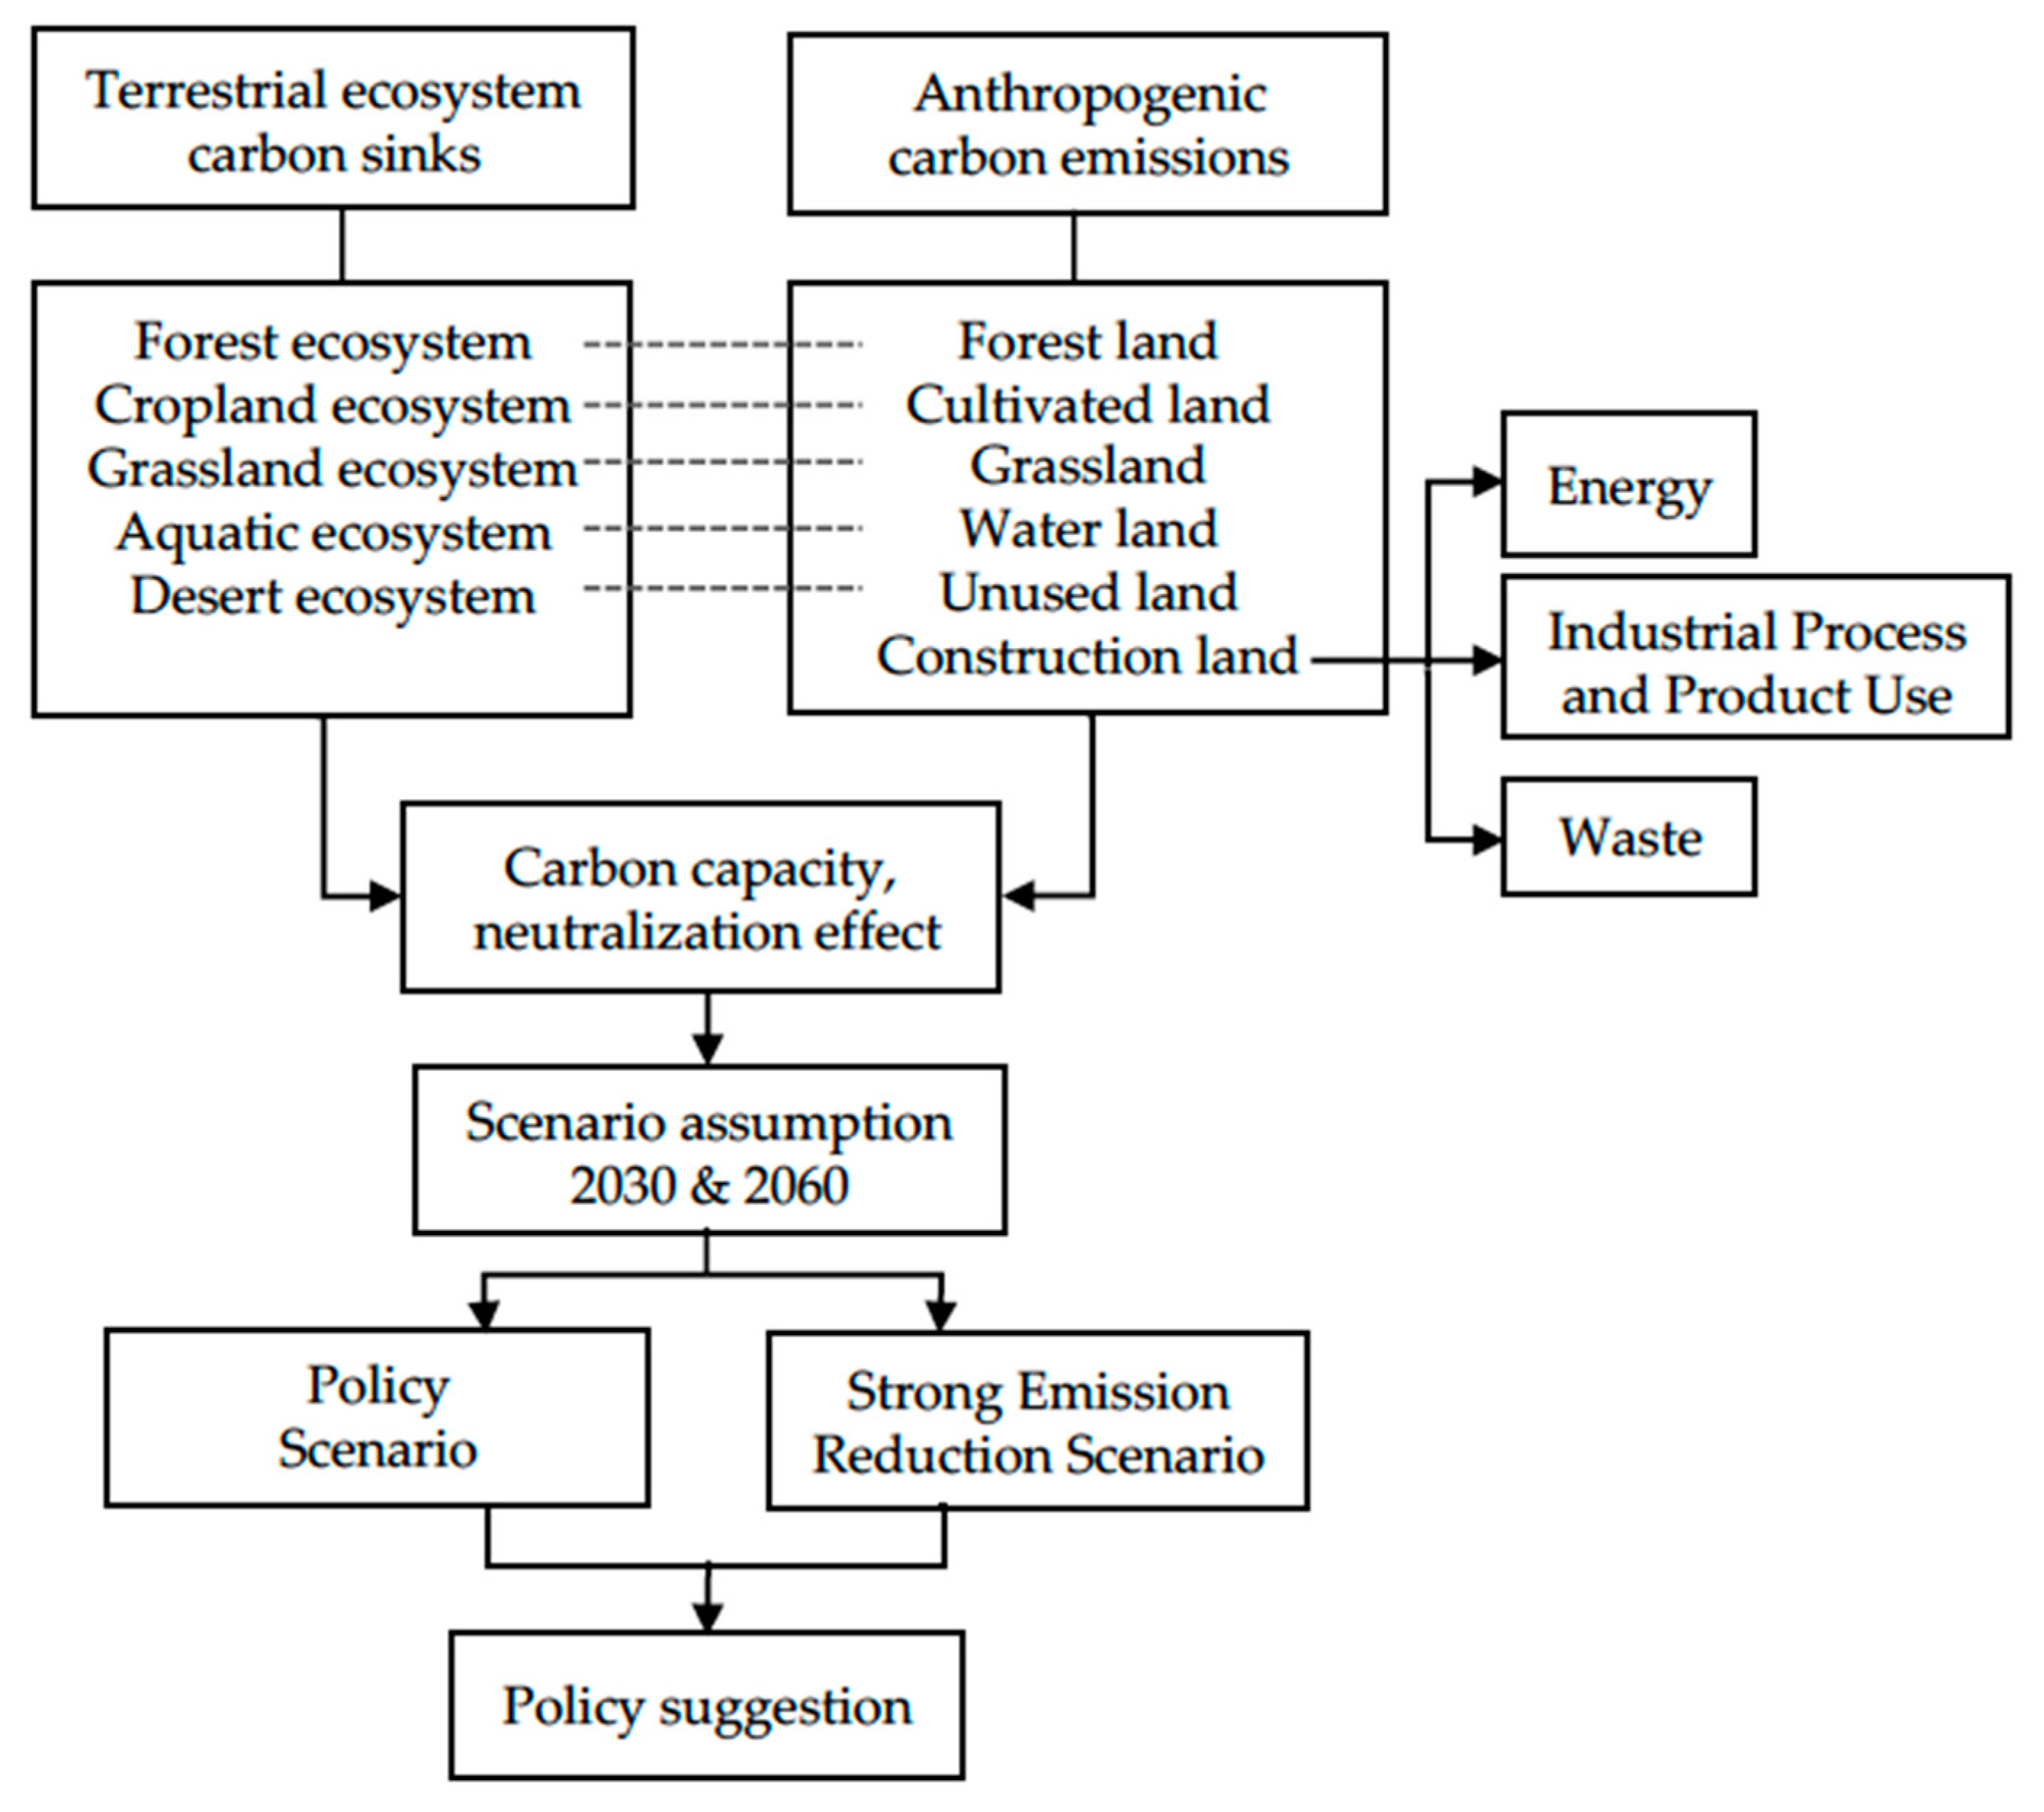
This paper is designed to better understand the roles of ecosystem carbon sinks and anthropogenic carbon emissions under the same carbon sector in the same emission reduction system. Thus, the paper firstly compares the terrestrial ecosystem carbon sinks and anthropogenic carbon emissions by correlation coefficient. Secondly, due to the consideration of carbon neutrality, the scenario assumption is used to assess the contribution of these two paths to emission reduction in 2030 and 2060. Finally, according to the estimation results and scenario simulation, the paper formulates the implementation schemes and policy objectives to realize carbon neutrality. The study is supported by data from Chongqing from 2013 to 2018. The research process is depicted in
Figure 1.
Moreover, the study is supported by data from Chongqing from 2013 to 2018 because Chongqing started the pilot project of controlling greenhouse gas emissions in 2012. Chongqing was facing the severe situation of high energy consumption, tighter constraints on resources and environment, and weak scientific and technological innovation capacity. However, to solve these problems, the government made drastic reforms, which actively formulated detailed low-carbon indicators and decomposed action plans. Finally, Chongqing achieved gratifying results. This typical case is suitable and sufficient to support our carbon research.
3.1. Calculation of Terrestrial Ecosystem Carbon Sinks
The terrestrial ecosystem carbon sinks refer to the ability to remove CO
2 from the atmosphere of vegetation, soil, and water, which depends on their organic carbon density. Researchers have obtained the reference values of carbon sinks of ecosystems based on carbon density. The paper calculates the total carbon sinks by referring to the carbon sink coefficients studied in previous literature (
Table 1) and the area of ecosystems, and the formula is shown in Equation (1).
refers to the terrestrial ecosystem carbon sinks represents terrestrial ecosystems, specifically the forest ecosystem, cropland ecosystem, grassland ecosystem, freshwater ecosystem, and desert ecosystems. is the area of terrestrial ecosystem (hm2), and the data is from the results of the third land and resources survey of Chongqing. is the carbon sink coefficient of terrestrial ecosystem (t/hm2).
3.2. Calculation of Anthropogenic Carbon Emissions
Land use change has a significant role in the global carbon cycle and climate change [
42], which can not only change the surface carbon process, but also affect the energy consumption intensity [
43]. Therefore, this study uses land use types to calculate carbon emissions. We have determined six land use types: forest land, cultivated land, grassland, water area, unused land, and construction land. For the first five land use types (FCGWU for short), the carbon emission coefficient with mature research can be used directly to calculate carbon emissions. In contrast, there is inconsistency in the carbon emission accounting standards of construction land. This paper follows the division principle of IPCC carbon sectors, and regards the carbon emission of Energy, Industrial Process, and Product Use and Waste as the carbon emissions of construction land.
3.2.1. Carbon Emissions from FCGWU
Based on previous research on carbon emission parameters of land types [
38], carbon emissions from FCGWU can be calculated by the carbon emission coefficient and land area (Equation (2)).
where
refers to carbon emissions from forest land, cultivated land, grassland, water area, and unused land (
).
is the area of land use type
(hm
2).
is the carbon emission coefficient of land use type
(t/hm
2), which is presented in detail in
Table 1.
3.2.2. Carbon Emissions from Construction Land
As stated above, the carbon source of construction land includes three components: Energy, Industrial Process, and Product Use (IPPU) and Waste. The carbon emissions from construction land are the sum of the three (energy-related emissions, industry-related emissions, and waste-related emissions). Because there are numerous subdivided carbon sources in every sector, for the calculation feasibility and data acquisition, this paper selects several key carbon sources for calculation.
- (1)
Carbon emissions from Energy
The nine energy sources most commonly used in reality are selected, which are coal, coke, gasoline, kerosene, diesel, fuel oil, liquefied petroleum gas, natural gas, and electricity. According to the IPCC, the energy-related emissions are calculated by various energy consumptions (
tons of standard coal) multiplied by the carbon emission coefficients (Equation (3)).
where
refers to the energy-related emissions.
is the consumption of energy
(t), and data is from the Statistical Yearbook of Chongqing.
is the standard coal conversion coefficient of energy
(t C/t), which is obtained according to the China Energy Statistical Yearbook.
is the
tons of standard coal consumption of energy
.
is the carbon emission coefficient of energy
(t/t C), which is from IPCC (2006).
Table 2 shows the coefficient details.
- (2)
Carbon emissions from Industrial Process and Product Use
The paper selects three major categories for calculation: cement production, glass production, and steel and metallurgical coke production. Among them, steel and metallurgical coke production are divided into three parts: metallurgical coke, crude steel, and pig iron. The consumption data is collected from the Statistical Yearbook of Chongqing. The basic formula is seen in Equation (4).
where
is the industry-related emissions.
is the consumption of production
(t).
is the default CO
2 emission coefficient (t CO
2/t), which is from IPCC (2006) (
Table 3). Lastly, 12/44 is the conversion coefficient from CO
2 to C (12/44).
- (3)
Carbon emissions from Waste
Waste consists of two parts: solid waste and wastewater. Due to the different disposal methods, solid waste is divided into waste incineration and waste landfill. According to IPCC, the carbon emissions calculation from Waste is as follows.
the carbon emissions from waste incineration, which is the product of waste incineration disposal volume (), the CO2 emission coefficient (0.99945 t CO2/t), carbon content of solid waste (45%), and CO2 conversion coefficient (12/44). represents the carbon emissions from waste landfill, which is the product of waste landfill disposal volume (), CH4 emission coefficient (0.617 t CH4/t), water content of solid waste (28.5%), and CH4 conversion coefficient (12/16). refers to the carbon emissions from wastewater, which is the result of the chemical oxygen demand of wastewater () multiplied by the CH4 emission coefficient (0.25 t CH4/t) and CH4 conversion coefficient (12/16). The values of the three wastes are respectively from the Urban and Rural Construction Statistical Yearbook of Chongqing, the Municipal Solid Waste Pollution Prevention and Control Information of Chongqing, and the Annual Report on Environmental Statistics of Chongqing.
4. Results and Discussion
4.1. Terrestrial Ecosystem Carbon Sinks
In recent years, Chongqing’s terrestrial ecosystem carbon sinks have been increasing, reaching 237.05 × 10
4 t in 2018 (
Table 4). Forest ecosystems accounted for 84.83% of total carbon sinks, which was the largest carbon pool. Cropland ecosystems ranked second with 13%, followed by freshwater ecosystems, grassland ecosystems, and desert ecosystems, with 1.39%, 0.69%, and 0.09%. If we want to achieve carbon neutrality, we must fully recognize the crucial role played by the forest ecosystem in natural carbon sinks. We still need to extend the duration of forest ecosystem carbon sinks by sticking to ecological projects such as afforestation and ecological renovation.
In these six years, only forest ecosystems and freshwater ecosystems have maintained the increase of carbon sinks, and the growth rate of the latter was significantly higher than that of the former. This reflects that Chongqing benefits from being close to the Three Gorges Reservoir Area. It also has great potential for water ecosystem carbon sink capacity in the future. Due to the decline in area, carbon sinks of desert ecosystems were weakening at the fastest rate, followed by cropland and grassland.
The expansion of urban production and living land has squeezed the ecological land, compressing the carbon sink space and making it fragmented and marginalized. As the largest carbon sink, the ecosystem should strengthen the systematic governance of “mountains, rivers, forests, fields, lakes, grass and sand”, and especially concentrate on the forest carbon sinks. Moreover, carbon sinks can be regarded as a kind of scarce property rights, ecological products, and emerging industries. Thus, we can add carbon sinks by establishing the carbon trading mechanism.
4.2. Anthropogenic Carbon Emissions
The carbon emissions of Chongqing have fluctuated upward from 2013 to 2018, and the total emissions ranged between 65 and 70 million tons (
Table 5). Construction land had the most carbon emissions, making up 96.6% of the total and rising 5.19% from 2013 to 2018. This demonstrates that the carbon emissions of construction land are not only dominant, but also being further consolidated and strengthened. In addition, the carbon emissions of cultivated land, forest land, water area, and grassland accounted for 2.9%, 0.3%, 0.12%, and 0.11% of the total, respectively. Unused land had no carbon emissions in theory. Moreover, the carbon emissions of forest land and water area increased and that of cultivated land and grassland decreased.
Figure 2 also illustrates the significant difference in carbon emissions between FCGWU and construction land.
The internal structure of carbon emissions from construction land can better illustrate the core focus of future emission reduction. In 2018, the carbon emissions from fossil energy, electricity, IPPU, solid waste, and wastewater were 4296.27 × 104 t, 1086.84 × 104 t, 1099.33 × 104 t, 149.38 × 10⁴ t, and 4.65 × 10⁴ t, accounting for 64.74%, 16.38%, 16.56%, 2.25%, and 0.07%. Fossil energy was the largest carbon source, followed by IPPU and electricity. By contrast, the carbon emissions generated by other land area changes were dwarfed. Such findings indicate that controlling fossil energy consumption will be the primary task of emission reduction. And they also expose a problem that the secondary industry with manufacturing as the core in Chongqing is still the main force of economic growth. In the future, Chongqing should strengthen the digital, intelligent, and ecological transformation of traditional industries, and finally limit carbon emission intensity through the green economy.
4.3. Effect of Ecosystem Carbon Sinks on Carbon Emission
In
Table 6, the terrestrial ecosystem carbon sinks neutralized 3.45% of carbon emissions, which fluctuated from 2013 to 2018 (
Figure 3). This fluctuation was closely related to the reduction in carbon emissions caused by the construction land area in 2016. However, this trend returned to normal in 2017, and the overall net carbon emissions remained relatively stable.
In the emission reduction system, ecosystem carbon sinks have increased and continuously contributed to carbon emission reduction. But they have not yet been able to halt the significant rise in emissions and bridge the carbon gap. On the contrary, the growth rate of net carbon emissions exceeded that of carbon emissions. The difference between the two growth rates highlights the contradiction between fewer carbon sinks and excessive carbon emissions. The bridging impact of carbon sinks will diminish over time if this condition is not addressed. Therefore, it is impossible to achieve carbon balance only by relying on ecosystems; a significant reduction of anthropogenic carbon sources is inevitable and necessary for carbon neutrality.
The paper mapped the terrestrial ecosystems to the corresponding land types to further refine the carbon budget details in the emission reduction system based on land use type. As a result, we assigned forest ecosystems, cropland ecosystems, grassland ecosystems, and freshwater ecosystems to forest land, cultivated land, grassland, and water area. It is concluded that only forest land had net carbon sinks and kept increasing, reaching 180.99 × 10⁴ t in 2018. In contrast, other land carbon sinks cannot offset their carbon emissions. The net carbon emissions of cultivated land, grassland, and water land fell in turn, reaching 167.83 × 10⁴ t, 6.22 × 10⁴ t, and 5.24 × 10⁴ t in 2018. As for construction land, the net carbon emission was 2 × 10⁴ t more than the total in 2018. This slight difference, when combined with the latter’s ongoing trend of outpacing the former, is enough to indicate a problem. That is, the impact of construction land on the carbon structure of the whole eco-social system is consolidating and intensifying. In other words, human behavior is constantly depleting and weakening the carbon sink externality of ecosystems.
In the future, Chongqing should pay primary attention to the transformation of energy structure and regulate the imbalance of urban carbon metabolism systems caused by unreasonable land use, utilizing fully the critical function of forest ecosystems in releasing oxygen and fixing carbon to promote the carbon peak and carbon neutrality in the upper reaches of the Yangtze River.
5. Scenario Assumption and Discussion
There is an alarming carbon imbalance in Chongqing. We will consider adding carbon sinks and lowering anthropogenic carbon emissions if we wish to realize carbon neutrality. Following this logic, we design six counter-factual scenarios to predict future carbon emissions and seek more reasonable and efficient emission reduction schemes.
5.1. Scenario Setting Principle
We deduce from Formulas (2)–(7) that there are two main factors that control carbon emissions. One is the total amount (the land area and the total consumption), and the other is the emission coefficient. Therefore, we consider and comply with these two grouping criteria when categorizing scenarios. On the assumption of carbon sinks increasing, a scenario of forest change is set, only taking into account the effect of net carbon sinks and the actual situation of land planning. Fossil energy and waste with more remarkable effects and feasible operations are selected as variables in terms of minimizing overall consumption. Regarding the reducing the emission coefficient, the carbon emission coefficients of Energy-related, Industry-related, and Waste-related are used as variables.
Therefore, the six scenarios are: Forest land area increases (S1), Fossil energy consumption reduces (S2), Waste disposal reduces (S3), the Energy-related emission coefficient decreases (S4), the Industry-related emission coefficient decreases (S5), and the Waste-related emission coefficient decreases (S6).
This paper proposes Target 1 and Target 2 for six scenarios in 2030 and 2060, respectively, in line with the global low-carbon target and China’s emission reduction plan. Target 1 is a plan based on the established reality and objectives, which is in line with the standard growth level. And Target 2 appropriately increases the target value based on Target 1, which is a high-level requirement. All growth rate targets designed are based on 2018.
Furthermore, the paper set a series of scenarios to judge the emission reduction effect and explore the most effective carbon neutrality scheme in order to implement and strengthen the nationally determined contributions (NDC) to climate change. Firstly, the paper establishes a “Business As Usual” (BAU) Scenario under unconditional change where the carbon emissions of Chongqing in 2030 and 2060 will be 7452.38 × 104 t and 9151.58 × 104 t. Secondly, the “Policy Scenario” is composed of all Target 1 of the six scenarios, which are driven by established low-carbon policies and objectives. “SER (Strong Emission Reduction) Scenario” is composed of all Target 2, which is the extension of Policy Scenarios.
5.2. Targets Setting
At the UN Climate Ambition Summit in 2020, President Xi of China announced the commitment to increase China’s forest stock by 6 billion cubic meters by 2030 over 2005. Then Chongqing put forward the goal of striving to achieve 57% forest coverage by 2025. Additionally, the Chinese Academy of Social Sciences issued a report, which proposed that China’s forest coverage rate should be increased to more than 30% by 2060. Based on these objectives, we set Chongqing’s forest area growth rate in 2030 at 3% (Target 1) and 5% (Target 2) and set 2060’s targets at 10% (Target 1) and 20% (Target 2).
At the 2020 UN climate ambition summit, China’s major leaders also announced that China’s non-fossil energy would account for about 25% of primary energy consumption by 2030. In 2021, the State Grid Energy Institute released China’s Energy and Power Development Prospects Report, which proposed that the proportion of non-fossil energy would reach 81% in 2060. In this sense, Chongqing’s fossil energy consumption needs to be reduced by 12% (Target 1) and 15% (Target 2) in 2030, and 75% (Target 1) and 85% (Target 2) in 2060.
In 2020, the Chongqing Municipal Bureau of Ecological Environment issued the Chongqing Municipal Solid Waste Treatment and Disposal Plan (2019–2035), which prepared objectives for solid waste treatment and disposal for the coming years. This paper specifies the targets of reducing waste disposal by 65% (Target 1) and 70% (Target 2) in 2030, and 85% (Target 1) and 90% (Target 2) in 2060 following the plan and the actual situation.
Reducing the carbon emission coefficient will benefit from the application of low-carbon technologies, which is aiming to improve production efficiency and resource utilization efficiency, giving play to technology substitution. In this case, the term “carbon emission coefficient” refers to the average value of carbon emission coefficients in a sector, highlighting the decline of carbon emissions per unit. After making a scientific judgment on the technology improvement rate, 5% (Target 1) and 10% (Target 2) in 2030 and 25% (Target 1) and 40% (Target 2) in 2060 are set for the reduction targets of the energy-related emission coefficient (Scenario 4), industry-related emission coefficient (Scenario 5), and waste-related emission coefficient (Scenario 6).
Table 7 shows specific scenarios and target values.
5.3. Scenario Analysis
According to the above scenario planning, the carbon emissions and abatement potential in 2030 and 2060 are calculated (
Table 8). We describe the emission reduction effects of the Policy Scenario and SER Scenario to judge the trend of emission reduction as a whole. Then the emission reduction effects of carbon sinks/sources are thoroughly analyzed. Through two-way comparison, the study further explores carbon reduction schemes and policy options with cost and benefit advantages.
5.3.1. Carbon Emission Reduction Trend
In
Figure 4, the net carbon emission under the BAU Scenario will increase gradually from 2018 to 2060. However, if the Policy Scenario and SER Scenario are realized, the net carbon emissions will be reduced year by year. According to the Policy Scenario, net carbon emissions in 2030 and 2060 will be reduced to 6499.46 × 10
4 t and 4121.24 × 10
4 t, 5.42% and 40.02% less than that in 2018. According to the SER Scenario, net carbon emissions in 2030 and 2060 will be reduced to 6027.43 × 10
4 t and 2670.35 × 10
4 t, down 12.28% and 60.14% compared with 2018. However, the carbon sinks will be reached 261.91 × 10
4 t and 274.77 × 10
4 t in 2030 and 2060 under the BAU Scenario. It can be found that according to the current scenario assumptions, no matter what energy transformation efforts and industrial emission reduction technology, China cannot achieve carbon neutrality in 2060. It still needs ecosystem carbon sinks and carbon capture, utilization, and storage technology to absorb. This is also consistent with the research conclusions of Sun et al. [
32] and Fang et al. [
36].
In 2030, the emission reduction of the two series scenarios will not differ greatly, but the benefits gap will progressively grow over time.
Figure 4 shows that in 2060, the reduction effect of the SER Scenario will be significantly greater than that of the Policy Scenario. Therefore, in the short term, realizing the Policy Scenario can result in satisfactory emission reduction benefits, but in the long term, the accumulation of strong policies will make a qualitative leap in emission reduction effect by 2060.
5.3.2. Emission Reduction Effect of Carbon Sinks/Sources
Figure 5’s obvious changes to the S2 and S4 lines show that the emission reduction benefits brought by reducing energy consumption are the most noticeable and fastest. Moreover, in the comparison of
Figure 5a,b, the change of S4 is the most prominent because the emissions of S4 in 2060 will be lower than that in 2018, which can not be realized by other coefficient changes. This proves that only more sufficient technology and time accumulation can obtain more abundant long-term benefits. Therefore, resolving energy conflicts and promoting the energy structural transformation will bear the brunt of carbon neutrality. Considering the emission reduction goals and the implementation costs, we propose to reduce fossil energy consumption by at least 12% by 2030 and at least 75% by 2060. As for the energy-related carbon coefficient, take 5% as the basic target, the greater the reduction, the better. Such a scheme is relatively conservative and reliable.
S1 and S6 in
Figure 6 show the least pronounced alteration effect. We need to weigh the operating cost and benefit return of these two situations in practice and consider the problems of urban planning and land use balance. Rather than expanding forest area blindly, more sustainable spatial planning is used to stabilize and consolidate ecosystem carbon sinks by orderly controlling the land’s boundary and scale. Therefore, it is appropriate to maintain 3% and 10% forest growth rates by 2030 and 2060. Comparing
Figure 6f with
Figure 6c, the comprehensive effect of waste disposal is relatively weak. Thus, reducing waste disposal by 65% and the waste-related emission coefficient by 5% by 2030 is a better choice. As a crucial part of the circular economy, it is the most urgent and easiest to implement that all resources can be recycled as soon as possible.
In general, the impacts of other sinks/sources pale in comparison to energy’s performance. The effect of forest land change is not particularly prominent, which demonstrates that under the same time conditions, the effect of anthropogenic emission reduction is faster, more immediate, and more significant. Therefore, in the short term, transforming the energy structure is the core of emission reduction. Another point worth mentioning is that before 2030, due to excessive fossil energy consumption, we are allowed to emphasize reducing energy consumption and carbon emission technology. However, with energy consumption falling to the limit saturation, the application of carbon sink technology should be strengthened to add more carbon sinks.
This paper examined and compared the contributions of terrestrial ecosystem sinks and anthropogenic carbon sources to emission reduction. The purpose of carbon neutrality is not only to achieve the carbon balance of anthropogenic carbon sources and sinks, but also to formulate a set of mechanisms that can maintain a sustainable carbon cycle. From the perspective of the complex system, this systematic carbon structure requires full cooperation between the ecosystem and human beings.
Although in terms of data, the increase of terrestrial ecosystem carbon sinks appears to contribute less to emission reduction than expected. However, according to the scenario assumption results, it is challenging to reach carbon neutrality based purely on human emission reduction efforts. We must rely on the ability of ecosystem carbon sinks, which are not only reflected in the change of land area, but will be the application of scientific land management and negative emission technology. At present, the carbon sequestration capacity of China’s terrestrial ecosystem is seriously underestimated [
20]. Through the optimization of land use management, we can make up for approximately 60–70% of carbon loss under the existing meteorological, vegetation, and soil conditions [
44]. Therefore, Chongqing needs to popularize the scientific utilization of cultivated land and speed up the three-water co-governance, adhere to the key ecological projects such as natural forest resource protection, conversion of cropland back to forest and grassland, and shelter forest ecosystem construction.
6. Conclusions
This paper utilized the carbon coefficient method to assess the role of terrestrial ecosystems in the carbon cycle. It focused on calculating and comparing the carbon sinks and anthropogenic carbon emissions in Chongqing from 2013 to 2018, based on the classification of land and carbon sector. Furthermore, to judge whether these two paths can promote carbon neutrality, the scenario assumption was adopted to explore their emission reduction potential and division of labor in 2030 and 2060. Based on these, we proposed a set of emission reduction mechanisms coordinated by the ecosystem and human system. And we draw the following conclusions.
Firstly, Chongqing’s terrestrial ecosystem carbon sinks and anthropogenic carbon emissions have maintained an increase from 2013 to 2018, reaching 237.05 × 10⁴ t and 6871.59 × 104 t in 2018. Terrestrial ecosystem carbon sinks neutralized 3.45% of carbon emissions in 2018, of which forest ecosystems contributed significantly. However, it still cannot bridge the gap with anthropogenic carbon emissions. Additionally, construction land occupied the absolute position in carbon emissions, which is constantly consolidated and deepened. Fossil energy is the main culprit.
Secondly, all schemes in the scenario assumptions have emission reduction effects. However, short-term emission reduction will mostly focus on adjusting the energy structure with very little benefit from expanding forest land or lowering waste disposal. Moreover, China’s carbon neutrality cannot be achieved only by relying on energy transformation and industrial emission reduction technology. It still needs ecosystem carbon sinks and carbon capture, utilization, and storage technology to absorb.
This study puts forward some policy recommendations for reducing carbon emissions and increasing carbon sinks in conjunction with the above conclusions and scenario simulations. Firstly, the government should accelerate the energy structure transformation by replacing fossil energy consumption with clean energy and pollutants recycling, improving energy efficiency, and increasing the electrification rate. These are conducive to rapid emission reduction in the short term, which is the priority for reform. Additionally, we should pay special attention to and expand the carbon sink advantages and capabilities of the terrestrial ecosystem. Secondly, it is difficult to completely decarbonize the energy system in a short time. The government should more actively promote negative emission technologies and scientific management of land to accelerate carbon neutrality in China. The technology can be developed by biological processes, such as afforestation, soil carbon sequestration, biomass energy with carbon capture and storage (BECCS), and ocean fertilization. Additionally, we can continue to rely on chemical means to promote direct air capture (DAC) and accelerate mineralization.
There were still many limitations in this paper, which deserve further research in the future. Firstly, this paper divided the terrestrial ecosystem into five categories and anthropologic land use into six categories. Although we included freshwater ecosystems in the terrestrial ecosystem, many terrestrial ecosystems, marine ecosystems, and land types still were not excluded. Future research can establish a more detailed classification system of ecosystems and human systems to make a more complete comparison of the carbon relationship between the two. Secondly, the paper adopted a conceptual value for technological progress in scenario assumptions, which cannot fully represent the growth rate and application of various technologies. Future research can further refine the popularization scale, application prospect, and implementation mechanism of various technologies under carbon neutrality requirements.


