
Identification and Factor Analysis of Traffic Conflicts in the Merge Area of Freeway Work Zone

Abstract
:1. Introduction
2. Data
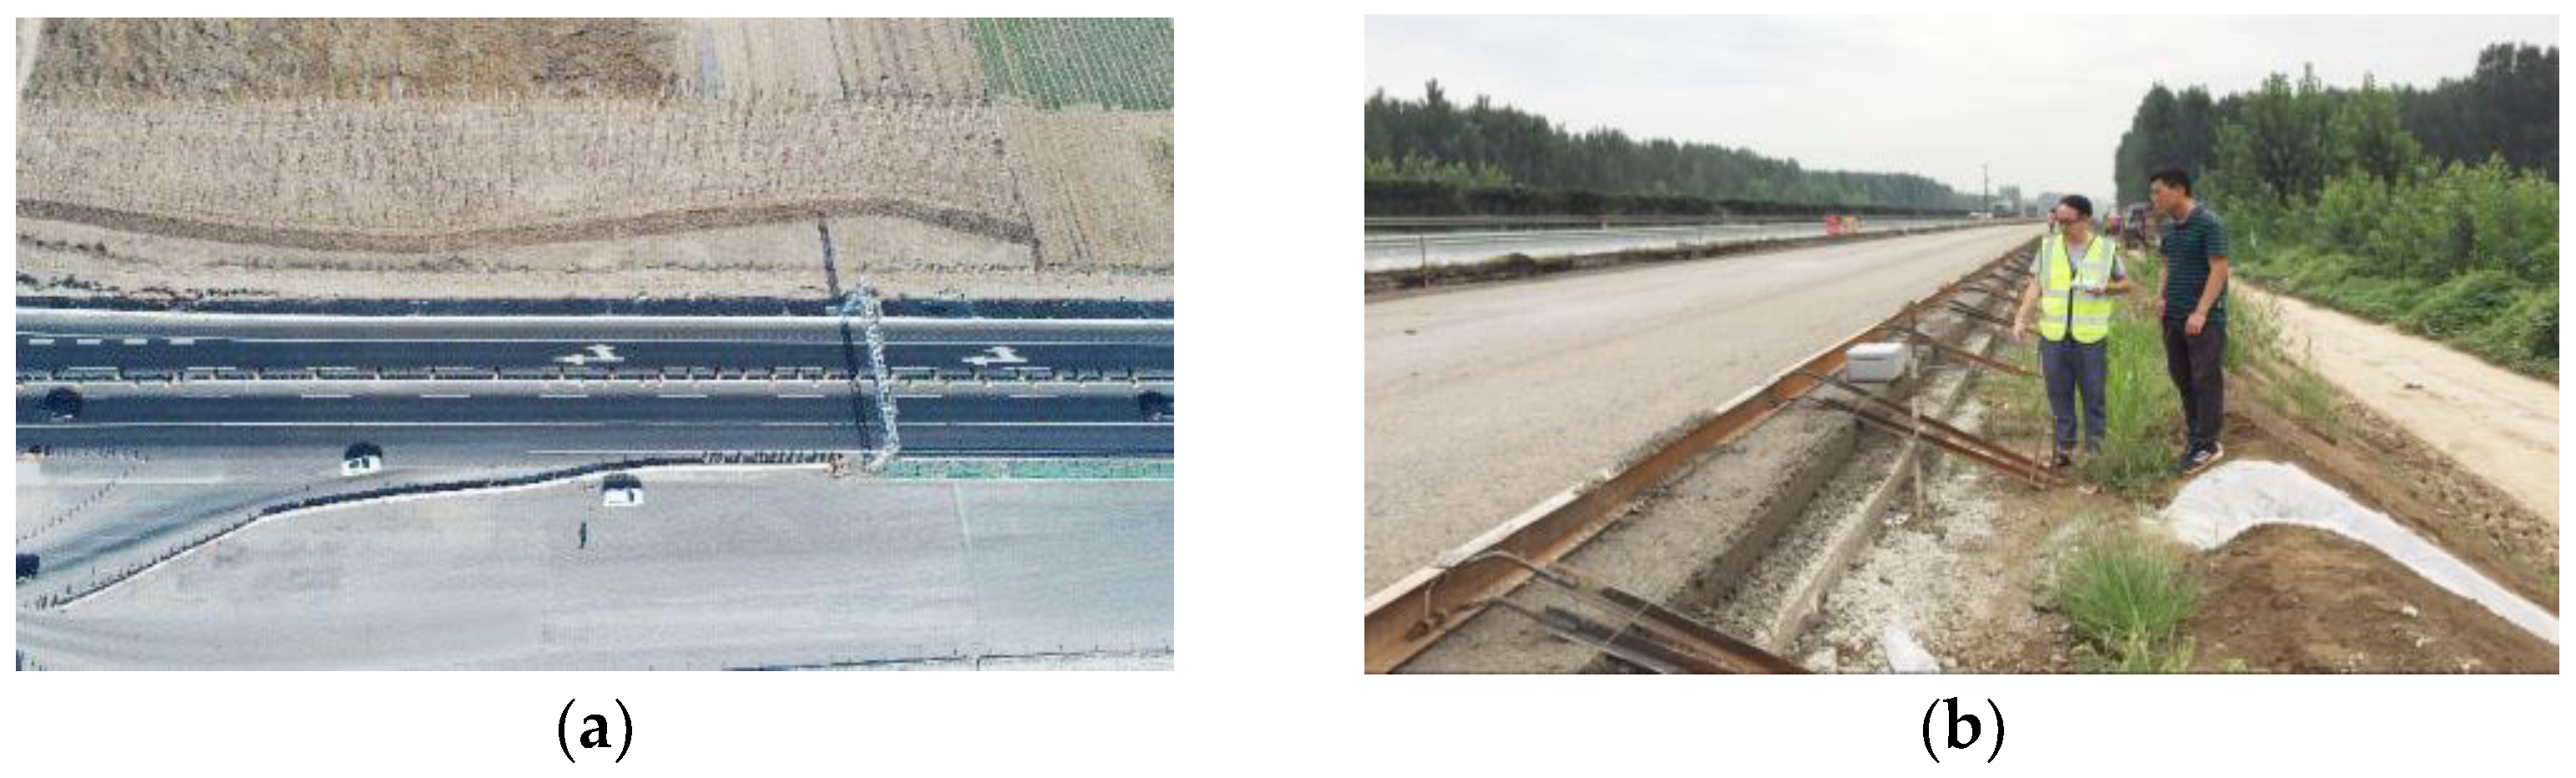
2.1. Unmanned Aerial Vehicle Data Collection
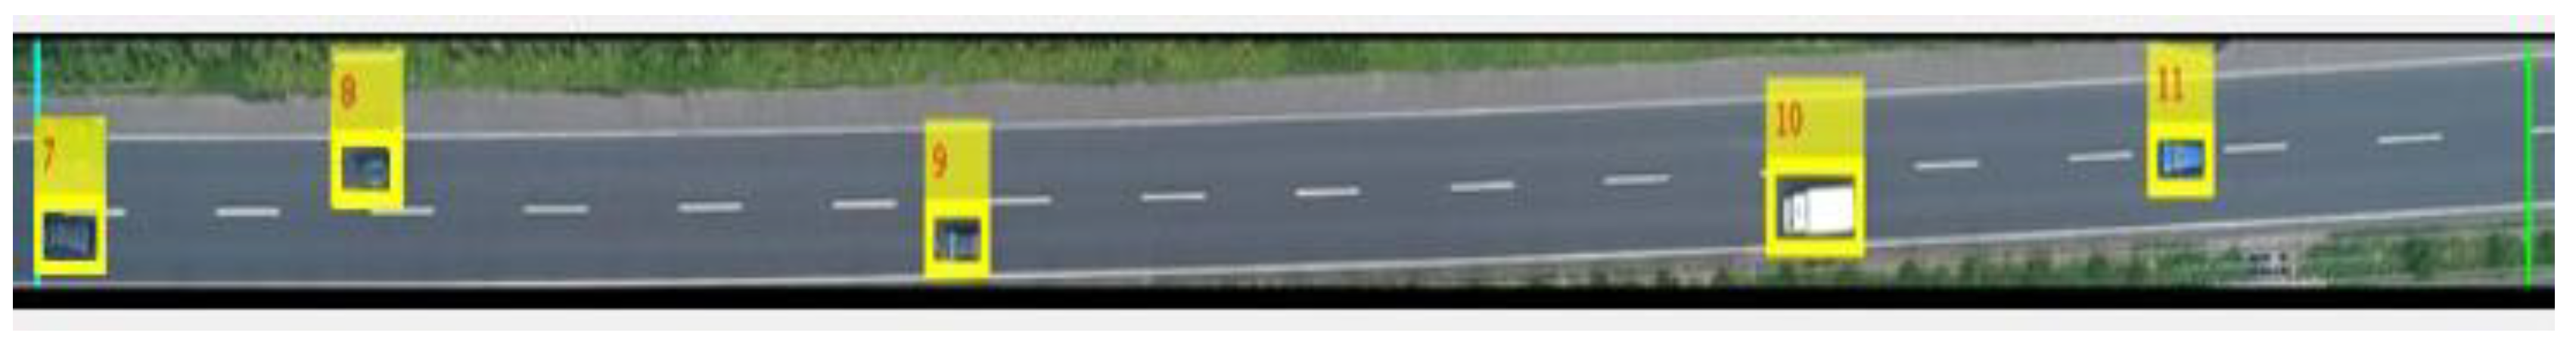
2.2. Video Data Processing
- (1)
- Vehicle detection
- (2)
- Vehicle tracking
3. Methods
3.1. Avoidant Conflict Identification
3.2. Impact Analysis of Severe Traffic Conflicts
3.2.1. Influencing Factors

| Category | Variable | Variable Explanation |
|---|---|---|
| Traffic flow factors | FMQ | Hourly traffic volume on the freeway, veh/h |
| FRQ | Hourly traffic volume on the ramp, veh/h | |
| FMvstd | Average speed standard deviation of the freeway traffic, m/s | |
| FRvstd | Average speed standard deviation of the ramp traffic, m/s | |
| FMV | Average speed of the freeway traffic, m/s | |
| FRV | Average speed of the ramp traffic, m/s | |
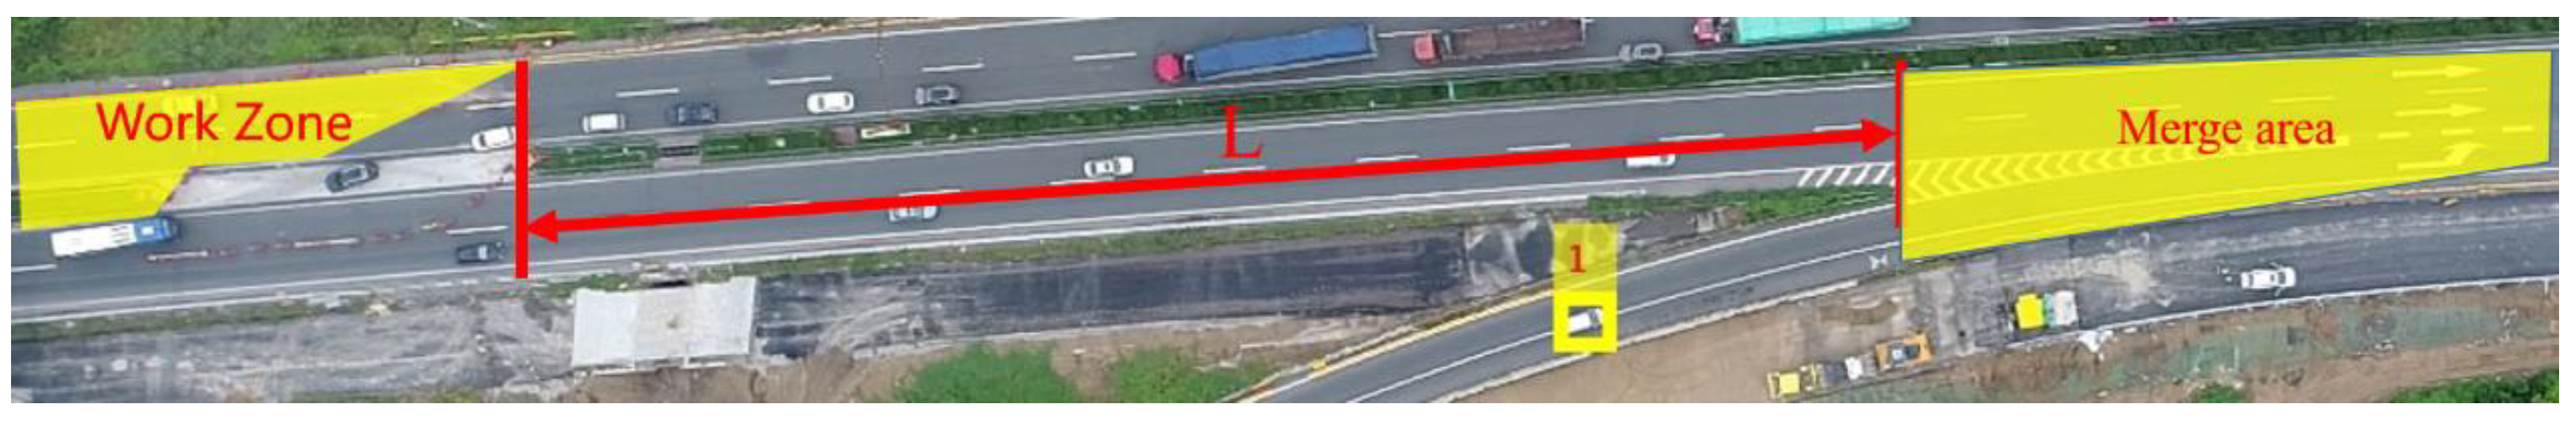
| Road factor | L | Distance between the upstream work zone and the merge area (Figure 5), m |
| IFw | Whether there is construction on the outside of the merge area | |
| IFc | Whether the length of the acceleration lane in the merge area is compressed (whether it is shorter than before construction) | |
| Individual vehicle factor | Ctype | Vehicle type |
| V(i) | Average speed of the vehicle, m/s | |
| Vstd(i) | Standard deviation of the continuous driving speed of the vehicle, m/s | |
| amax(i) | The most unfavorable acceleration of the vehicle (acceleration corresponding to the maximum absolute value of the vehicle acceleration), m/s2 | |
| Target variable | yi | Whether there are serious conflicts when the vehicles are driving in the merge area |
3.2.2. Binomial Logistic Model
4. Results and Analysis
4.1. Identification Results of Severe Traffic Conflicts
4.2. Distribution of Traffic Conflicts
- (1)
- Overall vehicle conflict distribution
- (2)
- Conflict distribution at different intervals
4.3. Logistic Model Results
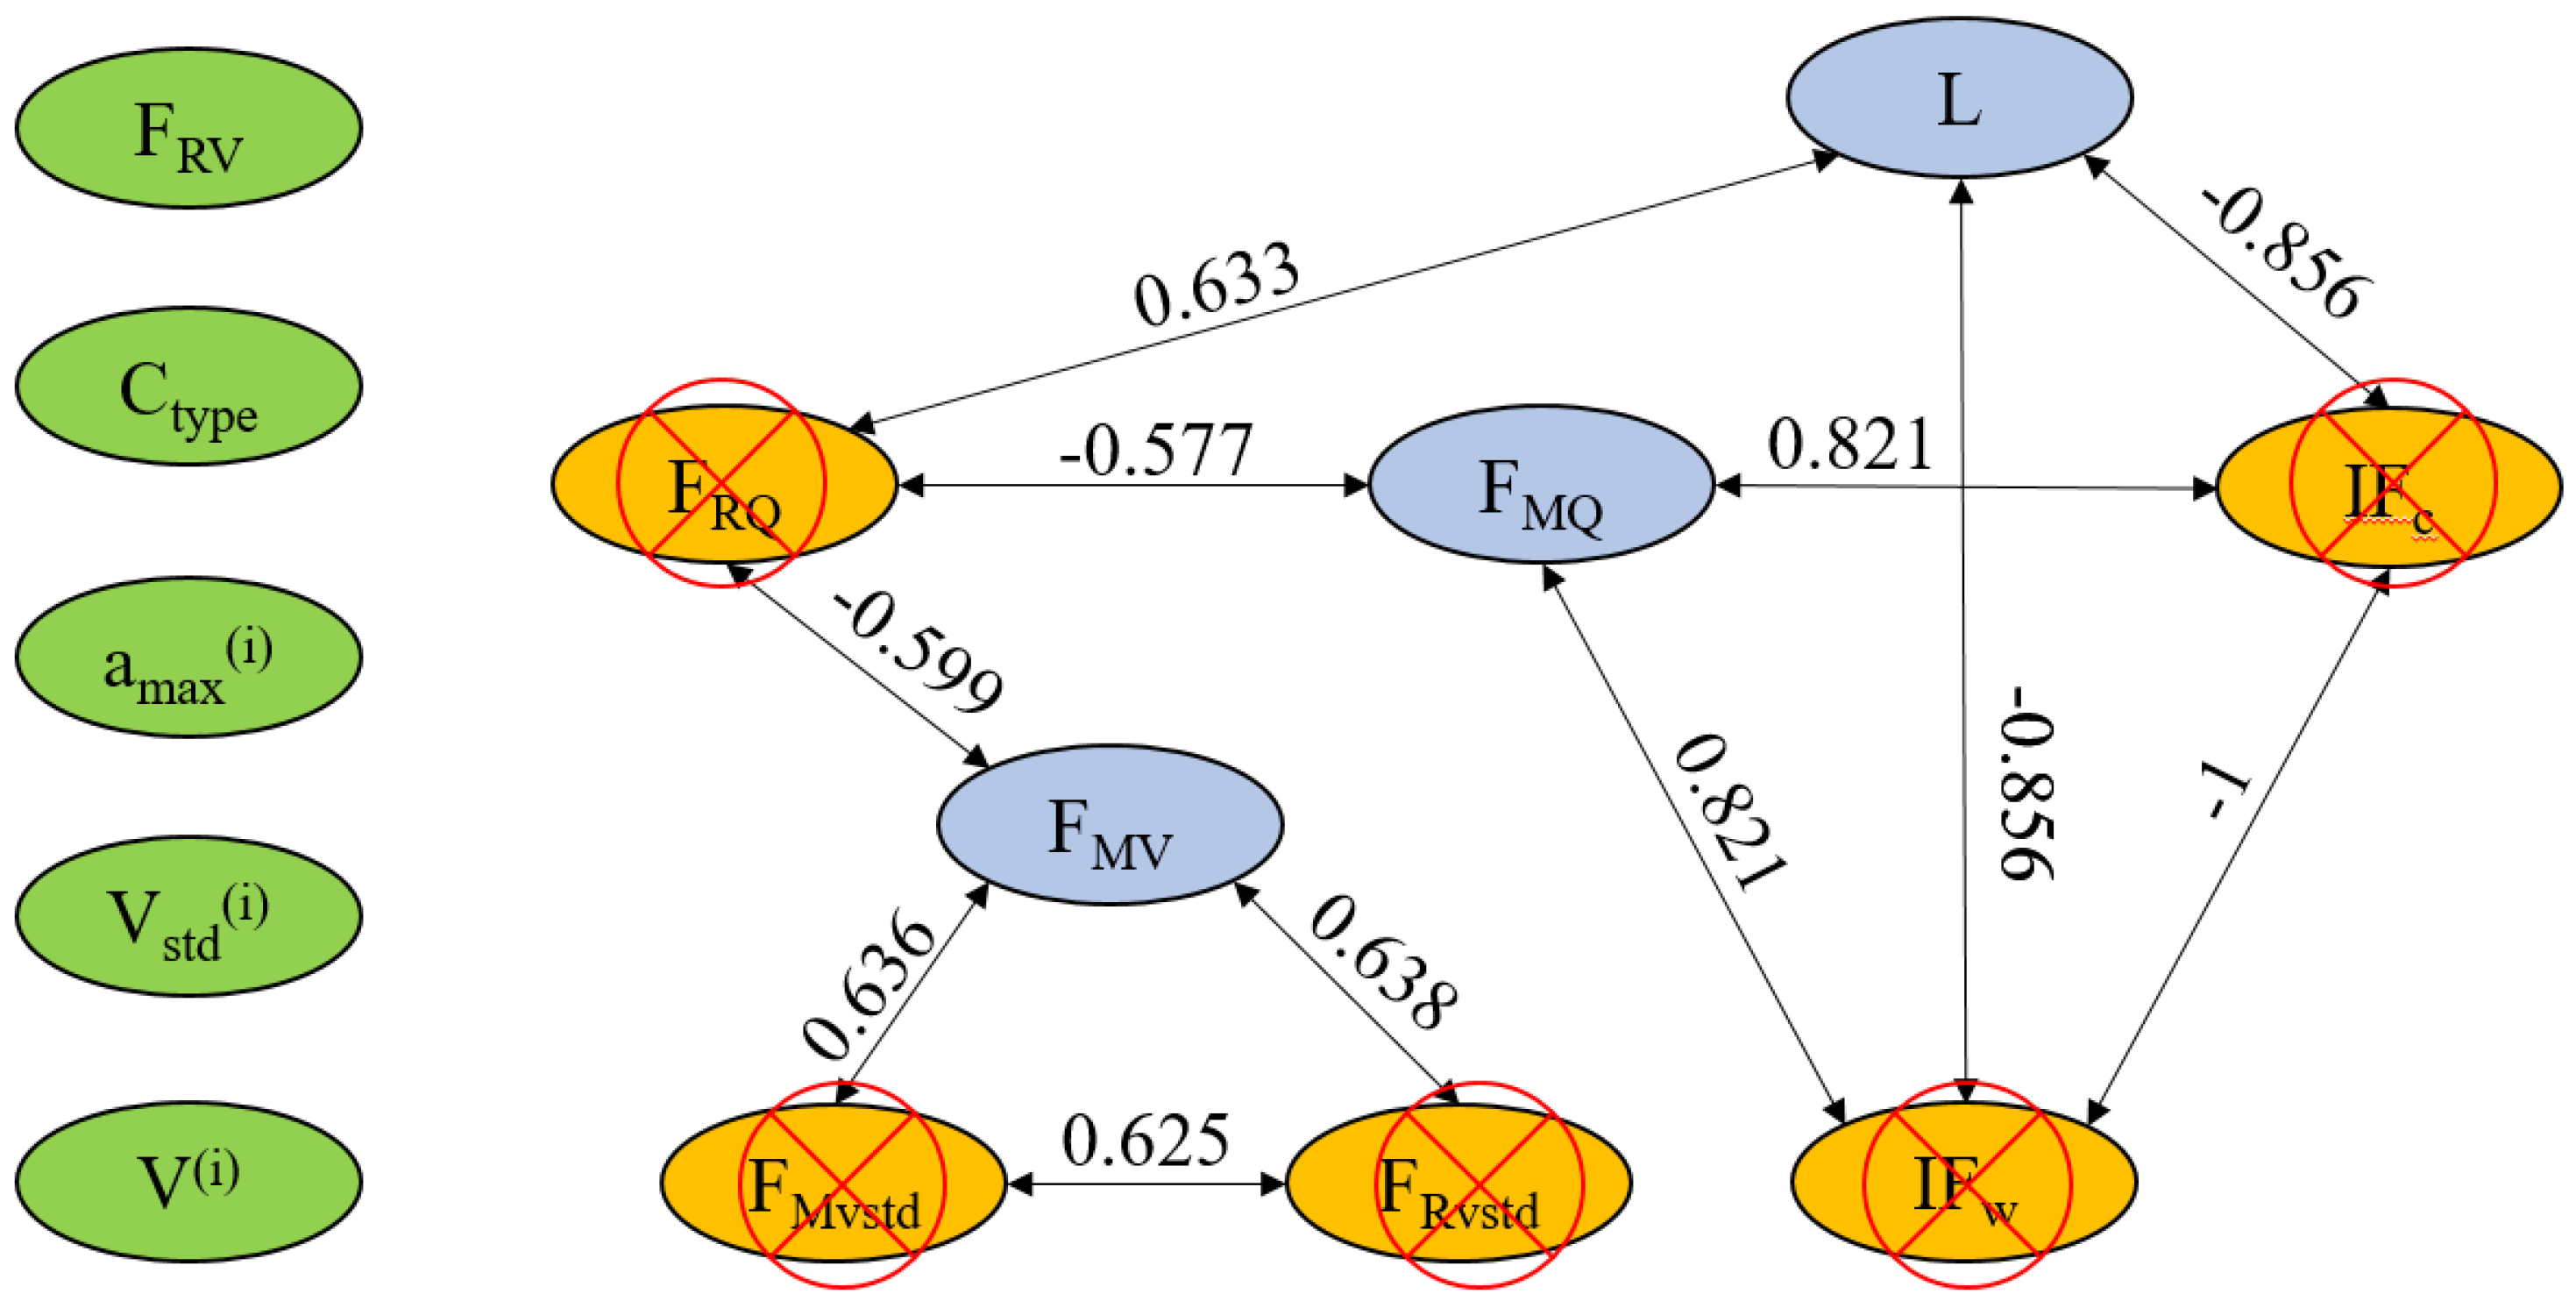
4.3.1. Variable Correlation Analysis
4.3.2. Variable Discretization
4.3.3. Model Result Analysis
4.3.4. Model Validation
5. Conclusions and Discussion
- (1)
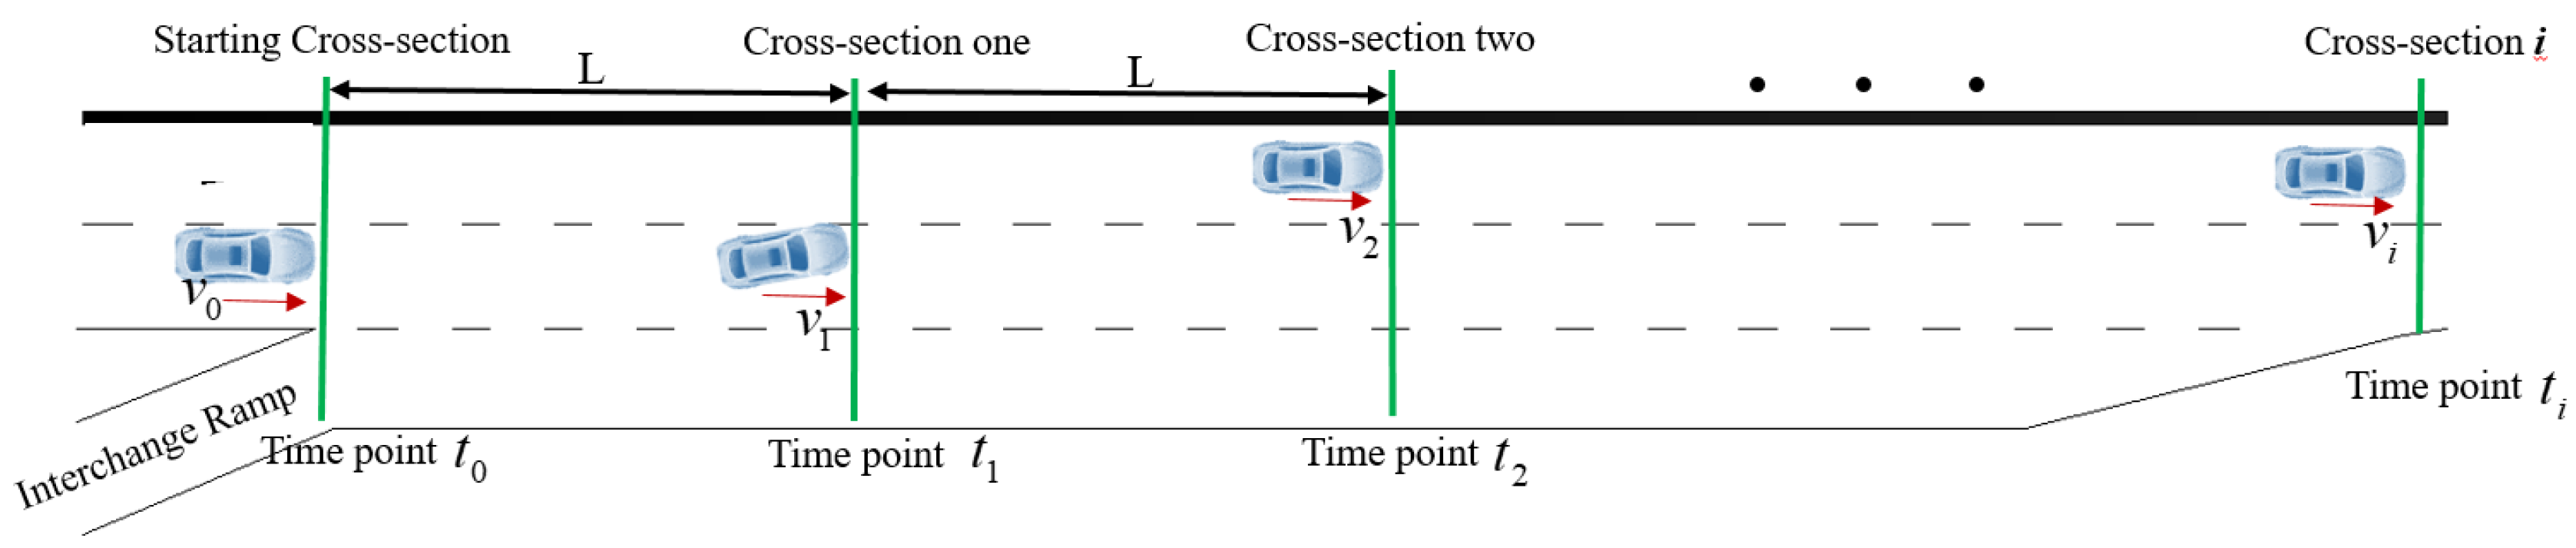
- Based on video data of vehicles collected using a UAV, the running tracking information of the vehicles was parsed, conflict states of vehicles in merge areas were studied, and spatial distribution characteristics of traffic conflicts in merge areas were analyzed. This is an effective approach to achieving the goals of traffic conflict research.
- (2)
- From the perspective of the conflict-avoidance driving behaviors of vehicles, the correlations between the serious conflict rate and traffic accident rate were analyzed using the Pearson coefficient method, based on the interval initial velocity and acceleration of the vehicles. The analysis shows that vehicles in the freeway merge areas will have serious traffic conflicts in the following two situations: (Ⅰ) m/s and m/s2; and (Ⅱ) m/s, and m/s2.
- (3)
- From the spatial distribution characteristics of the traffic conflicts and running tracks of vehicles in the merge areas, the percentages of serious traffic conflicts in the first 25 m and last 25 m of the merge area are 32.45% and 34.61%, respectively, i.e., higher than in the other sections. Moreover, the running tracks of vehicles will change significantly in these two intervals.
- (4)
- A binomial logistic model was established by considering the road conditions in the work zone. It was found that the smaller the distance between the upstream work zone and the merge area, the greater the probability of serious traffic conflicts. As the average vehicle speed increases, the probability of serious traffic conflicts initially decreases, and then increases; however, as the hourly traffic volume on the freeway increases, it first increases and then decreases. From the comparison of the OR value of each factor, it is found that when the average vehicle speed is high, the probability of serious conflict is the greatest, at 5.95 times that of the original probability. Large vehicles have the second-largest probability of experiencing serious conflicts, at 4.765 times that of small vehicles.
Author Contributions
Funding
Institutional Review Board Statement
Informed Consent Statement
Data Availability Statement
Conflicts of Interest
References
- Osman, M.; Mishra, S.; Paleti, R.; Golias, M. Impacts of work zone component areas on driver injury severity(Article). J. Transp. Eng. Part A Syst. 2019, 145, 4019032. [Google Scholar] [CrossRef]
- Gábor, V.; Árpád, T. Expected effects of accident data recording technology evolution on the identification of accident causes and liability. Eur. Transp. Res. Rev. 2023, 15, 17. [Google Scholar]
- Giuseppe, C.; Chiara, B.; Giulia, D.S.; Paolo, P. Optimizing Road Safety Inspections on Rural Roads. Infrastructures 2023, 8, 30. [Google Scholar]
- Lu, G.; Cheng, B.; Kuzumaki, S.; Mei, B. Relationship between road traffic accidents and conflicts recorded by drive recorders. Traffic Inj. Prev. 2011, 4, 320–326. [Google Scholar] [CrossRef]
- Li, S.; Xiang, Q.; Ma, Y.; Gu, X.; Li, H. Crash Risk Prediction Modeling Based on the Traffic Conflict Technique and a Microscopic Simulation for Freeway Interchange Merging Areas. Int. J. Environ. Res. Public Health 2016, 13, 1157. [Google Scholar] [CrossRef] [Green Version]
- Zheng, L.; Ismail, K.; Meng, X. Traffic conflict techniques for road safety analysis: Open questions and some insights. Can. J. Civ. Eng. 2014, 41, 633–641. [Google Scholar] [CrossRef]
- Zhu, S.; Jiang, R.; Wang, H.; Zou, H.; Wang, P. Review of research on traffic conflict techniques. China J. Highw. Transp. 2020, 33, 15–33. [Google Scholar]
- Bagdadi, O. Estimation of the severity of safety critical events. Accid. Anal. Prev. 2013, 50, 167–174. [Google Scholar] [CrossRef]
- El-Basyouny, K.; Sayed, T. Safety performance functions using traffic conflicts. Saf. Sci. 2013, 51, 160–164. [Google Scholar] [CrossRef]
- Zheng, L.; Sayed, T.; Essa, M. Validating the bivariate extreme value modeling approach for road safety estimation with different traffic conflict indicators. Accid. Anal. Prev. 2019, 123, 314–323. [Google Scholar] [CrossRef]
- Gettman, D.; Head, L. Surrogate Safety Measures from Traffic Simulation Models. Transp. Res. Rec. J. Transp. Res. Board 2003, 1840, 104–115. [Google Scholar] [CrossRef] [Green Version]
- Essa, M.; Sayed, T. Full Bayesian conflict-based models for real time safety evaluation of signalized intersections. Accid. Anal. Prev. 2019, 129, 367–381. [Google Scholar] [CrossRef] [PubMed]
- Patel, M.R.; Shukla, R.N.; Golakiya, H.D. Study of interaction between pedestrian and vehicle at undesignated urban mid-block section. Int. Res. J. Eng. Technol. 2018, 5, 4. [Google Scholar]
- Laureshyn, A.; Svensson, Å.; Hydén, C. Evaluation of traffic safety, based on micro-level behavioural data: Theoretical framework and first implementation. Accid. Anal. Prev. 2010, 42, 1637–1646. [Google Scholar] [CrossRef]
- Laureshyn, A.; De Ceunynck, T.; Karlsson, C.; Svensson, Å.; Daniels, S. In search of the severity dimension of traffic events: Extended Delta-V as a traffic conflict indicator. Accid. Anal. Prev. 2017, 98, 46–56. [Google Scholar] [CrossRef] [Green Version]
- Qi, Y.; Zhao, Q. Safety impacts of signalized lane merge control at highway work zones. Transp. Plan. Technol. 2017, 40, 577–591. [Google Scholar] [CrossRef]
- Yan-Li, M.A.; Shou-Ming, Q.I.; Hao-Tian, W.U.; Fan, L.Y. Traffic conflict identification model based on post encroachment time algorithm in ramp merging area. J. Transp. Syst. Eng. Inf. Technol. 2018, 18, 142–148. [Google Scholar]
- Fan, R.; Yu, H.; Liu, P.; Wang, W. Using VISSIM simulation model and Surrogate Safety Assessment Model for estimating field measured traffic conflicts at freeway merge areas. IET Intell. Transp. Syst. 2013, 7, 68–77. [Google Scholar] [CrossRef]
- Giulia, D.; Giuseppe, C.; Paolo, P. Speed data collection methods: A review. Transp. Res. Procedia 2023, 69, 512–519. [Google Scholar]
- Ho, D.-T.; Grøtli, E.I.; Sujit, P.B.; Johansen, T.A.; Sousa, J.B. Optimization of Wireless Sensor Network and UAV Data Acquisition. J. Intell. Robot. Syst. 2015, 78, 159–179. [Google Scholar] [CrossRef]
- Xing, L.; He, J.; Abdel-Aty, M.; Cai, Q.; Li, Y.; Zheng, O. Examining traffic conflicts of up stream toll plaza area using vehicles’ trajectory data. Accid. Anal. Prev. 2019, 125, 174–187. [Google Scholar] [CrossRef]
- Dong, E.; Han, B.; Jian, H.; Tong, J.; Wang, Z. Moving target detection based on improved Gaussian mixture model considering camera motion. Multimed. Tools Appl. 2020, 79, 7005–7020. [Google Scholar] [CrossRef]
- Zhang, K.; Zhang, L.; Liu, Q.; Zhang, D.; Yang, M.-H. Fast visual tracking via dense spatio-temporal context learning. In Proceedings of the European Conference on Computer Vision (ECCV), Zurich, Switzerland, 6–7 September 2014; pp. 127–141. [Google Scholar]
- Hossain, M.; Muromachi, Y. A real-time crash prediction model for the ramp vicinities of urban expressways. IATSS Res. 2013, 37, 68–79. [Google Scholar] [CrossRef] [Green Version]
- Meng, L.; Han, W.X.; Ke, S. Traffic Conflict Identification Technology of Vehicle Intersection Based on Vehicle Video Trajectory Extraction. Procedia Comput. Sci. 2017, 109, 963–968. [Google Scholar] [CrossRef]
- Lu, G.; Yan, J.; Kou, Y.; Zhang, J. Image registration based on criteria of feature point pair mutual information. IET Image Process. 2011, 5, 560–566. [Google Scholar] [CrossRef]
- Fu, X.S.; Zhu, J. Research on Moving Vehicle Detection and Tracking Algorithm Based on Video Image. Key Eng. Mater. 2011, 467–469, 1488–1492. [Google Scholar] [CrossRef]
- Hou, D.; Han, J.; Sun, X.; He, Y. Study on the Relationship between Speed Difference and Crash Rate on Freeway. In ICCTP 2010: Integrated Transportation Systems: Green, Intelligent, Reliable; ASCE Library: Reston, VA, USA, 2010; Volume 382, pp. 354–359. [Google Scholar] [CrossRef]
- Guo, T.; Liu, Y.; Lu, J. Levels of safety at freeway exits: Evaluations on the basis of individual speed difference. Transp. Res. Rec. 2011, 47, 10–18. [Google Scholar] [CrossRef]
- Rui, L.; Xichan, Z. Acceleration distribution characteristics of the driver and its application. J. Automot. Saf. Energy 2019, 16, 101–103. [Google Scholar]
- Jier, L.V.; Liu-hua, Z.; Rong-sen, Z.; Yan-fang, W. Effects of driver’s reaction time on safe driving. J. Transp. Syst. Eng. Inf. Technol. 2014, 14, 80–86. [Google Scholar]
- Li, L.; Zhu, X.; Ma, Z. Driver brake reaction time under real traffic risk scenarios. Qiche Gongcheng/Automot. Eng. 2014, 36, 1225–1229. [Google Scholar]
- Shi, Q.; Abdel-Aty, M. Big Data applications in real-time traffic operation and safety monitoring and improvement on urban expressways. Transp. Res. Part C Emerg. Technol. 2015, 58, 380–394. [Google Scholar] [CrossRef]
- Wu, Y.; Abdel-Aty, M.; Cai, Q.; Lee, J.; Park, J. Developing an algorithm to assess the rear-end collision risk under fog conditions using real-time data. Transp. Res. Part C Emerg. Technol. 2018, 87, 11–25. [Google Scholar] [CrossRef]


| Collection Time | Including the morning peak from 8:00 to 9:00, the evening peak from 16:00 to 17:00, and the flat peaks from 10:00 to 11:00 and 15:00 to 16:00. |
| Collection Site | K176 + 500, K258 + 260 (including 2 merge areas), and K132 + 300 (including 2 merge areas). |
| Characteristics of merge area | Merge area (K176 + 500):100 m long and 14 m wide Merge areas (K258 + 260): two merge areas are both 120 m and 15 m wide. Merge areas (K132 + 300): two merge areas are both 150 m and 15 m wide. |
| Collected Data Amount | A total of six hours of data were collected; after data sorting, 56,825 frames with complete data were retained. |
| Initial Velocity Classification | Initial Velocity (m/s) | Acceleration Classification | Acceleration (m/s2) |
|---|---|---|---|
| Interval 1 | [7, 13.5) | Interval 1 | [−3.96, −1.57) |
| Interval 2 | [13.5, 17.6) | Interval 2 | [−1.57, −0.65) |
| Interval 3 | [17.60, 21.10) | Interval 3 | [−0.65, 0.04) |
| Interval 4 | [21.10, 24.30) | Interval 4 | [0.04, 0.84) |
| Interval 5 | [24.30, 30.30] | Interval 5 | [0.84, 3.15] |
| Initial Velocity (m/s) | Acceleration (m/s2) | Pearson Coefficient | Initial Velocity (m/s) | Acceleration (m/s2) | Pearson Coefficient |
|---|---|---|---|---|---|
| [7,13.5) | [−3.96, −1.57) | 0.812 ** | [13.5, 17.6) | [−3.96, −1.57) | 0.823 ** |
| [7,13.5) | [−1.57, −0.65) | 0.877 ** | [13.5, 17.6) | [−1.57, −0.65) | 0.563 |
| [7,13.5) | [−0.65, 0.04) | 0.267 | [13.5, 17.6) | [−0.65, 0.04) | 0.532 |
| [7,13.5) | [0.04, 0.84) | 0.245 | [13.5, 17.6) | [0.04, 0.84) | 0.573 |
| [7,13.5) | [0.84, 3.15] | 0.214 | [13.5, 17.6) | [0.84, 3.15] | 0.861 ** |
| [17.60,21.10) | [−3.96, −1.57) | 0.806 ** | [21.10, 24.30) | [−3.96, −1.57) | 0.511 |
| [17.60,21.10) | [−1.57, −0.65) | 0.612 | [21.10, 24.30) | [−1.57, −0.65) | 0.643 |
| [17.60,21.10) | [−0.65, 0.04) | 0.422 | [21.10, 24.30) | [−0.65, 0.04) | 0.512 |
| [17.60,21.10) | [0.04, 0.84) | 0.476 | [21.10, 24.30) | [0.04, 0.84) | 0.332 |
| [17.60,21.10) | [0.84, 3.15] | (0.221) | [21.10, 24.30) | [0.84, 3.15] | 0.324 |
| [24.30,30.30] | [−3.96, −1.57) | 0.614 | [24.30, 30.30] | [0.04, 0.84) | 0.253 |
| [24.30,30.30] | [−1.57, −0.65) | 0.322 | [24.30, 30.30] | [0.84, 3.15] | 0.298 |
| [24.30,30.30] | [−0.65, 0.04) | 0.106 |
| Number of Vehicles in Serious Conflict (Vehicles) | Number of Vehicles in Non-Serious Conflict (Vehicles) | Total Number of Vehicles (Vehicles) | Proportion of Vehicles in Serious Conflict (%) |
|---|---|---|---|
| 816 | 1552 | 2368 | 34.46 |
| Variable | FRQ | FMV | FMvstd | FRvstd | IFc | IFw | L | |
|---|---|---|---|---|---|---|---|---|
| Hourly traffic on the freeway (FMQ) | Correlation | −0.577 | 0.821 | −0.821 | ||||
| significance (two-tailed) | 0.000 | 0.000 | 0.000 | |||||
| Hourly traffic volume on the ramp (FRQ) | Correlation | −0.599 | 0.633 | |||||
| significance (two-tailed) | 0.000 | 0.000 | ||||||
| Average speed of the freeway traffic(FMV) | Correlation | 0.636 | 0.638 | |||||
| significance (two-tailed) | 0.000 | 0.000 | ||||||
| Standard deviation of the average speed of the freeway traffic (FMvstd) | Correlation | 0.625 | ||||||
| significance (two-tailed) | 0.000 | |||||||
| Whether the acceleration lane is compressed (IFc) | Correlation | −1.000 | −0.856 | |||||
| significance (two-tailed) | 0.000 | 0.000 | ||||||
| Whether the roadside is under construction (IFw) | Correlation | 0.856 | ||||||
| significance (two-tailed) | 0.000 | |||||||
| Variable Type | Variable | Discrete Value | Discretization Discriminant |
|---|---|---|---|
| Individual vehicle variables | Vehicle type | 0 | Small or medium-sized vehicle |
| Ctype | 1 | Large vehicle | |
| Average speed of an individual vehicle V(i) (m/s) | 1 | [6, 15.5) | |
| 2 | [15.5, 21.6) | ||
| 3 | [21.6, 33] | ||
| Standard deviation of the average speed of an individual vehicle Vstd(i) (m/s) | 1 | [0, 1.85) | |
| 2 | [1.85, 5) | ||
| 3 | [5, 8] | ||
| The most unfavorable acceleration of an individual vehicle amax(i) (m/s2) | 1 | [−4.5, −2.3) | |
| 2 | [−2.3, 0.2) | ||
| 3 | [0.2, 3] | ||
| Traffic flow variables | Hourly traffic on the freeway FMQ (veh/h) | 1 | [820, 900) |
| 2 | [900, 1000) | ||
| 3 | [1000, 1120] | ||
| Average speed of the freeway traffic FMV (m/s) | 1 | [12, 14) | |
| 2 | [14, 17) | ||
| 3 | [17, 21] | ||
| Average speed of the ramp traffic FRV (m/s) | 1 | [8, 10) | |
| 2 | [10, 14) | ||
| 3 | [14, 18] | ||
| Road condition variables | Distance between the upstream work zone and the merge area L | 1 | Small |
| 2 | Medium | ||
| 3 | Large | ||
| Dependent variables | Whether there is a risk of serious conflict yi | 0 | Non-serious conflict |
| 1 | Serious conflict |
| Variable | β | S.E. | Wald | Degree of Freedom | Significance | Odds Ratio (OR) |
|---|---|---|---|---|---|---|
| V(i) = 1 | 8.504 | 2 | 0.000 | |||
| V(i) = 2 | −0.814 | 0.868 | 0.880 | 1 | 0.048 | 0.443 |
| V(i) = 3 | 1.783 | 0.729 | 5.990 | 1 | 0.000 | 5.954 |
| FMQ = 1 | 7.210 | 2 | 0.000 | |||
| FMQ = 2 | 0.542 | 0.278 | 3.812 | 1 | 0.000 | 1.720 |
| FMQ = 3 | −0.221 | 0.113 | 3.854 | 1 | 0.000 | 0.801 |
| amax(i) = 1 | 15.607 | 2 | 0.000 | |||
| amax(i) = 2 | −3.323 | 0.841 | 15.607 | 1 | 0.000 | 0.036 |
| amax(i) = 3 | −20.509 | 798.820 | 0.000 | 1 | 0.998 | 0.000 |
| Ctype | 1.561 | 0.734 | 4.531 | 1 | 0.033 | 4.765 |
| L = 1 | 4.000 | 2 | 0.000 | |||
| L = 2 | −0.029 | 0.022 | 1.803 | 1 | 0.000 | 0.971 |
| L = 3 | −0.587 | 0.360 | 2.656 | 1 | 0.000 | 0.556 |
| Constant | −3.909 | 0.600 | 42.449 | 1 | 0.000 | 0.020 |
| Chi-Square | Degree of Freedom | Significance | |
|---|---|---|---|
| Step (T) | 4.634 | 1 | 0.031 |
| Block | 1101.623 | 11 | 0.000 |
| Model | 1101.623 | 11 | 0.000 |
| Step (T) | Chi-Square | Degree of Freedom | Significance |
|---|---|---|---|
| 6 | 0.223 | 6 | 1.000 |
Disclaimer/Publisher’s Note: The statements, opinions and data contained in all publications are solely those of the individual author(s) and contributor(s) and not of MDPI and/or the editor(s). MDPI and/or the editor(s) disclaim responsibility for any injury to people or property resulting from any ideas, methods, instructions or products referred to in the content. |
© 2023 by the authors. Licensee MDPI, Basel, Switzerland. This article is an open access article distributed under the terms and conditions of the Creative Commons Attribution (CC BY) license (https://creativecommons.org/licenses/by/4.0/).
Share and Cite
Wang, P.; Zhu, S.; Zhao, X. Identification and Factor Analysis of Traffic Conflicts in the Merge Area of Freeway Work Zone. Sustainability 2023, 15, 11314. https://doi.org/10.3390/su151411314
Wang P, Zhu S, Zhao X. Identification and Factor Analysis of Traffic Conflicts in the Merge Area of Freeway Work Zone. Sustainability. 2023; 15(14):11314. https://doi.org/10.3390/su151411314
Chicago/Turabian StyleWang, Pan, Shunying Zhu, and Xiaoyue Zhao. 2023. "Identification and Factor Analysis of Traffic Conflicts in the Merge Area of Freeway Work Zone" Sustainability 15, no. 14: 11314. https://doi.org/10.3390/su151411314