Article

The Use of Recycled Polymers for the Preparation of Self-Reinforced Composites by the Overmolding Technique: Materials Performance Evaluation

by
Jacek Andrzejewski
Institute of Materials Technology, Faculty of Mechanical Engineering, Poznan University of Technology, Piotrowo 3 Street, 61-138 Poznan, Poland
Sustainability 2023, 15(14), 11318; https://doi.org/10.3390/su151411318
Submission received: 20 June 2023 / Revised: 12 July 2023 / Accepted: 17 July 2023 / Published: 20 July 2023

Abstract

:
The presented research focused on the evaluation of the novel concept of the overmolding technique using self-reinforced composite prepregs and recycled polymer blends. In order to evaluate the effectiveness of the proposed manufacturing technique, several series of materials based on polycarbonate/polyethylene terephthalate (PC/PET) and polycarbonate/polyethylene terephthalate glycol (PC/PETG) blends were prepared. The reinforcing component in the form of overmolded prepreg was made from polyester-based self-reinforced composite (srPET). The prepared materials were compared in terms of mechanical properties and heat resistance; the study was supplemented by thermal analysis measurements. Considering the mechanical characteristics, the overmolding technique turns out to be an effective method of improving the properties of composites, and the increase in impact strength turns out to be particularly beneficial. The increase of the impact strength for the overmolded PC/PET blend reached 430% for PC/PETG sample 330%, while for the PC-based composite, only 100%. The expected improvement in thermomechanical properties turned out to be difficult to achieve due to the rapid softening of the srPET prepreg at around 70 °C. However, technological tests and properties analysis indicated that the use of PC-based blends makes it possible to create a permanent connection with reinforcement based on srPET prepregs, which can significantly expand the potential of applications of this type of material. The presented research confirmed that the self-reinforced composites can be successfully used as reinforcement for recycled polymer blends.

1. Introduction

Self-reinforced materials, also called single-polymer composites, represent polymeric materials characterized by improved mechanical properties, favorable density–strength correlation, and an easy-to-perform recycling process. The self-reinforcement concept starts with the idea presented by Capiati and Porter in the 1970s, where prepared materials were composed of two different types of polyethylene (PE) resin [1]. Since the structure of the material was two-component, it can be called a composite; however, from the chemical point of view, both phases were composed of the same single type of polyethylene monomer. Since the first research, many concepts for the production of single-polymer composites have been tested, and some have found industrial applications [2,3,4,5]. Currently, the most widespread industrial solutions concern composites based on polyolefins; however, technological solutions based on polypropylene PP and its copolymers are definitely dominant. For example, all-PP materials are known under the commercial names Pure® and Curv® can be cited here [6,7,8]. For several years, a new research trend has been observed in which polyester [9,10,11,12,13,14] or nylon-based [15,16,17] materials are the main object of modification. However, so far, the main interest concerns the first group of plastics, mainly PET-based materials.
The main features of thermoplastic polyesters, which allow them to be used in the construction of self-reinforced composites, include a large range of varieties and subspecies, as well as a wide range of processing temperatures for one type of polymer. For example, the PET homopolymer that was manufactured in the form of foil can be thermoformed below 100 °C. In contrast, the heat resistance of the same homopolymer that was processed into a thin film can reach 225 °C, which is helpful for use as the backing sleeve. Therefore, it is possible to produce materials in the form of films with very different plasticization temperatures, which can be used as the matrix phase. Due to the widespread use of PET as a fiber-forming material, there are wide varieties of high-strength technical fibers. From the technological point of view, the properties of PET-type polyesters allow for the production of single-polymer composites relatively easily; however, the use of polyolefins is still more widespread for several reasons.
One of the drawbacks of PET and other amorphous polyesters like polylactic acid (PLA) is their insufficient heat resistance, limited by the glass transition region (Tg). For pure PET, the Tg reached around 80–90 °C, while the heat deflection temperature (HDT) was limited to 70–80 °C. Due to the cold crystallization phenomenon, it is possible to conduct the annealing procedure; however, it is an energy and time-consuming procedure, and it can also cause excessive shrinking and, consequently, part warping. According to previous work on this subject [18], where polyester-based single-polymer composites were overmolded using pure PET or PETG resin, the heat resistance of both types of hybrid composites was very low, close to the heat resistance of pure PETG (≈70 °C). Research studies indicate the high potential for using single-polymer composites in the automotive industry [10,19].
In industrial practice, the use of polymer blends is a common way to improve PET heat resistance [20]. So far, PET-based blends have been modified with several different polymers like polyamides PA6 and PA66 [21,22,23,24] and acrylonitrile-butadiene-styrene copolymer ABS [25,26,27]. However, for PET, the most popular type of blend is with a polycarbonate (PC) [28,29,30,31,32,33,34,35], which is why we select this type of material for investigation. Interestingly, the PC/PET blends have already been used during the overmolding of srPET composites. Jerpal et al. investigated the use of commercially available PC/PET material [36]. The research focused on the impact of injection molding conditions on the properties of srPET composite inserts. Experimental and simulation studies have shown a large dependence of the mechanical properties of the srPET composite on the thermal conditions in the mold, which is related to the phenomenon of material structure relaxation.
One of the aspects of the overmolding technique analyzed in the presented work was the possibility of using waste/recycled type of polymers. Like no other type of polymer, polyethylene terephthalate is commonly used in its recycled form. The main reason for that is the lack of fillers, pigments, or other additives used during the manufacturing of PET-based products, like bottles, foils, and other types of packaging. The research on the use of recycled PET (or rPET) as a component of technical blends has been known for many years, also on an industrial scale [37,38,39,40]; however, a literature review shows very few examples where the polymer system also contains a recycled PC component [41,42]. The obvious reason for that is the high susceptibility of PC to hydrolytic degradation. It means that PC melt processing requires intensive drying of the input material, which is often difficult when processing the waste type of plastics.
Summarizing the introduction to the subject of the article, it is worth noting that the main area of novelty for the discussed concept of research and developed materials is the issue of the use of recycled materials. Overall, the developed manufacturing methods concept is part of the circular economy issues. The second important aspect is the assessment of potential changes in mechanical and thermomechanical properties caused by the addition of the PC component.
The main purpose of the conducted research is to assess the possibility of using srPET composites as a selective reinforcement in products obtained by the overmoulding technique. The comparative tests will be aimed at verifying whether the use of materials with the addition of PC enables the creation of a permanent connection between the reinforcing insert and the overmolded material. The presented research is also aimed at demonstrating whether the use of waste-origin polymer blends is a valuable concept for the preparation of PC/polyester-based blends. The performed tests included mechanical properties evaluation (tensile and Charpy tests) and measurements of thermomechanical properties (HDT); the experimental methodology is supplemented by thermal analysis measurements using dynamic mechanical, thermal analysis (DMTA) and differential scanning calorimetry (DSC) techniques.

2. Experimental

2.1. Materials

Two types of recycled polymers were used for the preparation of the developed materials. The first resin was PET—polyethylene terephthalate—from recycled bottle preforms (GTX Hanex, Dabrowa Gornicza, Poland), and the intrinsic viscosity (IV) was 0.72 dL/g. Glycol-modified PET copolymer (PETG) was the second type of used resin; for the purpose of the study, we used recycled filament from the FDM processing (Fiberlogy, Krakow, Poland). The melt flow index (MFI) for PETG measured before processing was 15 g/10 min (2.16 kg/230 °C). Both types of polyesters were blended with recycled PC resin; for the purpose of the study, we used shredded roof sheets (Tuplex, Poland), and the MFI of the recycled PC was 10 g/10 min (1.2 kg/300 °C).
Polyester-based single-polymer composite srPET (Comfil ApS, Gjern, Danmark) was supplied in the form of a flat sheet thickness of 1 mm. As declared by the producer, the material consists of 50% PET reinforcing fibers and 50% of low melting polyester resin market as LPET. The reinforcing PET fibers were prepared in the form of twill fabric. Before the overmolding process stage, the sheets were cut into 10 mm wide strips.

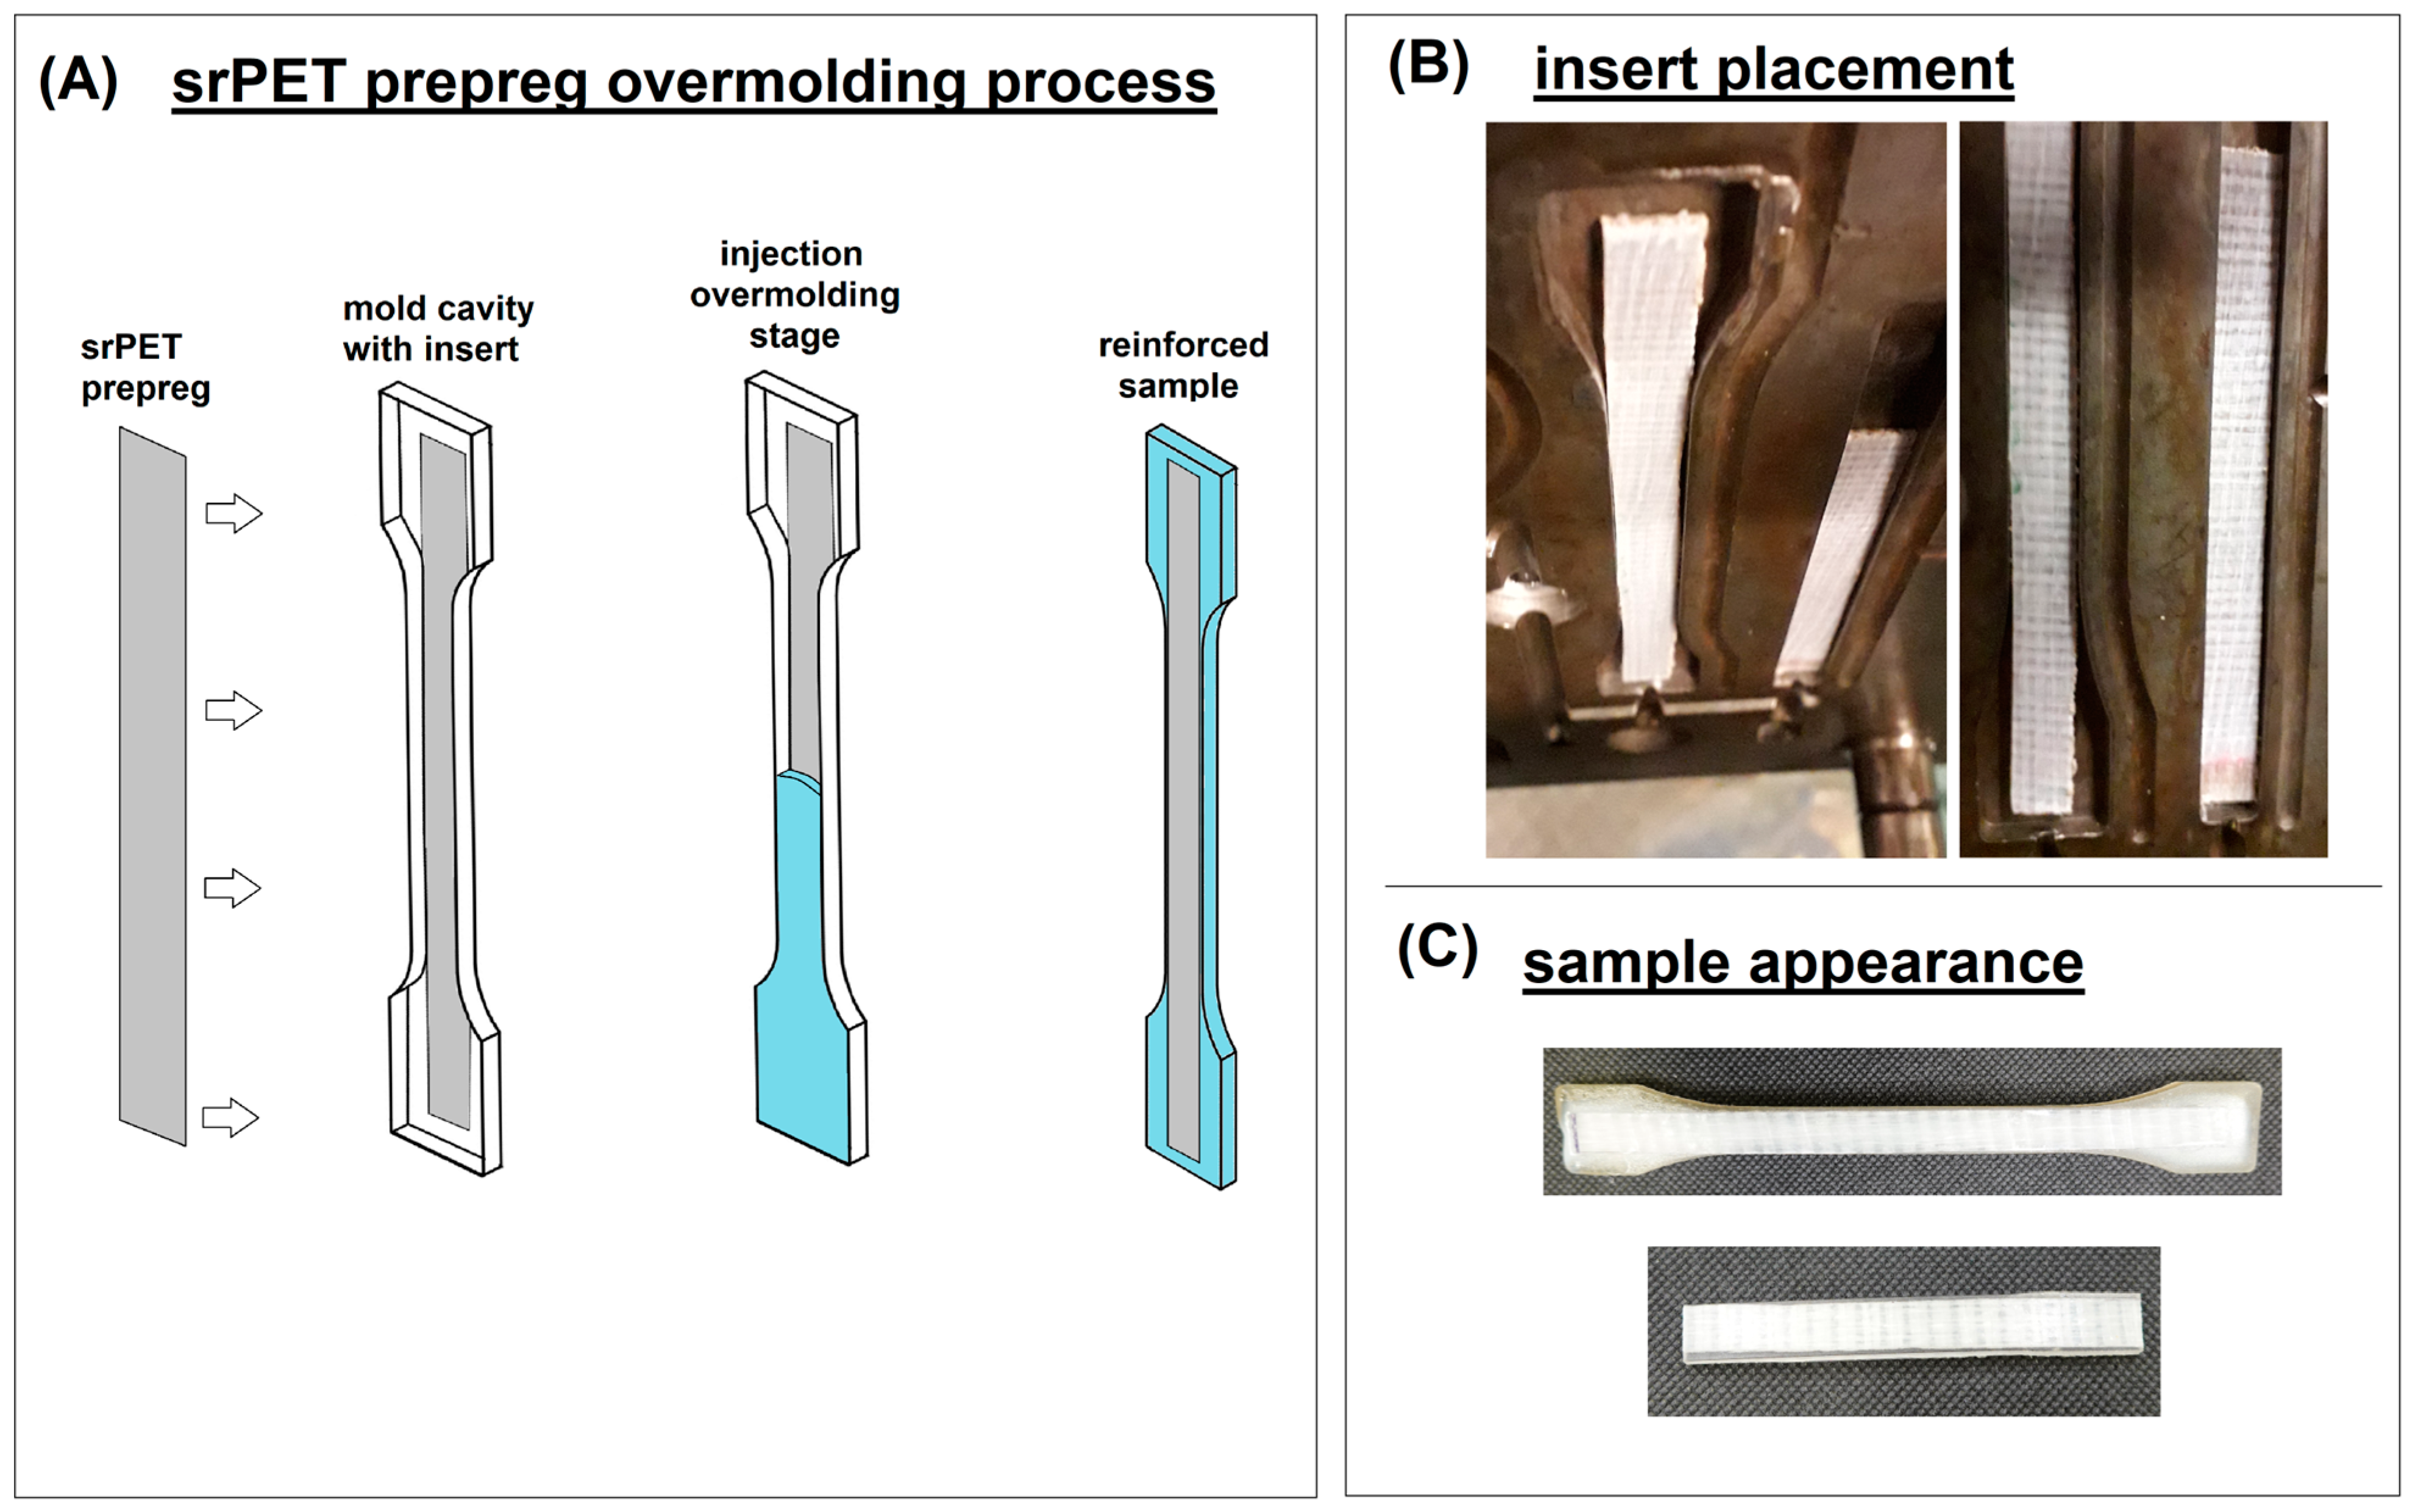
2.2. Sample Preparation

Since part of the developed materials was prepared from the blended polymers, the initial stage of the sample preparation procedure consists of melt mixing of PC/PET and PC/PETG blends. For the purpose of the study, we used the twin screw extruder, model EH16.2D (Zamak Mercator, Skawina, Poland). The machine was equipped with 16 co-rotating screws, L/d = 50. The temperature profile of the machine barrel was as follows: 280(die)-280-280-275-275-270-270-260-260 °C, and the screw speed was set to 120 rpm. The prepared material was continuously cooled and pelletized. The extrusion procedure was also applied for pure PC, PET, and PETG since the shredded form of material might get stuck in the hopper of the injection molding machine. Before each processing stage, all the materials were dried in the cabinet oven for 6 h at 90 °C for PET and PC and 70 °C for PETG.
The injection molding and overmolding process were conducted using Engel Victory 50 machine (Engel Austria GmbH, Schwertberg, Austria). This hydraulic machine was equipped with a 25 mm diameter screw, L/d ratio was 24. The standard molding procedure was conducted with the following parameters: injection temperature of 280 °C, injection/holding pressure of 750/450 bars, and holding/cooling time of 10/30 s. The mold temperature was set to 40 °C. The overmolding stage was conducted in accordance with the procedure described in previous papers [18,43]. In simple terms, the procedure consists in placing the srPET inserts inside the injection mold; the width of the insert was adjusted so as to prevent the prepreg from slipping out when the mold is closed. The rest of the procedure was performed similarly to the standard molding process. The main stages of the overmolding procedure are presented in Figure 1. The overmolding procedure was conducted for all types of molded materials: PC, PET, PETG, PC/PET (50/50), and PC/PETG (50/50).

2.3. Methods

The mechanical properties of the developed materials were evaluated using static tensile tests and notched Charpy impact resistance measurements. For tensile tests, the measurement procedure was conducted according to ISO 527 standard [44], using a 1A type sample gauge length of 50 mm. All samples were tested using Zwick/Roell Z01 universal testing machine (Zwick/Roell GmbH, Ulm, Germany). The cross-heat speed was set to 5 mm/min for all samples.
The impact resistance test was carried out using Zwick/Roell HIT15 machine (Zwick/Roell, Ulm, Germany). The apparatus was equipped with a 5 J energy hammer. The machine was instrumented with a force sensor which means that it was possible to record the force during the impact on the sample. The test was conducted according to ISO 179 standard [45]. For all mechanical tests (tensile/impact), at least 5 samples were measured in order to determine the reliable average value and standard deviation.
Dynamic mechanical, thermal analysis (DMTA) was performed using Anton Paar MCR301 rheometer (Anton Paar GmbH, Graz, Austria) attached with torsion clamps. Samples of the size 50 × 10 × 4 mm were cut from the dumbbell specimens. The testing range started from 25 °C, while the final temperature, depending on the molded type of material, is between 150 °C and 200 °C. The heating rate was set to 2 °C/min for all samples. The deformation strain was 0.01%, while the frequency of the applied force was 1 Hz.
The heat deflection temperature (HDT) was measured using the TESTLAB RV300C apparatus, according to ISO 75 standard [46]. At least 3 samples were used for a single test. The measurements were performed at a 2 °C/min heating rate, while the applied load was 0.455 MPa.
The differential scanning calorimetry analysis (DSC) was conducted using the Netzsch Phoenix DSC F1 apparatus (Netzsch GmbH, Selb, Germany). The study was conducted under the protective nitrogen atmosphere using pierced aluminum crucibles. The samples of an average weight of 5 mg were cut from the molded specimens. The measuring procedure consists of 3 stage program (heating/cooling/heating), where tests were conducted in the range of 30–300 °C. The heating/cooling rate was set to 10 °C/min.

3. Results and Discussion

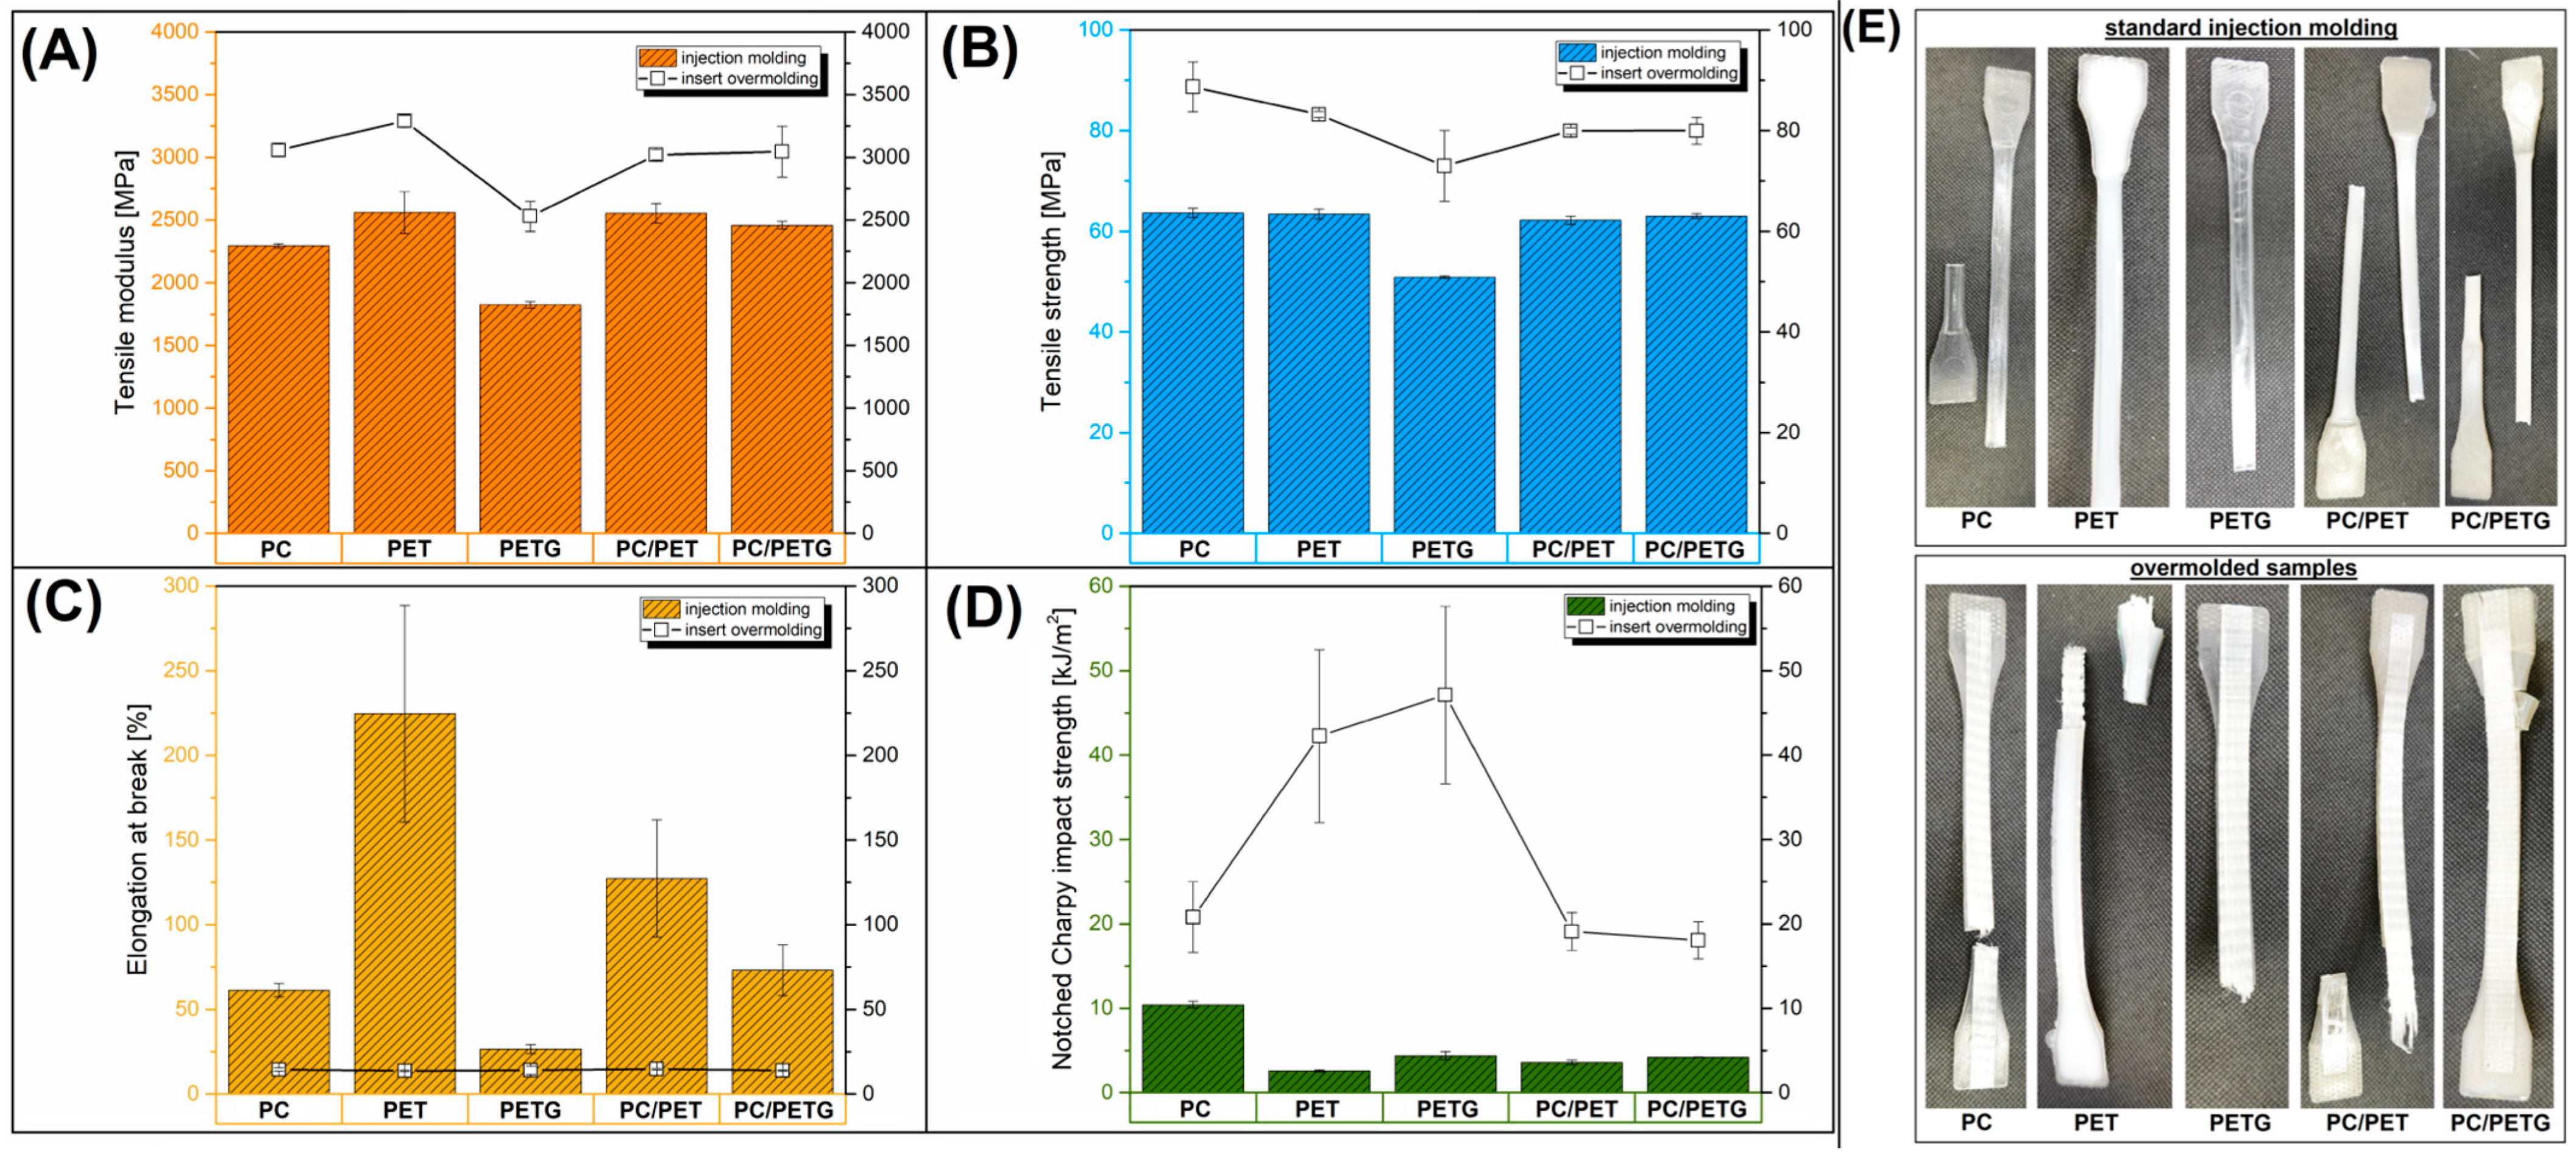
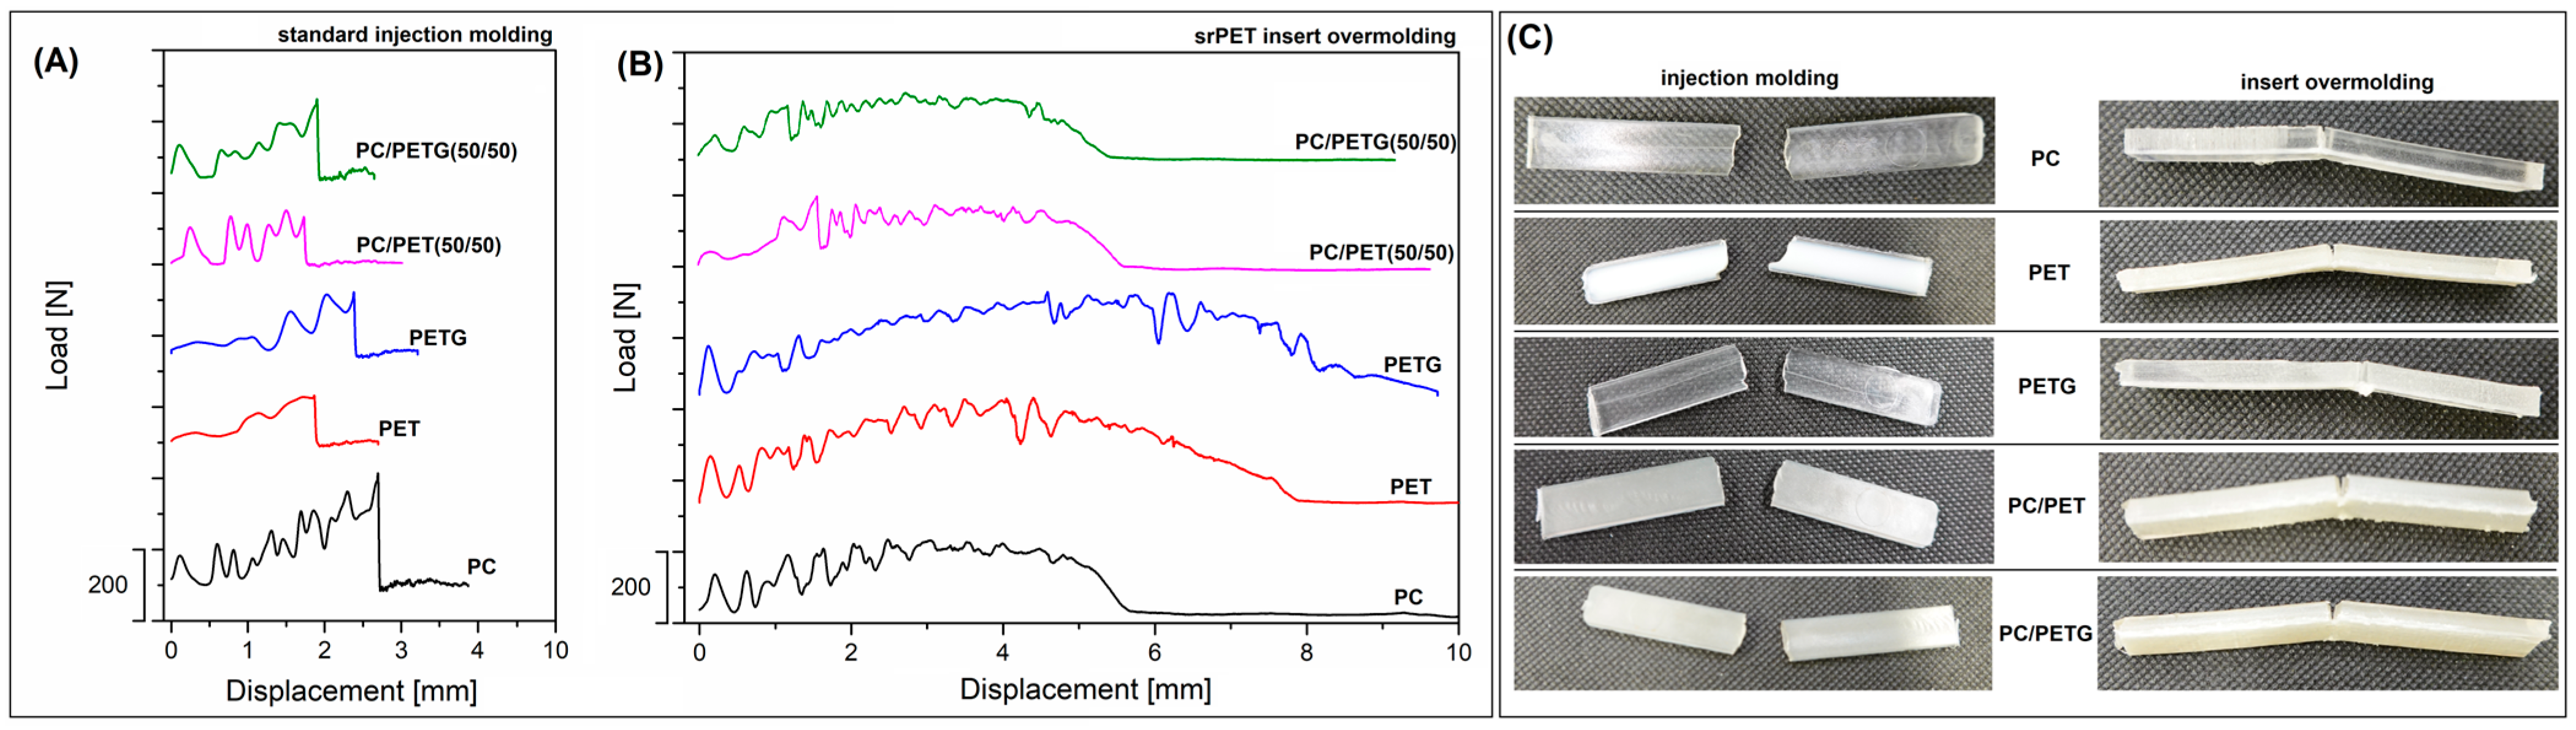
3.1. Mechanical Performance—Static Tensile Measurements and Notched Charpy Impact Tests

The results of the mechanical tests are shown in the form of plots in Figure 2, where the mean values of tensile modulus/strength together with elongation at break and impact strength are compared. Additionally, the results of the impact resistance measurements in the form of load/displacement plots and sample appearance are presented in Figure 3.
The results of the tensile modulus/strength measurements confirmed clearly that the reinforcing efficiency for all of the tested samples was a visible improvement. For most of the samples, the average tensile modulus increase was from 20 to 30%. For example, the initial modulus of pure PC and PET samples increased from initial 2295/2560 MPa to 3060/3290 MPa for srPET reinforced samples. Interestingly, the lowest tensile modulus for overmolded samples was recorded after using pure PETG as the main molded component; however, that fact is mainly caused by the lowest stiffness of that resin. Since the modulus value for pure PETG was around 1820 MPa, the overmolded sample reached 2530 MPa, which still can be considered a large reinforcement factor. The trends of changes for tensile strength are very similar to tensile modulus values. Again, the tensile strength for pure PC and PET-based samples was improved from 64/63 MPa to 89/83 MPa, while the results for PETG-based specimens were visibly lower. The results of strength/modulus results analysis for polymer blends revealed slightly similar results to pure PC and PET samples. The stiffness for injection molded and overmolded materials was almost similar for PC/PET and PC/PETG-based materials; the same conclusion applies to tensile strength values.
When comparing the results of the elongation at break values, it is clear that large differences appear for the injection molded materials, where the correlation between pure polymers is 61%, 225%, and 26%, respectively, for PC, PET, and PETG material. The results for the PC/PET(50/50) blends are the result of the properties of the component polymers reaching 127%, while for PC/PETG (50/50), the elongation of 73% was higher than the PC and PETG resin. The observed effect is quite an unexpected result because, as a rule, for polymer mixtures, most of the mechanical properties are the result of the properties of individual components being reduced in relation to them. The factor explaining this phenomenon is the partial miscibility of this polymer system, in which case the presence of two types of polymer chains may cause a plasticizing effect, where the reduction of the amorphous structure entanglement density increases the macromolecular chain mobility. It is worth noting that compared to commonly used plasticizing compounds, the visible effect is quite negligible; therefore, the effectiveness of this phenomenon is rather not practical. Interestingly, it is difficult to find descriptions of similar effects in the literature; this phenomenon is partly described for the oriented PETG/PC foils [47].
It turns out, however, that the initial differences in the properties of polymers obtained using the traditional molding technique do not have a visible effect on the properties of the samples reinforced in the overmolding method. For all samples with srPET reinforcement, the elongation at break values was close to 14%. Considering that the maximum strain for the pure srPET prepreg of around 19% is slightly higher than for overmolded specimens, this behavior may suggest the occurrence of a partial delamination process before the final fracture of the sample. More complex results are detected during the analysis of the impact resistance values, where properties of overmolded samples seem to be the most beneficial. In the case of injection molded materials, the highest impact strength was recorded for pure PC samples (10 kJ/m2), while the for the rest of the materials, the strength values did not reach 5 kJ/m2. After the introduction of the srPET insert, the impact resistance for the PC-based sample was increased to 21 kJ/m2, while for PET and PETG-based samples, even 42 kJ/m2 and 47 kJ/m2, respectively. The results for the blends were again reduced to around 19 kJ/m2. Some additional results reflecting the impact resistance of specimens are presented in the form of load/displacement plots (see Figure 3). The biggest area under the curve of the PC sample clearly revealed the highest energy necessary for sample breakage. For other samples, the distance before full fracture and maximum force of the impact was lower. Since the impact strength for overmolded samples is strongly improved, the plot appearance also differs from solid unreinforced materials. The main difference refers to a visibly longer distance before the final fracture of the specimen. The longest displacement was recorded for PET and PETG-based samples, while for PC-based material and both types of blends, the distance was visibly smaller. Interestingly, the maximum force difference was not significant. When considering the unreinforced samples, the maximum load reached around 300 N for pure PC, while the force did not reach 200 N for the rest of the materials. For insert reinforced PC, the maximum load reached 200 N, while for PC-based blends, the force values were lower (≈175 N). Visibly higher values of around 300 N were recorded for PET and PETG-based specimens. However, the load/force value difference cannot be considered significant since the fluctuations had a percentage dimension, while the change in fracture distance (time) was several times greater for the reinforced samples. The appearance of samples after the impact test is shown in Figure 3C. The photos reveal brittle fractures for all of the injection molded materials; even for PC specimens, the fracture surface does not show plastic deformation, as is usually the case for samples based on this polymer. The obvious reason for the deterioration of PC properties is the influence of secondary processing (recycling). The sample appearance for overmolded insert materials revealed a lack of srPET insert fracture, while the molded part of the specimen was cracked for most of the specimen.

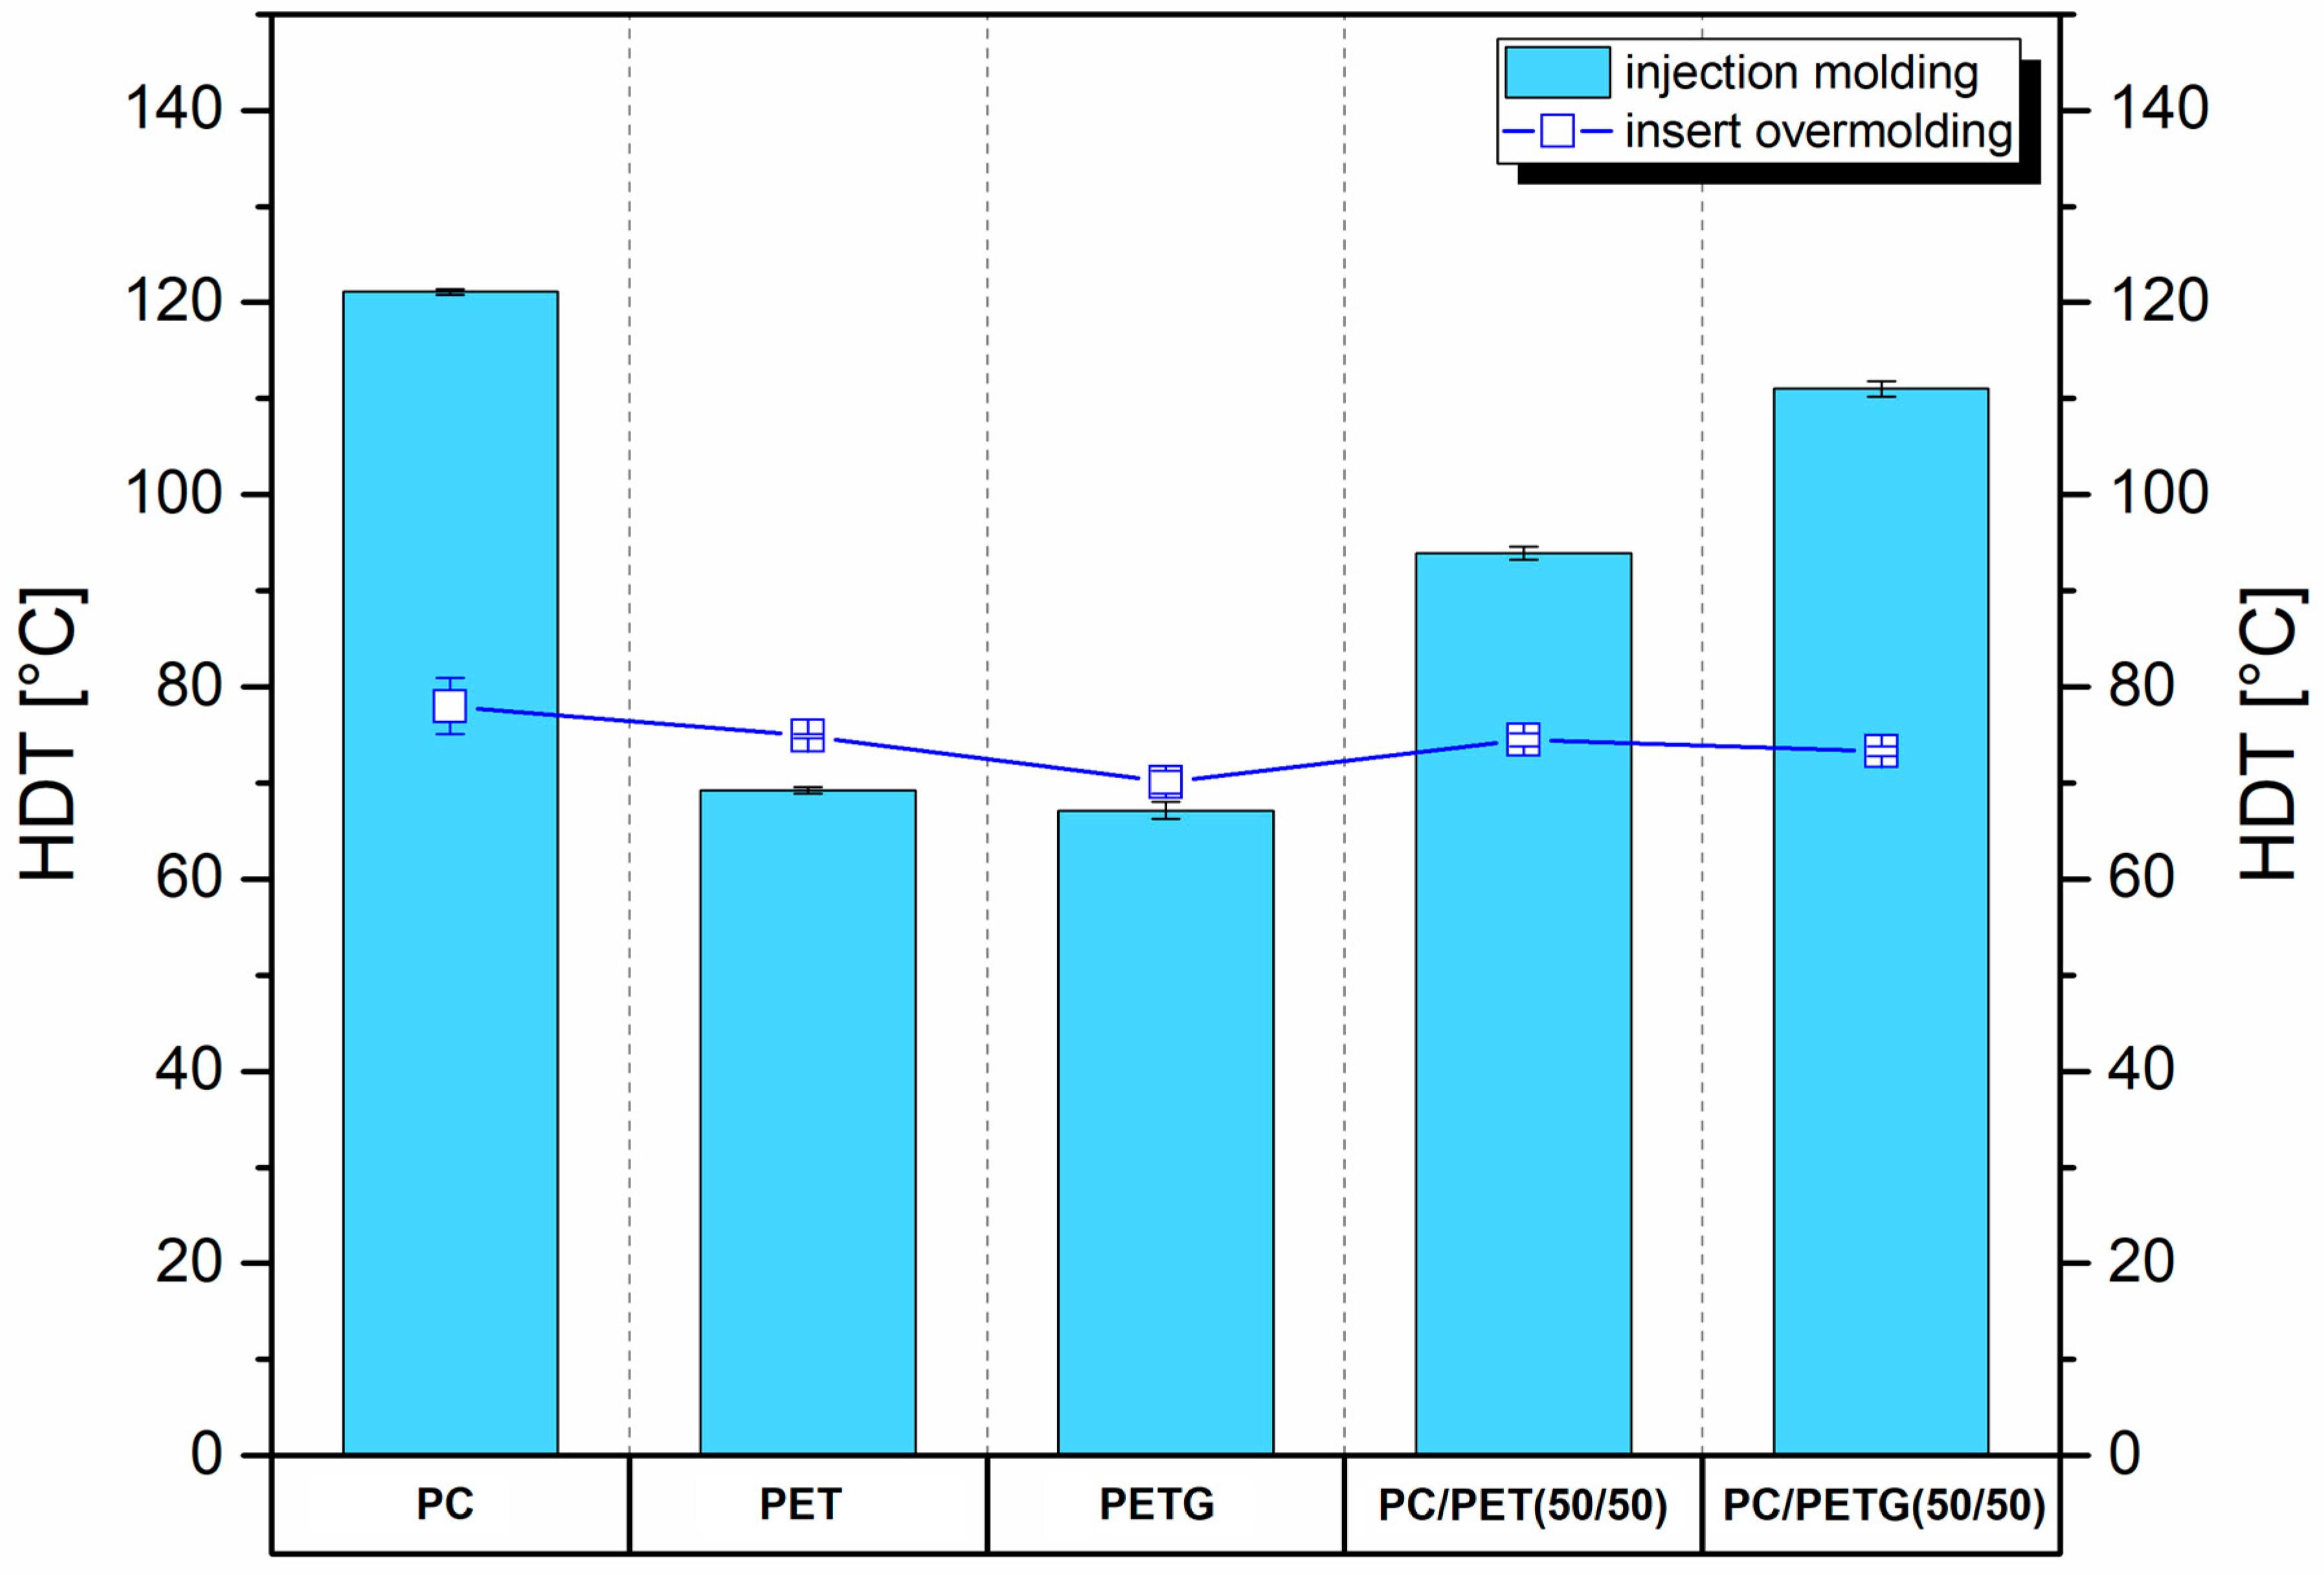
3.2. Thermomechanical Properties—DMTA Analysis/HDT Tests

One of the main reasons for using PC in the presented study was its high thermomechanical properties, including HDT/Vicat test results. The analysis of the prepared materials was conducted using DMTA measurements and heat deflection tests (HDT). The storage modulus and tan δ plots are collected in Figure 4, while the recorded HDT temperature results are revealed in Figure 5.
The results of the storage modulus analysis for pure polymers (see Figure 4A) revealed a large difference between polycarbonate (PC) resin and both types of polyesters (PET, PETG). The plateau region where the stiffness of samples can be considered stable for PC reached around 130 °C, while for both polyesters, its around 60 °C; exceeding this limit defines the range of the glass transition, where due to the increase in mobility of polymer chains the storage modulus drops significantly. Interesting differences can be noticed for PC-based blends where the plot appearance was different depending on the polyester type. For PC/PET material, the initial value of the storage modulus was slightly higher than for other samples; however, considering the small magnitude of this difference, this fact can be neglected. More importantly, the stiffness drop starts in the same temperature range as that of pure PET sample, and despite the use of 50% PC in the structure, the decrease in stiffness is almost identical to that of pure PET or PETG. The modulus value at 100 °C does not exceed 10% of the value obtained at room temperature. Different behavior applies to PC/PETG samples, where the appearance of the curve suggests clear changes in the phase characteristics. For this material, the initial drop of stiffness at around 60 °C cannot be confirmed; the storage modulus plateau reached almost 90 °C; however, even above this limit, the stiffness drop is not so evident as for PC/PET blend since the rubbery state plateau is reached at around 130 °C. Changes of this type clearly indicate differences in the miscibility of PC/PET and PC/PETG systems, which is confirmed by the tan δ curve analysis results.
For both types of pure polyesters, the glass transition temperature (Tg) was at the same level of 85 °C; the differences in the peak height reflect the content of the crystalline phase in PET resin. The Tg peak for the PC sample reached 160 °C, while the dominating amorphous character of this resin is also confirmed by the relatively higher maximum point of the transition peak. The interesting details are revealed for blended samples, where for the PC/PET sample, two peaks can be distinguished, while for the PC/PETG sample, only one peak. This fact clearly confirms the difference in phase miscibility for this type of blend. In the case of PC/PET material, the first peak at around 85 °C strongly corresponds with the Tg of the PET phase, an interesting phenomenon is the surface area under the tan δ curve in the glass transition region, where the area for PET and PC/PET blend coincides. Such behavior would suggest a significant increase in the content of the amorphous phase of the PET phase in the mixture, but it is one of the assumptions regarding the observed phenomenon. Another tan δ peak appears at around 140 °C during the further temperature increase. The location of the peak near the Tg range for PC confirmed the PC-PET system miscibility; however, it is also evident that this phenomenon is also limited. The lack of changes in the glass transition of the PET phase shows that a significant volume of this polymer is not miscible with the PC phase; such a phenomenon is typical for semi-crystalline polymers where the crystalline phase domains are surrounded by the rigid amorphous fraction (RAF) [48,49]. In this case, only a part of the PET chains in the form of a mobile amorphous fraction can be part of a homogeneous PC/PET mixture.
Contrary to the PC/PET blend, where the miscibility phenomenon seems to be present only for part of the mixture, the tan δ plots confirmed that for PC/PETG materials, the blending procedure led to the formation of a homogenous polymer mixture. The full miscibility is confirmed by the presence of a single tan δ peak at around 130 °C. Compared to pure PET resin, PETG copolymer is characterized by a fully amorphous structure, which means that the chain mobility on not limited by the presence of rigid amorphous fraction (RAF). Both PETG and PC chains can interact during the extrusion blending process, which leads to the formation of a homogenous melt. During the cooling of the material, there is no separation of the crystalline phase, as in the case of the PC-PET system.
The comparison of the storage modulus and tan δ plots for injection molded samples (Figure 4A,C) reflects the reference viscoelastic properties of pure polymers and prepared blends. The rest of the plots present the DMA analysis for insert reinforced specimens, where the properties of the samples are the resultant of the injection molded part and the srPET insert. The DMTA plots for pure srPET prepreg are also attached for comparison purposes. The storage modulus analysis results confirmed the overmolding procedure reinforcing effect since the initial values of the modulus recorded close to the room temperature are visibly higher than for unreinforced samples. In addition to the increase in stiffness, there are also clear differences in the modulus values for individual samples. The highest stiffness was recorded for pure srPET prepreg; however, the results for PC/PET and PC/PETG samples are only slightly lower. Another decrease in modulus was detected for PC and PET material, while the lowest stiffness refers to the PETG sample. It may be somewhat surprising that the stiffness for the srPET prepreg under these conditions is only slightly higher than the value for the molded samples. However, in the case of DMTA measurements in the torsion mode, the anisotropy of the tested sample is of great importance, which is unfavorable for the tested prepregs, because it does not allow testing the stiffness samples along the reinforcement fibers. Taking into account that the analysis is to indicate the trends of changes in the modulus value, the exact determination of the modulus value in all directions would be a redundant procedure. Due to the nature of the analyzed thermomechanical properties, a more important fact is the change in the softening process initiation temperature of the tested materials, which is slightly lower after the introduction of the prepreg. The onset of the storage modulus reduction was recorded at around 65 °C for most of the samples, even for PC-based overmolded specimens. It is lower than 75 °C for standard injection molding procedure.
It is clear that this type of behavior was caused by the presence of insert reinforcement, especially the LPET copolymer used as the matrix for oriented PET fibers. When shifted to tan δ plots, it is clear that the first peak at around 75 °C reflects the Tg for the LPET matrix in the srPET insert. The most visible signal for LPET is visible for the sample made of the srPET prepreg alone; however, similar peaks of slightly lower intensity are recorded for each of the samples. The second of the visible Tg peaks area is recorded around 85 °C and corresponds to samples where for the overmolding procedure, we use PET, PETG, and PC/PET blend. The remaining tan δ peaks are also related to the previously analyzed tan δ curves, where for PC+insert samples, a clear Tg peak occurs at 160 °C, while for the PC/PETG mixture, the Tg value is again around 130 °C. It is worth noting that a common feature of the tan δ diagrams for overmolded samples is a slightly smaller area under the curves in the area of glass transitions; this phenomenon is a consequence of replacing part of the molded material with a layer of srPET prepreg.
Summarizing the results of the DMTA analysis for overmolded samples, it is worth noting that for most materials, the introduction of the prepreg did not improve the thermomechanical properties since only for samples prepared using pure PC and PC/PETG blend the storage modulus values above the main glass transition region was relatively high. For these two materials, the stiffness drop takes place in two stages. The first loss in thermomechanical properties should be associated with the softening range of the srPET prepreg, while the second final decrease is associated with the loss of properties by the overmoulded material. The expected heat resistance for the rest of the prepared samples should be lower than for injection molded samples since the onset of the softening process occurs at lower temperatures. Additionally, the storage modulus loss takes place in one step since the main Tg area of the LPET matrix is very close to overmolded PET, PETG, and PC/PET material.
The DMTA analysis is complemented by the HDT studies presented in Figure 5. The results of the standard injection molded samples are compared with counterparts obtained by the overmolding process. The results for standard specimens confirmed the highest HDT for pure PC material (121 °C), while for both polyesters, the heat resistance was visibly lower, reaching 69 °C and 67 °C, respectively, for PET and PETG material. It is clear that the HDT values are strongly correlated with the Tg area of pure polymers. For prepared blends, the HDT coefficient values are the result of the components’ properties, where the HDT results for PC/PET were around 94 °C, and for PC/PETG, 111 °C. In particular, the result for the PC/PETG sample reflects the positive effect of miscibility for this polymer system, which allows for better properties than the other samples. It is worth noting that the measurements were carried out with a load of 1.8 MPa, as for technical plastics, such as polyamide or epoxy resins, so the obtained results can be considered very good from the perspective of applications. Unfortunately, comparing the reference results with the samples subjected to the overmolding process, it is clearly visible that the prepreg insertion has a negative impact on the obtained thermomechanical properties, which was also partly suggested by the DMTA analysis. The highest HDT was recorded again for the overmolded PC sample; however, the recorded deflection point reached only 78 °C; for the rest of the samples, the results oscillated between in the range of 70–75 °C, which for most of the materials is lower than the reference value. It is clear that the obtained reduction in heat resistance was caused by the presence of srPET prepreg since the HDT value for this material was around 72.5 °C.
The measurements clearly confirm that despite the use of materials with increased thermomechanical properties at the stage of overmolding, the low softening point for the used srPET reinforcing insert is the main reason for the deterioration of heat resistance.

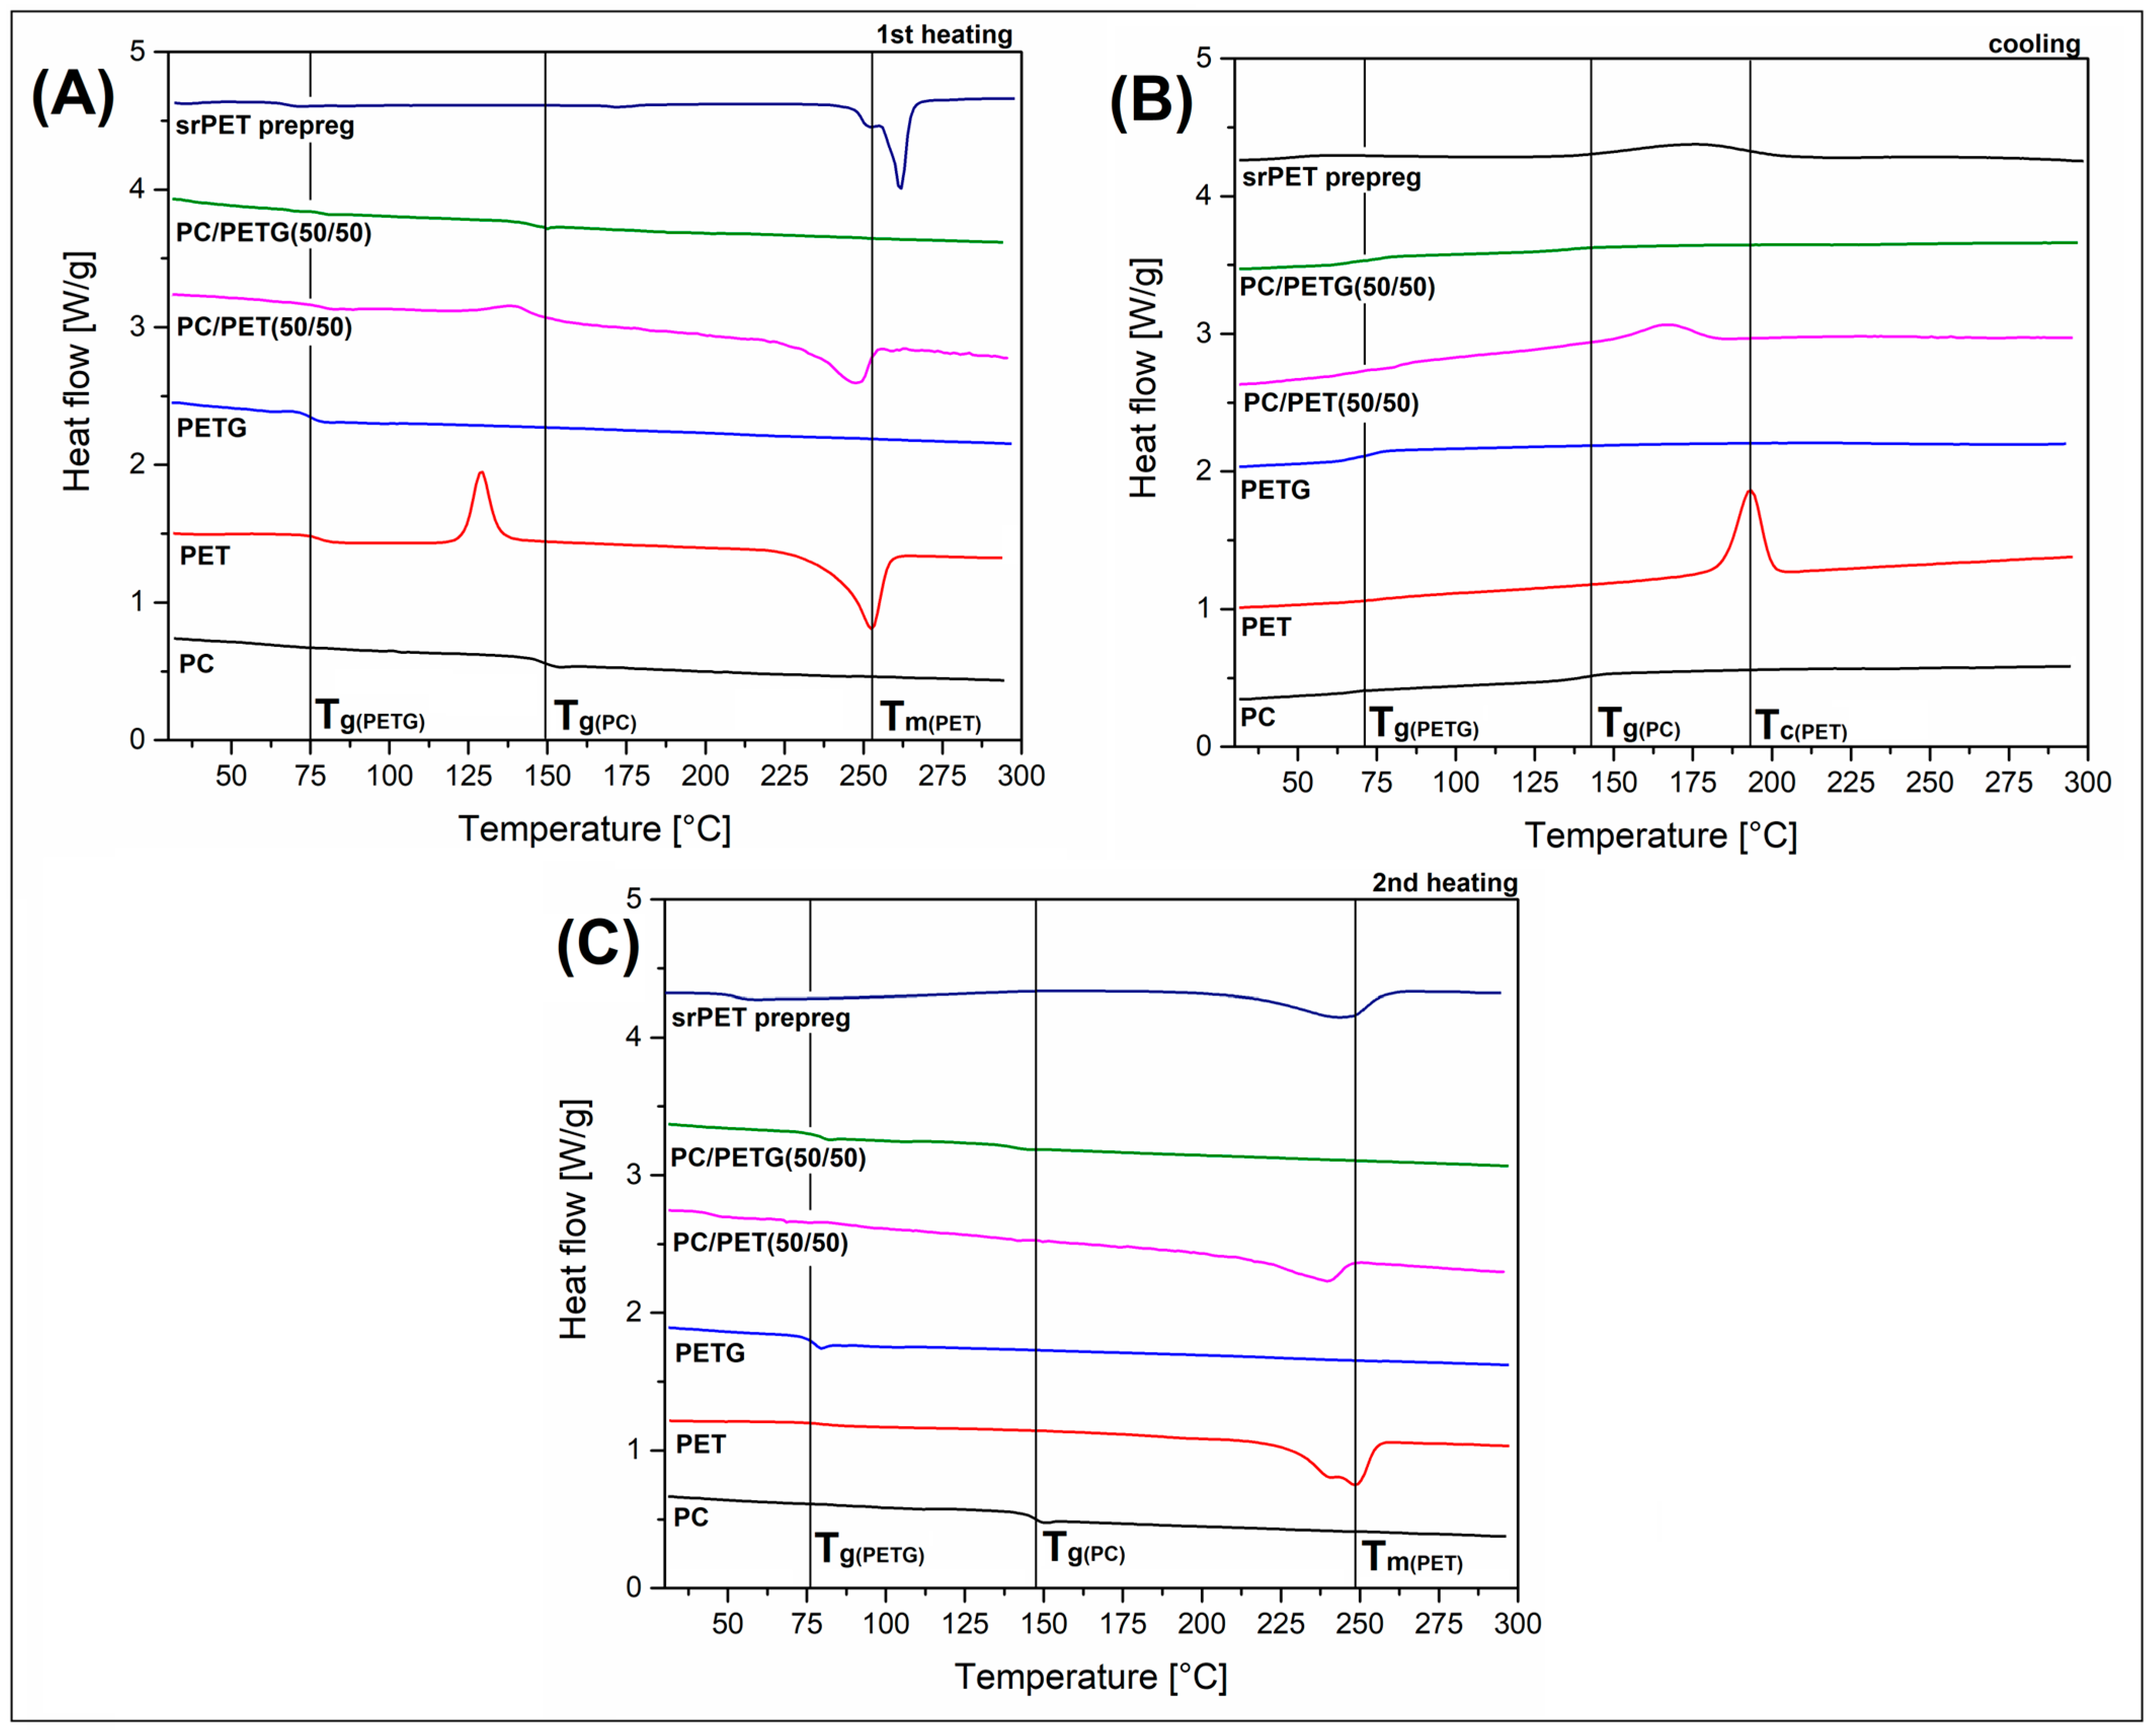
3.3. Phase Transition Measurements—DSC Analysis

The DSC measurements are presented in the form of 1st heating, cooling, and 2nd heating thermograms (see Figure 6). Tests were conducted for samples prepared by the injection molding process, while for comparison, the plots were combined with the results for srPET prepreg. The main reason for conducting these measurements was the evaluation of the glass transition regions for amorphous polymers and the melting temperature for the PET phase. The figures with more detailed plots of the DSC measurements are presented in the Supplementary Materials, separately for 1st heating (Figure S1), cooling (Figure S2), and 2nd heating (Figure S3).
In the case of pure amorphous materials, which refer to PC and PETG resin, the Tg appears as the inflection point of the DSC signal curve. There is a clear difference between PC, where inflection was recorded at 148 °C, and while for PETG sample at 75 °C. In the case of DSC results, the indication of the glass transition temperature may have a slightly different value than for mechanical measurements, such as DMTA or TMA; however, in the case of changes in the Tg temperature range, they are visible for each of the thermal analysis techniques. Interestingly, for the amorphous PC/PETG blend, the position of Tg inflection points related to the PC and PETG phase were not shifted; however, the intensity of the baseline signal change has clearly decreased, which results from the decrease in the volume of the analyzed phase in relation to the pure material. For PET-based samples, the presence of a partly crystalline structure leads to the appearance of two visible peaks. The first exothermic peak with the maximum point at around 130 °C refers to the cold crystallization (Tcc) phenomenon, while the final melting of the PET crystalline phase was recorded at 255 °C. It is clear that for blended samples, the peak position was slightly shifted. The temperature of the melting point was lower, while the cold crystallization peak appeared at a higher temperature. That behavior is related to the disturbance in the PET crystalline phase structure. The presence of the PC chains limits the freedom of PET polymer chains movement, which consequently causes the formation of a crystalline structure with disturbed morphology and a shorter length of lamellae [50,51]. The analysis of the DSC signal for the srPET prepreg reveals some interesting information about this material. Since the matrix phase for this polymer consists of a low melting type of polyester resin (LPET), the Tg region was close to other polyester-based samples; however, compared to PET or PETG specimens, the inflection of the plot was slightly reduced to around 65 °C. Since the reinforcing prepreg was made from highly oriented PET fibers (HTPET), the cold crystallization phenomenon did not occur. Another noteworthy fact was related to the position of the melting point area, where the peak position was visibly higher than for standard PET resin. The position of the peak maximum was recorded at around 262 °C. That behavior is typical during the melting of oriented materials since the macromolecular structure of the fiber is characterized by a high level of crystallinity and resulting in improved thermal stability.
The cooling thermograms presented In Figure 6B did not reveal any untypical features. For amorphous PC and PETG samples, the glass transition area was at a similar level compared to 1st heating stage. More complex results are revealed for PET-based samples, where the exothermic peaks are recorded at different temperatures. Unlike the injection molded samples, the PET phase used for the preparation of srPET prepreg was made from a different type of resin, which is why the properties cannot be compared to other samples. Interestingly, for pure PET and PC/PET samples, the crystallization peak position also differs; however, it is relatively clear to combine this behavior with the formation of a partly miscible polymer melt structure where the formation of crystal lamellae is hindered [30,33,37].
The 2nd heating stage of the DSC measurements, presented in Figure 6C, revealed that most of the properties observed during the initial heating are confirmed, especially regarding the glass transition region. The basic differences are related to the remelting of the sample structure and the subsequent cooling at a relatively slow rate (10 °C/min) compared to the molding procedure. A typical phenomenon for measurements of the 2nd heating stage is the disappearance of the cold crystallization peaks, resulting from the already mentioned slow cooling rate and crystallization of the PET phase. The melting point for the pure PET sample was slightly shifted to 247 °C; however, there is an additional peak that appears at around 240 °C. That phenomenon is quite typical for thermoplastic polyesters, especially PET or PLA since the crystalline phase tends to form less organized structures. The additional peak reflects the presence of smaller and less ordered crystalline forms. Interestingly, for PC/PET blend, the temperature of the main melting peak coincides with the additional peak for the pure PET sample. This behavior again indicates the presence of limited mobility of polymer chains in PC/PET systems, which results in the dominance of smaller lamellar structures of the PET crystalline phase. The difference between the appearance of the 1st and 2nd heating plot also refers to the srPET material. The main visible change, besides the lack of a cold crystallization peak, is the shifting of the melting point. Similar to other samples, the peak position was lower than for the unheated specimen; however, this time, the difference reached around 20 °C. Such a large difference in the melting point cannot be solely due to differences in the size of the forming crystal structures. Therefore, it is worth explaining that the high melting point for the structures tested during the 1st heating stage results in both from the higher stability of the crystalline structures of the fibers, but also from the stresses inside the composite structure, which are caused by the stretching of the fibers during the bonding process. It is worth explaining that the phenomenon of a double peak occurring during the melting of the crystalline structure of PET fibers for the srPET sample has a slightly different character than for the PET material shaped by injection molding. Since the fiber grades of PET resin have lower molecular weight, the formation of the crystalline structure is facilitated. For this reason, the crystalline structure is more homogeneous, and there are no variations in the size of the lamellae, leading to double peak formation.
Summarizing the results of the DSC analysis, it is worth emphasizing that the macromolecular structure for the prepared polymer blends is clearly different from that represented by pure materials. In the case of PC/PET and PC/PETG systems, the occurrence of at least partial miscibility is confirmed, which affects the interactions between polymer chains and the formation of the phase system after the production process.

4. Conclusions

It is clear that the preliminary assumptions regarding the possible increase in thermomechanical properties turned out to be incorrect. The measurements for the prepared blends indicated an improvement in the HDT temperature; compared to PET, an increase of 24 °C and 41 °C was recorded for PC/PET and PC/PETG material, respectively. However, for overmolded samples, the HDT did not reach 80 °C even for pure PC-based specimens, which clearly shows that the low thermal resistance of the srPET prepreg determines the properties of the overmoulded part, regardless of the material used during the injection molding stage. A detailed analysis of the course of changes in stiffness as a function of time (DMTA analysis) clearly confirmed that the main reason for the low heat resistance of the obtained samples is the intensive softening process of the LPET matrix, which is the main component of srPET composites. Despite the fact that the overmoulded component for selected samples (PC or PC/PETG) shows a significant value of the storage module above 100 °C; however, the loss of thermal stability by the insert leads to the weakening of the entire product.
Despite the fact that the thermomechanical properties turned out to be unsatisfactory, the remaining functional properties, including key mechanical characteristics, such as impact strength, indicate the beneficial effect of using a reinforcing prepreg. The initial impact strength for pure PC increased by double after the introduction of the insert, from 10 kJ/m2 to 21 kJ/m2. Much greater improvement took place for polymer blends, where for PC/PET and PC/PETG materials, the values increased from the initial 3.6/4.2 kJ/m2 to 19.1/18.0 kJ/m2.
Taking into account the results of the conducted research, it is possible to point to some general conclusions:
-
the research confirmed the possibility of permanent connection of srPET composites with polymer blends of several types,
-
the use of recycled origin materials was proven to be possible,
-
the developed method does not require a complicated prepreg plasticizing procedure.
An important advantage of using PC/PET mixtures in the context of comparison with PC is their better chemical resistance and less susceptibility to environmental cracking, which better allows you to expand the application field. Considering the main advantages of the developed materials, the automotive industry is the most prospective application area. In particular, the unloaded elements of the car structure, such as door panels, dashboard panels, and fenders. For most of these parts, high impact strength is required more than high stiffness, while the key aspect is the tendency to reduce the weight of these products, which would be possible with the overmolding technique.
Summarizing all of the performed tests, it is worth noticing that although the main expected improvement in the heat resistance has not been achieved, the obtained properties are satisfactory. The future work plan will include the use of glass/carbon fiber reinforced composites in combination with self-reinforced materials, which will probably allow for a more pronounced increase in thermal stability.

Supplementary Materials

The following supporting information can be downloaded at: https://www.mdpi.com/article/10.3390/su151411318/s1, Figure S1: The DSC 1st heating stage thermograms for overmolded materials and srPET prepreg; Figure S2: The DSC cooling stage thermograms for overmolded materials and srPET prepreg; Figure S3: The DSC 2nd stage heating thermograms for overmolded materials and srPET prepreg.

Funding

This research was funded by the Ministry of Education and Science in Poland as part of the statutory subsidy for the Poznan University of Technology, project no. 0613/SBAD/4820. The srPET composites were kindly supplied by Tore Bak from the Comfil ApS company, while the PET materials were supplied by Michał Grzelak from GTX Hanex Plastic.

Informed Consent Statement

Not applicable.

Data Availability Statement

The data presented in this study are available on request from the corresponding author.

Conflicts of Interest

The author declares no conflict of interest.

References

  1. Capiati, N.J.; Porter, R.S. The Concept of One Polymer Composites Modelled with High Density Polyethylene. J. Mater. Sci. 1975, 10, 1671–1677. [Google Scholar] [CrossRef]
  2. Kmetty, Á.; Bárány, T.; Karger-Kocsis, J. Self-Reinforced Polymeric Materials: A Review. Prog. Polym. Sci. 2010, 35, 1288–1310. [Google Scholar] [CrossRef]
  3. Karger-Kocsis, J.; Bárány, T. Single-Polymer Composites (SPCs): Status and Future Trends. Compos. Sci. Technol. 2014, 92, 77–94. [Google Scholar] [CrossRef] [Green Version]
  4. Ward, I.M.; Hine, P.J. The Science and Technology of Hot Compaction. Polymer 2004, 45, 1413–1427. [Google Scholar] [CrossRef]
  5. Santos, R.A.M.; Gorbatikh, L.; Swolfs, Y. Commercial Self-Reinforced Composites: A Comparative Study. Compos. Part B Eng. 2021, 223, 109108. [Google Scholar] [CrossRef]
  6. Romhány, G.; Bárány, T.; Czigány, T.; Karger-Kocsis, J. Fracture and Failure Behavior of Fabric-Reinforced All-Poly(Propylene) Composite (Curv®). Polym. Adv. Technol. 2007, 18, 90–96. [Google Scholar] [CrossRef]
  7. Izer, A.; Bárány, T.; Varga, J. Development of Woven Fabric Reinforced All-Polypropylene Composites with Beta Nucleated Homo- and Copolymer Matrices. Compos. Sci. Technol. 2009, 69, 2185–2192. [Google Scholar] [CrossRef]
  8. Deng, H.; Reynolds, C.T.; Cabrera, N.O.; Barkoula, N.-M.; Alcock, B.; Peijs, T. The Water Absorption Behaviour of All-Polypropylene Composites and Its Effect on Mechanical Properties. Compos. Part B Eng. 2010, 41, 268–275. [Google Scholar] [CrossRef]
  9. Schneider, C.; Velea, M.N.; Kazemahvazi, S.; Zenkert, D. Compression Properties of Novel Thermoplastic Carbon Fibre and Poly-Ethylene Terephthalate Fibre Composite Lattice Structures. Mater. Des. 2015, 65, 1110–1120. [Google Scholar] [CrossRef] [Green Version]
  10. Poulikidou, S.; Schneider, C.; Björklund, A.; Kazemahvazi, S.; Wennhage, P.; Zenkert, D. A Material Selection Approach to Evaluate Material Substitution for Minimizing the Life Cycle Environmental Impact of Vehicles. Mater. Des. 2015, 83, 704–712. [Google Scholar] [CrossRef] [Green Version]
  11. Jerpdal, L.; Åkermo, M. Influence of Fibre Shrinkage and Stretching on the Mechanical Properties of Self-Reinforced Poly(Ethylene Terephthalate) Composite. J. Reinf. Plast. Compos. 2014, 33, 1644–1655. [Google Scholar] [CrossRef]
  12. Rojanapitayakorn, P.; Mather, P.T.; Goldberg, A.J.; Weiss, R.A. Optically Transparent Self-Reinforced Poly(Ethylene Terephthalate) Composites: Molecular Orientation and Mechanical Properties. Polymer 2005, 46, 761–773. [Google Scholar] [CrossRef]
  13. Beauson, J.; Schillani, G.; Van der Schueren, L.; Goutianos, S. The Effect of Processing Conditions and Polymer Crystallinity on the Mechanical Properties of Unidirectional Self-Reinforced PLA Composites. Compos. Part A Appl. Sci. Manuf. 2022, 152, 106668. [Google Scholar] [CrossRef]
  14. Goutianos, S.; Van der Schueren, L.; Beauson, J. Failure Mechanisms in Unidirectional Self-Reinforced Biobased Composites Based on High Stiffness PLA Fibres. Compos. Part A Appl. Sci. Manuf. 2019, 117, 169–179. [Google Scholar] [CrossRef]
  15. Salahuddin, B.; Mutlu, R.; Baigh, T.A.; Alghamdi, M.N.; Aziz, S. Self-Reinforced Nylon 6 Composite for Smart Vibration Damping. Polymers 2021, 13, 1235. [Google Scholar] [CrossRef]
  16. Gong, Y.; Liu, A.; Yang, G. Polyamide Single Polymer Composites Prepared via in Situ Anionic Polymerization of ε-Caprolactam. Compos. Part A Appl. Sci. Manuf. 2010, 41, 1006–1011. [Google Scholar] [CrossRef]
  17. Bhattacharyya, D.; Maitrot, P.; Fakirov, S. Polyamide 6 Single Polymer Composites. Express Polym. Lett. 2009, 3, 525–532. [Google Scholar] [CrossRef]
  18. Andrzejewski, J.; Przyszczypkowski, P.; Szostak, M. Development and Characterization of Poly(Ethylene Terephthalate) Based Injection Molded Self-Reinforced Composites. Direct Reinforcement by Overmolding the Composite Inserts. Mater. Des. 2018, 153, 273–286. [Google Scholar] [CrossRef]
  19. Poulikidou, S.; Jerpdal, L.; Björklund, A.; Åkermo, M. Environmental Performance of Self-Reinforced Composites in Automotive Applications—Case Study on a Heavy Truck Component. Mater. Des. 2016, 103, 321–329. [Google Scholar] [CrossRef]
  20. Begum, S.A.; Rane, A.V.; Kanny, K. Applications of Compatibilized Polymer Blends in Automobile Industry; Elsevier Inc.: Amsterdam, The Netherlands, 2019; ISBN 9780128160060. [Google Scholar]
  21. Evstatiev, M.; Nicolov, N.; Fakirov, S. Morphology of Microfibrillar Reinforced Composites PET/PA 6 Blend. Polymer 1996, 37, 4455–4463. [Google Scholar] [CrossRef]
  22. Yan, Y.; Huang, Y.H.; Wang, Y.; Xiao, Z.C.; Yang, M.B. Polyamide 6 (PA6) /Polyethylene Terephthalate (PET) Blends with Gradient and Encapsulation Structure Developed by Injection Molding. Polymer 2019, 180, 121679. [Google Scholar] [CrossRef]
  23. Tanaka, F.H.; Cruz, S.A.; Canto, L.B. Morphological, Thermal and Mechanical Behavior of Sepiolite-Based Poly(Ethylene Terephthalate)/Polyamide 66 Blend Nanocomposites. Polym. Test. 2018, 72, 298–307. [Google Scholar] [CrossRef]
  24. Evstatiev, M.; Fakirov, S.; Bechtold, G.; Friedrich, K. Structure-Property Relationships of Injection- and Compression-Molded Microfibrillar-Reinforced PET/PA-6 Composites. Adv. Polym. Technol. 2000, 19, 249–259. [Google Scholar] [CrossRef]
  25. Cook, W.D.; Zhang, T.; Moad, G.; Van Deipen, G.; Cser, F.; Fox, B.; O’Shea, M. Morphology-Property Relationships in ABS/PET Blends. I. Compositional Effects. J. Appl. Polym. Sci. 1996, 62, 1699–1708. [Google Scholar] [CrossRef]
  26. Rivas, B.L.; Pereira, E.D. Blends of Acrylonitrile-Butadiene-Styrene/Waste Poly(Ethylene Terephthalate) Compatibilized by Styrene Maleic Anhydride. J. Appl. Polym. Sci. 2001, 80, 2593–2599. [Google Scholar] [CrossRef]
  27. Oral, M.A.; Ersoy, O.G.; Serhatli, E. Effect of Acrylonitrile–Butadiene–Styrene/Polyethylene Terephthalate Blends on Dimensional Stability, Morphological, Physical and Mechanical Properties and after Aging at Elevated Temperature. J. Plast. Film Sheeting 2018, 34, 394–417. [Google Scholar] [CrossRef]
  28. Wu, Y.H.; Wang, C.C.; Chen, C.Y. Nucleation Effect of Aliphatic Polycarbonate in Its Blends with Poly(Ethylene Terephthalate). Mater. Chem. Phys. 2020, 248, 122920. [Google Scholar] [CrossRef]
  29. Jiang, J.; Wang, S.; Hou, J.; Zhang, K.; Wang, X.; Li, Q.; Liu, G. Effect of Injection Velocity on the Structure and Mechanical Properties of Micro Injection Molded Polycarbonate/Poly(Ethylene Terephthalate) Blends. Mater. Des. 2018, 141, 132–141. [Google Scholar] [CrossRef]
  30. Marchese, P.; Celli, A.; Fiorini, M. Influence of the Activity of Transesterification Catalysts on the Phase Behavior of PC-PET Blends. Macromol. Chem. Phys. 2002, 203, 695–704. [Google Scholar] [CrossRef]
  31. Luo, F.; Liu, X.; Liu, C.; Ma, J.; Wang, X.; Shen, C. Dynamic Viscoelasticity and Molecular Orientation in Uniaxially Drawn PC/PET Blends. J. Appl. Polym. Sci. 2019, 136, 47514. [Google Scholar] [CrossRef]
  32. Montaudo, G.; Puglisi, C.; Samperi, F. Mechanism of Exchange in PBT/PC and PET/PC Blends. Composition of the Copolymer Formed in the Melt Mixing Process. Macromolecules 1998, 31, 650–661. [Google Scholar] [CrossRef]
  33. Ishigami, A.; Kodama, Y.; Wagatsuma, T.; Ito, H. Evaluation of Structures and Morphologies of Recycled PC/PET Blends Fabricated by High-Shear Kneading Processing. Int. Polym. Process. 2017, 32, 568–573. [Google Scholar] [CrossRef]
  34. Nassar, T.R.; Paul, D.R.; Barlow, J.W. Polyester–Polycarbonate Blends. II. Poly(Ethylene Terephthalate). J. Appl. Polym. Sci. 1979, 23, 85–99. [Google Scholar] [CrossRef]
  35. Srithep, Y.; Pholharn, D.; Dassakorn, A.; Morris, J. Effect of Chain Extenders on Mechanical and Thermal Properties of Recycled Poly (Ethylene Terephthalate) and Polycarbonate Blends. IOP Conf. Ser. Mater. Sci. Eng. 2017, 213, 012008. [Google Scholar] [CrossRef]
  36. Jerpal, L.; Schuette, P.; Ståhlberg, D.; Åkermo, M. Influence of temperature during overmolding on the tensile modulus of self-reinforced poly(ethylene terephthalate) insert. J. Appl. Polym. Sci. 2020, 137, 48334. [Google Scholar] [CrossRef]
  37. da Silva, A.M.G.; de Barcelos, K.A.; da Silva, M.C.; Morelli, C.L. Blend of Recycled Poly(Ethylene Terephthalate) and Polycarbonate with Polyaniline for Antistatic Packaging. Polym. Polym. Compos. 2020, 28, 331–337. [Google Scholar] [CrossRef]
  38. Nofar, M.; Oğuz, H. Development of PBT/Recycled-PET Blends and the Influence of Using Chain Extender. J. Polym. Environ. 2019, 27, 1404–1417. [Google Scholar] [CrossRef]
  39. Celik, Y.; Shamsuyeva, M.; Endres, H.J. Thermal and Mechanical Properties of the Recycled and Virgin PET—Part I. Polymers 2022, 14, 1326. [Google Scholar] [CrossRef]
  40. Szymczak, P.; Dziadowiec, D.; Andrzejewski, J.; Szostak, M. The Efficiency Evaluation of the Reactive Extrusion Process for Polyethylene Terephthalate (PET). Monitoring of the Industrial Foil Manufacturing Process by In-Line Rheological Measurements. Appl. Sci. 2023, 13, 3434. [Google Scholar] [CrossRef]
  41. Zicans, J.; MerijsMeri, R.; Ivanova, T.; Berzina, R.; Kalkis, V.; Maksimov, R. Recycled Polycarbonate Blend as Matrix for Development of Polymer Nanocomposite. Macromol. Symp. 2012, 321–322, 221–224. [Google Scholar] [CrossRef]
  42. Khan, M.M.K.; Hilado, C.J.; Agarwal, S.; Gupta, R.K. Flammability Properties of Virgin and Recycled Polycarbonate (PC) and Acrylonitrile-Butadiene-Styrene (ABS) Recovered from End-of-Life Electronics. J. Polym. Environ. 2007, 15, 188–194. [Google Scholar] [CrossRef]
  43. Andrzejewski, J.; Szostak, M. Preparation of Hybrid Poly(Lactic Acid)/Flax Composites by the Insert Overmolding Process: Evaluation of Mechanical Performance and Thermomechanical Properties. J. Appl. Polym. Sci. 2020, 138, 49646. [Google Scholar] [CrossRef]
  44. ISO 527-1; ISO-Committee Plastics—Determination of Tensile Properties. ISO-Committee: Geneva, Switzerland, 2012.
  45. ISO 179-1; ISO-Committee Plastics—Determination of Charpy Impact Properties. ISO-Committee: Geneva, Switzerland, 2010.
  46. ISO 75; ISO-Committee Plastics—Determination of Temperature of Deflection under Load. ISO-Committee: Geneva, Switzerland, 2013.
  47. Chen, L.; Zhang, X.; Li, H.; Li, B.; Wang, K.; Zhang, Q.; Fu, Q. Superior Tensile Extensibility of PETG/PC Amorphous Blends Induced via Uniaxial Stretching. Chin. J. Polym. Sci. 2011, 29, 125–132. [Google Scholar] [CrossRef]
  48. Monnier, X.; Cavallo, D.; Righetti, M.C.; Di Lorenzo, M.L.; Marina, S.; Martin, J.; Cangialosi, D. Physical Aging and Glass Transition of the Rigid Amorphous Fraction in Poly(l-Lactic Acid). Macromolecules 2020, 53, 8741–8750. [Google Scholar] [CrossRef]
  49. Badia, J.D.; Strömberg, E.; Karlsson, S.; Ribes-Greus, A. The Role of Crystalline, Mobile Amorphous and Rigid Amorphous Fractions in the Performance of Recycled Poly (Ethylene Terephthalate) (PET). Polym. Degrad. Stab. 2012, 97, 98–107. [Google Scholar] [CrossRef] [Green Version]
  50. Kiliaris, P.; Papaspyrides, C.D.; Pfaendner, R. Reactive-Extrusion Route for the Closed-Loop Recycling of Poly(Ethylene Terephthalate). J. Appl. Polym. Sci. 2007, 104, 1671–1678. [Google Scholar] [CrossRef]
  51. Raffa, P.; Coltelli, M.B.; Savi, S.; Bianchi, S.; Castelvetro, V. Chain Extension and Branching of Poly(Ethylene Terephthalate) (PET) with Di- and Multifunctional Epoxy or Isocyanate Additives: An Experimental and Modelling Study. React. Funct. Polym. 2012, 72, 50–60. [Google Scholar] [CrossRef]
Figure 1. The diagram of the overmolding process procedure. (A) The scheme presents the main stages of the overmolding process, (B) the view of the mold cavity before overmolding, (C) the sample appearance after the overmolding process.
Sustainability 15 11318 g001
Figure 2. The results of static tensile and Charpy impact tests for injection molded samples and insert overmolded specimens: (A) tensile modulus, (B) tensile strength; (C) elongation at break; (D) notched Charpy impact strength, (E) appearance of the tensile test specimens after a fracture.
Sustainability 15 11318 g002
Figure 3. The results of Charpy impact tests in the form of load versus displacement curves. (A) injection molded samples, (B) insert reinforced specimens, (C) the appearance of the specimens after impact testing.
Sustainability 15 11318 g003
Figure 4. The results of DMTA analysis for (A,C) injection molded samples and (B,D) insert overmolded. Results are presented in the form of storage modulus (top row) and tan δ (bottom row) plots.
Sustainability 15 11318 g004
Figure 5. The results of heat deflection temperature tests (HDT) for standard injection molded samples (columns) and overmolded specimens (line).
Sustainability 15 11318 g005
Figure 6. The results of DSC analysis. Plots are collected from different stages of the measurements: (A) 1st heating, (B) cooling, and (C) 2nd heating.
Sustainability 15 11318 g006
Disclaimer/Publisher’s Note: The statements, opinions and data contained in all publications are solely those of the individual author(s) and contributor(s) and not of MDPI and/or the editor(s). MDPI and/or the editor(s) disclaim responsibility for any injury to people or property resulting from any ideas, methods, instructions or products referred to in the content.

