1. Introduction
One of the most important aspects of e-commerce transactions overall is logistics. A free, open, international, and inclusive platform is being built by the logistics industry. This platform enables e-commerce transactions between customers and small and medium-sized businesses [
1].
The success of any e-commerce company depends on carefully planned logistics. The expansion of e-commerce presents the logistics system with both new difficulties and possibilities [
2].
Customers anticipate their ordered goods to be supplied in a shorter time frame as a result of the market economy’s ongoing development and the improvement of science and technology [
3,
4,
5,
6,
7]. As a result, in order to remain competitive, manufacturers need to be able to create a wide range of goods at a low cost and react fast to client demands.
Customer service in logistics includes satisfying demands for timeliness, dependability, communication, and comfort. Customers have high expectations for e-commerce logistics, and a brand’s ability to compete in this fiercely competitive e-business market depends on its ability to provide logistical services. However, the cost of logistics increases with the service level.
Academic research is becoming increasingly and more focused on the platform service supply chain as a result of its growing significance in generating economic value [
8]. Supply networks of today must adapt to constant and quick change. The platform service supply chains must keep enhancing or optimizing their operational and strategic choices, such as those involving cooperation, pricing, and production, from an economic standpoint. Because of rising client expectations, this is difficult.
More complicated distribution networks have developed as a result of the emergence of new channels and structures for distribution. For instance, commodities are frequently carried straight from a distribution center to the end consumer or even from a distribution center to a postal office depot, where they are then delivered to clients by a mailman [
9].
The alternatives available to grocery retailers to satisfy online demand are varied: use existing distribution centers, establish online distribution centers, buy products from numerous suppliers at various locations, or leverage existing physical shops. Products can be chosen from shop inventory when dealing with a limited quantity of orders. If there is clearly a greater demand for products in certain stores, then it is reasonable to pack orders directly from warehouses [
10].
In contrast to conventional distribution networks, wholesalers and retailers are frequently disregarded because of this. Moreover, in an e-commerce setting, clients place smaller, more regular orders [
11]. The quantity of consignments rises as a result [
9]. Very stringent requirements for the corporate capacity of production and on-time completion are put forth by the increasingly market-centric order completion technique [
12,
13].
Distribution centers are increasingly using compact storage technologies. They are space-efficient, flexible in regulating demand, and help to reduce direct variable expenses [
14]. Retail performance is now correlated with supply chain effectiveness due to the enormous logistical challenges brought about by this trend [
15].
Finding and filling in the order-picking problem knowledge gaps could result in more comprehensive and useful solutions for order-picking. The majority of research examines the order-picking issue using the method where parts are assigned to pickers. The picker travels the logistic center and selects items listed in the order. Nonetheless, zone-picking regulations are used in many logistic hubs, and the picker only picks items from his zone for certain orders. Therefore, in this study, we delve into the procedure for getting the container from the conveyor to the picking areas where the pickers are able to pick up the orders. We want to contribute by carrying out studies, experiments, and analyses that close the gaps concerning order picking in distribution centers with conveyors and propose insightful information to practitioners in business and supply chains.
The rest of this paper is organized as follows. In
Section 2, the existing literature related to the topics addressed in this research is reviewed. In
Section 3, we set the research steps. In
Section 4, the definition and formulation of the investigated order-picking problem are presented.
Section 5 provides the results of the computational experiment using the CPLEX solver. Discussion and application of the proposed model are given in
Section 6.
Section 7 presents a summary of the work and discusses possibilities for further work.
2. Related Literature
2.1. Sustainable Logistics
Including green components in logistics operations has the greatest impact on shaping supply chains toward a sustainable future. Companies must stimulate the use of environmentally friendly practices by continuously integrating them and assessing the effects on the environment and the business sustainability results [
16].
The consumer electronics industry is expanding quickly, which has increased supply chain warehousing activities’ carbon emissions [
17]. Since it strives to strike a balance between economic viability, maintaining the environment, and the growth and development of organizations, sustainability concerns have become more and more important.
According to Richards (2017), warehouse operations account for 24% of the cost of logistics; hence, concentrating on warehouse design for managing overall cost and carbon footprint can produce positive effects [
2].
Research published by the World Economic Forum (2009) [
18] stated that supply chain logistics activities are responsible for 5.5% of worldwide Greenhouse Gas (GHG) emissions. Companies need to look at all aspects of carbon emission generation if they want to achieve environmental sustainability and a low-carbon supply chain [
18].
The ongoing rise GHG emissions in recent years has prompted numerous businesses to look into the environmental impacts of their operations. Around 10% of global CO
2 emissions, according to recent estimates, come from logistical supply chains [
19].
The goals of the study by Kinoshita et al. (2023) [
20] were to develop a decision-support model for a global supply chain with low GHG emissions while accounting for prices, tariffs, Free Trade Agreement (FTA), carbon taxes, and GHG emissions. The research made a contribution by concurrently examining tariffs, FTAs, and carbon taxes. The authors also investigated whether FTAs would economically reduce GHG emissions as opposed to causing carbon leakage [
20].
Ali et al. (2022) [
16] identified the sustainable-green practices applicable to supply chain warehouse functions and investigated these practices by determining their weights in improving sustainable performance. Furthermore, they built a framework for relationships between these practices and performances according to the results of the research [
16].
Any business approach that lessens the environmental effect of the logistics network and delivery is referred to as “green logistics”. According to Choi et al. (2017) [
21], Malesios et al. (2018) [
22], and Bai et al. (2018) [
23], green supply chains are intended to control environmental degradation issues by converting all primary activities into green manufacturing, distribution, and reverse logistics.
Approximately 20% of the total logistical expenditures go toward the high energy costs associated with lighting, heating, and cooling warehouses and material handling equipment (MHE). Thus, lowering the energy consumption of warehouses would have a big positive impact on the environment. Sustainable approaches that minimize the cost of energy consumption due to MHE create a new challenge for warehouse management in this situation [
19].
The necessity for logistics process optimization is recognized in order to lower costs, boost efficiency, and apply different cost-saving methods. The logistics chain’s other components are greatly impacted by the complicated operation of warehousing. When it comes to modern manufacturing, using outdated techniques and methods for warehouse management leads to several challenges and issues, which are reflected in the inefficient flow of production processes [
24].
Logistics 4.0 primarily emphasizes financial gains. Ferraro et al. (2023) [
25] demonstrated that exoskeletons, collaborative robots, and additive manufacturing are the best means of attaining sustainable development objectives within Logistics 4.0. The researchers provided an improved analysis of logistics technologies, including effects on economic, environmental, and social sustainability on the one hand. On the other hand, the study by Ferraro et al. (2023) [
25] suggested a user-friendly multi-criteria decision-making technique based on the well-known analytic hierarchy process for choosing the most promising 4.0 technology to be deployed in businesses [
25].
Carli et al. (2020) [
19] proposed a model to automatically determine the most profitable and environmentally responsible schedule for the material handling tasks performed by electric mobile MHEs (MMHEs) (i.e., forklifts) in labor-intensive warehouses. The resulting schedule seeks to reduce the total cost, which is made up of the total electricity cost for charging batteries, as well as the penalty cost associated with the duration of the material handling activities. The method makes sure that tasks are carried out in accordance with priority queuing and that battery recharging takes the shortest amount of time [
19].
Vazquez-Noguerol et al. (2022) [
26] provided a method that simultaneously optimized the decision variables of several functions, which optimized the distribution of online orders to retailers. The suggested technique consolidates workloads in order to prevent downtime and use fewer resources, in addition to minimizing pickup and delivery costs. The result is calculated using a weighted sum technique, integrating variables that reflect various shop characteristics, including product selection, sales channel, and in-store activity [
26].
Business processes and supply chain models must be founded on environmental sustainability elements in order for corporate sustainability plans to be successful [
16,
27,
28]. As a result, firms are transforming their supply networks into green supply chains.
Jayarathna et al. (2023) [
29] investigated how the logistics industry applied sustainable principles to circular economy. In three main themes—environmental preservation, firm’s dynamic capacities, and social wellbeing—the authors found 47 sustainable logistics strategies. The report offered a useful addition to the execution of the circular economy transformation plan. In accordance with their strategic aims, logistics businesses can choose their sustainable logistics strategies for circular economy [
29].
With the help of powerful innovations like artificial intelligence, machine learning, and sophisticated analytics, intelligent firms are hurrying to comprehend and adopt sustainable management of logistics.
2.2. Sustainable Warehouse
In a public warehouse (PW), there are four distinct operations:
the receiving operation, which is the first stage of PW procedures and involves bringing stock-keeping units (SKUs) from customers into the PW;
the storage operation, which entails moving and placing SKUs in their designated storage locations;
the retrieving operation, which aims to retrieve the object SKUs from their storage locations in order to integrate a customer order;
the delivering operation, which involves, due to their propensity to be either very labor- or very capital-intensive, storing and retrieval; these two activities are among the most costly processes [
30,
31,
32].
Storage facilities, machinery for handling materials, and employees are all valuable PW resources. It goes without saying that the effective use of these resources will increase output and improve customer satisfaction [
33].
With its cost-effective practices, a sustainable warehouse may, over time, greatly increase the operational and financial efficiency of the warehouse. Due to the rapid rise in global energy consumption, which raises power prices and reduces operational efficiency, it is becoming increasingly crucial to do this.
Businesses of all sizes and allied industries are moving toward sustainable storage. For warehouses with different lengths and heights of storage aisles, Parikh and Meller (2010) [
34] created a throughput model that includes the vertical journey dimension [
34].
The choice of a specific warehousing strategy frequently relies upon basic warehousing operations, the nature and volume of client orders, the logistics units’ equipment, the expenditures associated with material handling in individual sub-processes (including both monetary and temporal costs), the accessibility of storage, and the labor resources at hand [
35].
Thomas and Meller (2015) [
36] investigated how different layout elements affect labor hours. They applied analytical models because they can predict performance metrics to determine labor hours for each design in the solution space [
36].
Roodbergen et al. (2015) [
37] gave case studies for selecting the layout variables that shorten the typical order pickup journey distance. Aisle lengths, cross-aisle counts, warehouse shapes, and storage unit allocations were some of the plan criteria [
37].
Haouassi et al. (2022) [
38] excluded the impact of blocking on the effectiveness of the choosing process in their problem formulation since the aisles were assumed to be sufficiently broad. This assumption may turn out to be inaccurate when small warehouses are built in cities and their need results directly from the expansion of e-commerce [
38].
Similarly, Shqair et al. (2014) [
39] carried out a simulation-based statistical study of specific warehouse architecture factors. They claimed that simulation is required to capture the inherited unpredictability in warehouse activities in order to solve the stochastic environment problem. The outputs from the simulation runs could be utilized as inputs to statistical research that evaluates the relationships between the various parameters and the journey distances in order to examine how the multi-level decisions impact the travel distance in the warehouses [
39].
A sustainable warehouse layout takes into account all the auxiliary factors that have an impact on the facility, such as product packaging and transportation strategies. The implementation of sustainability practices in warehouses must take into account a number of factors, including the emergence of new technologies, market and competitive pressures, new government regulations or policies, supply chain disruptions, the price of raw materials, and a lack of resources [
40].
The topics of warehousing procedures and their effect on warehousing logistics were covered in further detail by Brynzer and Johansson (1996) [
41]. Currently, it is believed that the warehouse management system and warehouse operations are crucial components of corporate logistics [
42].
Companies are continually enhancing their warehousing processes to lessen carbon impact and apply tactics that boost energy effectiveness. They also apply advanced storage and transportation technology to keep their organization on course.
In most, if not all, supply chains, warehouses play a key role [
37,
43]. This situation necessitates effective management systems in order to obtain an edge in a fiercely competitive global context since storage operations have a direct impact on direct variable costs [
44]. Additionally, reliable supply times and storage management have improved, which has been acknowledged over the last 20 years as a critical performance driver [
45].
The efficiency of order packaging depends on many factors. The most important of them concern the arrangement of racks and shelves, the arrangement of traffic zones, the availability of routes and methods of storing products. A thorough literature assessment on these subjects was provided by de Koster et al. (2007) [
46].
Since the transportation and logistics sectors have a significant influence on energy use, new solutions are always being created to help reduce environmental concerns. The innovations in Industry 4.0 are intended to coincide with conserving resources and, as a result, lessen environmental footprints. Examples include smart manufacturing, smart factories, and (indirectly) smart and sustainable storage solutions.
2.3. Order Picking
The most significant operation in a warehouse is order picking. An essential indicator of an order-picking system’s effectiveness is the mean throughput time of any given order in the system. The order will be available for dispatch more quickly and at a higher level of service from the warehouse if it is chosen more quickly. Two significant variables that will affect the order-picking efficiency are order batching and selecting area zoning [
47].
As more people utilize digital services, online commerce is expanding quickly. To meet the growing demand, conventional brick-and-mortar businesses are creating omnichannel solutions like click-and-collect services [
48].
Zhang et al. (2016) [
49] investigated the integration of order-picking and distribution processes in a B2C e-commerce setting. Delivery is outsourced to third-party logistics (or 3PL) service providers in their study [
49].
The primary operation in warehouses is order picking, which involves selecting products from their storage locations to fulfill customer orders [
50]. Recent patterns demonstrated that client orders have shifted from few, large purchases to many, smaller orders, which nonetheless need to be chosen and dispersed quickly even though they arrive late at warehouses. For businesses to remain competitive in this environment, warehouse order-picking systems need to be effective and adaptable [
47].
Haouassi et al. (2022) [
38] investigated the possible advantages of breaking down client orders into order lines during the selection process for warehouses that handle a lot of quick-turnaround orders (e-commerce warehouses). By enabling the orders to be divided over many pickers, the researchers expanded the combined batching, routing, and picker scheduling issue to serve this function. The challenge was to create a collection of picking tours by grouping order lines, assigning the tours to a group of order pickers, and schedule the tours for each picker so that the deadlines for the orders are met and the overall processing time is kept to a minimum [
38].
Order batching and scheduling actually have some connotative linkage, or, to put it another way, the batching issue is a component of order scheduling or planning in a PW [
51].
In order to examine the effects of order batching and picking area zoning on the mean order throughput time in a pick-and-pass order-picking system, Yu and de Koster (2009) [
47] developed an approximation model based on queuing network theory. The sorting procedure required to reorder the batch was included in the model. It was believed that service times at pick zones follow generic distributions. The researchers derived the first and second seconds of service times at zones as well as the likelihood that a batch of orders will visit a pick zone [
47].
The order assignment step in the order preparation process becomes crucial and has an impact on the total delivery performance since the latter actions are frequently accomplished using commercial navigation software [
52].
Customers continuously place orders, which are then released for fulfillment. A forklift can handle each order independently when the order is substantial (contains more than one pallet of SKU). This method of order execution is frequently regarded as the exclusive method [
46]. However, when orders are small (a small order is one pallet of SKU), it may be possible to save travel times by processing several orders at once.
Pietri et al. (2021) [
48] examined the buy-online-pickup-in-store idea, in which staff of traditional retailers pick up internet orders. The authors discussed various optimization techniques to address these important picking and packing process problems and suggested a thorough optimization approach that decreased the overall time that human resources are needed while ensuring the quality of packaging to guard against potential damage [
48].
Fedorko et al. (2020) [
24] focused on how choosing items in a warehouse might be made more efficient using computer simulation techniques. According to the High-Runner Strategy technique, their study showed how to apply a heuristic methods to improve shelf storage. In such settings, the time spent choosing should be kept to a minimum [
24].
Klumpp and Loske (2021) [
53] used the non-parametric Data Envelopment Analysis for order picking and e-commerce domain. By proposing a method of obtaining empirical information and new expertise on the subject of non-parametric efficiency metrics for order picking as a key process in electronic commerce environments, Klumpp and Loske (2021) made a unique and significant contribution to the body of knowledge on this topic [
53].
According to Ceynowa et al. (2023), information and communication technologies (ICT) tools are very important for modern businesses to be rival and sustainable. The authors created an application that lets businesses place orders with suppliers quickly and easily. The overall goal of their ICT tool was to make ordering products for businesses more efficient and straightforward, saving time and resources while guaranteeing that they obtain the commodities they require in a timely and dependable manner. Because of this, their solution has functions like a user-friendly interface for placing and submitting orders, real-time order progress and delivery tracking, and automatic pricing changes or product availability notifications. Additionally, it offered a channel of contact between businesses and their suppliers, making it simple to resolve any problems that might develop during the ordering process [
54].
3. Research Procedure and Methods
The research is provided according to the following steps:
Gather the literature on order picking and sustainable logistics applicable to the warehouse and the distribution center.
Define the order-picking strategies.
Give the detailed investigated order-picking problem definition applicable to the distribution center.
Formulate the order-picking problem with a one-directional conveyor and buffers.
Draw various layouts of the distribution center that are applicable to the formulated problem.
Conduct the experiment using a CPLEX solver and report the instance size that is possible or impossible to solve with this tool.
Analyze the results of the research and formulate the conclusions.
The research is based on operational research, which is a very useful analytical method in the sustainable management of organizations. Simulation is mainly used.
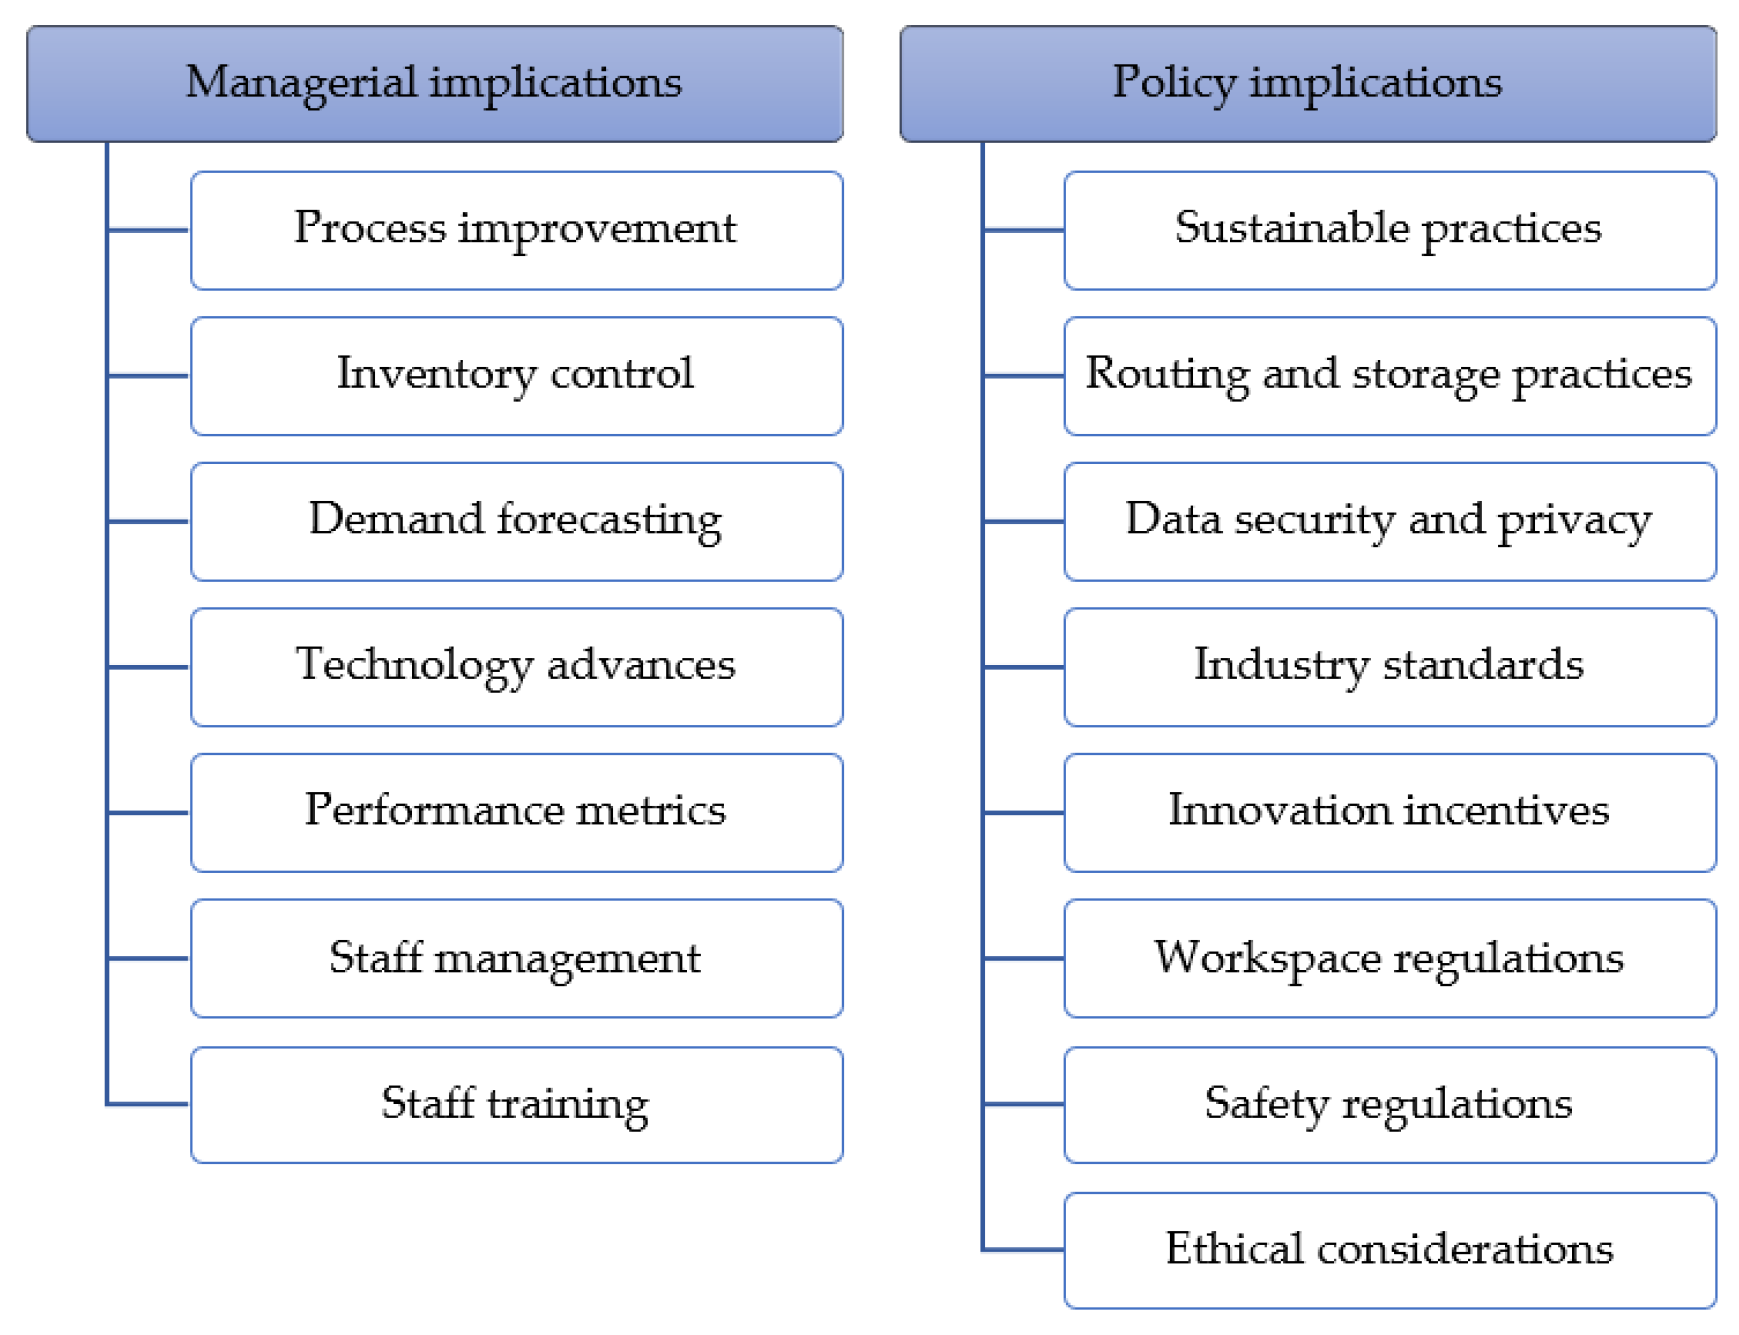
For companies, warehouses, and supply chain operations, the order selection problem has important managerial and policy implications. By solving the order-picking problem, businesses can more efficiently deploy their resources (such as personnel, tools, and space), reducing wastage and unnecessary expenditures. To solve this issue, thorough planning, effective implementation, and consideration of numerous elements are required.
Figure 1 presents some managerial and policy implications associated with the order-picking problem:
To cut down on travel time, reorganize operations, and boost productivity, managers must concentrate on streamlining the order-picking process. Implementing technology like real-time tracking, automated storage and retrieval systems, and routing algorithms may be necessary for this. The best way to reduce the number of pickers needed for a single shift in the warehouse is to automate it. Automating a warehouse is the most effective technique to lower the number of pickers required for a single shift. Warehouse automation should increase all of the pickers’ productivity, requiring fewer of them to fill the same number of orders.
To make sure that frequently used items are placed in convenient locations, efficient inventory management techniques are required. Managers should keep an eye on demand trends and modify their storage plans accordingly. Distributors should have complete visibility over all inventory movements, including which employee carried out each activity, with the help of a competent WMS with targeted e-commerce workflows. To keep track of inventory, follow the status of orders, and ensure proper picking, managers must evaluate and integrate technology like barcode scanners, RFID devices, and warehouse management software.
Supply chains and warehouses should implement regulations that support sustainable order picking, taking into account waste minimization, energy-efficient machinery, and eco-friendly packaging options. Fewer pickers should be needed to fill the same number of orders because of automation, which should boost the efficiency of all of the pickers. The creation of best practices might result from cooperation with industry organizations as well.
4. Problem Definition and Formulation
Authors have investigated the subsequent order-picking problem (OPP). There is a definite number of orders at the logistic center (warehouse or distribution center) that workers (pickers) must complete by choosing products from the racks, collecting them and putting them in the container with the given order. Each ready-to-go container has a definite list of the products with the quantities that the client ordered.
The products are stored in the defined locations on the racks. In the logistics center, generally, each product is stored in one location on the rack, but also, every product may be stored in more than one location. Because sometimes it is prohibited to place a new delivery of the product in the previous location, therefore it is placed in another location. For example, products such as paints do not necessarily have to maintain exactly the same color between different production batches; therefore, the distributors prefer not to sell clients such doubtful products from different deliveries. Because of this, they manage to store such products in different locations. Of course, most of the products that are totally equal are stored only in one location.
Containers are moved from the depot to the buffers on the one-directional conveyor, which is stretched across all storage locations in the logistics center. The racks near the buffer are assigned to the same buffer. Accordingly, one buffer may serve for one or several racks. One picker picks products from one or more buffers for which that employee is assigned. This means that in the same buffer, the employee picking the order has access to many racks and storage places. A single rack, or even a selected part of it, is not assigned to a specific employee. The picker is assigned to the whole buffer, i.e., to all racks in the buffer and all locations on the rack.
Assigning more than one rack to an employee requires that they be adjacent to each other. This is to avoid the need for the employee to travel an additional route, which would have to be taken into account in the algorithm. Only moving time between buffers is considered for containers because containers are moving on the one-directional belt conveyor.
After the container reaches the buffer, the employee must find the product required by the order. Most often, it is only necessary to count the appropriate number of products, although sometimes it is also necessary to measure, for example, the length of the chain or the rope, cut it, and then pack it into temporary packaging. The employee places the entire order for which he is responsible in the container, and the conveyor moves to the next buffer or the depot.
Everything that must be inside the containers is prepared beforehand. No more products can be added to the order once the container starts its trip. It is not mandatory to add products to the container in the predetermined order. We assume that enough products that the client ordered are available at the distribution center. Out-of-stock does not occur. The conveyor is one-directional; therefore, the container does a full round without accessing the final depot in order to reach the prior buffer.
Orders must be completed as quickly as possible. Therefore, the investigated OPP determines the order and allocation of containers to be handled by employees, taking into account employees’ availability and travel time. The execution time is equal to the time needed for the container to travel between all buffers.
Figure 2,
Figure 3 and
Figure 4 present an example of the distribution center with six buffers (B1–B6). The distribution of the facility’s internal space, as shown on a plan, is what the distribution center’s design or layout is all about. In this research, the layout of a distribution center establishes the storage and order preparation areas. Buffers B0 and B7 are start and out depots. There are 120 locations assigned per 20 locations to each buffer. The main locations are colored in the dark on each rack. There are eight repeated locations of colored light in each rack. On the figures, there is no assignment of the locations to the shelves shown. It shows what locations exist in which rack and which rack is assigned to which buffer. The conveyor is one-directional and transfers the containers from buffer B0–B1 to buffer B6–B7. To come to any of the previous buffers, the container must perform a round-trip beyond depots B7 and B0.
In
Figure 2, each picker is assigned to one buffer, and each buffer is assigned to one picker. In
Figure 3, one picker is assigned to more than one buffer, i.e., Picker 4 is assigned to buffer B4 and buffer B5. Multi-picker assignment is presented in
Figure 4, i.e., buffer B1 is operated by two pickers (1 and 2); similarly, Pickers 5 and 6 are assigned to buffer B6.
Next, we present the mathematical model for the described problem. The following notation is used in the model.
Indices and sets:
—number of orders;
—number of products;
—number of buffers;
—number of pickers/workers;
—index for orders, ;
—index for products, ;
—index for buffers, ;
—index for pickers/workers, .
Parameters:
—picking time of the product in the order ;
—travel time from the depot to the buffer ;
—quantity of product in the order that must be picked;
—available quantity of the product in the buffer ;
—travel time from the buffer to the buffer (because the conveyor is one-directional, );
—binary parameter of assignment products to buffers;
;
—binary parameter of assignment pickers to buffers;
;
Decision variables:
—start time for the product in the order processed by the picker in the buffer ;
—quantity of the product in the order picked by the picker in the buffer .
Subject to:
Pickers-to-buffers assignment, i.e., there is no product that could not be handled in the buffer by a specific employee.
Products-to-buffers assignment, i.e., there is no product in the order that is not in stock.
Each order has a set order of execution in the buffers. Each buffer complementation operation can only start when the previous one has finished.
Each employee processes one order at a time and can only process it in one buffer at a time.
Each picker can only pack one product at a time.
Each picker can operate in one buffer at a time.
Each picker can pack only one product at a time, in one buffer for only one order.
Each picker processes just one of the different jobs, just one of the different products, just one of his buffers at a time.
Picking cannot begin before the container arrives from the depot.
There is always sufficient time for container travel between buffers, i.e., consider the travel time from buffer to buffer for the container in one direction on the conveyor or round-trip beyond the depot to come to any previous buffers.
The buffers will never run out of products.
Enough products are picked.
Decision variables:
5. Experiment
The goal of the computational experiment was to evaluate the possibility of commercial tools such as the CPLEX solver to solve the defined order-picking problem on different-size instances.
SQL Server 2019.0150.2000.05 and SQL Server Management Studio 15.0.18424.0 were used for the experiments.
The solver version was IBM ILOG CPLEX Optimization Studio Version: 12.10.0.0
The computing stations parameters:
CPU: AMD Ryzen 5 1600
RAM: 16 GB
Operation system: Windows 10 64-bit
The 30 test instances created for the experiment are listed in
Table 1. Each of the distribution center layouts included ten examples. The layouts of the distribution centers are seen in
Figure 2,
Figure 3 and
Figure 4. In the six buffers, there were 120 main and 8 repeating locations. The product is stored in one, two, or three locations. A total of 85 products are stored only in one location, while 22 products are stored in two locations and 13 products are stored in three locations. There were five orders in each instance generated. There were 1…5 products randomly generated to be picked into the container. There were six, four, eight pickers in distribution center layouts.
Table 2 presents the results of the solution of the proposed OPP by CPLEX. There were 43,200, 28,800, 57,600 variables in each of the distribution center layouts. The time limit for CPLEX was set to 300 s. There were 2.2 million, 3.3 million, 2.9 million constraints in each of the distribution center layouts. One of the thirty instances was solved optimally. For the rest of the instances, the search was terminated by the time limit.
For the first distribution center layout, the result was far from the lower bound one with an average 44.91%, varying from 0.00% to 100.00%. For the second distribution center layout, the result was far from the lower bound one with an average 54.97%, varying from 29.29% to 69.12%. For the third distribution center layout, the result was far from the lower bound one with an average 63.00%, varying from 39.51% to 100.00%.
Table 3 presents the solution time for the 300 s CPLEX time limit.
Table 3 also shows that for four of the thirty instances, the solution was worse than the lower bound 100.00%. Therefore, we decided to increase the time limit to 600 s.
Table 4 presents the results of the solution of the proposed OPP by CPLEX with an increased time limit. For two instances, the result improved to 41.69% and 29.10%, but for another two instances, it was the same, and it was worse than the lower bound 100.00%.
Table 5 presents the solution time for the 600 s CPLEX time limit.
We tried to increase the number of products in the order from 1…5 to 1…10 for the same number of orders (which equals 5), but no solution was found after 80 min.
Our strategy involved increasing the quantity of orders from 5 to 10 for the same number of products in the order (which was selected randomly 1…5), but OplRun was not responding after 10 min.
This evidence confirms that CPLEX is an excellent tool for solving small instances of logistic order-picking problems. But for medium and large logistic data, new efficient heuristics are required.
6. Discussion and Application of the Proposed Model
The subject of analysis is the assembly line of furniture fittings, such as hinges, screws, dowels, etc. The assembly warehouse is divided into zones according to assortment groups. The assembly order is related to the type of furniture (wardrobe, desk) and requires collecting all necessary elements for the specified number of pieces of furniture according to the specification. The fittings are assembled in containers and delivered to the final assembly zone for products (this area is not subject to analysis).
Transport installation is a system of chain conveyors on which containers move between picking zones. The conveyor system consists of modules, each of which is powered by a 1.5 kW motor. A single module can have a maximum length of 10 m. The electricity consumption depends on the length of the module and its level of load. The maximum electricity consumption is designed for the maximum length of the conveyor under full load. To simplify the calculations, it has been assumed and confirmed by direct measurement of consumption in the production workshop that each working meter of the conveyor requires 110 W of power. The total length of the conveyor system is 95 m. The total power of the conveyor system is 10.45 kW. The conveyors operate continuously, and the conveyor speed is 20 m/min. As a result, the travel time of a single container through the entire transport line, if it does not have to stop, is 285 s. Such a sample trip consumes 0.827 kWh of electricity. For each second of operation, the system is estimated to require approximately 0.003 kWh of electricity. Of course, the picking line also includes other types of devices besides the conveyor system that consume electricity. These include electronic monitoring devices, lighting, container detection, and protection mechanisms. In total, it can be assumed that the operation of the entire picking line is associated with an energy consumption of 0.005 kWh/s. Using this value, it is possible to determine the energy savings resulting from better queue management.
Order picking is the core process of every automatic system. Some researchers also pay attention to energy consumption in order-picking systems, as this is a crucial factor for the distribution center and warehouse decision-makers.
The primary elements of the order-picking system, such as item qualities, product popularity, order identities, and physical shelf and location dimensions, all affect how much time and energy are expended [
55].
Battini et al. (2016) [
55] included energy consumption in the function that determined the overall order-picking time. They based it on the concept of the rest allowance formulation, which changed the rate of energy expenditure into an equivalent time value. This method enabled the estimation of the amount of additional rest time needed to maintain a low degree of fatigue. Battini et al. (2016) [
55] concluded that the energy expenditure rate is important during picking since the metabolic cost is considerable and the time required to complete a pick is relatively short. In contrast, walking often uses less energy but takes longer [
55].
Gajšek et al. (2021) [
56] investigated a multi-objective model based on binary integer linear programming, which they used to solve a storage assignment problem and a solution that took order-picking time, energy consumption, and health risk into account. In order to support these initiatives, their study compared the outcomes of several single-objective and multi-objective functions while taking into account the time, energy, and health risk criteria [
56].
In the research by Ebrahimi et al. (2015) [
57], a mixed-integer linear model for a picker-to-parts system with rapid charging technology was provided. Two minimization objective functions, energy consumption, and order tardiness, were examined as part of the model. The suggested model resolved the order batching, batch assignment, batch sequencing, and forklift routing issues along with the battery charge schedule of electric forklifts [
57].
Zhang et al. (2016) [
49] worked on the task of grouping dynamically arriving orders into selecting batches and allocated them to the right pickers so that most orders may be fulfilled in the shortest amount of time. Extensive numerical studies provided by Zhang et al. (2016) [
49] showed that urgent algorithms can result in a significant increase in the number of delivered orders, highlighting the significance of order batching and delivery integration.
The experiments conducted by Yu and de Koster (2009) [
47] with various input parameters, such as setup time at pick zones, various order arrival rates to the systems, and various order arrival distributions, have revealed that an ideal batch size always exists and that batch size has a significant impact on the mean order throughput time [
47].
This research can enrich the methods of order-picking processes in warehouses and distribution centers in terms of energy minimization as well as improving batching processes.
The results of our research showed that depending on the adopted center layout, the average results were worse than the optimal solution by 44.91% to 63%. Only in a few cases, it was not possible to find solutions within 300 s of calculations that were at most twice as bad as the optimal solution. It can be completely justified that a randomly chosen solution, without using optimization methods, will not provide a completion time smaller than twice the optimal solution. This means that for a single 8 h shift in the distribution center, it is possible to save 37% of task completion time, which amounts to 10,656 s of work on the entire picking line and saves 53.28 kWh of electrical energy. Time savings will vary depending on specific input data and the current load on the picking line.
The proposed model, due to its simplicity and speed of operation, could be applied to both large and small logistic systems, including production. Although individual energy savings for a single conveyor line may not seem significant to decision-makers, the cumulative value of these savings could have a noticeable impact on the overall economy, understood as a whole process of logistics in the economy, according to the authors.
7. Conclusions
Green logistics were focused on using supply chain management techniques that have a lower negative impact on the environment (on air, water, and land) and reduce overall health concerns.
Sustainable order picking can boost the economic performance of the logistic centers. The efficient management of order picking in distribution centers allows for improvement:
Time-efficient working methods for order pickers reduce the number of heaping tasks for pickers and idle time.
Sustainable transport of containers between different picking zones in the logistic centers reduces the containers’ distance travel, conveyor’s energy consumption, and emission.
Sustainable order-picking operations that cut resource usage on operating expenses such as time and operating expenses, which results in decreasing CO2 emission.
Adapting green trends to warehousing delivers a quick return on investment (ROI) as well as longer-term global advantages while meeting stakeholders’ expectations.
Using available optimization software such as IBM ILOG CPLEX Optimization Studio Version: 12.10.0.0, numerical experiments conducted on different problem sizes demonstrate that the developed model could be solved. The acquired findings demonstrate, from a sustainable management perspective, that the suggested order-picking problem model allows obtaining solutions that surpass the business’s order-completing strategy.
In order to pick problems in distribution centers and warehouses, the proposed model can help with the decision-making process for picking items to order assignment and picker scheduling. It may also offer managerial guidance for other labor-intensive service-oriented companies.
The contributions of the paper are the following:
the proposed model’s simplicity and potential for use allow for improving production and logistics systems;
the proposed solution to the order-picking problem impacts operational efficiency and cost reduction, which affects the long-term competitiveness in the market;
adopting sustainable practices aligns a business with the expanding trends toward environmental responsibility and resource conservation, positioning it for long-term success;
the contemporary logistical challenges and may be of interest to readers.
Here are some of the key limitations of our study that impact the practical applicability of the research:
the developed mathematical model was solved using a commercial solver without the advanced solution algorithm;
the study is rather theoretical, emphasizing the model, the discussion of the problem, and highlighting future directions.
Further study should concentrate on expanding our model to an integrated version that takes into account the picking and packing activities concurrently because these operations seem to be connected. It would be beneficial to model and contrast the various sorting systems used in e-commerce warehouses.


