
Sustainable Development of Water Housing Using the Example of Poland: An Analysis of Scenarios

Abstract
:1. Introduction
2. Definitions and Aim of Sustainability
3. Materials and Methods
3.1. Methodology of Conducting Studies Using SSSs
- First Stage
- 2.
- Second Stage
- -
- the strength of the influence of a given factor on the development of FHs (the strength of the impact is measured in accordance with the ten-point scale adopted in the methodology, which is presented in Table 1); and
- -
- the probabilities of three characteristic tendencies of process change (the sum of these probabilities must equal 1).
- -
- an upward trend in the process in the future: the potential negative or positive impact of the trend, and the likelihood of its occurrence;
- -
- a stabilization tendency in the process in the future: the potential negative or positive impact of the trend, and the likelihood of its occurrence; or
- -
- a downward trend in the process in the future: the potential negative or positive impact of the trend, and the likelihood of its occurrence.
- 3.
- Third Stage—The trends are arranged according to particular scenarios:
- optimistic, based on the factors that have the most positive influence (disregarded in this study);
- pessimistic, based on the factors that have the most negative influence (disregarded in this study);
- the surprise scenario, taking into account the factors that are the least likely to take place; or
- the most probable scenario, based on the factors that are most likely to take place, irrespective of the positive or negative impacts.
- 4.
3.2. Identification of the Factors Influencing the Development of FHs
4. Results
5. Discussion
5.1. Stormy Surroundings
5.2. Evaluation of Environmental Heterogeneity
5.3. Neutralization of Threats
5.4. The Leading Processes of Threats
5.5. Early Warning Systems
6. Conclusions
6.1. Stormy Surroundings
6.2. Evaluation of Environmental Heterogeneity
6.3. Neutralization of Threats
6.4. The Leading Processes of Threats
- “1.3. City center real estate prices”, with a 50% probability, and an impact of +3, in the economic sphere;
- “2.3. A way to spend free time”, with a 50% probability, and an impact of +3, in the socio-cultural sphere; and
- “3.4. Eco-friendly solutions”, with a 49% probability, and an impact of +4, in the environmental sphere.
6.5. Early Warning Systems
- “1.3. City center real estate prices”, with an 8% probability, and an impact of −2, in the economic sphere;
- “2.1. Contact with nature”, with a 12% probability, and an impact of −2, in the socio-cultural sphere; and
- “3.4. Eco-friendly solutions”, with a 13% probability, and a negative impact, in the environmental sphere.
Author Contributions
Funding
Institutional Review Board Statement
Informed Consent Statement
Data Availability Statement
Acknowledgments
Conflicts of Interest
References
- Kobryń, A. Wielokryterialne Wspomaganie Decyzji w Gospodarowaniu Przestrzenią (Multi-Criteria Decision Support in Spatial Management), 1st ed.; Difin: Warsaw, Poland, 2014; p. 9. [Google Scholar]
- Miszewska-Urbańska, E.; Bolt, A.; Taraszkiewicz, A.; Wiśniewski, R. Badanie zgodności koncepcji rekreacyjno-turystycznego otwarcia drogi wodnej Oświęcim-Kraków z zasadami zrównoważonego rozwoju (Study of the compliance of the recreational and tourist concept of opening the Oświęcim-Kraków waterway with the principles of sustainable development). JCEEA 2016, XXXIII, 267–280. [Google Scholar]
- World Commision on Environment and Development. Our Common Future; Oxford University Press: Oxford, UK, 1987. [Google Scholar]
- Ministerstwo Rozwoju i Technologii (Ministry of Development and Technology). Available online: https://www.gov.pl/web/rozwoj-technologia/zrownowazony-rozwoj (accessed on 1 May 2023).
- Bujak-Szwaczka, B.; Kolas, P. Rozwój Zrównoważony (Sustainable Development) Multimedia Presentation. Available online: https://www.popt.2007-2013.gov.pl (accessed on 20 April 2016).
- Ciambra, A.; Stamos, I.; Siragusa, A. Localizing and Monitoring Climate Neutrality through the Sustainable Development Goals (SDGs) Framework: The Case of Madrid. Sustainability 2023, 15, 4819. [Google Scholar] [CrossRef]
- Ciegis, R. Ekonomika ir Aplinka: Subalansuotos Plėtros Valdymas (Economy and Environment: Management of Sustainable Development), 1st ed.; Vytauto Didžiojo Universiteto Leidykla: Kaunas, Lithuania, 2004. [Google Scholar]
- Ciegis, R.; Ramanauskiene, J.; Martinkus, B. The Concept of Sustainable Development and its Use for Sustainability Scenarios. Inz. Ekon.-Eng. Econ. 2009, 62, 28–37. [Google Scholar]
- Biglari, S.; Beiglary, S.; Arthanari, T. Achieving sustainable development goals: Fact or Fiction? J. Clean. Prod. 2022, 332, 130032. [Google Scholar] [CrossRef]
- Ciegis, R.; Streimikiene, D. Integration of Sustainable Development Indicators into Sustainable Development Programmes. Inz. Ekon.-Eng. Econ. 2005, 42, 7–12. [Google Scholar]
- Díaz-López, C.; Martín-Blanco, C.; De La, J.J.; Bayo, T.; Rubio-Rivera, B.; Zamorano, M.; Blanco, M.; De La, C.; Rubio-Rivera, J.J.; Zamorano, B.; et al. Analyzing the Scientific Evolution of the Sustainable Development Goals. Appl. Sci. 2021, 11, 8286. [Google Scholar] [CrossRef]
- Gusmão Caiado, R.G.; Leal Filho, W.; Quelhas, O.L.G.; Luiz de Mattos Nascimento, D.; Ávila, L.V. A literature-based review on potentials and constraints in the implementation of the sustainable development goals. J. Clean Prod. 2018, 198, 1276–1288. [Google Scholar] [CrossRef]
- Lafortune, G.; Fuller, G.; Schmidt-Traub, G.; Kroll, C. How Is Progress towards the Sustainable Development Goals Measured? Comparing Four Approaches for the EU. Sustainability 2020, 12, 7675. [Google Scholar]
- Meschede, C. The Sustainable Development Goals in Scientific Literature: A Bibliometric Overview at theMeta-Level. Sustainability 2020, 12, 4461. [Google Scholar] [CrossRef]
- Miola, A.; Schiltz, F. Measuring sustainable development goals performance: How to monitor policy action in the 2030 Agenda implementation? Ecol. Econ. 2019, 164, 106373. [Google Scholar] [CrossRef]
- Moldan, B.; Dahl, A.L. Challenges to Sustainable Indicators. In Measuring Progress Towards Sustainability: Assessment of Indicators. A Project of SCOPE, the Scientific Committee on Problems of the Environment, of the International Council for Science, 2nd ed.; Hak, T., Moldan, B., Dahl, A.L., Eds.; Island Press: Washington, DC, USA, 2007; Volume 3, pp. 1–26. [Google Scholar]
- Munasinghe, M. Environmental Economics and Biodiversity Management in Developing Countries. Ambio 2013, 22, 126–135. [Google Scholar]
- Petkeviciute, N.; Svirskaite, I. Ekonominis vystymasis ir žmogaus socialinė raida. Organ. Vadyb. Sist. Tyrim. 2001, 17, 163–173. [Google Scholar]
- Pierantoni, I.A. A Few Remarks on Methodological Aspects Related to Sustainable Development. In Measuring Sustainable Development: Integrated Economic, Environmental and Social Frameworks; OECD: Paris, France, 2004; pp. 63–90. [Google Scholar]
- Romero Goyeneche, O.Y.; Ramirez, M.; Schot, J.; Arroyave, F. Mobilizing the transformative power of research for achieving the Sustainable Development Goals. Res. Policy 2022, 51, 104589. [Google Scholar] [CrossRef]
- Akintoye, V.A.; Opeyemi, O.A. Prospects for achieving sustainable development through the millennium development goals in Nigeria. Eur. J. Sustain. Dev. 2014, 3, 33. [Google Scholar]
- Ali, I.; Modibbo, U.M.; Chauhan, J.; Meraj, M. An integrated multi-objective optimization modelling for sustainable development goals of India. Environ. Dev. Sustain. 2021, 23, 3811–3831. [Google Scholar] [CrossRef]
- AlArjani, A.; Modibbo, U.M.; Ali, U.; Sarkar, B. A new framework for the sustainable development goals of Saudi Arabia. J. King Saud Univ. Sci. 2021, 33, 101477. [Google Scholar] [CrossRef]
- Zhou, C.; Gong, M.; Xu, Z.; Qu, S. Urban scaling patterns for sustainable development goals related to water, energy, infrastructure, and society in China. Resour. Conserv. Recycl. 2022, 185, 106443. [Google Scholar] [CrossRef]
- De Souza, S.R.G.; Vale, D.; do Nascimento, H.I.F.; Nagy, J.C.; da Silva Junior, A.H.M.; Rolim, P.M.; Seabra, L.M.J. Food Purchase from Family Farming in Public Institutions in the Northeast of Brazil: A Tool to Reach Sustainable Development Goals. Sustainability 2023, 15, 2220. [Google Scholar] [CrossRef]
- Haq, A.; Modibbo, U.M.; Ahmed, A.; Ali, I. Mathematical modeling of sustainable development goals of India agenda 2030: A Neutrosophic programming approach. Environ. Dev. Sustain. 2022, 24, 11991–12018. [Google Scholar] [CrossRef]
- Hu, Q.; Lu, C.; Chen, T.; Chen, W.; Yuan, H.; Zhou, M.; Qiu, Z.; Bao, L. Evaluation and Analysis of the Gross Ecosystem Product towards the Sustainable Development Goals: A Case Study of Fujian Province, China. Sustainability 2023, 15, 3925. [Google Scholar] [CrossRef]
- Magesa, B.A.; Mohan, G.; Melts, I.; Matsuda, H.; Pu, J.; Fukushi, K. Interactions between Farmers’ Adaptation Strategies to Climate Change and Sustainable Development Goals in Tanzania, East Africa. Sustainability 2023, 15, 4911. [Google Scholar] [CrossRef]
- Modibbo, U.M.; Ali, I.; Ahmed, A. Multi-objective optimization modelling for analysing sustainable development goals of Nigeria: Agenda 2030. Environ. Dev. Sustain. 2021, 23, 9529–9563. [Google Scholar] [CrossRef]
- Olabi, A.G.; Obaideen, K.; Abdelkareem, M.A.; AlMallahi, M.N.; Shehata, N.; Alami, A.H.; Mdallal, A.; Hassan, A.A.M.; Sayed, E.T. Wind Energy Contribution to the Sustainable Development Goals: Case Study on London Array. Sustainability 2023, 15, 4641. [Google Scholar] [CrossRef]
- Williams, S.; Murphy, D.F. Learning from Each Other: UK Global Businesses, SMEs, CSR and the Sustainable Development Goals (SDGs). Sustainability 2023, 15, 4151. [Google Scholar] [CrossRef]
- Venkatesan, P.; Sivaramane, N.; Sontakki, B.S.; Rao, C.S.; Chahal, V.P.; Singh, A.K.; Sivakumar, P.S.; Seetharaman, P.; Kalyani, B. Aligning Agricultural Research and Extension for Sustainable Development Goals in India: A Case of Farmer FIRST Programme. Sustainability 2023, 15, 2463. [Google Scholar] [CrossRef]
- Constitution of the Republic of Poland No. 483 of 2 April 1997. Available online: https://www.ilo.org/dyn/natlex/docs/ELECTRONIC/48187/73135/F401971080/POL48187%20English.pdf (accessed on 13 March 2023).
- Bieniok, H. Metody Sprawnego Zarządzania (Methods of Efficient Management); Agencja Wydawnicza Placet: Warszawa, Poland, 2011. [Google Scholar]
- Kałkowska, J.; Pawłowski, E.; Trzcielińska, J.; Trzcieliński, S.; Włodarkiewicz-Klimek, H. Zarządzanie Strategiczne. Metody Analizy Stategicznej z Przykładami (Strategic Management. Strategic Analysis Methods with Examples), 1st ed.; Wydawnictwo Politechniki Poznańskiej: Poznan, Poland, 2010; pp. 52–62. [Google Scholar]
- Gierszewska, G.; Romanowska, A. Analiza Strategiczna Przedsiębiorstwa (Strategic Analysis of the Enterprise), 4th ed.; Polskie Wydawnictwo Ekonomiczne: Warsaw, Poland, 2009; pp. 56–61. [Google Scholar]
- Miszewska, E.; Niedostatkiewicz, M.; Wiśniewski, R. Enviromental factors as the elements determing the development of floating homes. Saf. Eng. Anthropog. Objects 2021, 4, 41–51. [Google Scholar] [CrossRef]
- Miszewska, E.; Niedostatkiewicz, M.; Wiśniewski, R. Analiza możliwości rozwoju Mieszkalnych Obiektów Pływających (MOP) w aspekcie czynników środowiskowych (Analysis of the possibilities for the development of Floating Homes (FH) in the aspect of environmental factors). Przegląd Bud. 2022, 1–2, 50–55. [Google Scholar]


| The Strength of a Negative Impact | The Strength of a Positive Impact | ||||||||
|---|---|---|---|---|---|---|---|---|---|
| −5 | −4 | −3 | −2 | −1 | +1 | +2 | +3 | +4 | +5 |
| Very high | High | Moderate | Low | Very low | Very low | Low | Moderate | High | Very high |
| Factors/Trends In | Trends | Strength of Impact from −5 to +5 | Probability |
|---|---|---|---|
| 1.1. Rent costs (maintenance of the facility) | Growth | +2 | 0.44 |
| Stagnation | +1 | 0.41 | |
| Regression | −1 | 0.15 | |
| Sum | 1.00 | ||
| 1.2. FH insurance | Growth | +1 | 0.31 |
| Stagnation | 0 (−1) * | 0.49 | |
| Regression | −1 | 0.20 | |
| Sum | 1.00 | ||
| 1.3. City center real estate prices | Growth | +3 | 0.50 |
| Stagnation | +1 | 0.42 | |
| Regression | −2 | 0.08 | |
| Sum | 1.00 | ||
| 1.4. Mortgages for construction or purchase of FHs | Growth | 0 (+1) * | 0.26 |
| Stagnation | 0 (−1) * | 0.55 | |
| Regression | −1 | 0.19 | |
| Sum | 1.00 | ||
| 1.5. Technical inspection costs of FHs | Growth | −1 | 0.22 |
| Stagnation | 0 (−1) * | 0.54 | |
| Regression | +1 | 0.24 | |
| Sum | 1.00 | ||
| 1.6. Increasing affluence of society | Growth | +4 | 0.46 |
| Stagnation | +2 | 0.40 | |
| Regression | −2 | 0.14 | |
| Sum | 1.00 | ||
| Factors/Trends In | Trends | Strength of Impact from −5 to +5 | Probability |
|---|---|---|---|
| 2.1. Contact with nature | Growth | +3 | 0.46 |
| Stagnation | +1 | 0.42 | |
| Regression | −2 | 0.12 | |
| Sum | 1.00 | ||
| 2.2. Fashion | Growth | +2 | 0.45 |
| Stagnation | +2 | 0.40 | |
| Regression | −1 | 0.15 | |
| Sum | 1.00 | ||
| 2.3. A way to spend free time | Growth | +3 | 0.50 |
| Stagnation | +2 | 0.39 | |
| Regression | −1 | 0.11 | |
| Sum | 1.00 | ||
| 2.4. Sense of freedom | Growth | +2 | 0.41 |
| Stagnation | +1 | 0.48 | |
| Regression | −1 | 0.11 | |
| Sum | 1.00 | ||
| 2.5. Convictions and beliefs | Growth | +1 | 0.14 |
| Stagnation | +1 | 0.68 | |
| Regression | −1 | 0.18 | |
| Sum | 1.00 | ||
| 2.6. The construction industry | Growth | +3 | 0.44 |
| Stagnation | +1 | 0.46 | |
| Regression | −1 | 0.10 | |
| Sum | 1.00 | ||
| 2.7. Sense of prestige | Growth | +2 | 0.47 |
| Stagnation | +2 | 0.42 | |
| Regression | −1 | 0.11 | |
| Sum | 1.00 | ||
| Factors/Trends In | Trends | Strength of Impact from −5 to +5 | Probability |
|---|---|---|---|
| 3.1. Revitalization of urban areas | Growth | +3 | 0.37 |
| Stagnation | +1 | 0.47 | |
| Regression | −2 | 0.16 | |
| Sum | 1.00 | ||
| 3.2. Monitoring the aquatic environment | Growth | +3 | 0.28 |
| Stagnation | +1 | 0.58 | |
| Regression | −1 | 0.14 | |
| Sum | 1.00 | ||
| 3.3. Uncontrolled expansion | Growth | −3 | 0.37 |
| Stagnation | 0 (−1) * | 0.42 | |
| Regression | +2 | 0.21 | |
| Sum | 1.00 | ||
| 3.4. Eco-friendly solutions | Growth | +4 | 0.49 |
| Stagnation | +1 | 0.39 | |
| Regression | −2 | 0.12 | |
| Sum | 1.00 | ||
| 3.5. Alternatives to land drainage | Growth | +3 | 0.30 |
| Stagnation | 0 (+1) * | 0.56 | |
| Regression | −2 | 0.14 | |
| Sum | 1.00 | ||
| 3.6. Rising sea and ocean levels | Growth | +3 | 0.35 |
| Stagnation | +1 | 0.53 | |
| Regression | −1 | 0.12 | |
| Sum | 1.00 | ||
| 3.7. Rapid change in groundwater levels | Growth | +3 | 0.38 |
| Stagnation | 0 (−1) * | 0.47 | |
| Regression | −2 | 0.15 | |
| Sum | 1.00 | ||
| 3.8. Hydrological drought | Growth | −2 | 0.17 |
| Stagnation | +1 | 0.54 | |
| Regression | +2 | 0.29 | |
| Sum | 1.00 | ||
| 3.9. Surface water resources | Growth | +2 | 0.33 |
| Stagnation | +1 | 0.52 | |
| Regression | 0 (−1) * | 0.15 | |
| Sum | 1.00 | ||
| 3.10. Land protection by relocating towns to water | Growth | +2 | 0.21 |
| Stagnation | +1 | 0.61 | |
| Regression | −1 | 0.18 | |
| Sum | 1.00 | ||
| Factors/Trends in the Surroundings | Strength of Impact from −5 to +5 | Factors/Trends in the Surroundings | Strength of Impact from −5 to +5 | Factors/Trends in the Surroundings | Strength of Impact from −5 to +5 |
|---|---|---|---|---|---|
| 1.1. Rent costs (maintenance of the facility) | +2 | 2.1. Contact with nature | +3 | 3.1. Revitalization of urban areas | +3 |
| 1.2. FH insurance | +1 | 2.2. Fashion | +2 | 3.2. Monitoring the aquatic environment | +3 |
| 1.3. City center real estate prices | +3 | 2.3. A way to spend free time | +3 | 3.3. Uncontrolled expansion | +2 |
| 1.4. Mortgages for construction or purchase of FHs | 0 (+1) * | 2.4. Sense of freedom | +2 | 3.4. Eco-friendly solutions | +4 |
| 1.5. Technical inspection costs of FHs | +1 | 2.5. Convictions and beliefs | +1 | 3.5. Alternatives to land drainage | +3 |
| 1.6. Increasing affluence of society | +4 | 2.6. The construction industry | +3 | 3.6. Rising sea and ocean levels | +3 |
| 2.7. Sense of prestige | +2 | 3.7. Rapid change in groundwater levels | +3 | ||
| 3.8. Hydrological drought | +2 | ||||
| 3.9. Surface water resources | +2 | ||||
| 3.10. Land protection by relocating towns to water | +2 | ||||
| Strength of influence | +2.0 | Strength of influence | +2.3 | Strength of influence | +2.7 |
| Factors/Trends in the Surroundings | The Strength of the Impact of −5 to +5 | Factors/Trends in the Surroundings | The Strength of the Impact of −5 to +5 | Factors/Trends in the Surroundings | The Strength of the Impact of −5 to +5 |
|---|---|---|---|---|---|
| 1.1. Rent costs (maintenance of the facility) | −1 | 2.1. Contact with nature | −2 | 3.1. Revitalization of urban areas | −2 |
| 1.2. FH insurance | −1 | 2.2. Fashion | −1 | 3.2. Monitoring the aquatic environment | −1 |
| 1.3. City center real estate prices | −2 | 2.3. A way to spend free time | −1 | 3.3. Uncontrolled expansion | −3 |
| 1.4. Mortgages for construction or purchase of FHs | −1 | 2.4. Sense of freedom | −1 | 3.4. Eco-friendly solutions | −2 |
| 1.5. Technical inspection costs of FHs | −1 | 2.5. Convictions and beliefs | −1 | 3.5. Alternatives to land drainage | −2 |
| 1.6. Increasing affluence of society | −2 | 2.6. The construction industry | −1 | 3.6. Rising sea and ocean levels | −1 |
| 2.7. Sense of prestige | −1 | 3.7. Rapid change in groundwater levels | −2 | ||
| 3.8. Hydrological drought | −2 | ||||
| 3.9. Surface water resources | 0 (−1) * | ||||
| 3.10. Land protection by relocating towns to water | −1 | ||||
| Strength of influence | −1.3 | Strength of influence | −1.1 | Strength of influence | −1.7 |
| Factors/Trends in the Surroundings | The Strength of a Negative Impact | The Strength of a Positive Impact | Probability | Factors/Trends in the Surroundings | The Strength of a Negative Impact | The Strength of a Positive Impact | Probability | Factors/Trends in the Surroundings | The Strength of a Negative Impact | The Strength of a Positive Impact | Probability |
|---|---|---|---|---|---|---|---|---|---|---|---|
| 1.1. Rent costs (maintenance of the facility) | +2 | 0.44 | 2.1. Contact with nature | +3 | 0.46 | 3.1. Revitalization of urban areas | +1 | 0.47 | |||
| 1.2. FH insurance | 0 (−1) * | 0.49 | 2.2. Fashion | +2 | 0.45 | 3.2. Monitoring the aquatic environment | +1 | 0.58 | |||
| 1.3. City center real estate prices | +3 | 0.50 | 2.3. A way to spend free time | +3 | 0.50 | 3.3. Uncontrolled expansion | 0 (−1) * | 0.42 | |||
| 1.4. Mortgages for construction or purchase of FHs | 0 (−1) * | 0.55 | 2.4. Sense of freedom | +1 | 0.48 | 3.4. Eco-friendly solutions | +4 | 0.49 | |||
| 1.5. Technical inspection costs of FHs | 0 (−1) * | 0.54 | 2.5. Convictions and beliefs | +1 | 0.68 | 3.5. Alternatives to land drainage | 0 (+1) * | 0.56 | |||
| 1.6. Increasing affluence of society | +4 | 0.46 | 2.6. The construction industry | +1 | 0.46 | 3.6. Rising sea and ocean levels | +1 | 0.53 | |||
| 2.7. Sense of prestige | +2 | 0.47 | 3.7. Rapid change in groundwater levels | 0 (−1) * | 0.47 | ||||||
| 3.8. Hydrological drought | +1 | 0.54 | |||||||||
| 3.9. Surface water resources | +1 | 0.52 | |||||||||
| 3.10. Land protection by relocating towns to water | +1 | 0.61 | |||||||||
| Medium strength of influence | −1.0 | +3.0 | Medium strength of influence | +1.9 | Medium strength of influence | −1.0 | +1.1 |
| Factors/Trends in the Surroundings | The Strength of a Negative Impact | The Strength of a Positive Impact | Probability | Factors/Trends in the Surroundings | The Strength of a Negative Impact | The Strength of a Positive Impact | Probability | Factors/Trends in the Surroundings | The Strength of a Negative Impact | The Strength of a Positive Impact | Probability |
|---|---|---|---|---|---|---|---|---|---|---|---|
| 1.1. Rent costs (maintenance of the facility) | −1 | 0.15 | 2.1. Contact with nature | −2 | 0.12 | 3.1. Revitalization of urban areas | −2 | 0.16 | |||
| 1.2. FH insurance | −1 | 0.20 | 2.2. Fashion | −1 | 0.15 | 3.2. Monitoring the aquatic environment | −1 | 0.14 | |||
| 1.3. City center real estate prices | −2 | 0.08 | 2.3. A way to spend free time | −1 | 0.11 | 3.3. Uncontrolled expansion | +2 | 0.21 | |||
| 1.4. Mortgages for construction or purchase of FH | −1 | 0.19 | 2.4. Sense of freedom | −1 | 0.11 | 3.4. Eco-friendly solutions | −2 | 0.13 | |||
| 1.5. Technical inspection costs of FHs | −1 | 0.22 | 2.5. Convictions and beliefs | +1 | 0.14 | 3.5. Alternatives to land drainage | −2 | 0.14 | |||
| 1.6. Increasing affluence of society | −2 | 0.14 | 2.6. The construction industry | −1 | 0.10 | 3.6. Rising sea and ocean levels | −1 | 0.12 | |||
| 2.7. Sense of prestige | −1 | 0.11 | 3.7. Rapid change in groundwater levels | −2 | 0.15 | ||||||
| 3.8. Hydrological drought | −2 | 0.17 | |||||||||
| 3.9. Surface water resources | 0 (−1) * | 0.15 | |||||||||
| 3.10. Land protection by relocating towns to water | −1 | 0.18 | |||||||||
| Medium strength of influence | −1.3 | Medium strength of influence | −1.2 | +1.0 | Medium strength of influence | −1.6 | +2.0 |
| Sphere | Scenario | |||||
|---|---|---|---|---|---|---|
| Pessimistic | Optimistic | Surprise | Most Probable | |||
| Negative | Positive | Negative | Positive | |||
| Economic | −1.3 | 2.0 | −1.3 | 0.0 | −1.0 | 3.0 |
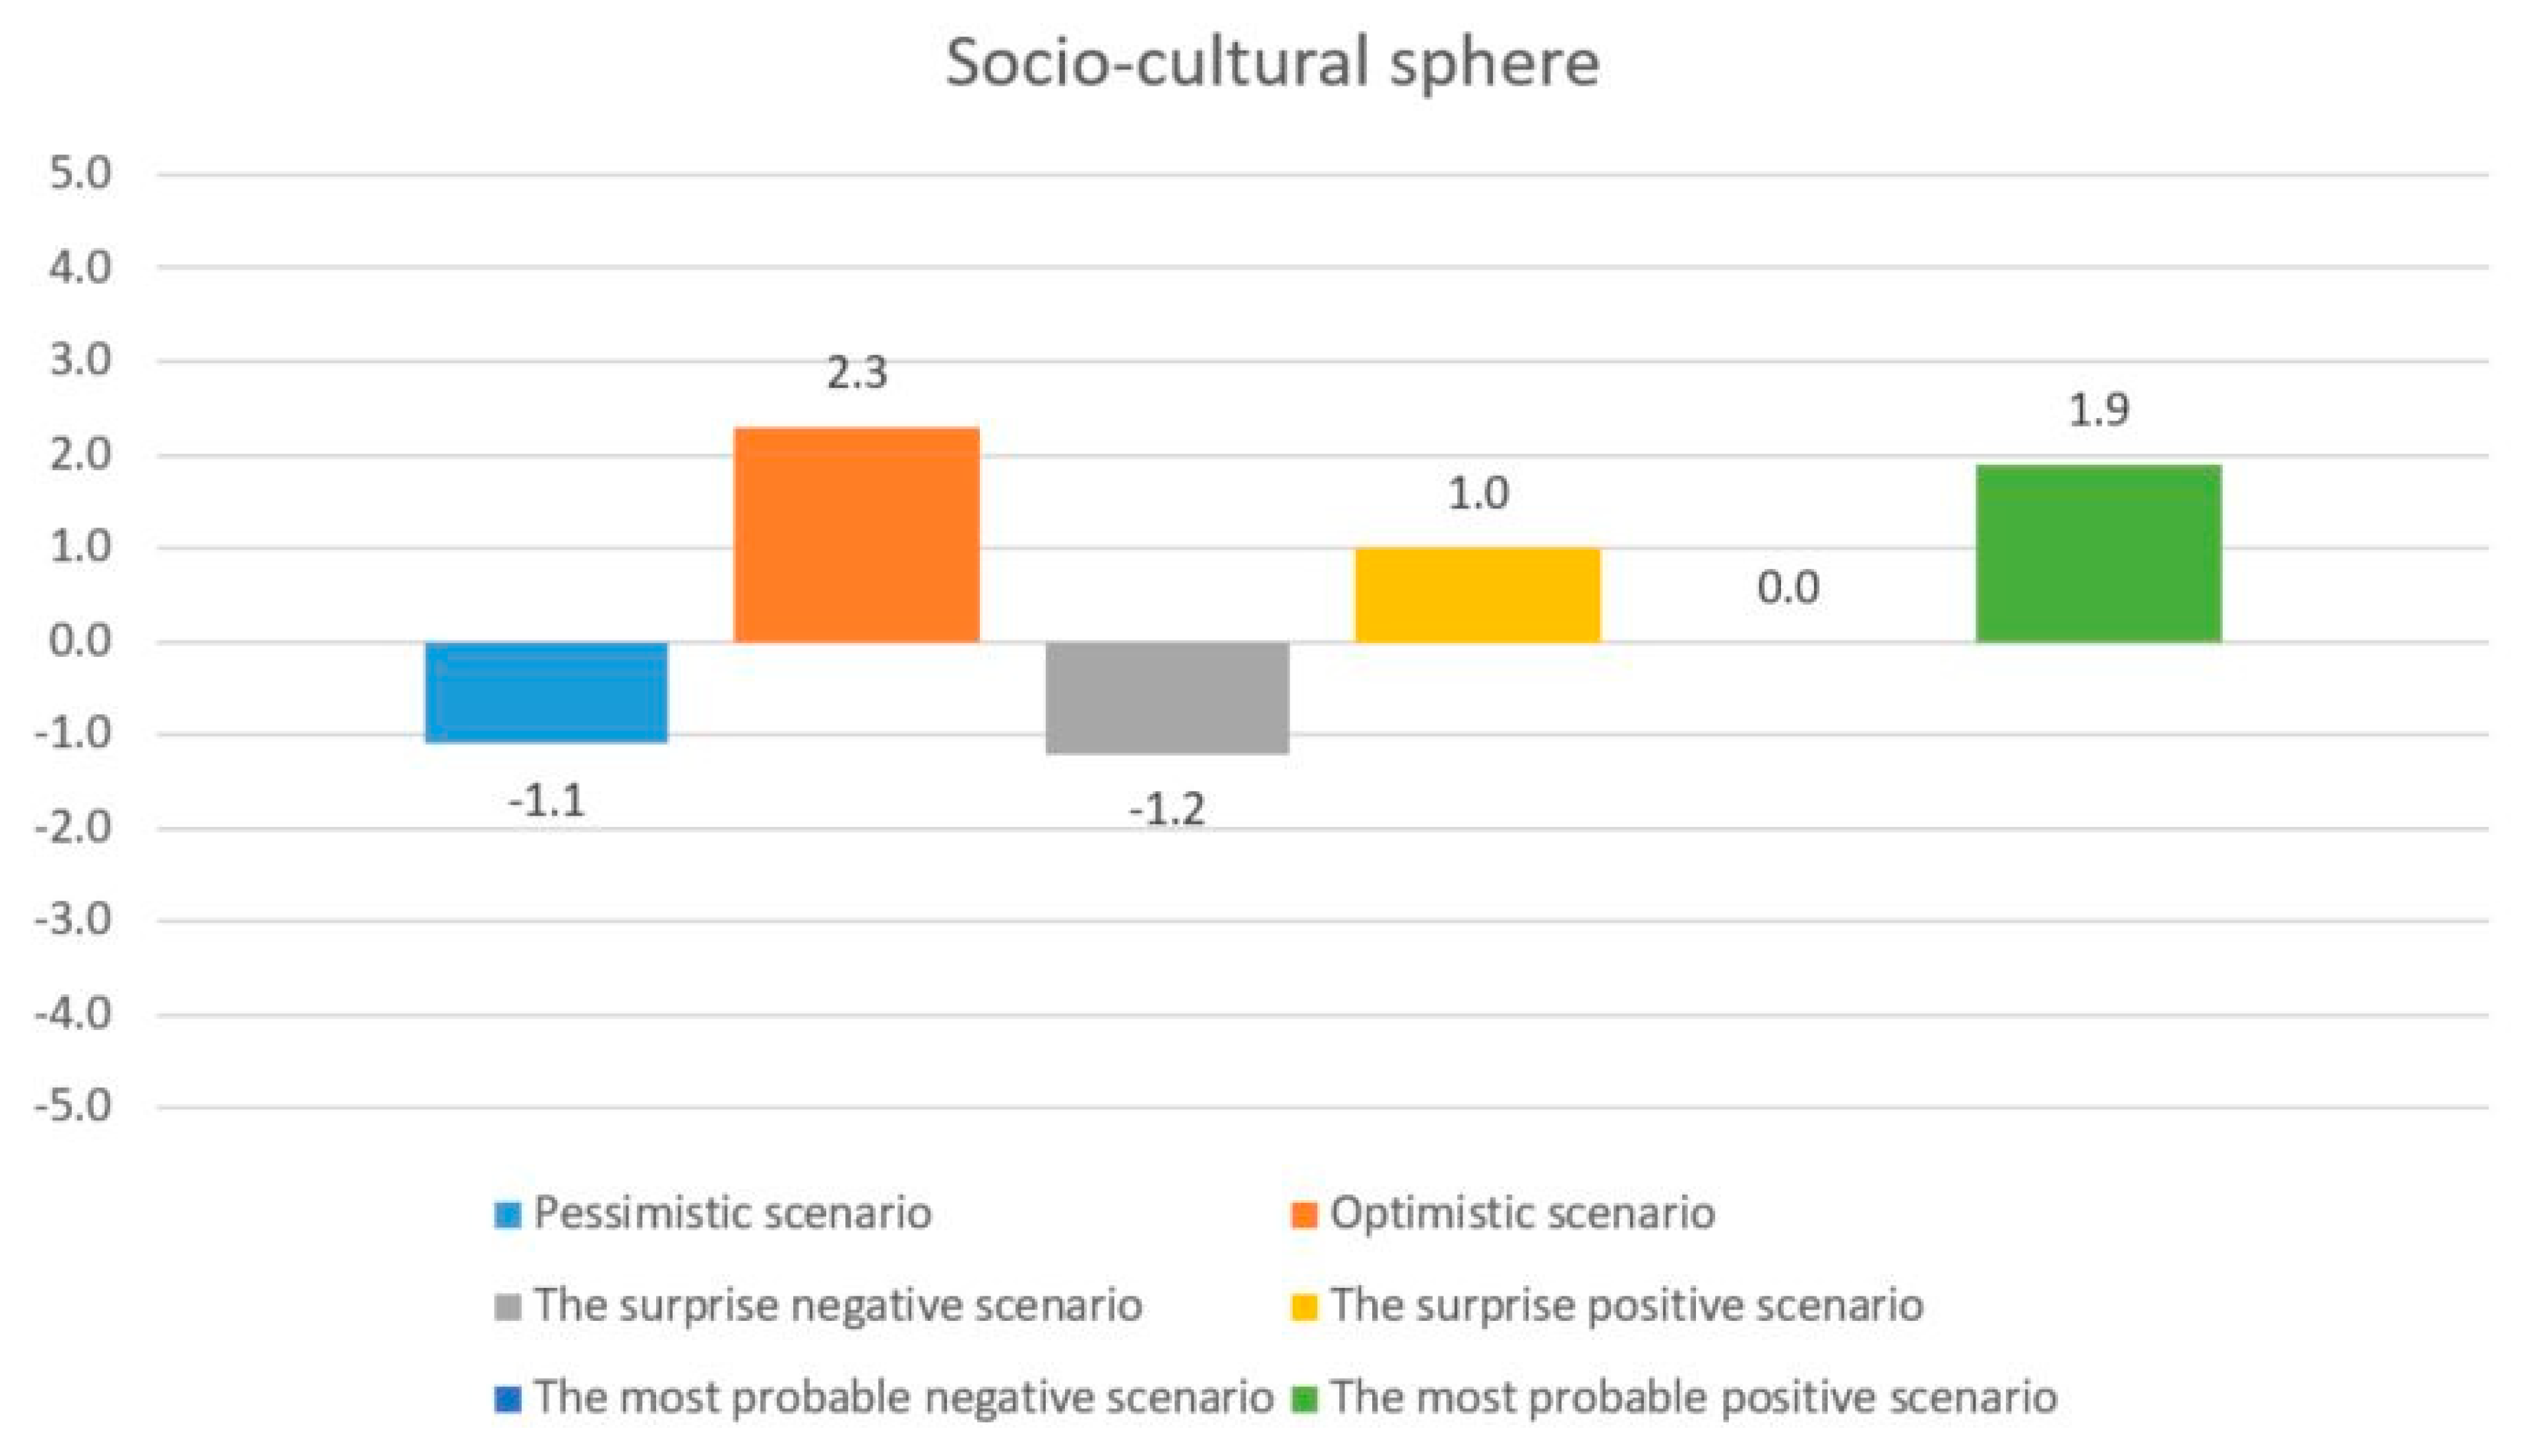
| Socio-cultural | −1.1 | 2.3 | −1.2 | 1.0 | 0.0 | 1.9 |
| Environmental | −1.7 | 2.7 | −0.6 | 2.0 | −1.0 | 1.1 |
Disclaimer/Publisher’s Note: The statements, opinions and data contained in all publications are solely those of the individual author(s) and contributor(s) and not of MDPI and/or the editor(s). MDPI and/or the editor(s) disclaim responsibility for any injury to people or property resulting from any ideas, methods, instructions or products referred to in the content. |
© 2023 by the authors. Licensee MDPI, Basel, Switzerland. This article is an open access article distributed under the terms and conditions of the Creative Commons Attribution (CC BY) license (https://creativecommons.org/licenses/by/4.0/).
Share and Cite
Miszewska, E.; Niedostatkiewicz, M.; Wiśniewski, R. Sustainable Development of Water Housing Using the Example of Poland: An Analysis of Scenarios. Sustainability 2023, 15, 11368. https://doi.org/10.3390/su151411368
Miszewska E, Niedostatkiewicz M, Wiśniewski R. Sustainable Development of Water Housing Using the Example of Poland: An Analysis of Scenarios. Sustainability. 2023; 15(14):11368. https://doi.org/10.3390/su151411368
Chicago/Turabian StyleMiszewska, Emilia, Maciej Niedostatkiewicz, and Radosław Wiśniewski. 2023. "Sustainable Development of Water Housing Using the Example of Poland: An Analysis of Scenarios" Sustainability 15, no. 14: 11368. https://doi.org/10.3390/su151411368