Article

Correlation of Two Biodegradability Indices of PLA-Based Polymers under Thermophilic Aerobic Laboratory Conditions

by
Dimitra Melitou
,
Spyridoula Gerassimidou
,
Athanassia Averopoulou
and
Dimitrios Komilis
*
Department of Environmental Engineering, Democritus University of Thrace, GR 67100 Xanthi, Greece
*
Author to whom correspondence should be addressed.
Sustainability 2023, 15(14), 11411; https://doi.org/10.3390/su151411411
Submission received: 2 June 2023 / Revised: 19 July 2023 / Accepted: 20 July 2023 / Published: 23 July 2023
(This article belongs to the Section Waste and Recycling)

Abstract

:
The biodegradation of bioplastics is a topic of interest worldwide. This work aims to measure the biodegradability of five polylactic acid (PLA)-based bioplastics under aerobic, thermophilic laboratory conditions and correlate their weight loss with their CO2 generation over a 3-month period, as both are considered indexes of biodegradation. The experimental design was based on the simulation of composting conditions by placing the bioplastic samples mixed with compost in sealed glass vessels that were regularly opened. The results showed significant variability in biodegradation, as dry weight losses ranged from 15.1–99.7%, while CO2 generation ranged from 9.2–14.9 g C–CO2/kg dry mixture (bioplastic + inoculum) depending on the sample. Moreover, no significant correlation between the weight losses and the gross CO2 production was calculated (p = 0.656), indicating the importance of carefully selecting the methods to assess biodegradation potential. This lack of correlation also reveals that different pathways are likely involved during the biodegradation of bioplastics and that the weight loss alone cannot indicate the conversion of solid C to CO2. This work proposes the need to develop an optimal degradation index for bioplastics that would provide a better understanding of their biodegradability in composting reactors. This index should combine dry weight loss and CO2 generation to assess the biodegradation of bioplastics with high confidence.

1. Introduction

The current lifestyle and population growth have led to an increasing trend of plastic waste generation worldwide that is projected to triple between 2019 and 2060, exceeding one billion metric tonnes (Mg) [1]. The plastic packaging sector is the main contributor to plastic waste generation, accounting for approximately 40% [2,3]. Estimations show that the global plastic recycling rate does not exceed 10%, while more than 20% of total plastic waste generation is mismanaged [4]. Landfilling plastic waste is the most common end-of-life (EoL) management option worldwide, accounting for 50% of total plastic waste management [4]. The current plastic waste management practices have led to the leakage of 22 million Mg of plastic waste in the marine and terrestrial environment in 2019 [5]. In addition, plastics production was responsible for more than 3% of global greenhouse carbon (GHG) emissions in 2019, resulting in the generation of ca. 1.6 billion Mg of GHG emissions [5].
These environmental issues have driven attention toward innovations and alternative solutions in the plastics sector. A solution is provided by a new category of plastics called “bioplastics”. Bioplastics belong to a large family of plastics with different properties [6] and several applications in the packaging, agriculture, automotive and medical sectors [7]. Specifically, the origin of raw materials (i.e., bio-based) and biodegradability status are the main properties that characterize a plastic material as bioplastic [8]. Bioplastics can be either produced from biomass such as corn, sugarcane or cellulose and are defined as bio-based, or degraded by microorganisms that are available in the environment into H2O, CO2, CH4 and compost and are defined as biodegradable [6]. Although there are bioplastics that are both bio-based and biodegradable, these two properties should not be considered equal [6]. For example, there are biodegradable plastics that are petroleum-based, such as polycaprolactone (PCL) or polybutylene succinate/adipate (PBS/A) [8].
The main driver for moving towards bioplastics as an alternative to conventional plastics (i.e., petrochemical-based and non-biodegradable) is their contribution to resource recovery through their biodegradability potential at the EoL stage and/or fossil fuel conservation, providing a potential for carbon neutrality [6]. In 2022, bioplastics production was estimated at 2.22 million Mg [9], representing nearly 1% of total plastic production which is very low participation in the plastics market [7]. However, the transition towards a more circular economy and the current sustainability goals set by governments at the national and international level forecast that bioplastics production capacity is going to be increased by ca. 2.8 times over the period 2022–2027 [9].
Research has been conducted to investigate the biodegradation potential of bioplastics under laboratory-controlled conditions [10,11] or in the natural environment [11].
Still, the EoL fate of bioplastics and particularly of biodegradable plastics, needs more research attention before wider adoption at the commercial level. The biodegradability rate of bioplastics is not a fixed characteristic; it depends on the physico-chemical structure of the polymer and the environmental conditions [6,11,12], such as temperature, pH, moisture, amounts of oxygen and microbial activity in soil and/or in a composting facility [13]. Therefore, this variability arising from a number of influential factors and a variety of sources indicates the uncertainty generated for result reproducibility during the evaluation of the biodegradation rate [13]. A combination of biodegradation indexes under controlled and constant monitoring might be crucially needed to understand and properly assess the mechanism of bioplastic biodegradation on the environment [13].
The transition towards sustainable management of biodegradable plastics remains challenging as their biodegradability rate is highly variable among different biodegradable plastic items, while their ability to biodegrade needs optimization in terms of time and completion [12,14]. A wider adoption of biodegradable plastics without addressing the challenges regarding their variable biodegradability potential may induce new problems in the plastic waste management system, including microplastic pollution, contamination of plastic waste recycling streams and promoting plastic littering behavior [8].
Polylactic acid (PLA) is one of the most popular bioplastic polymers due to its technological advances in manufacturing and functional features [15]. PLA is both bio-based and biodegradable and represented one-fifth of the global production capacity of bioplastics in 2022 [9]. Several studies investigated the biodegradation of PLA biodegradability [16,17,18], focusing on laboratory simulation testing [19] under aerobic composting conditions [20], thermophilic composting conditions [21] and thermophilic anaerobic conditions [22]. Reproducing laboratory testing is necessary to obtain reliable insights into the biodegradation of bioplastics under specified conditions. The goal of this work was to assess the biodegradability of different PLA-based plastic products used in the food sector following laboratory testing under aerobic, thermophilic conditions. To the best of our knowledge, this is the first experimental work that assesses the biodegradation of PLA products of various forms (i.e., flexible and rigid) through quantification of CO2 generation and weight loss under thermophilic aerobic degradation, with the ultimate goal to correlate those two indexes. This attempt to correlate these two parameters (weight loss and CO2 generation) could lead to the proposal of an optimal degradation index for bioplastics that could provide a better understanding of their biodegradation behavior in composting reactors. This, in turn, would enable us to assess the biodegradability potential of biodegradable plastics with higher confidence.

2. Materials and Methods

2.1. Bioplastic Samples and Compost

Different bioplastic products were examined in this experiment, including cutlery and plastic bags. Specifically, around 200 g of plastic plates (18 cm diameter × 1.5 mm thickness) and 300 g of plastic knives (16.5 cm × 1.5 cm) manufactured from PLA were collected from a local supermarket in Xanthi—Greece. In addition, around 200 g of PLA-based green bags (23 cm × 35 cm × ≈ 15–20 μm), labeled as compostable, that had been collected from a pet shop in Thessalonica (manufactured in Italy) were used. Moreover, 200 g of PLA-based white compostable bags (27 cm × 45 cm × ≈ 15–20 μm) were collected from a local bakery shop in Drama (Greece). Finally, around 150 g of a novel bioplastic flexible material (10 cm × 10 cm × 120 μm) made from a PLA mixture (termed bioflex here) was also used. This latter product had been manufactured at the Aristotle University of Thessaloniki, Greece. This specific plastic had been nicknamed “bioflex” by the members of the Greek university that manufactured it, but it is not associated with Bioflex™ packaging (https://www.bioflexpackaging.com, access date: 1 June 2023). Moreover, the precise composition of the bioflex plastic used in this work was unavailable. Still, it was mentioned that it mainly comprises PLA and small amounts of polyester. For the experimental testing of the composting of those five (5) PLA-based plastics, a cow-manure-derived compost was used as inoculum. Specifically, around 5 kg of a high-quality cow-manure-derived compost mixed with straw, collected from a nearby cow manure composting facility, was used to inoculate all bioplastics in the experiments.

2.2. Sample Preparation and Experimental Procedure

Every single plastic product mentioned in Section 2.1 was manually cut into several pieces that each weighed from around 4 to 7 g prior to placement into 1 L glass vessels (also referred to as respirometer). Specifically, the knife (each weighed 7.2 g) was cut in half, and both pieces were placed into each vessel. Each plate was cut into three pieces with dimensions 9 × 9 cm each, and each weighed 4 g. The bakery bag was cut into three 13 × 8 cm pieces that each weighed 5 g. The green bag was cut into three 10 × 8 cm pieces that each weighed 5 g. The bioflex plastic was cut into 10 × 10 cm pieces that each weighed 4.5 g. The aforementioned weights of all bioplastic pieces were recorded on a precision balance (KERN® Model GJ, Kern and Sohn®, Balingen, Germany). Three samples from each bioplastic product were prepared (i.e., 15 bioplastic samples in total) to provide 3 replications per bioplastic product (n = 3) during the experiment. The wet weight of the compost added in each respirometer to inoculate the bioplastic was between 90–100 g (wet weight). The amounts were chosen so that the ratio of wet compost to wet bioplastic was around 20:1 in all cases. Each PLA sample and the compost were placed in the 1 L glass vessels (respirometers) provided by WTW®; these vessels are typically used to measure soil respiration, often in combination with WTW-OxiTop® (Xylem Analytics®, Weilheim, Germany) pressure measurement heads. However, the OxiTop® heads were not used here since degradation activity was measured via CO2 generation only and not via O2 consumption, as those pressure heads are sensitive at temperatures above 55 °C. Every bioplastic piece was placed between a metallic flexible screen closed with metallic staplers perimetrically. The “sandwiched” bioplastic was mixed with the above-mentioned amount of compost and placed in each vessel. In total, 15 vessels were filled with mixtures of compost and bioplastic pieces, while 2 vessels were used as blank samples and were filled only with compost. Blank samples enabled both to examine the compost’s behavior without the effect of the bioplastic sample and to compare the absorption of CO2 emissions from the compost samples with that of the mixture of compost + bioplastic. In addition, 2 completely empty vessels containing no material were used to quantify the capture of atmospheric CO2 by the alkaline traps over the 90-day period. This latter amount was subtracted from the CO2 produced from all PLA and compost samples to calculate the gross CO2 generation per vessel. In all vessels, except the empty ones, around 50 mL of a Baumann nutrient solution was added to bring the moisture content of the contents (compost + PLA) to an optimal value of around 50–55% w/w (on a wet basis) and to provide nutrients. Plastic 50 mL beakers, filled with 40 mL of 3 M KOH solution that served as the alkaline traps, were placed on an elevated floor within the vessel. All vessels were sealed with 8 metallic clippers. A red plastic plug was put on top of every plastic cap to completely seal the vessels from the atmosphere. The experiment was held under aerobic, thermophilic conditions by placing the vessels in an oven at 58 °C. The vessels were briefly opened every 2 days to let air enter the vessel for a couple of minutes to ensure aerobic conditions throughout the experiment. Every 15–20 days, around 10–20 mL of purified water was added onto the substrate to maintain optimal moisture content and to prevent drying of the substrate. Every 30 days (until the end of the experiment at 90 days), the screened PLA sample was removed from the vessel, washed with tap water to remove any compost on the surface and dried at the same 58 °C for 1 day. Then, the dried sample was weighed. The net dry weight of each PLA sample was then calculated after subtracting the weight of the metallic screen and the staples from the total dry weight. The weight of the screen and the staples for each PLA sample, which had been weighed at the start of the experiment, was considered to remain stable over the experiment. After 1 day of drying, the dried plastic pieces were reinserted into the vessels with the same compost, and 10 mL of the Baumann solution was added to moisten the mixture. The CO2 generated every 30 days was measured after titration of the alkaline trap using 0.2 N H2SO4 solution (see Section 2.4), and a new alkaline trap would be added to each vessel at the end of every 30 days. That new trap was then used to record the CO2 for the next 30 days. The duration of the whole experiment lasted three months (90 days).

2.3. Moisture Content and Volatile Solids Determination

To determine the initial moisture content [23], the bioplastic samples and the compost were placed into a drying oven for 3 days at 75 °C and moisture was calculated via weight difference and expressed on a wet weight basis. The volatile solids (organic matter) content was quantified via the loss on ignition at 550 °C for 1.5 h following standard methods [23].

2.4. CO2 Determination via Titration

At the end of every 30 days of the experimental procedure, acid-base titration using the solution of H2SO4 was held to measure CO2 emissions during the biodegradation process. Ten (10) mL from the alkaline trap contained in each vessel were removed and mixed with around 50 mL of deionized water into a conical flask. The conical flask was placed on the electric stirrer, and the temperature and pH were monitored using a thermometer and pH meter (WTW™ InoLab, Xylem Analytics, Weilheim, Germany). The pH of the solution was carefully brought down to 8.3 using a 1 N or 0.2 N H2SO4 solution. After reaching a pH of 8.3, using a burette, a 0.2 N H2SO4 solution was used to carefully drop the pH from 8.3 to 4.3 and this volume of the acid was recorded. The method used here to determine CO2 is described in detail in [24].
The mathematical formula that was used for the determination of CO2 emissions during biodegradation produced by the nutrient substrate is
C C O 2 ( t ) = V 4.3 8.3 V s a m p l e × N a c i d × A W c × V t r a p V 4.3 8.3 b l V b l a n k × N a c i d × A W c × V t r a p b l m s
where, C–CO2 (t) is the cumulative C–CO2 at each sampling time t, expressed as Total Carbon (TC) in g/dry kg mixture; V4.3–8.3 is the volume of the H2SO4 solution needed to reduce pH from 8.3 to 4.3 (mL) in the sample; (V4.3–8.3)bl is the volume of the H2SO4 solution needed to reduce pH from 8.3 to 4.3 in a blank flask (mL) that does not contain any sample and is ran simultaneously with the other samples; Nacid is the normality of the H2SO4 solution (0.2 Ν); AWc is the atomic weight of C (12); Vsample is the volume received from the trap placed in the vessel with the sample (PLA + compost) for the titration (mL), typically 10 mL; Vblank is the volume received from the trap in the control (blank/empty) vessel for the titration (mL); Vtrap is the volume of the alkaline trap contained in the sealed flask with the sample (at the time of sampling, typically ranging from 0.045–0.055 L; Vtrapbl is the volume of the alkaline trap contained in the sealed blank flask (L) at the time of sampling, also ranging from 0.045–0.055 L; and ms is the total dry weight of the combined substrate (i.e., mixture of PLA and compost) placed in the vessel, namely the sum of the dry weights of the PLA and the compost that served as inoculant (in kg) or of the compost contained only in the vessels (that did not contain PLA plastics).

3. Results and Discussion

3.1. Moisture Content and Total Solids of Biomaterials

Table 1 shows the initial characterization, i.e., moisture content and volatile solids, of the 5 PLA-based samples and the compost before the experimental procedure of biodegradation. The PLA plates had the highest volatile solids content (99.5% d.w.), while the minimum value was found in the compost (48.2% d.w.). These values are in agreement with typical values found in PLA products (i.e., 88–99% d.w. [25,26]), while the volatile solids content of the compost may vary considerably and can reach up to 85% d.w. [27,28] depending on the source of the organic waste. The organic matter content of the compost used here is indicative of a stable compost. The moisture contents of all materials were below 10% w.w. for all materials, with the highest moisture content being that of the compost, namely around 7% w.w. All bioplastics (except the plate) were practically dry, having very low moisture content.

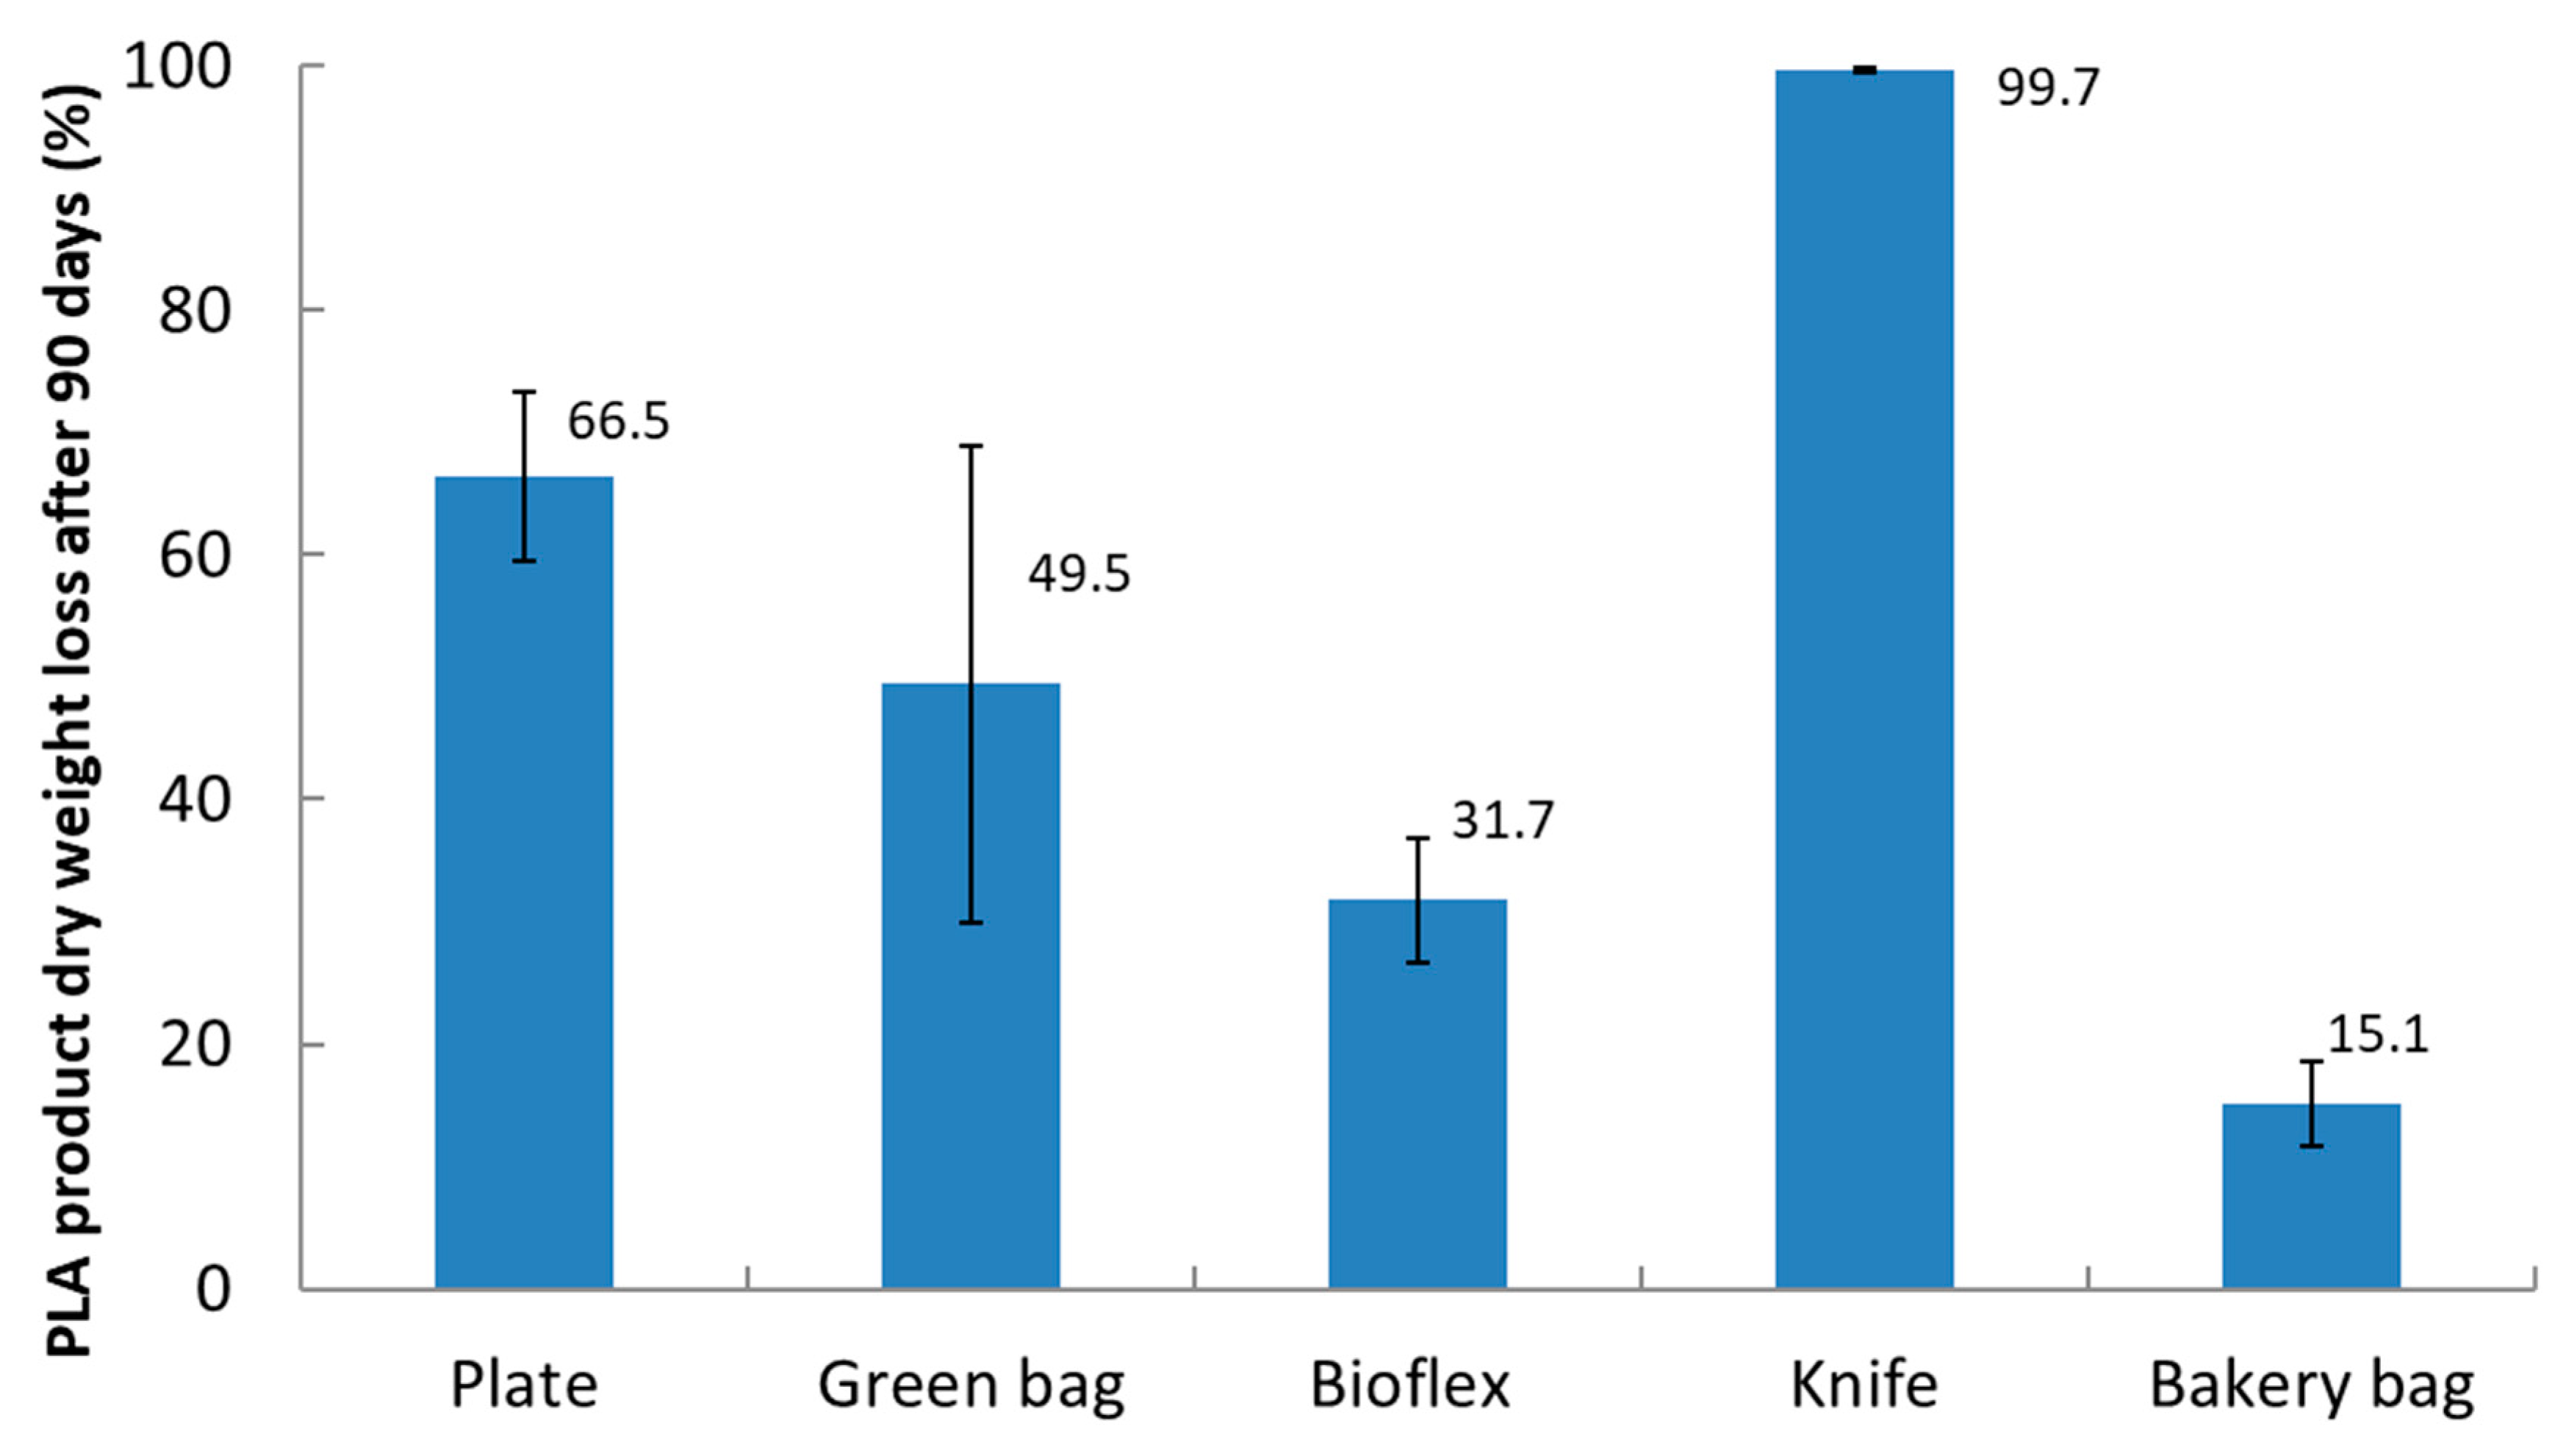
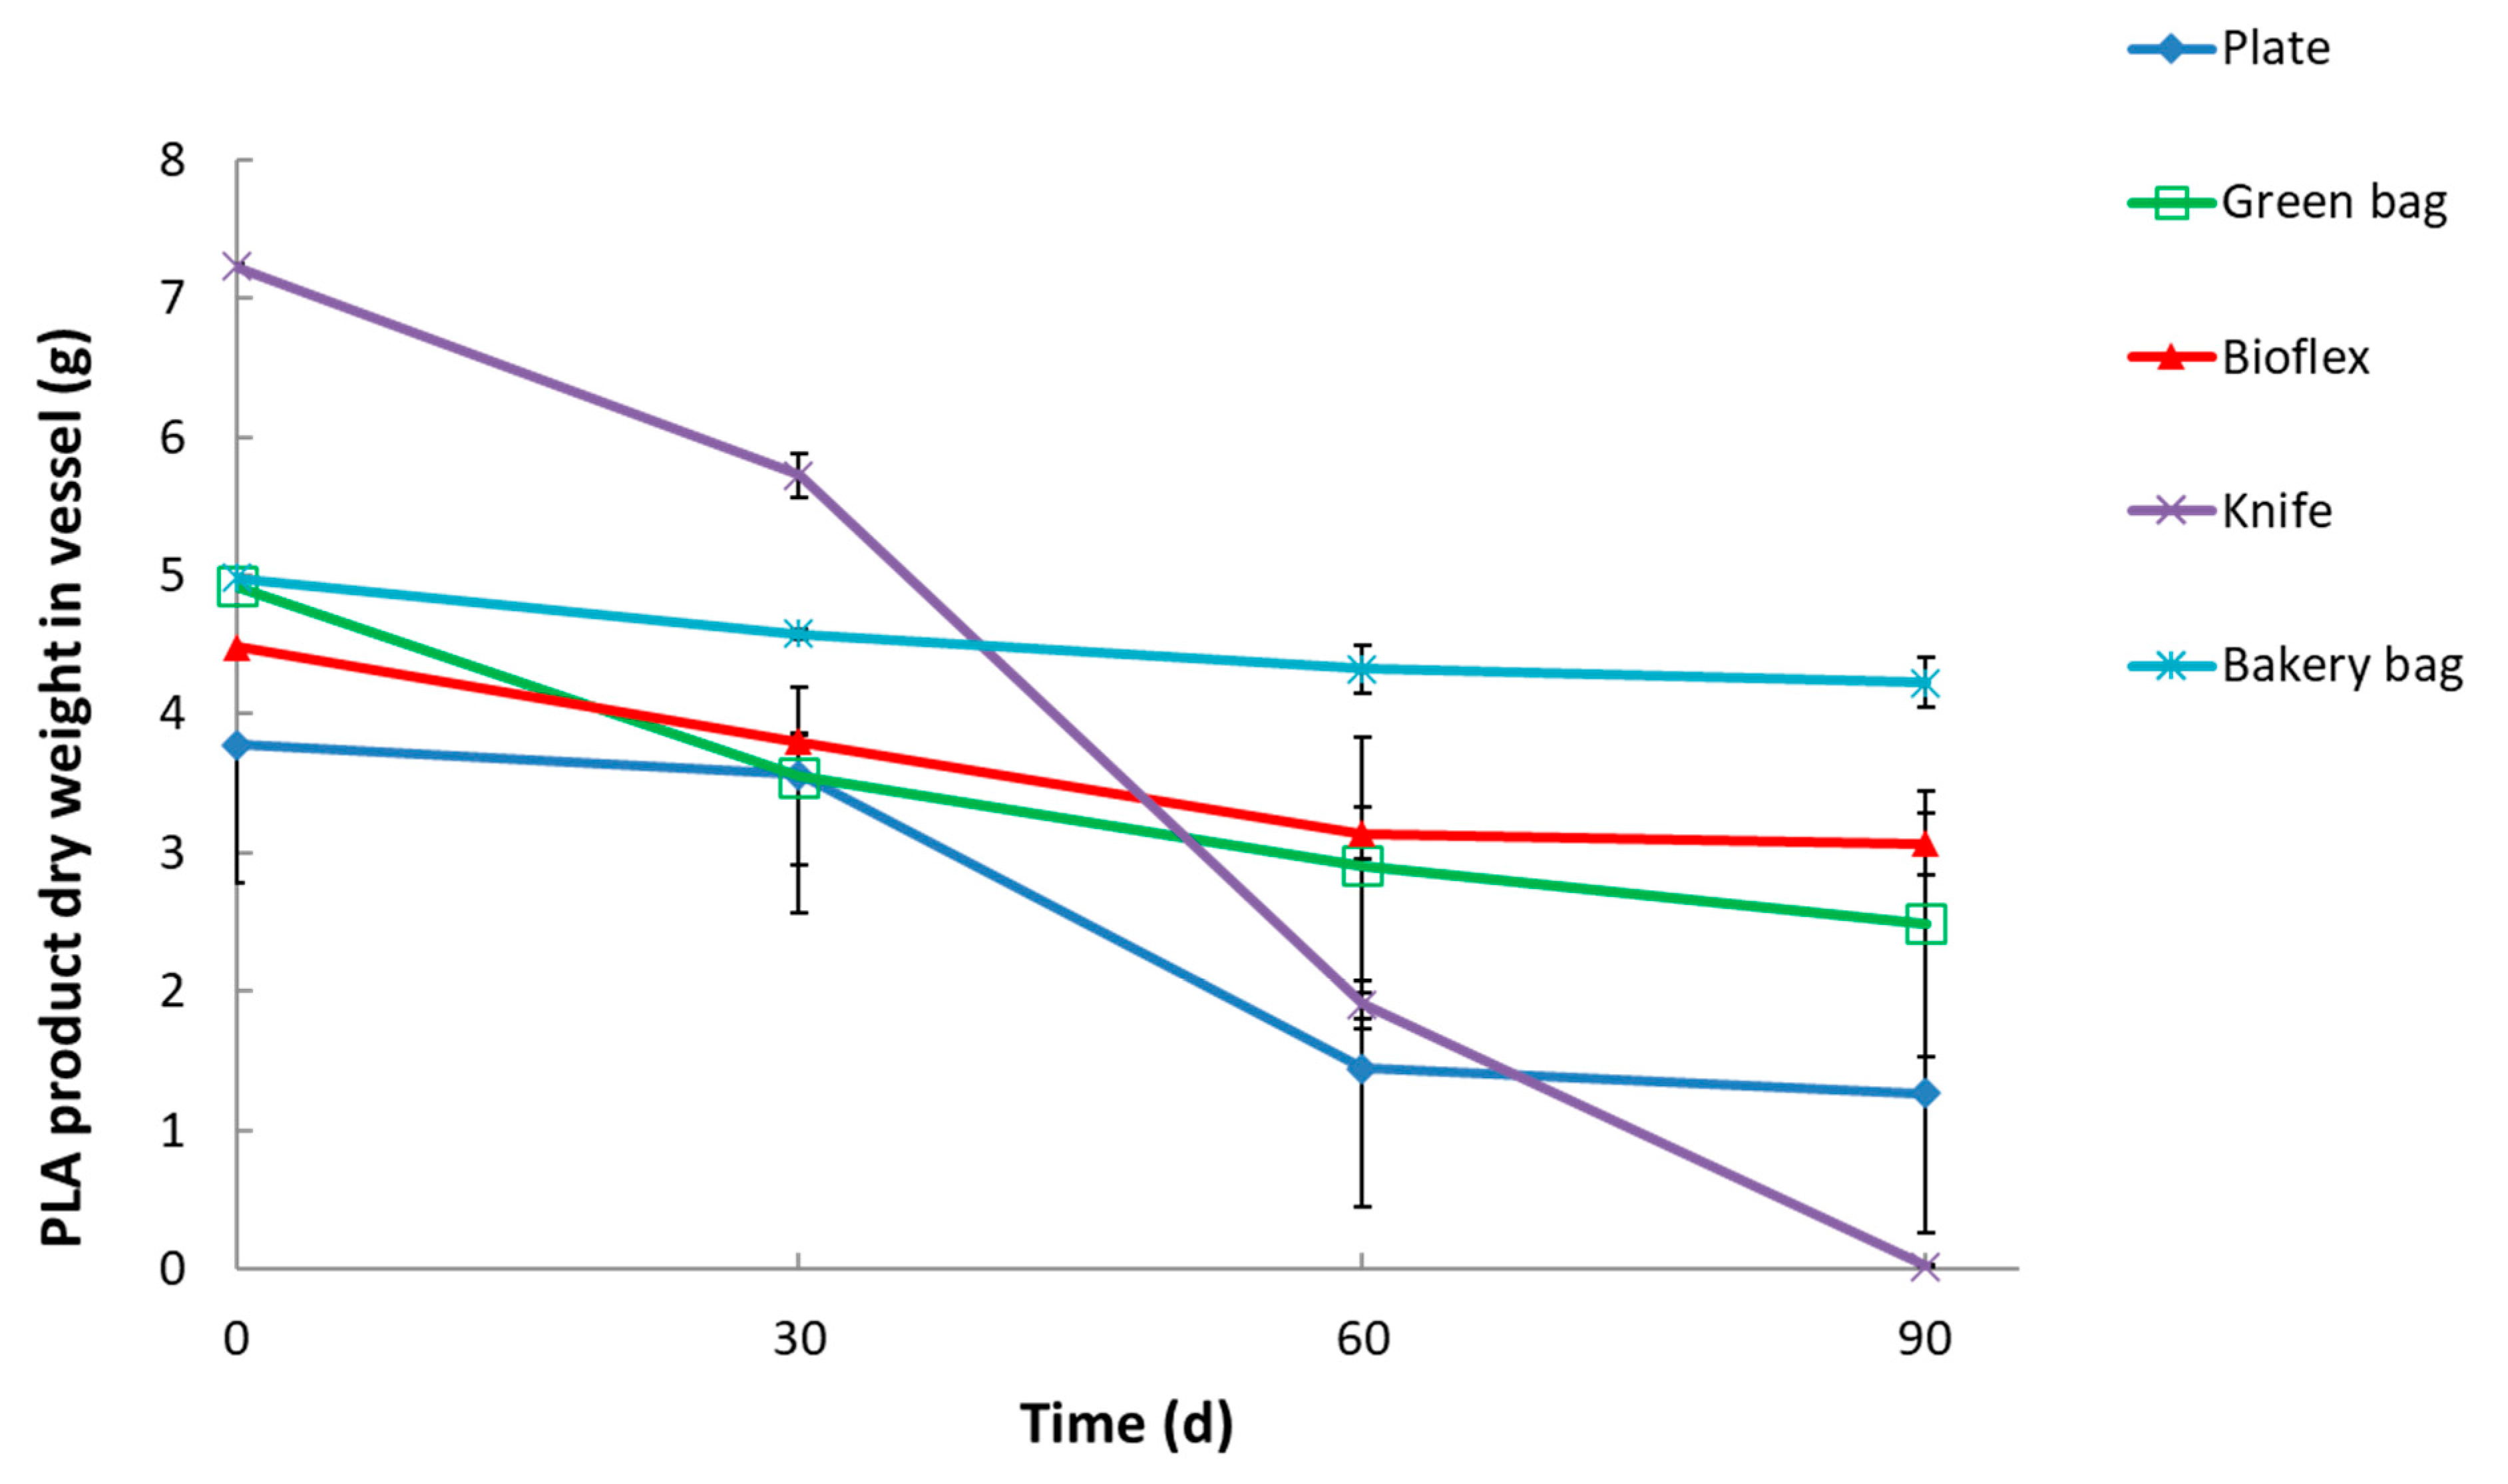
3.2. Weight Loss of PLA-Based Products during Biodegradation

Figure 1 depicts the dry weight loss of PLA-based products after the three-month laboratory aerobic degradation. In fact, there is a significant variation of dry weight losses among all materials used here. The maximum dry weight loss was observed for the knife product (99.7%), and the minimum was observed for the bakery bag (15.1%). This high range is in line with scientific evidence that also reported highly variable rates of weight loss of PLA samples during thermophilic degradation. For example, a review study has provided evidence on the biodegradation of PLA-based samples under thermophilic conditions simulating a composting environment, reporting a range of 60–100% of weight loss within a period of 28–90 days [12]. In addition, some studies have reported that under thermophilic conditions for more than 30 days, the weight loss of PLA films can exceed 90% [29,30], while the weight loss for rigid PLA items is very low. A study that measured the weight loss of PLA cutleries, which can be considered relatively thick plastic products, under thermophilic aerobic conditions found that weight loss did not exceed 5% [29]. The physical characteristics (e.g., thickness [29]) and the environmental conditions (e.g., temperature and degradation phase duration) should be considered in the assessment of the biodegradability of bioplastics [12,29]. For example, it has been reported that the weight loss of PLA may not exceed 10% within a period of 3 months under mesophilic conditions [29]. Therefore, thermophilic conditions are more beneficial in terms of a higher biodegradation rate. The differences in the weight losses of PLA-based samples can be attributed to differences in their chemical structure [31], crystallinity, molecular weight, surface area, crosslinks [13] and the fact that the biodegradation process of PLA depends on a variety of microorganisms and enzymes [11,16,20]. The physical aging and additives content [32] have also been reported as influential factors on the biodegradation rate. Still, clear indications of the reason for this significant difference cannot be provided due to limited evidence on the composition and polymeric structure of the samples.
Figure 2 depicts the variation of dry weight loss of PLA-based products as a function of time. A complete loss of weight was recorded after 90 days for the knife samples indicating an almost complete degradation. On the contrary, the bakery bag samples lost around 0.75 g of their dry weight, corresponding to 151% weight loss. After 30 days of thermophilic degradation, the knife samples showed a steeper weight loss compared to all other PLA products. The weight loss for the bakery bags during the first 30 days was negligible. Bioflex and the green bags showed a relatively steady rate of dry weight loss throughout the 90 days.
Figure 3 depicts the gross cumulative C–CO2 generation by the five PLA-based products mixed with compost and compost alone. The CO2 generation for the sole compost sample was 9 g C–CO2/dry kg of compost. All mixtures of PLA products (except the plate) had higher CO2 generation per kg of mixture, indicating that most PLA samples did biodegrade and were partly converted to CO2. The maximum cumulative C–CO2 generation was found for the green bag (15.9 g C–CO2/dry kg mixture). The corresponding minimum value was found for plate samples (9.2 g C–CO2/kg mixture), similar to compost. In fact, four PLA + compost mixtures generated more CO2 (per dry kg) than compost alone, indicating that they do biodegrade and convert their solid C to CO2. Comparative evidence on CO2 generation by PLA samples from other researchers is very limited since most researchers used to select weight loss as an indicator of PLA biodegradation, as can be seen in recent review studies [11,12]. Even this limited evidence is old (before the last 10 years) [12] and does not represent updated evidence on PLA biodegradation.
Figure 3 shows that none of the PLA mixtures induced C–CO2 production lower than the sole compost. However, only the plate samples mixed with compost had similar values to the sole compost. This indicates that the added compost did, in fact, work successfully as an inoculum for the PLA samples. Efforts to calculate the net CO2 generation per dry kg of PLA only, i.e., after subtracting the contribution of CO2 of the compost from the total CO2 of the mixture, were not successful as slightly negative values would be calculated in most cases. As a result, all C–CO2 generation reported in Figure 3 is expressed as the mass of C–CO2 per dry kg of mixture (i.e., PLA + compost or compost alone).
The relationship between dry weight loss and CO2 generation was further investigated, as this was the primary objective of this work. That is, the research questions were “To what extent does dry weight loss mineralize to CO2?” Or “Does weight loss lead to other intermediate metabolic products and not necessarily to CO2?”. Based on the above research questions, Figure 4 is a scatterplot of the dry weight loss versus the cumulative generation of the C–CO2 after 90 days.
Figure 4 shows that there is no correlation between dry weight loss and overall CO2 generation, as might have been expected. For example, the knife sample had the highest weight loss (100%), as it practically disappeared, but did not have the highest CO2 generation (12.9 g C–CO2/kg mixture). At the same time, the bakery bag had a similar CO2 generation (around 12.7 g C–CO2/kg mixture) to the knife but the lowest dry weight loss (15.1%). That is, although the gross C–CO2 generation from these two polymers was similar, there was a huge difference in the corresponding weight losses.
The highest C–CO2 generated after 90 days was 14.9 g C–CO2/kg mixture and was recorded from the green bag; however, the green bag’s weight loss was only 50% which was a moderate weight loss value compared to the weight losses of the knife and the plate. The lowest C–CO2 generation (9.2 g C–CO2/kg mixture) was recorded for the plate samples, which observed a rather high weight loss (67%).
A linear regression model was fitted to the data, with C–CO2 generation being the independent variable (predictor) and dry weight loss (in %) the dependent variable. Results showed that the resulting linear regression model was not statistically significant at a = 0.05 as the p-value of that model (i.e., of the CO2 variable) was 0.656 (i.e., higher than α). The above proves that no correlation exists between CO2 and weight loss (as is visually evident in Figure 4). Therefore, the depicted regression line in Figure 4 is non-significant, so the regression equation shown has no descriptive or predictive abilities.
This discrepancy between dry weight loss and C–CO2 generation can indicate that (a) biodegradation does occur to intermediate metabolic products, such as volatile organic compounds or soluble products, but not down to CO2; (b) degradation mechanisms that are not induced by microbes may occur, such as simple depolymerization and solubilization due to thermophilic temperatures. These mechanisms can contribute to weight loss but do not lead to mineralization of organic C to CO2; (c) a different structure and mechanical properties (e.g., polymer length, crystallinity, tensile strength) of the PLA used to manufacture the five products used here.
The degradation rate of PLA may depend on the PLA isomer ratio as well as the shape and size of the material [33]. Different mechanisms are involved in PLA degradation, including hydrolytic, oxidative, thermal, microbial, enzymatic, chemical and photodegradation processes [33]. The PLA biodegradation mechanism during composting is a combination of microbial and enzymatic degradation that primarily includes the scission of the main and side chains [33]. The mechanism of microbial degradation takes place after the hydrolysis of high-molecular-weight PLA that breaks down the ester bonds, where microorganisms adhere and colonize the surface of PLA and excrete extracellular depolymerase to break down PLA. Then, lactic acid oligomers, dimers and monomers are produced; these are low-molecular-weight compounds that can infiltrate into microbial cell membranes leading to the release of PLA-degrading enzymes by bacterial cells that adhere to PLA surfaces. PLA-degrading enzymes, absorbed or localized to the surface of PLA, lead to the mineralization of PLA to CO2 [33].
The above lack of correlation between weight loss and CO2 generation indicates that the existing criteria to assess bioplastic biodegradability should be revised. Our findings are also supported by a recent study [34] that reported that “it is unavoidable to associate mass loss measurements with mineralization kinetics to attest the complete conversion of the polymer organic carbon into CO2” (p. 16). By this statement, authors highlight that dry weight loss during biodegradation does not necessarily indicate that this loss is entirely assimilated by microorganisms and is therefore converted into CO2; however, many studies still use only dry weight loss as a biodegradation indicator [34]. According to [13], although the measurement of CO2 is considered a good indicator to assess a material’s biodegradability potential, it is still not recommended to be used alone [13]. CO2 measurements need to be combined with other degradation index methods (e.g., dry weight loss) to gain better insights into the mechanisms of biodegradation [13].
According to [35,36], plastic is rendered compostable if, within six months, 90% of the material is assimilated by microorganisms and is then converted to CO2. This is an assessment of biodegradability, which indirectly implies that 90% dry weight loss is a prerequisite. An additional requirement (disintegration potential) is that within 3 months, 90% of the material should consist of fragments less than 2 mm. According to the former requirement, the dry weight alone could be a measure of biodegradability as long as that weight lost is converted to CO2. In that sense, a positive correlation between dry mass loss and CO2 generation must exist to use only dry mass loss as a biodegradation index. Our work has demonstrated that this is not always the case, as a correlation, of any type, between CO2 generation and dry mass loss was not calculated here. Regardless, suppose the 90% dry mass loss after 6 months is considered alone as an indicator for compostable plastic. In that case, only the “knife” sample can be considered compostable, as it practically lost 100% of its dry weight after 3 months. The plate lost around 70% of its dry mass after 3 months, but according to the trend of weight loss (Figure 2), it would not be expected to reach the 90% threshold value after 6 months to be rendered compostable.
The high variations of aerobic biodegradability among the PLA products used here indicate that the determination of plastic products as biodegradable, even if produced from the same biopolymer (i.e., PLA), is not sufficient to acknowledge the required conditions for their complete degradation. That is, biodegradation criteria should be more clearly defined compared to the existing criteria since simple weight loss as a sole biodegradation indicator might be misleading [37] since it may not indicate mineralization to CO2. In fact, dry weight loss and CO2 production measurements have been reported as two different testing methods for the assessment of biodegradation of bioplastics under aerobic conditions [38]. The concurrent use of both monitoring methodologies for the assessment of biodegradability has been recommended [34,38]. Regulatory interventions to improve standards and labeling biodegradable plastics are necessary for sustainability [39]. In relation to this, specific actions should be undertaken, which would include the determination of biodegradability under a wide range of testing environments and conditions, as well as the assessment of feedstock and chemicals as influential factors on biodegradation rates [40].
The results of this work demonstrate that biodegradation of PLA is generally feasible under thermophilic conditions, as has been often demonstrated in the literature. These conditions are more often encountered in dedicated industrial composting facilities than in simple home composting [8], as in the latter, thermophilic temperatures hardly appear. However, 100% degradation of PLA samples in dedicated facilities is not a guarantee [29]; this might be attributed not only to the biodegradation performance of PLA-based products but also to the design of composting facilities that handle these materials. As PLA is poor in nutrients, it has to be mixed with organic materials during composting [38]. Therefore the addition of compost in PLA-based samples during their biodegradation is essential. On the one hand, the role of compost as an accelerator of the process, serving as both a nutrient source and an inoculum, is beneficial. On the other hand, mixing compost with PLA may lead to the release of microplastics into the environment since evidence has shown that microplastic fragments from PLA samples are released after 2 months of composting [29] and after a burying time of 90 days [30].
The results of this work also indicate that a new index of biodegradation should be developed that could combine both dry weight loss and CO2 generation. That is, neither of the two can stand as biodegradability indexes on their own, as these two parameters were found in this work not to correlate. For example, an ad-hoc index that would be calculated from the mathematical product of those two parameters could be further investigated as a novel index to assess the biodegradability of bioplastics in future work. Moreover, it would be ideal to close the C balance by performing measurements of solid C losses of the bioplastics during the process and comparing those to the C–CO2 generated. However, this is not easy to do, as the contribution of the inoculum to the overall CO2 generation needs to be accurately assessed.

4. Conclusions

This study provided insights into the biodegradation rate of PLA products under thermophilic aerobic conditions. The biodegradation of PLA-based products is efficient under thermophilic conditions indicating that it requires dedicated industrial composting facilities instead of home composting as the latter rarely reach thermophilic conditions. The dry weight losses considerably differed among the five PLA-based products used here and ranged from 15.1% to 99.7% after 90 days despite the identical experimental conditions and the fact that all five bioplastics were PLA based. This indicates that the physical characteristics and the raw materials used to manufacture PLA-based products can play a critical role in their biodegradation after they become wastes. The gross production of CO2 also showed significant variation among the samples (9.2–14.9 g C–CO2/dry kg mixture), but there was no statistically significant positive correlation between CO2 generation and dry weight loss. This lack of correlation was proven by the fact that the resulting linear regression model was not statistically significant at α = 0.05 (p-value = 0.656) and indicated that biodegradation of bioplastics might follow different pathways depending on the mechanical properties of the bioplastic products. That is, weight loss may not indicate the conversion of solid C to CO2.
Before the full-scale use of biodegradable plastics at a commercial level, as an alternative solution to conventional plastics, due to potential benefits arising from their End of Life (EoL) fate, it is important to understand and evaluate their biodegradability under several environmental conditions considering their structural and chemical characteristics as well as to properly choose biodegradability assessment methods. An optimized biodegradation index that would mathematically combine both dry weight loss and CO2 generation could constitute a novel quality assurance measure to precisely assess the biodegradability potential of biodegradable plastics.

Author Contributions

Conceptualization: D.K.; Data curation: D.M. and A.A.; Formal analysis: D.K., D.M. and A.A.; Investigation: D.K., D.M. and A.A.; Methodology: D.K., D.M. and A.A.; Project administration, D.K.; Supervision, D.K.; Validation; D.M. and D.K.; Writing-original draft, D.M. and S.G.; Writing-review and editing S.G., D.M. and D.K. All authors have read and agreed to the published version of the manuscript.

Funding

This research received no external funding.

Institutional Review Board Statement

Not applicable.

Informed Consent Statement

Not applicable.

Data Availability Statement

Data can be available after request.

Acknowledgments

The authors wish to thank Dimitris Achilias for providing the “bioflex” bioplastic used in this work.

Conflicts of Interest

The authors declare no conflict of interest.

References

  1. STATISTICA. Projected Plastic Waste Generation Worldwide from 2019 to 2060. Available online: https://www.statista.com/statistics/1338839/global-plastic-waste-generation-outlook/ (accessed on 26 February 2023).
  2. STATISTICA. Distribution of Plastic Waste Generation Worldwide in 2018, by Sector. Available online: https://www.statista.com/statistics/1166582/global-plastic-waste-generation-by-sector/ (accessed on 26 February 2023).
  3. UNEP. Our Planet is Choking on Plastic. Available online: https://www.unep.org/interactives/beat-plastic-pollution/ (accessed on 26 February 2023).
  4. OECD. Plastic Pollution Is Growing Relentlessly as Waste Management and Recycling Fall Short, Says OECD. Available online: https://www.oecd.org/environment/plastic-pollution-is-growing-relentlessly-as-waste-management-and-recycling-fall-short.htm#:~:text=Globally%2C%20only%209%25%20of%20plastic,recycled%20while%2022%25%20is%20mismanaged (accessed on 26 February 2023).
  5. OECD. Plastic Leakage and Greenhouse Gas Emissions Are Increasing. Available online: https://www.oecd.org/environment/plastics/increased-plastic-leakage-and-greenhouse-gas-emissions.htm (accessed on 26 February 2023).
  6. EuropeanBioplastics. What Are Bioplastics? Available online: https://www.european-bioplastics.org/bioplastics/ (accessed on 26 February 2023).
  7. Bioplastics Europe. What Are “Bio-Plastics”? Available online: https://bioplasticseurope.eu/about (accessed on 26 February 2023).
  8. Gerassimidou, S.; Martin, O.V.; Chapman, S.P.; Hahladakis, J.N.; Iacovidou, E. Development of an integrated sustainability matrix to depict challenges and trade-offs of introducing bio-based plastics in the food packaging value chain. J. Clean. Prod. 2021, 286, 125378. [Google Scholar] [CrossRef]
  9. European Bioplastics. Bioplastics Market Data. Available online: https://www.european-bioplastics.org/market/ (accessed on 26 February 2023).
  10. Vaverková, M.D.; Adamcová, D. Biodegrability of bioplastic materials in a controlled composting environment. J. Ecol. Eng. 2015, 16, 155–160. [Google Scholar] [CrossRef]
  11. Folino, A.; Karageorgiou, A.; Calabrò, P.S.; Komilis, D. Biodegradation of wasted bioplastics in natural and industrial environments: A review. Sustainability 2020, 12, 6030. [Google Scholar] [CrossRef]
  12. Emadian, S.M.; Onay, T.T.; Demirel, B. Biodegradation of bioplastics in natural environments. Waste Manag. 2017, 59, 526–536. [Google Scholar] [CrossRef]
  13. Pires, J.R.A.; Souza, V.G.L.; Fuciños, P.; Pastrana, L.; Fernando, A.L. Methodologies to assess the biodegradability of bio-based polymers—Current knowledge and existing gaps. Polymers 2022, 14, 1359. [Google Scholar] [CrossRef]
  14. Hahladakis, J.N.; Iacovidou, E. Closing the loop on plastic packaging materials: What is quality and how does it affect their circularity? Sci. Total Environ. 2018, 630, 1394–1400. [Google Scholar] [CrossRef]
  15. RameshKumar, S.; Shaiju, P.; O’Connor, K.E. Bio-based and biodegradable polymers-State-of-the-art, challenges and emerging trends. Curr. Opin. Green Sustain. Chem. 2020, 21, 75–81. [Google Scholar] [CrossRef]
  16. Karamanlioglu, M.; Preziosi, R.; Robson, G.D. Abiotic and biotic environmental degradation of the bioplastic polymer poly (lactic acid): A review. Polym. Degrad. Stab. 2017, 137, 122–130. [Google Scholar] [CrossRef] [Green Version]
  17. Jiménez, L.; Mena, M.; Prendiz, J.; Salas, L.; Vega-Baudrit, J. Polylactic acid (PLA) as a bioplastic and its possible applications in the food industry. J. Food Sci. Nutr. 2019, 5, 2–6. [Google Scholar]
  18. Kalita, N.K.; Damare, N.A.; Hazarika, D.; Bhagabati, P.; Kalamdhad, A.; Katiyar, V. Biodegradation and characterization study of compostable PLA bioplastic containing algae biomass as potential degradation accelerator. Environ. Chall. 2021, 3, 100067. [Google Scholar] [CrossRef]
  19. Rudnik, E.; Briassoulis, D. Degradation behaviour of poly(lactic acid) films and fibres in soil under Mediterranean field conditions and laboratory simulations testing. Ind. Crop. Prod. 2011, 33, 648–658. [Google Scholar] [CrossRef]
  20. Kalita, N.K.; Sarmah, A.; Bhasney, S.M.; Kalamdhad, A.; Katiyar, V. Demonstrating an ideal compostable plastic using biodegradability kinetics of poly (lactic acid)(PLA) based green biocomposite films under aerobic composting conditions. Environ. Chall. 2021, 3, 100030. [Google Scholar] [CrossRef]
  21. Kalita, N.K.; Nagar, M.K.; Mudenur, C.; Kalamdhad, A.; Katiyar, V. Biodegradation of modified Poly (lactic acid) based biocomposite films under thermophilic composting conditions. Polym. Test. 2019, 76, 522–536. [Google Scholar] [CrossRef]
  22. Cucina, M.; Carlet, L.; De Nisi, P.; Somensi, C.A.; Giordano, A.; Adani, F. Degradation of biodegradable bioplastics under thermophilic anaerobic digestion: A full-scale approach. J. Clean. Prod. 2022, 368, 133232. [Google Scholar] [CrossRef]
  23. USDA; USCC. Test Methods for the Examination of Composting and Compost; Thomson, W., Ed.; The Composting Council Research and Education Foundation: Holbrook, NY, USA, 2002.
  24. Komilis, D.P.; Ham, R.K. A laboratory method to investigate gaseous emissions and solids decomposition during composting of municipal solid wastes. Compost. Sci. Util. 2000, 8, 254–265. [Google Scholar] [CrossRef]
  25. Zaborowska, M.; Bernat, K.; Pszczółkowski, B.; Cydzik-Kwiatkowska, A.; Kulikowska, D.; Wojnowska-Baryła, I. Multi-faceted analysis of thermophilic anaerobic biodegradation of poly(lactic acid)-based material. Waste Manag. 2023, 155, 40–52. [Google Scholar] [CrossRef]
  26. Sarasa, J.; Gracia, J.M.; Javierre, C. Study of the biodisintegration of a bioplastic material waste. Bioresour. Technol. 2009, 100, 3764–3768. [Google Scholar] [CrossRef] [PubMed]
  27. Mulbry, W.; Ahn, H. Greenhouse gas emissions during composting of dairy manure: Influence of the timing of pile mixing on total emissions. Biosyst. Eng. 2014, 126, 117–122. [Google Scholar] [CrossRef]
  28. Sangamithirai, K.; Jayapriya, J.; Hema, J.; Manoj, R. Evaluation of in-vessel co-composting of yard waste and development of kinetic models for co-composting. Int. J. Recycl. Org. Waste Agric. 2015, 4, 157–165. [Google Scholar] [CrossRef] [Green Version]
  29. Ruggero, F.; Onderwater, R.C.; Carretti, E.; Roosa, S.; Benali, S.; Raquez, J.-M.; Gori, R.; Lubello, C.; Wattiez, R. Degradation of film and rigid bioplastics during the thermophilic phase and the maturation phase of simulated composting. J. Polym. Environ. 2021, 29, 3015–3028. [Google Scholar] [CrossRef]
  30. Boonmee, C.; Kositanont, C.; Leejarkpai, T. Degradation of poly (lactic acid) under simulated landfill conditions. Environ. Nat. Resour. J. 2016, 14, 1–9. [Google Scholar]
  31. Stloukal, P.; Kalendova, A.; Mattausch, H.; Laske, S.; Holzer, C.; Koutny, M. The influence of a hydrolysis-inhibiting additive on the degradation and biodegradation of PLA and its nanocomposites. Polym. Test. 2015, 41, 124–132. [Google Scholar] [CrossRef]
  32. Brdlík, P.; Novák, J.; Borůvka, M.; Běhálek, L.; Lenfeld, P. The Influence of Plasticizers and Accelerated Ageing on Biodegradation of PLA under Controlled Composting Conditions. Polymers 2023, 15, 140. [Google Scholar] [CrossRef] [PubMed]
  33. Zaaba, N.F.; Jaafar, M. A review on degradation mechanisms of polylactic acid: Hydrolytic, photodegradative, microbial, and enzymatic degradation. Polym. Eng. Sci. 2020, 60, 2061–2075. [Google Scholar] [CrossRef]
  34. Salomez, M.; George, M.; Fabre, P.; Touchaleaume, F.; Cesar, G.; Lajarrige, A.; Gastaldi, E. A comparative study of degradation mechanisms of PHBV and PBSA under laboratory-scale composting conditions. Polym. Degrad. Stab. 2019, 167, 102–113. [Google Scholar] [CrossRef]
  35. EN 13432:2000; Packaging. Requirements for packaging recoverable through composting and biodegradation. Test scheme and evaluation criteria for the final acceptance of packaging. European Norm: Brussels, Belgium.
  36. EN 14995:2006; Plastics—Evaluation of compostability - Test scheme and specifications. European Norm: Brussels, Belgium.
  37. Zumstein, M.T.; Narayan, R.; Kohler, H.-P.E.; McNeill, K.; Sander, M. Dos and do nots when assessing the biodegradation of plastics. Environ. Sci. Technol. 2019, 53, 9967–9969. [Google Scholar] [CrossRef] [PubMed] [Green Version]
  38. Ruggero, F.; Gori, R.; Lubello, C. Methodologies to assess biodegradation of bioplastics during aerobic composting and anaerobic digestion: A review. Waste Manag. Res. 2019, 37, 959–975. [Google Scholar] [CrossRef] [Green Version]
  39. Bhagwat, G.; Gray, K.; Wilson, S.P.; Muniyasamy, S.; Vincent, S.G.T.; Bush, R.; Palanisami, T. Benchmarking bioplastics: A natural step towards a sustainable future. J. Polym. Environ. 2020, 28, 3055–3075. [Google Scholar] [CrossRef]
  40. Rossi, V.; Cleeve-Edwards, N.; Lundquist, L.; Schenker, U.; Dubois, C.; Humbert, S.; Jolliet, O. Life cycle assessment of end-of-life options for two biodegradable packaging materials: Sound application of the European waste hierarchy. J. Clean. Prod. 2015, 86, 132–145. [Google Scholar] [CrossRef]
Figure 1. Dry weight loss (%) of all PLA-based products used in this work after a three-month thermophilic aerobic period. Error bars are standard errors of the means based on n = 3.
Sustainability 15 11411 g001
Figure 2. Dry weight change of the five PLA-based products versus time during the three-month thermophilic aerobic degradation period (error bars are the standard error of the means based on triplicate measurements).
Sustainability 15 11411 g002
Figure 3. Total C–CO2 cumulative production by the mixtures of the five PLA-based products with the compost during the three-month thermophilic aerobic degradation. The C–CO2 production is expressed per dry kg of the initial substrate (PLA + compost or compost alone) placed in the vessel on day 0.
Sustainability 15 11411 g003
Figure 4. Correlation between dry weight loss (%) and cumulative C–CO2 generation (in g/dry kg of initial mixture) after 90 days of thermophilic composting. The regression equation shown is non-significant.
Sustainability 15 11411 g004
Table 1. Moisture (% w.w. 1) and volatile solids content (% d.w. 2) of the five PLA-based products and the compost at the initiation of the experiment.
SubstratesMoisture Content (% w.w. 1)Volatile Solids (% d.w. 2)
Plate5.6 (±1.8)99.5 (±0.1)
Green bag1.5 (±0.9)98.3 (±0.1)
Bioflex0.4 (±0.1)94.8 (±0.1)
Knife0.4 (±0.1)90.5 (±1.1)
Bakery bag0.4 (±0.1)79.3 (±0.1)
Compost7.1 (±0.2)48.2 (±0.3)
1 on a wet weight basis, 2 on a dry weight basis. Values in brackets are the standard errors of the mean.
Disclaimer/Publisher’s Note: The statements, opinions and data contained in all publications are solely those of the individual author(s) and contributor(s) and not of MDPI and/or the editor(s). MDPI and/or the editor(s) disclaim responsibility for any injury to people or property resulting from any ideas, methods, instructions or products referred to in the content.

