
Analysis of Factors Affecting Walking Speed Based on Natural Field Data: Considering the Attributes of Travelers and the Travel Environment

Abstract
:1. Introduction
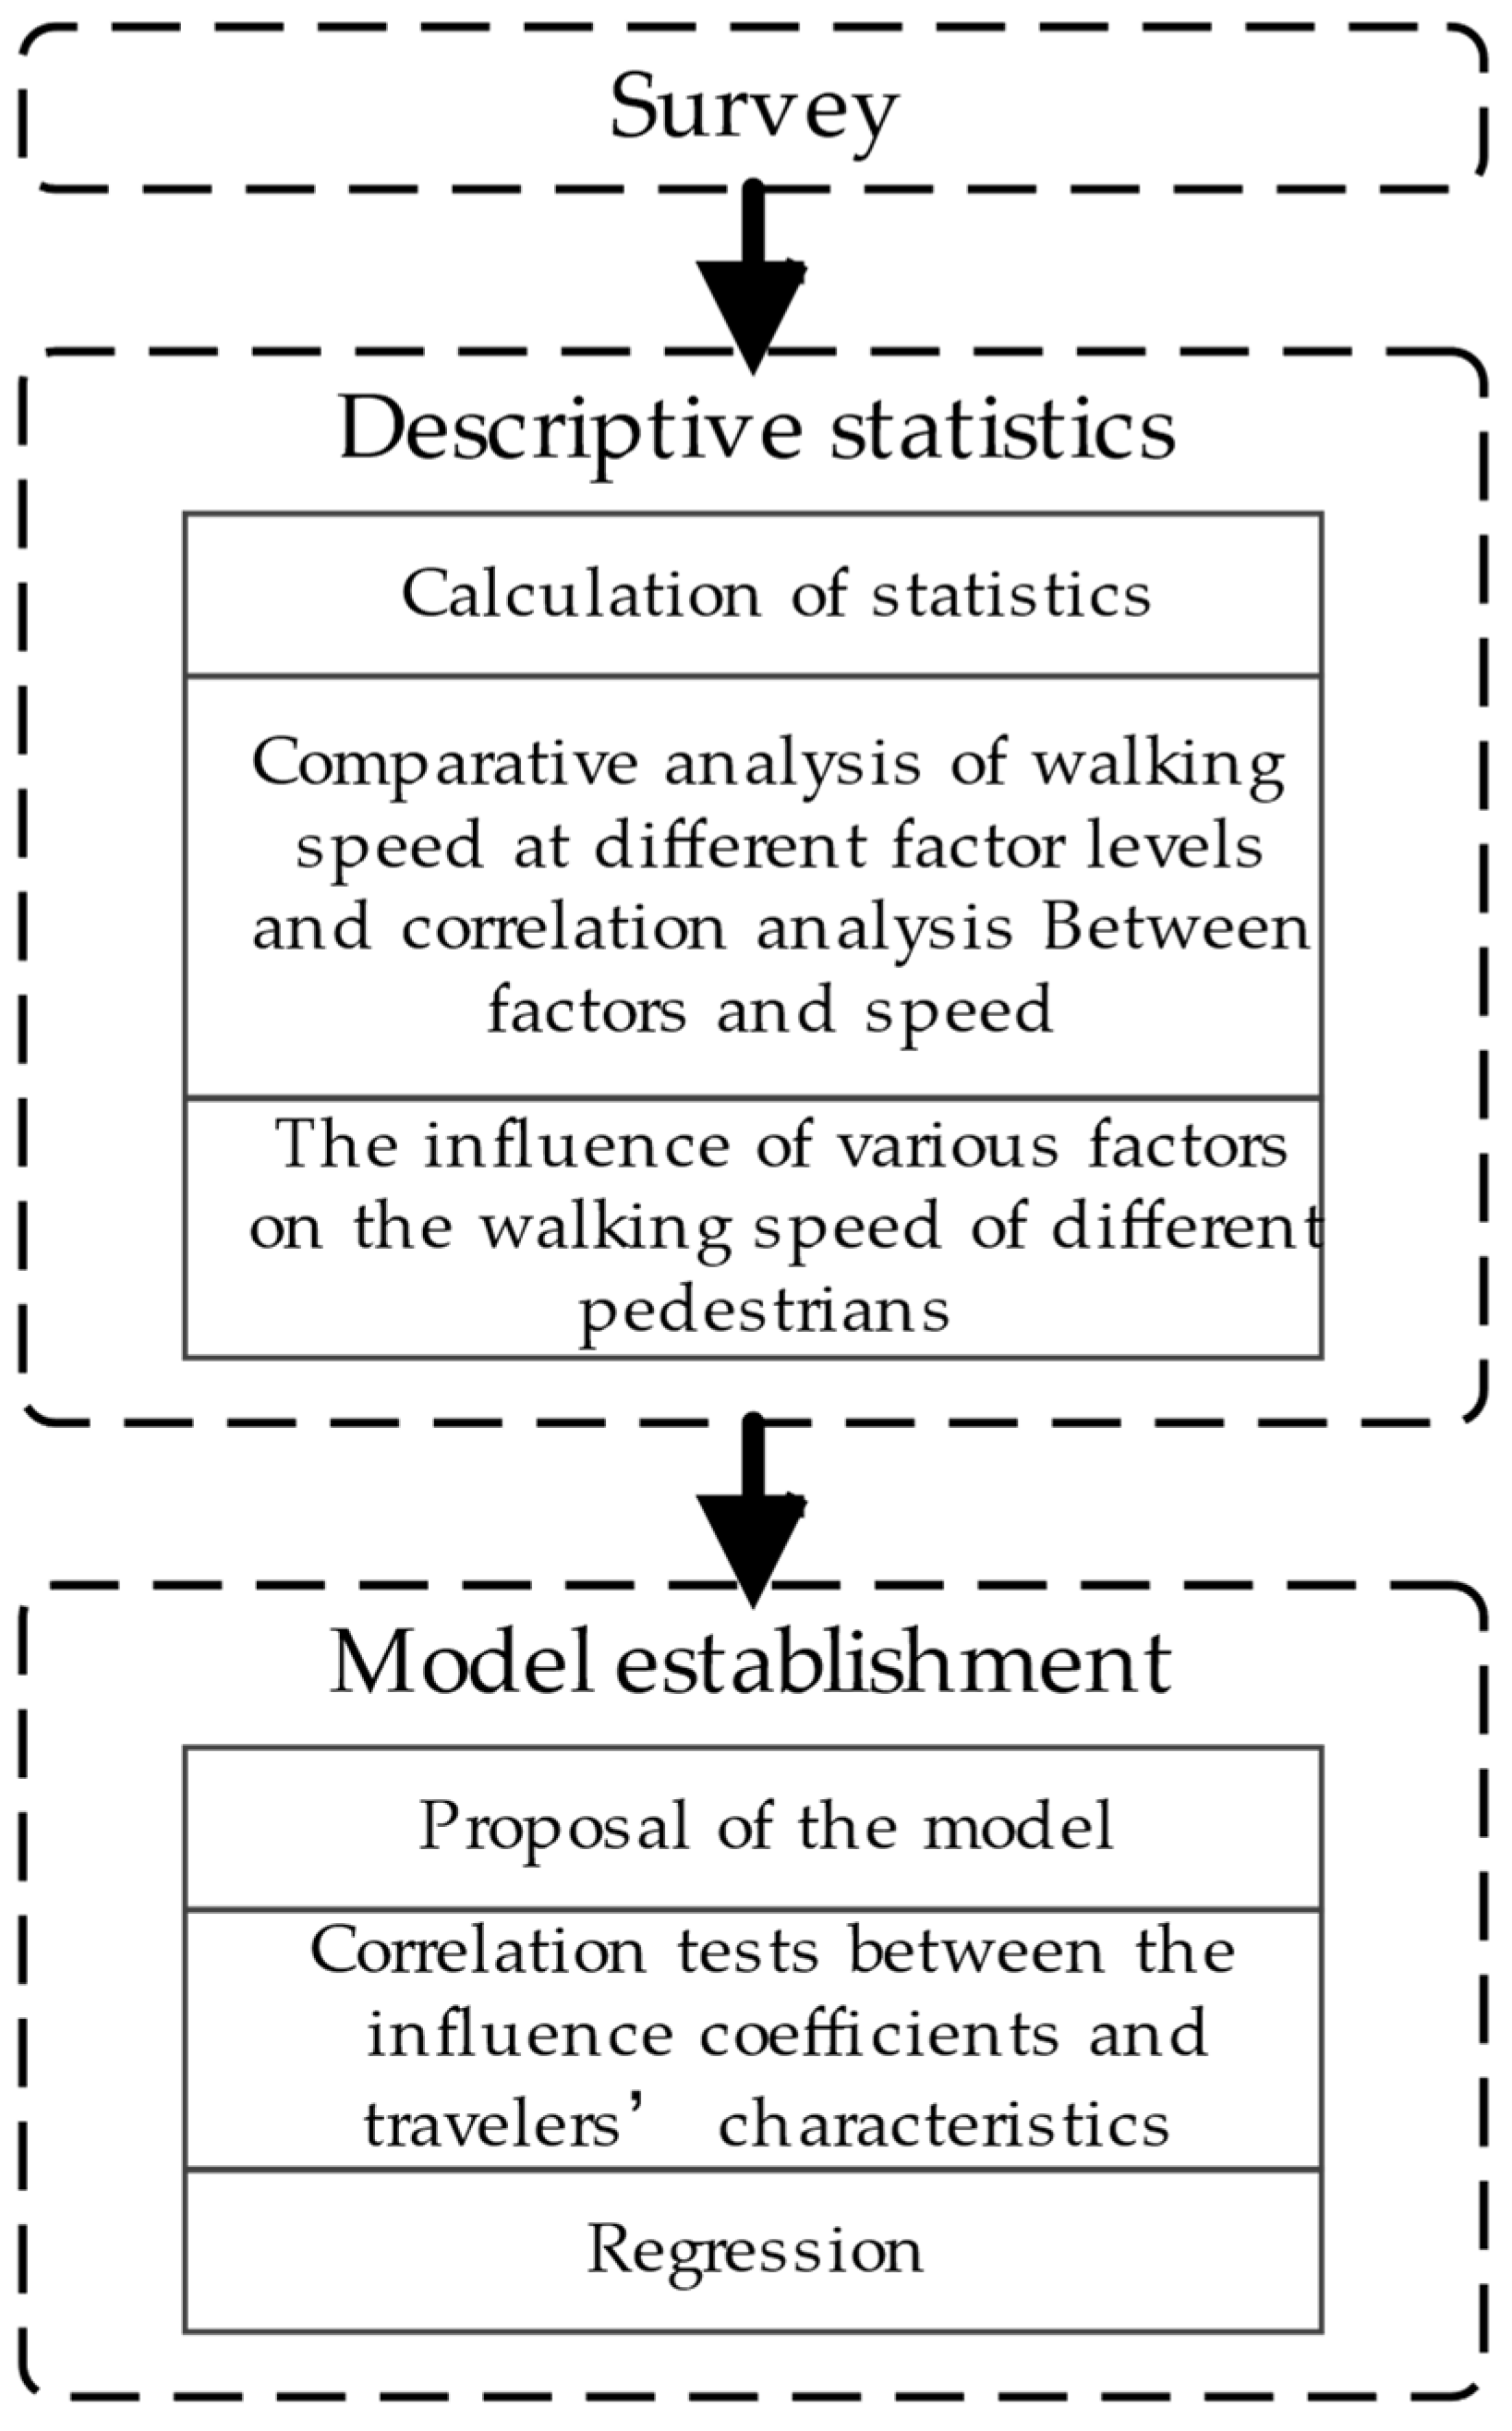
2. Methods
- Average walking speed for the entire travel.
- Personal characteristics:
- Age
- Gender
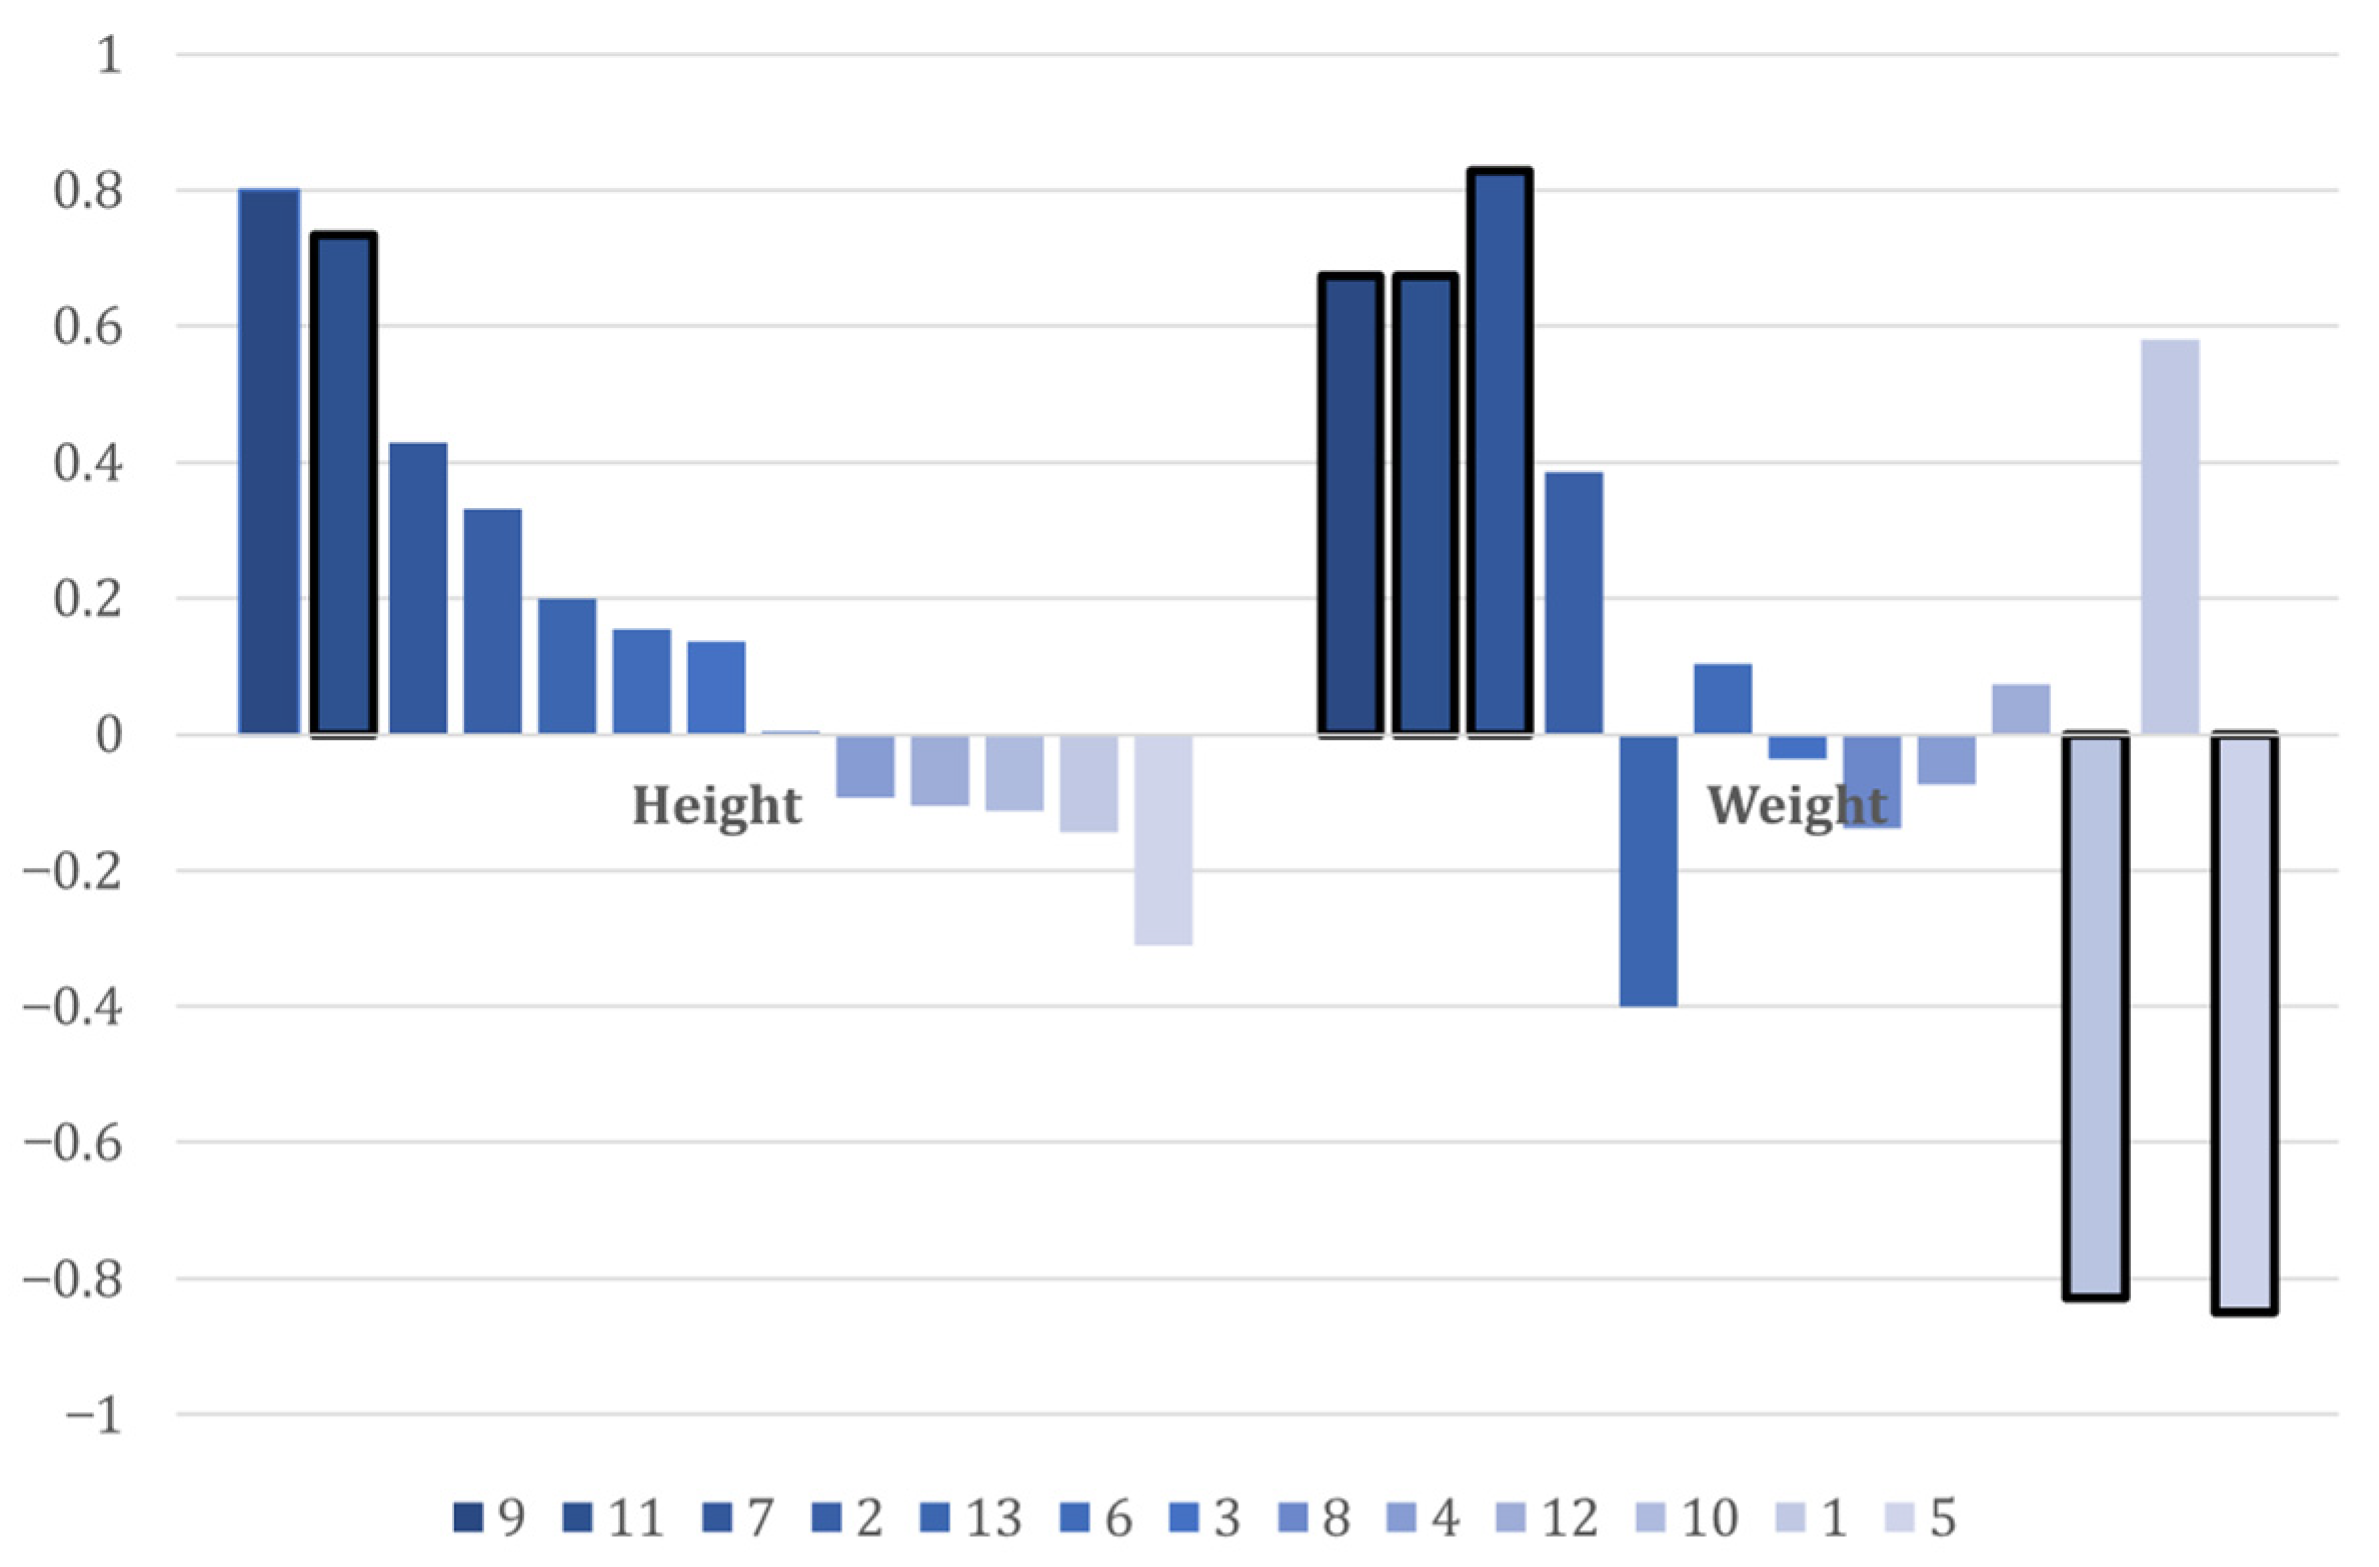
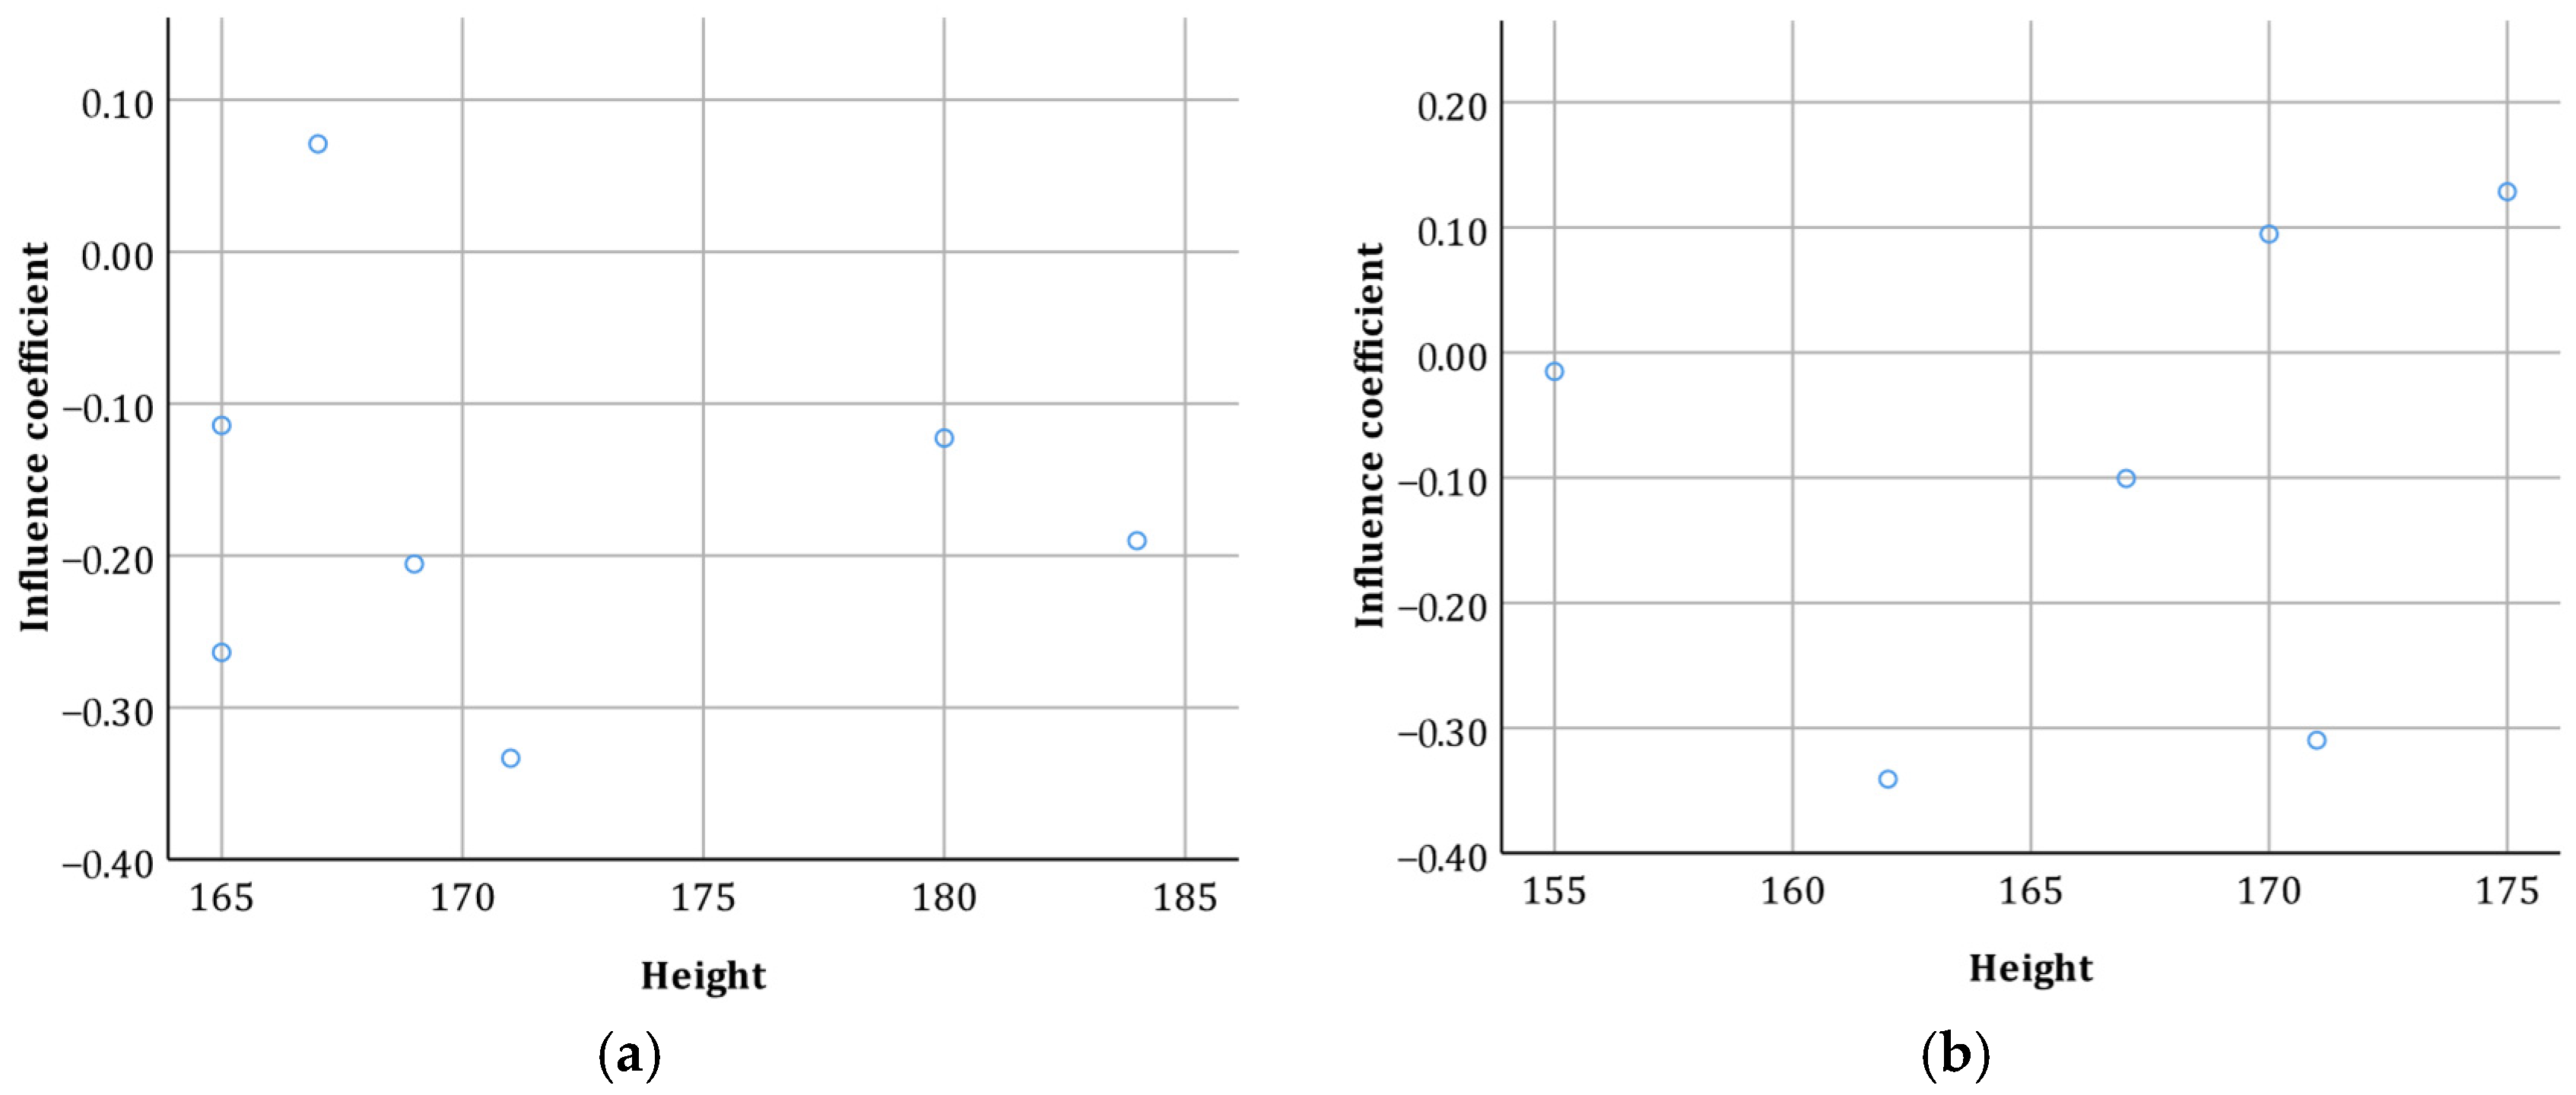
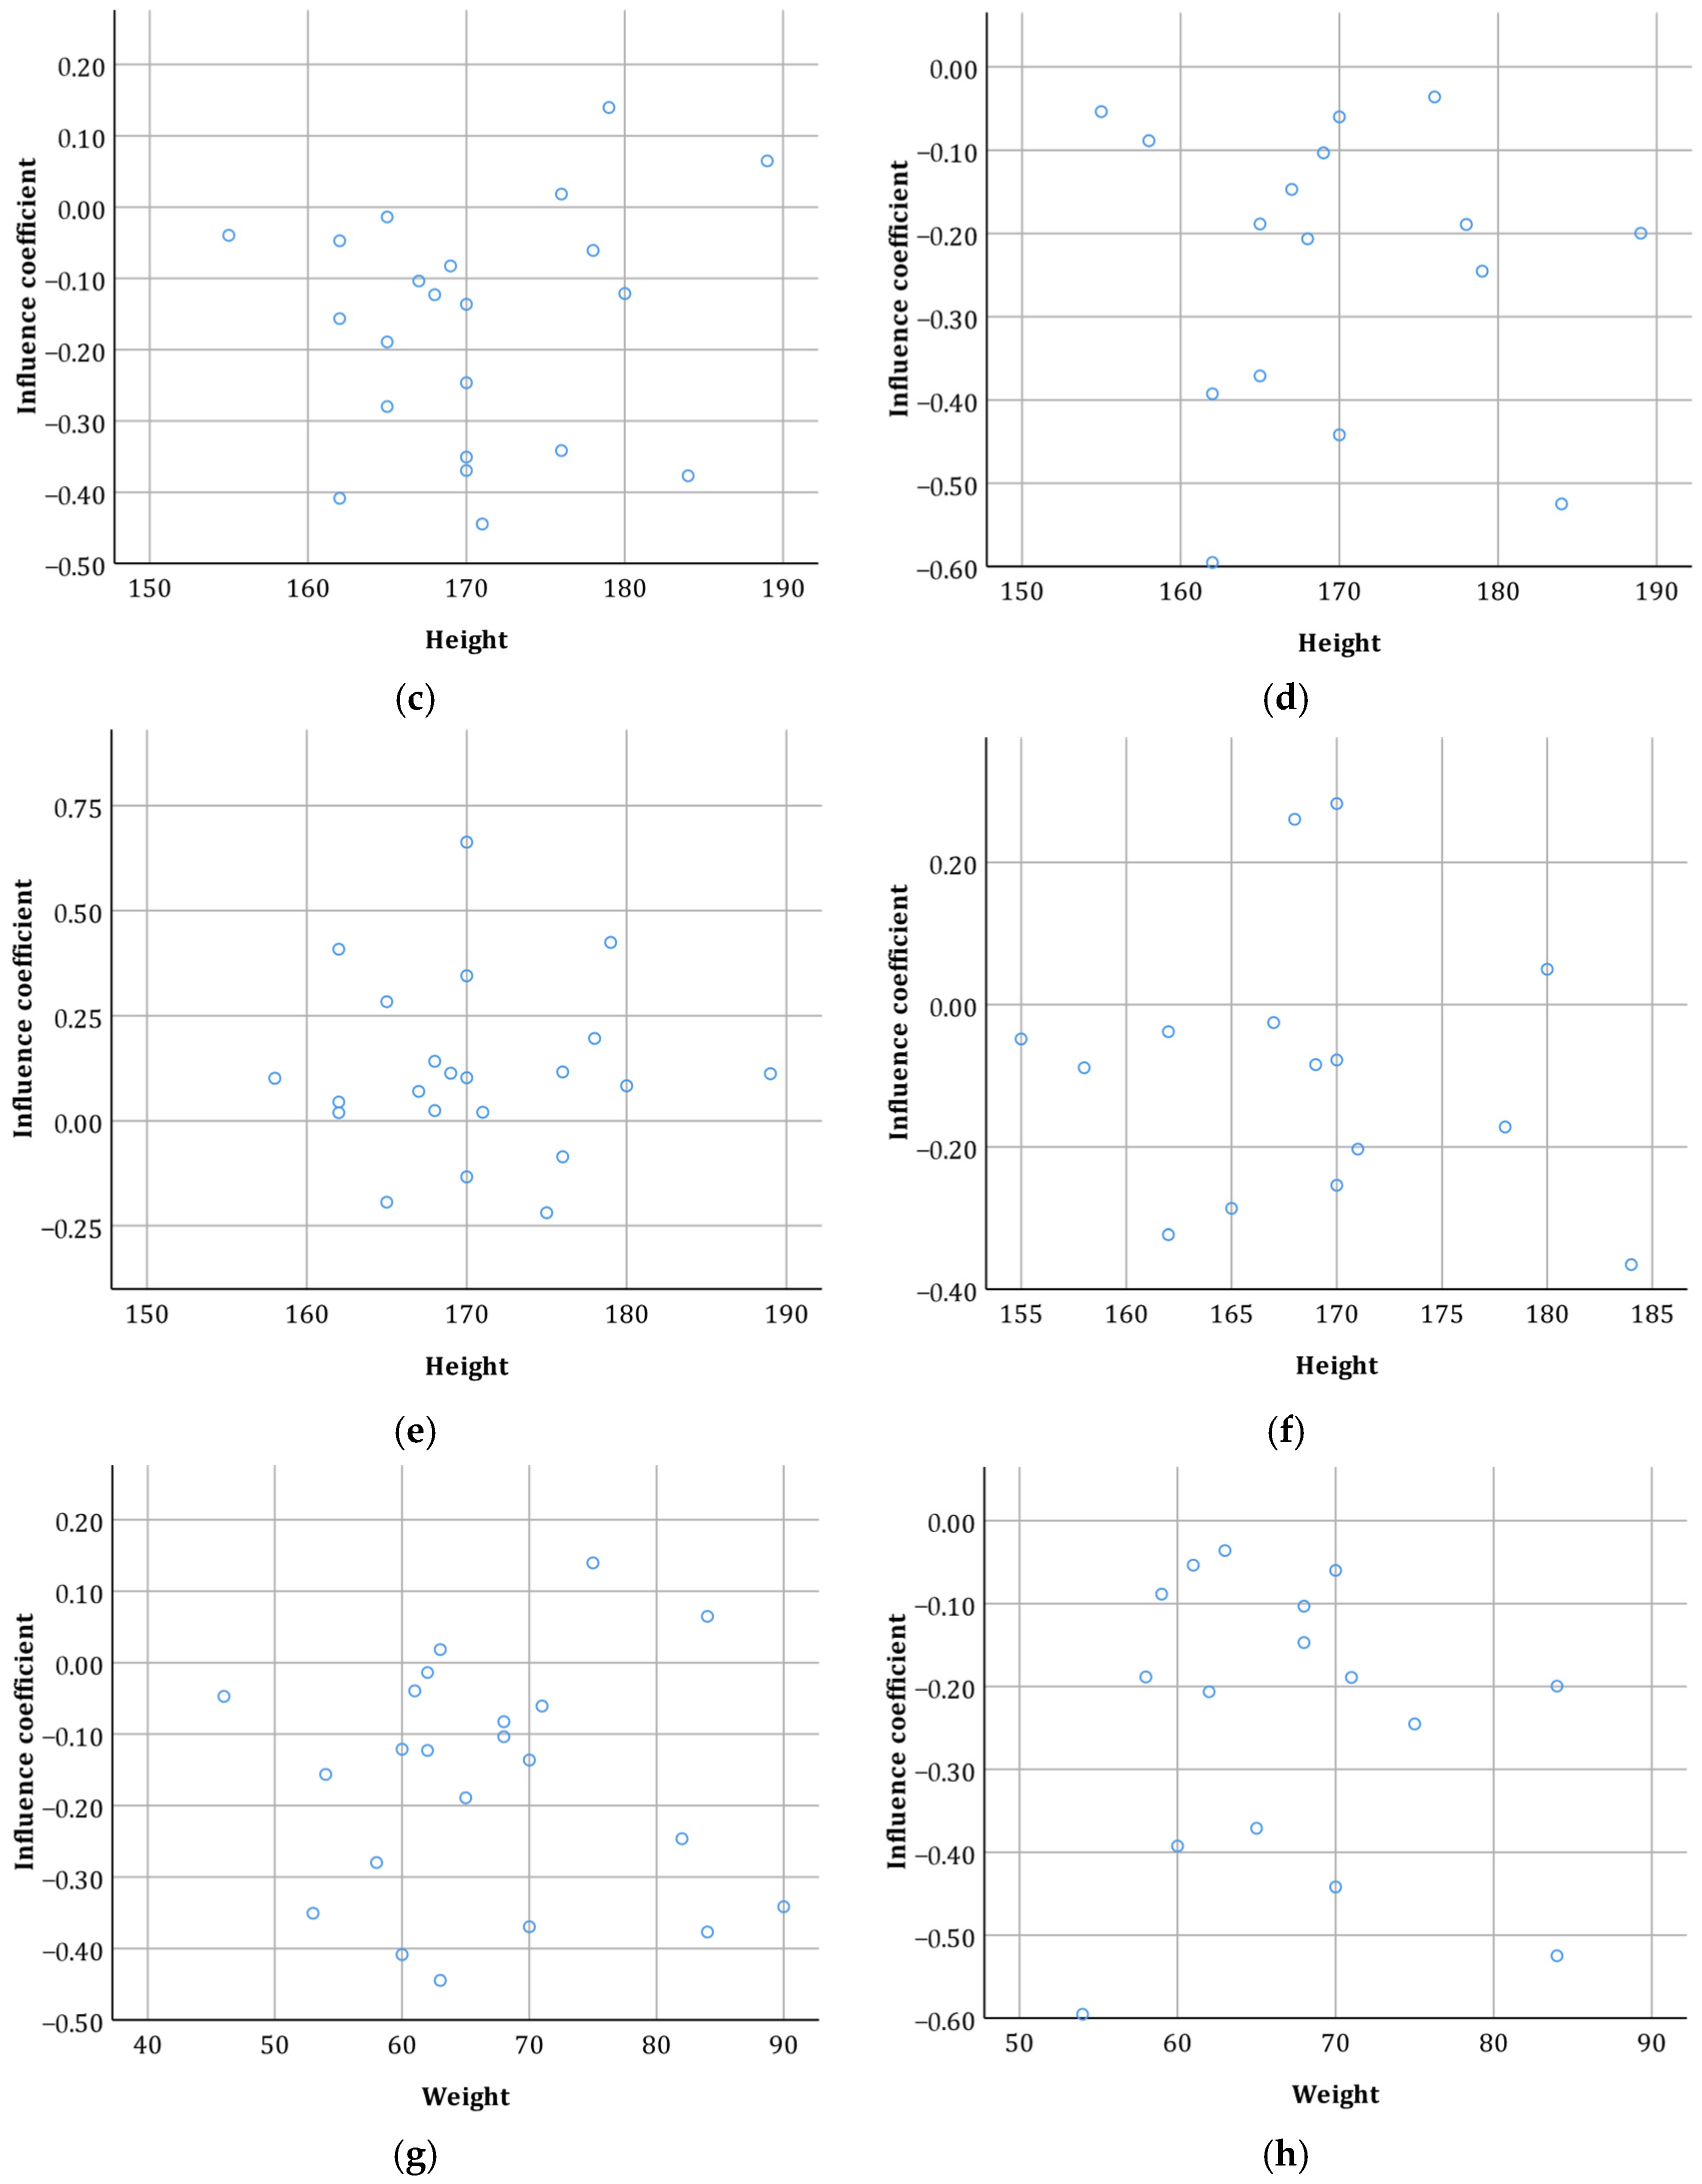
- Height
- Weight
- Environmental and self-variable factors:
- Travel distance, volunteers can refer to navigation Apps.
- Road smoothness, determined subjectively by the volunteers as either “smooth” or “uneven”.
- Weather, obtained by volunteers through weather information apps or other means.
- Influence of wind, determined subjectively by the volunteers as one of the following: “no influence”, “low headwind effect”, “high headwind effect”, “low tailwind effect”, “high tailwind effect”, or “strong crosswind”.
- Road conditions, categorized as “dry”, “puddles”, “snow-covered”, “ice-water mixture”, or “icy”.
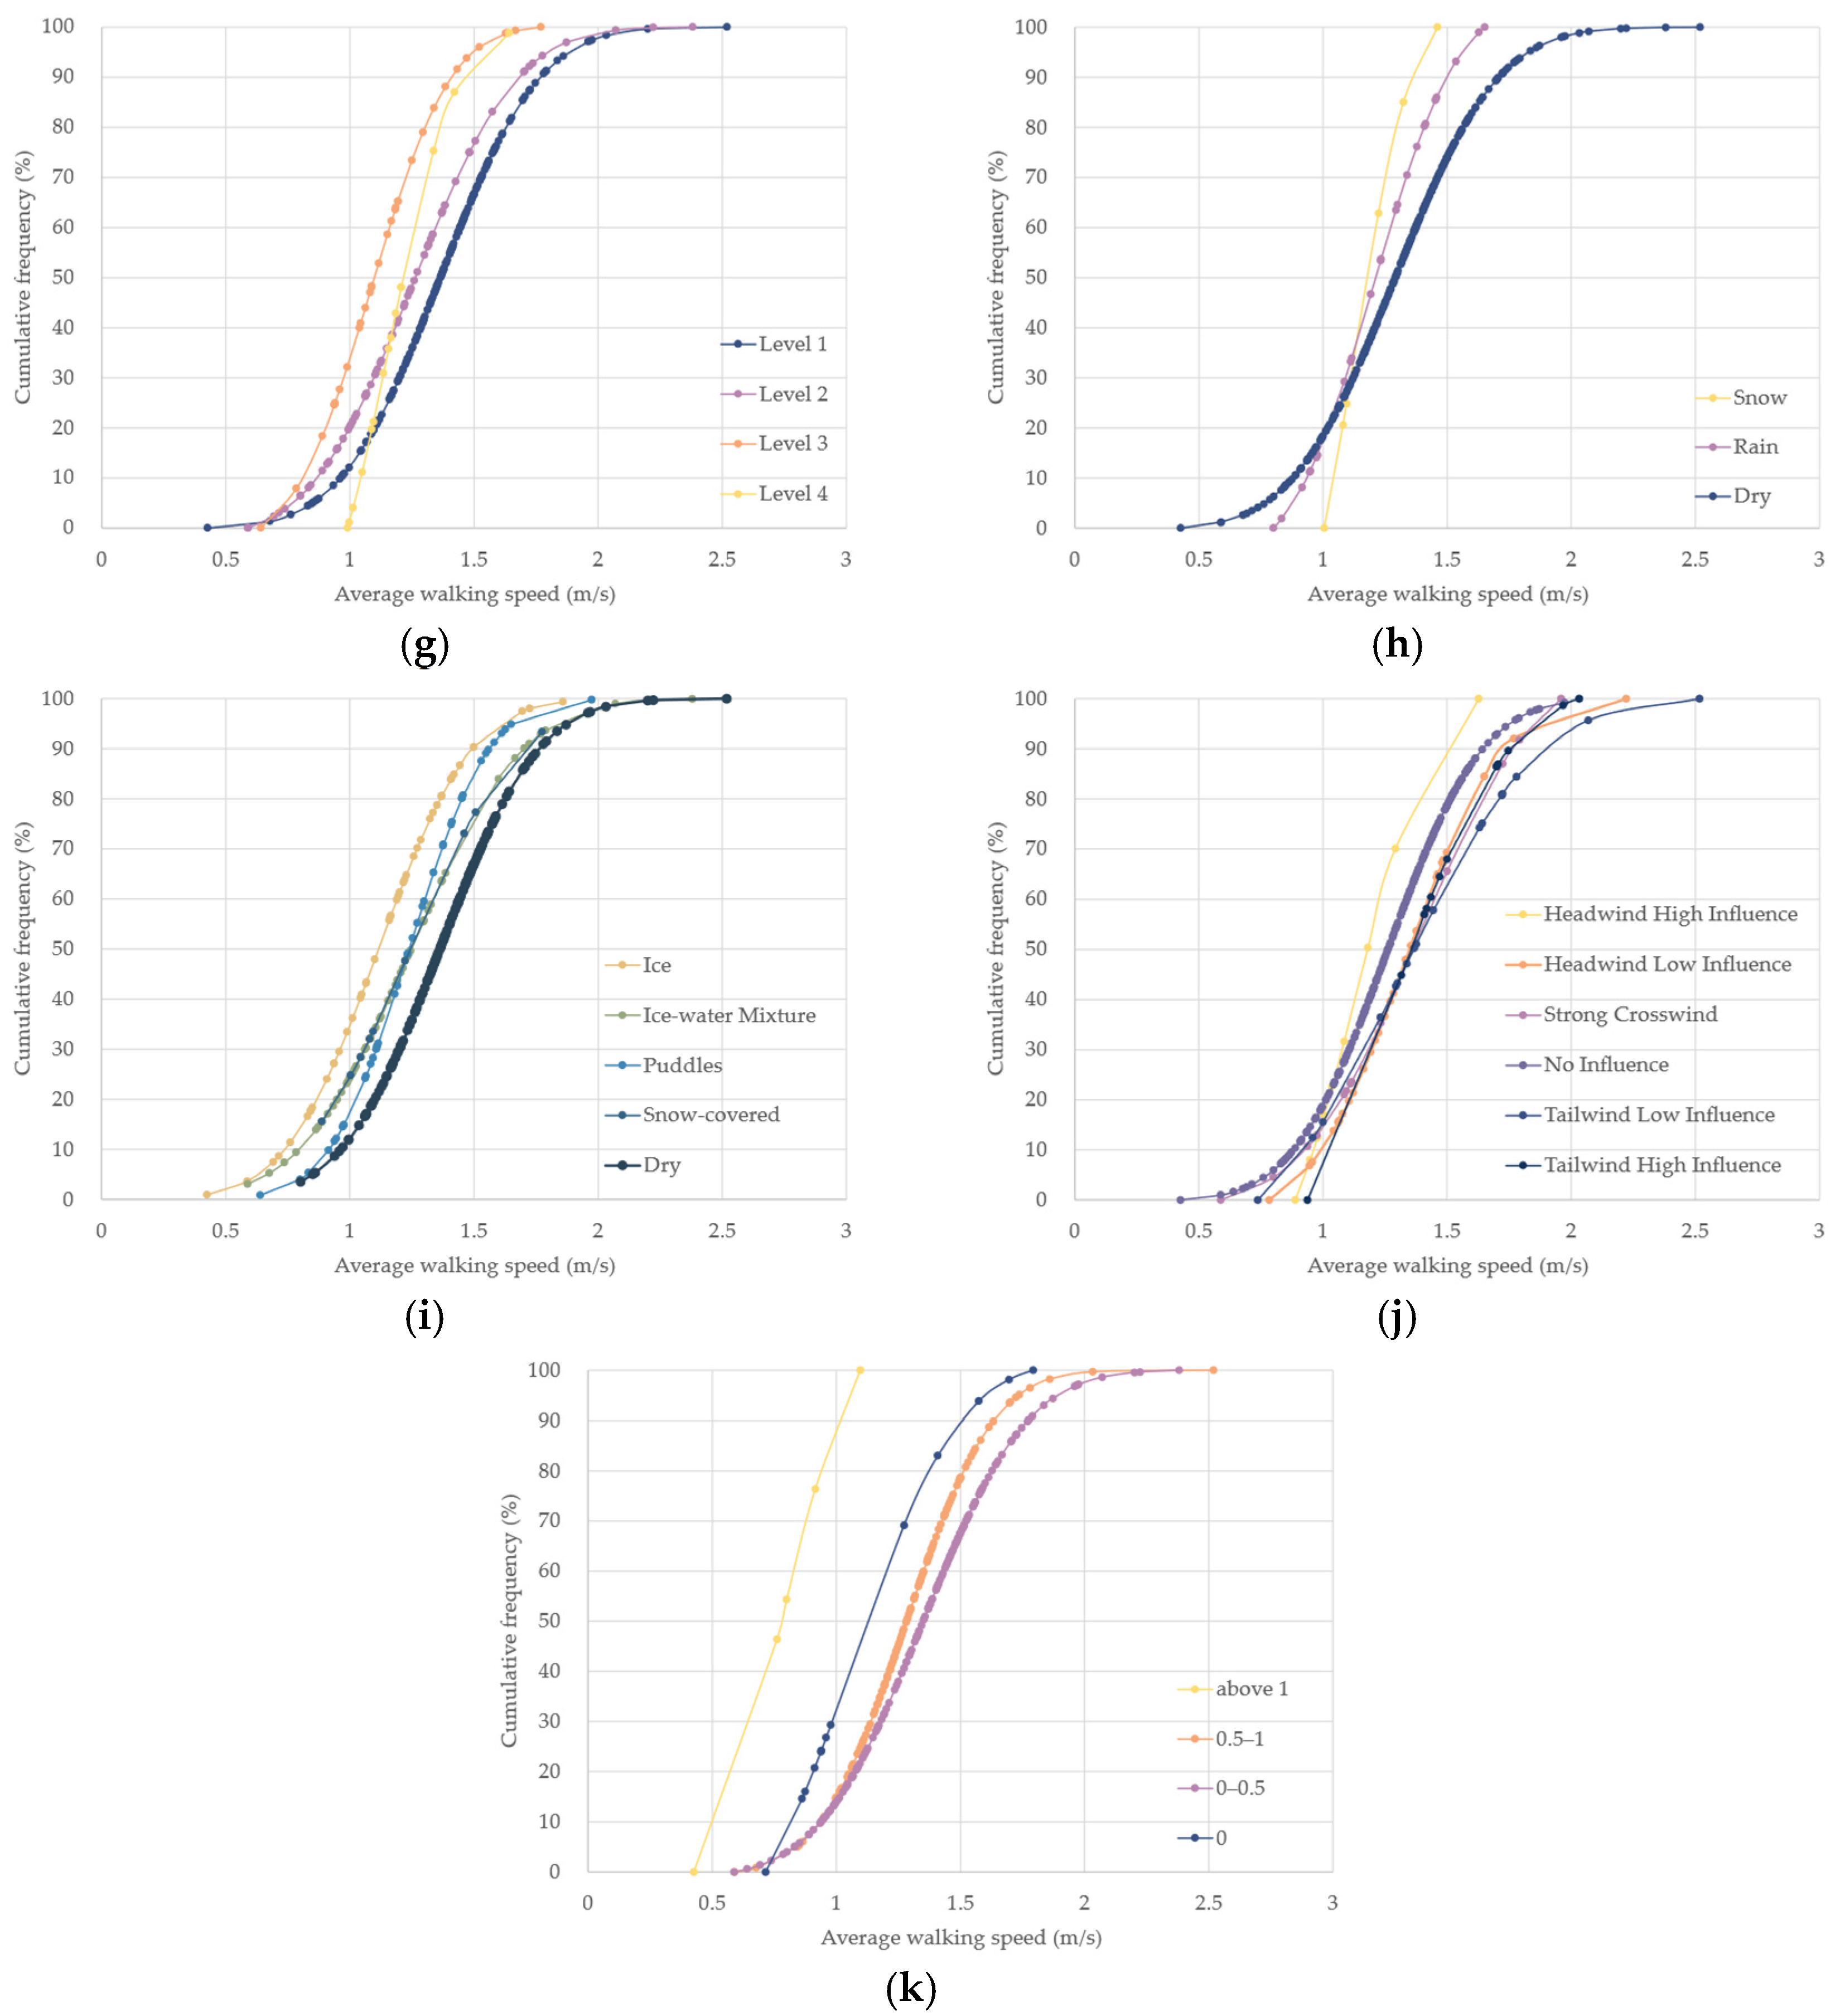
- LOS for pedestrian sidewalks, evaluated based on the average longitudinal distance between pedestrians. Categorized as level 1 for distances above 2.5 m, level 2 for distances between 1.8 and 2.5 m, level 3 for distances between 1.4 and 1.8 m, and level 4 for distances below 1.4 m.
- Rushed level, with options of “rushed” or “not rushed”.
- The number of intersections per 100 m, counted based on those with pedestrian crossing behavior, excluding those without any crossing behavior.
3. Analysis and Results
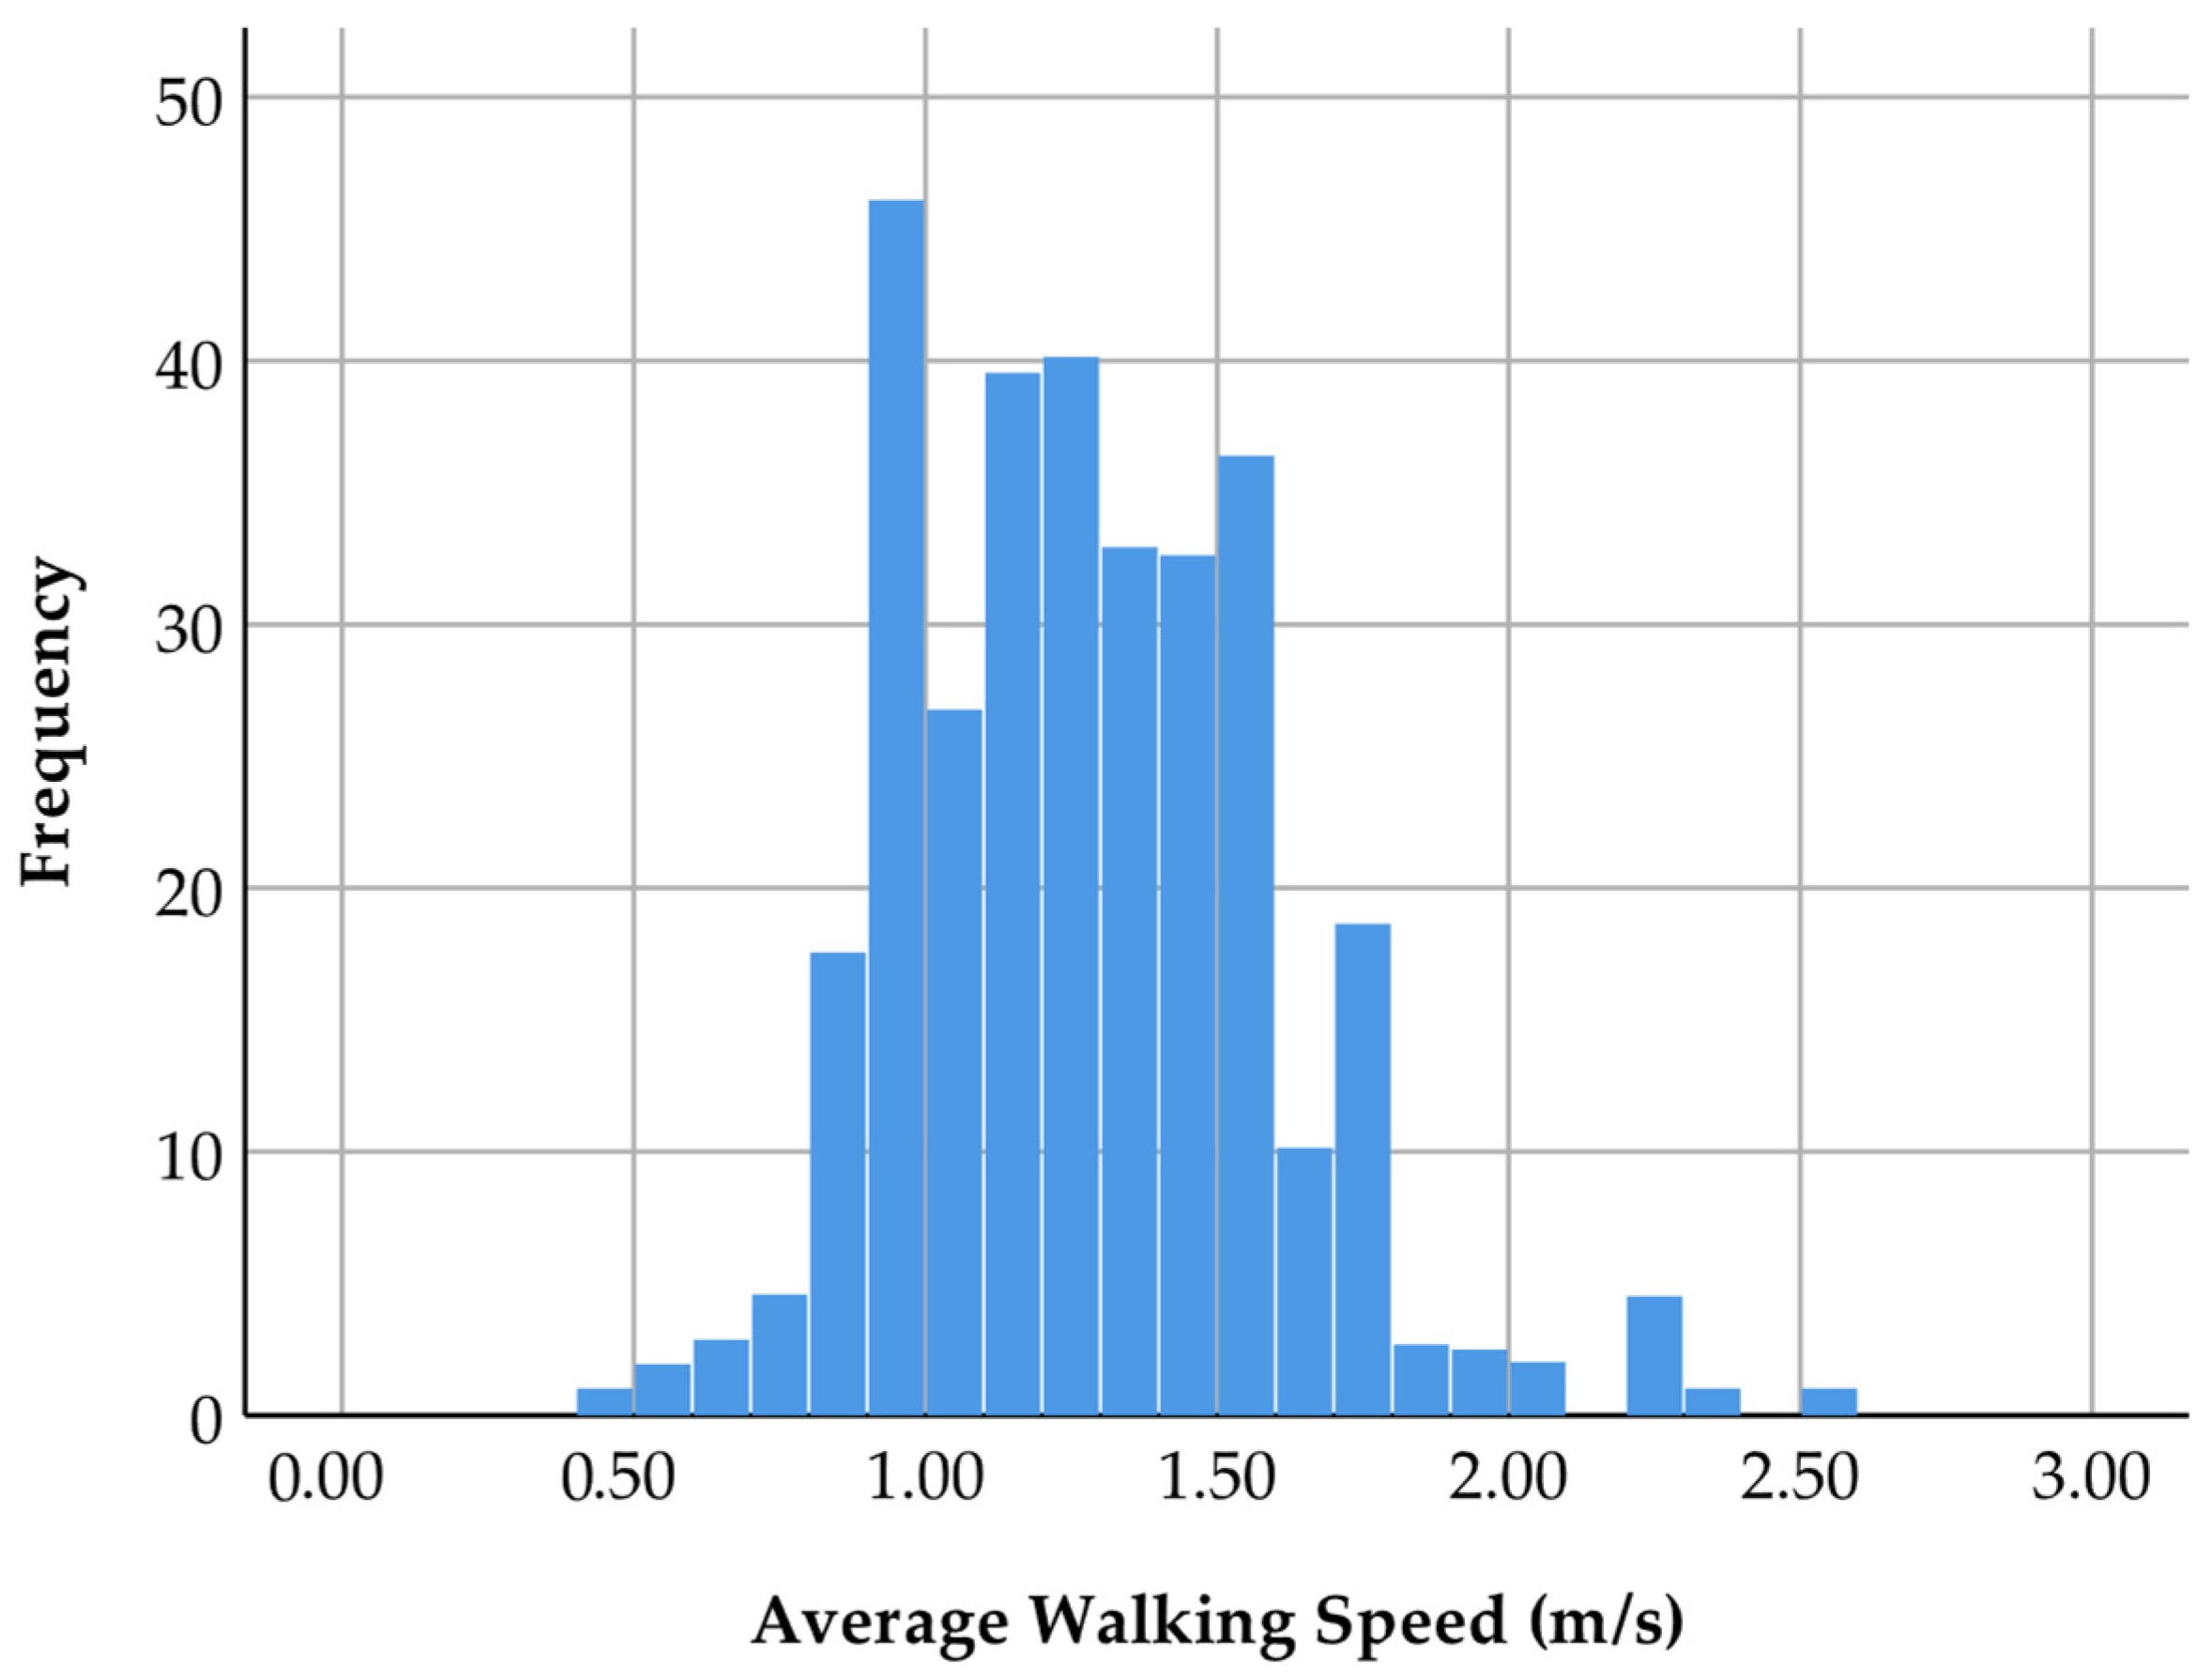
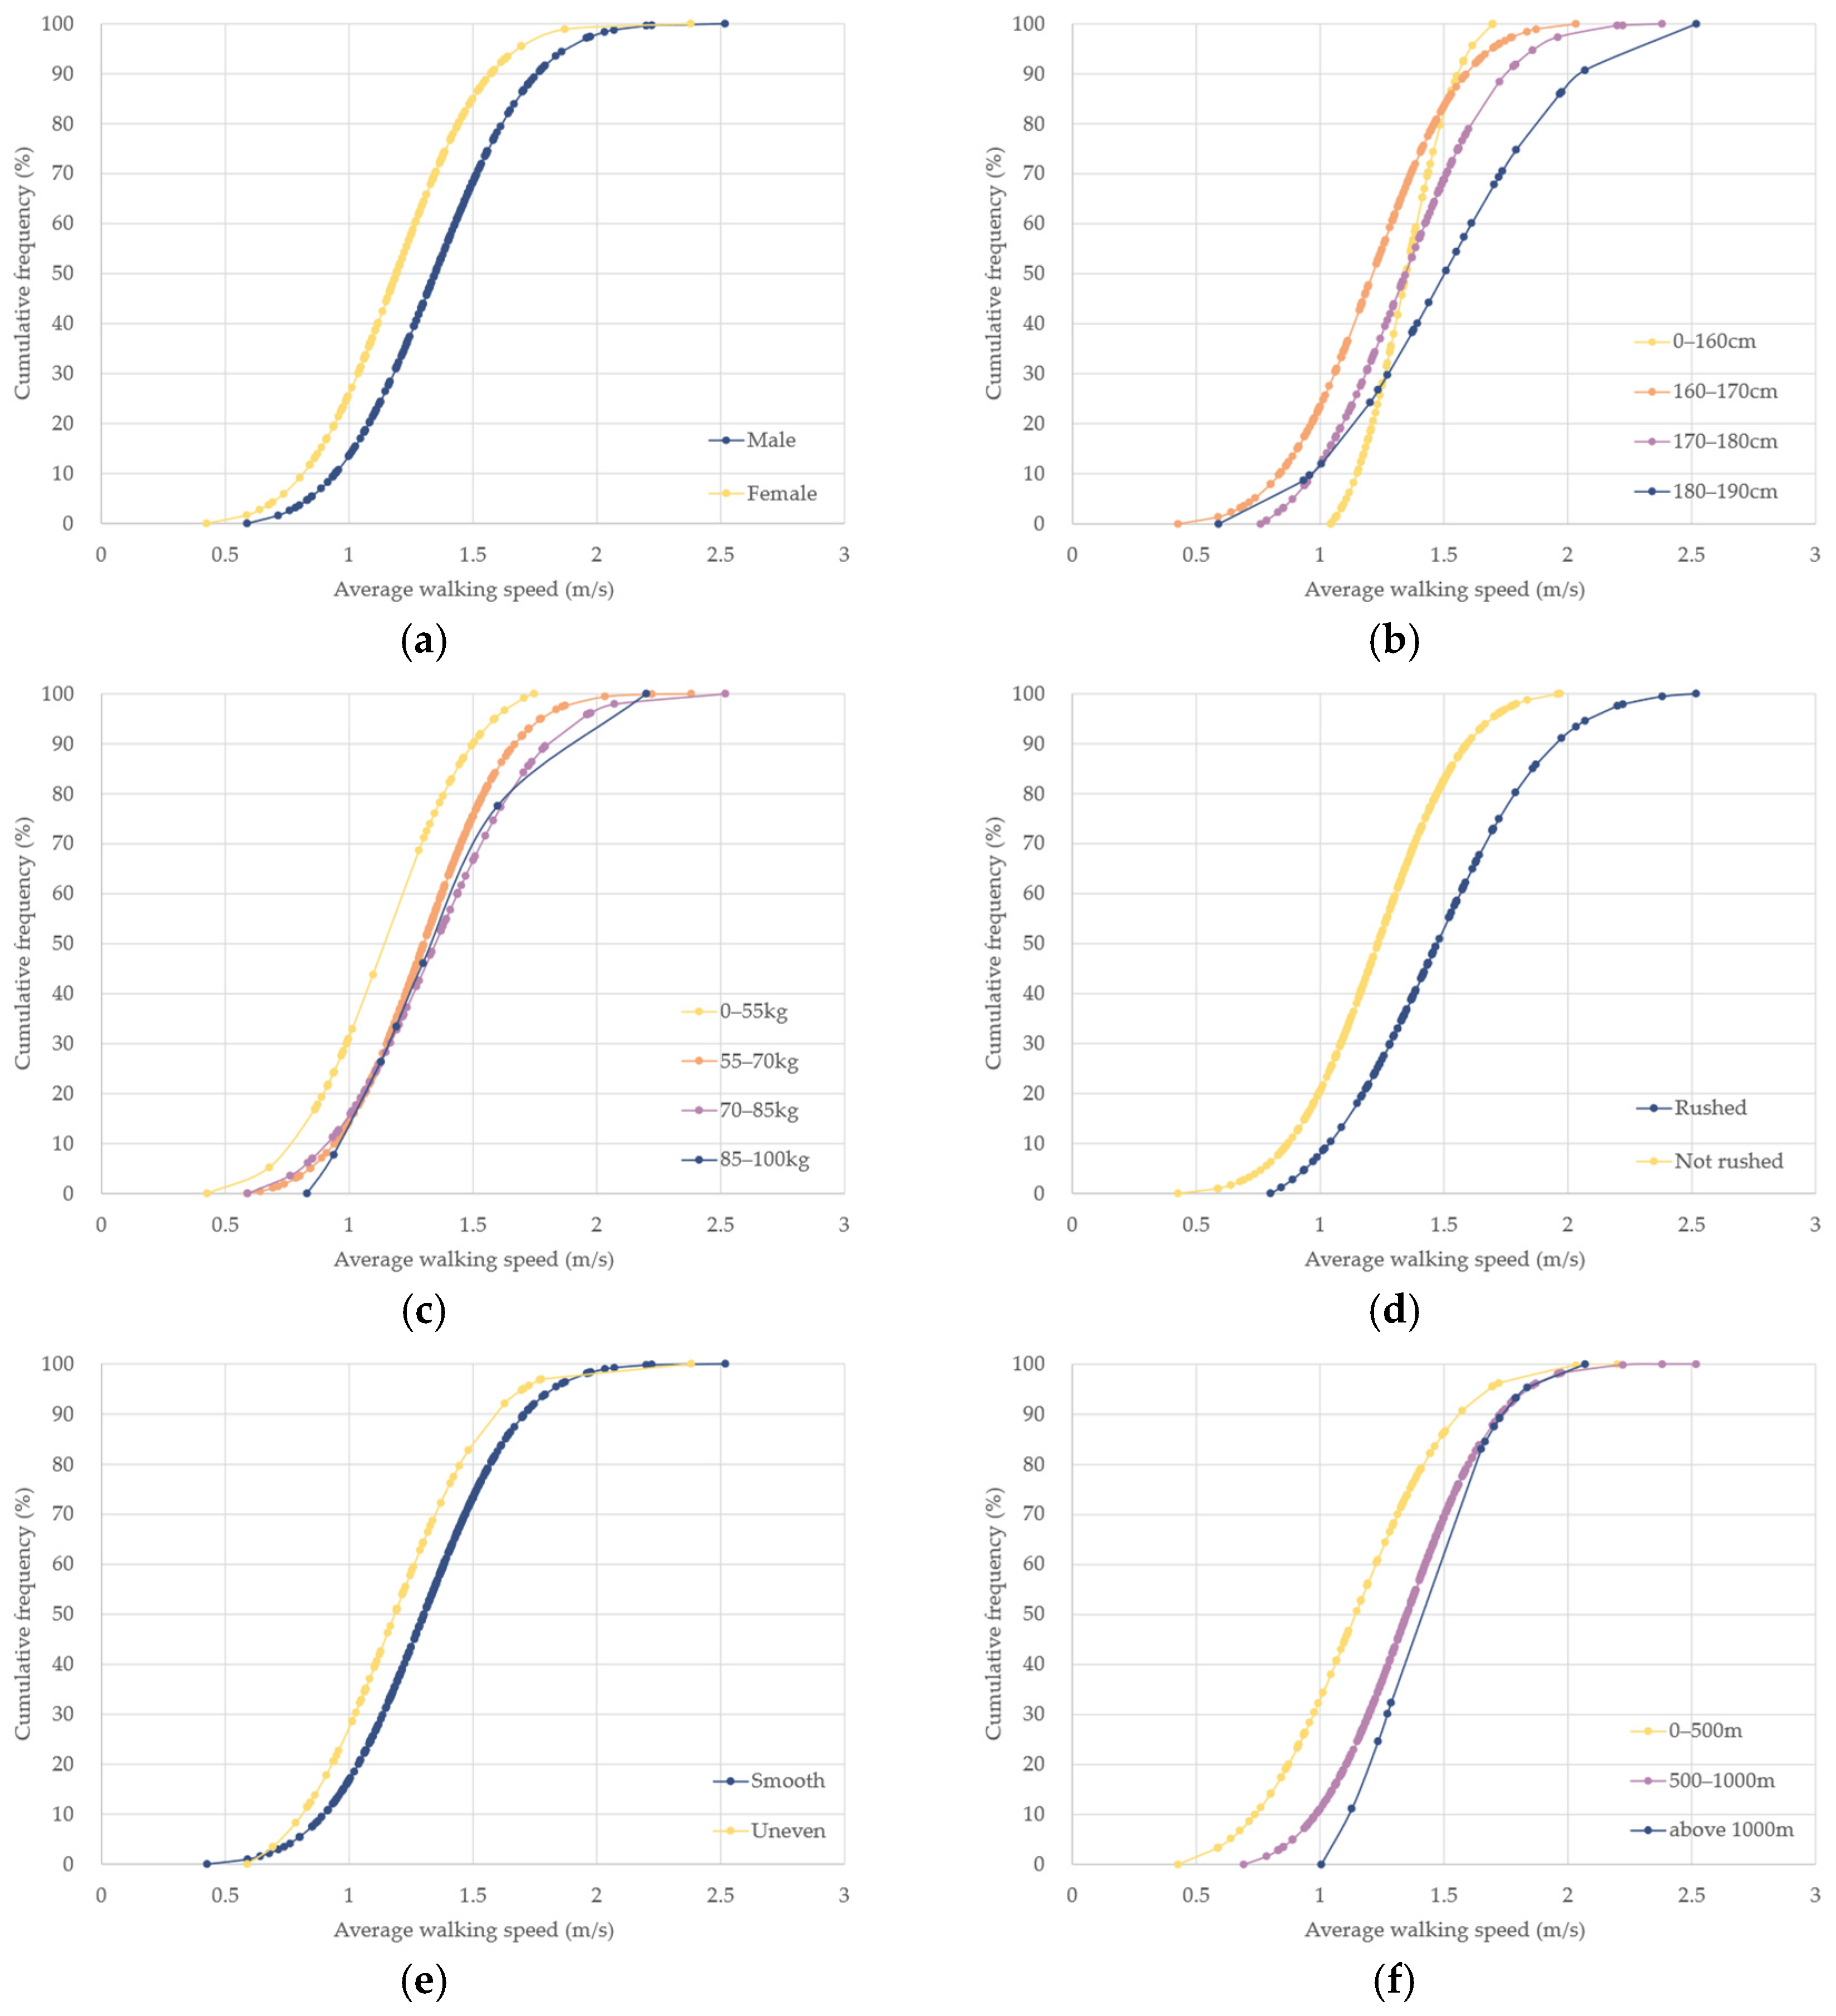
3.1. Walking Speed Descriptive Statistics
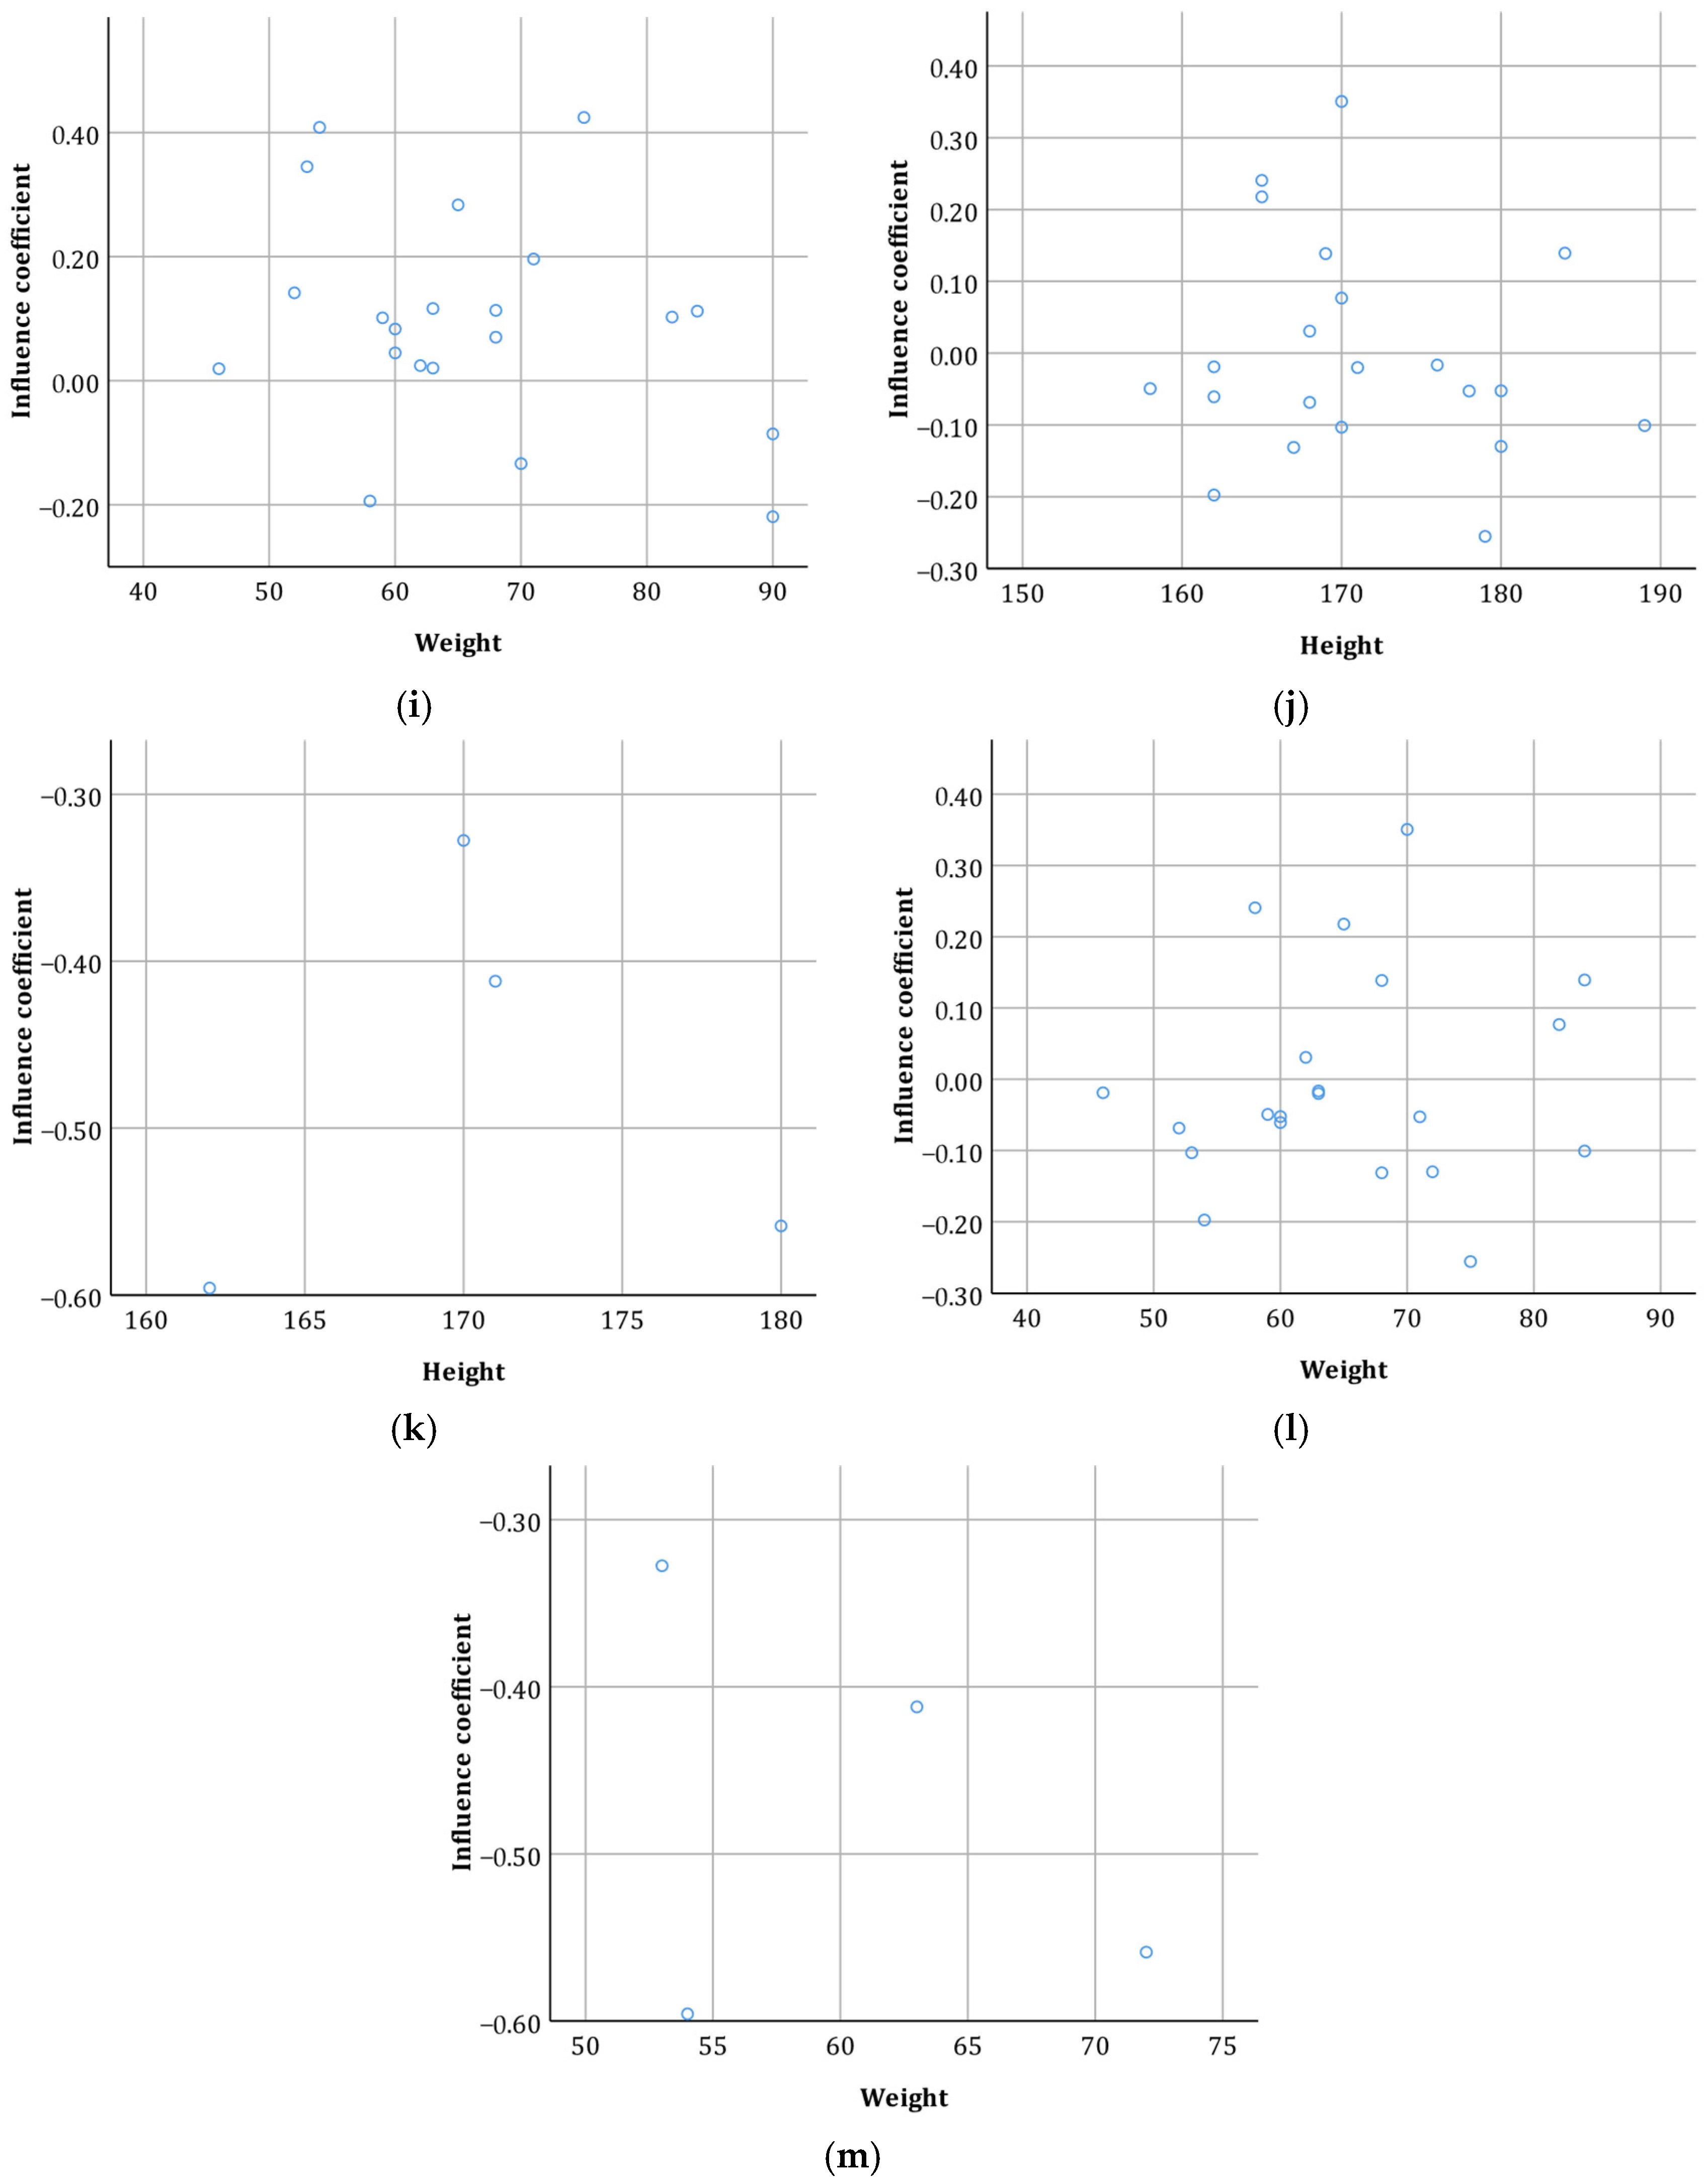
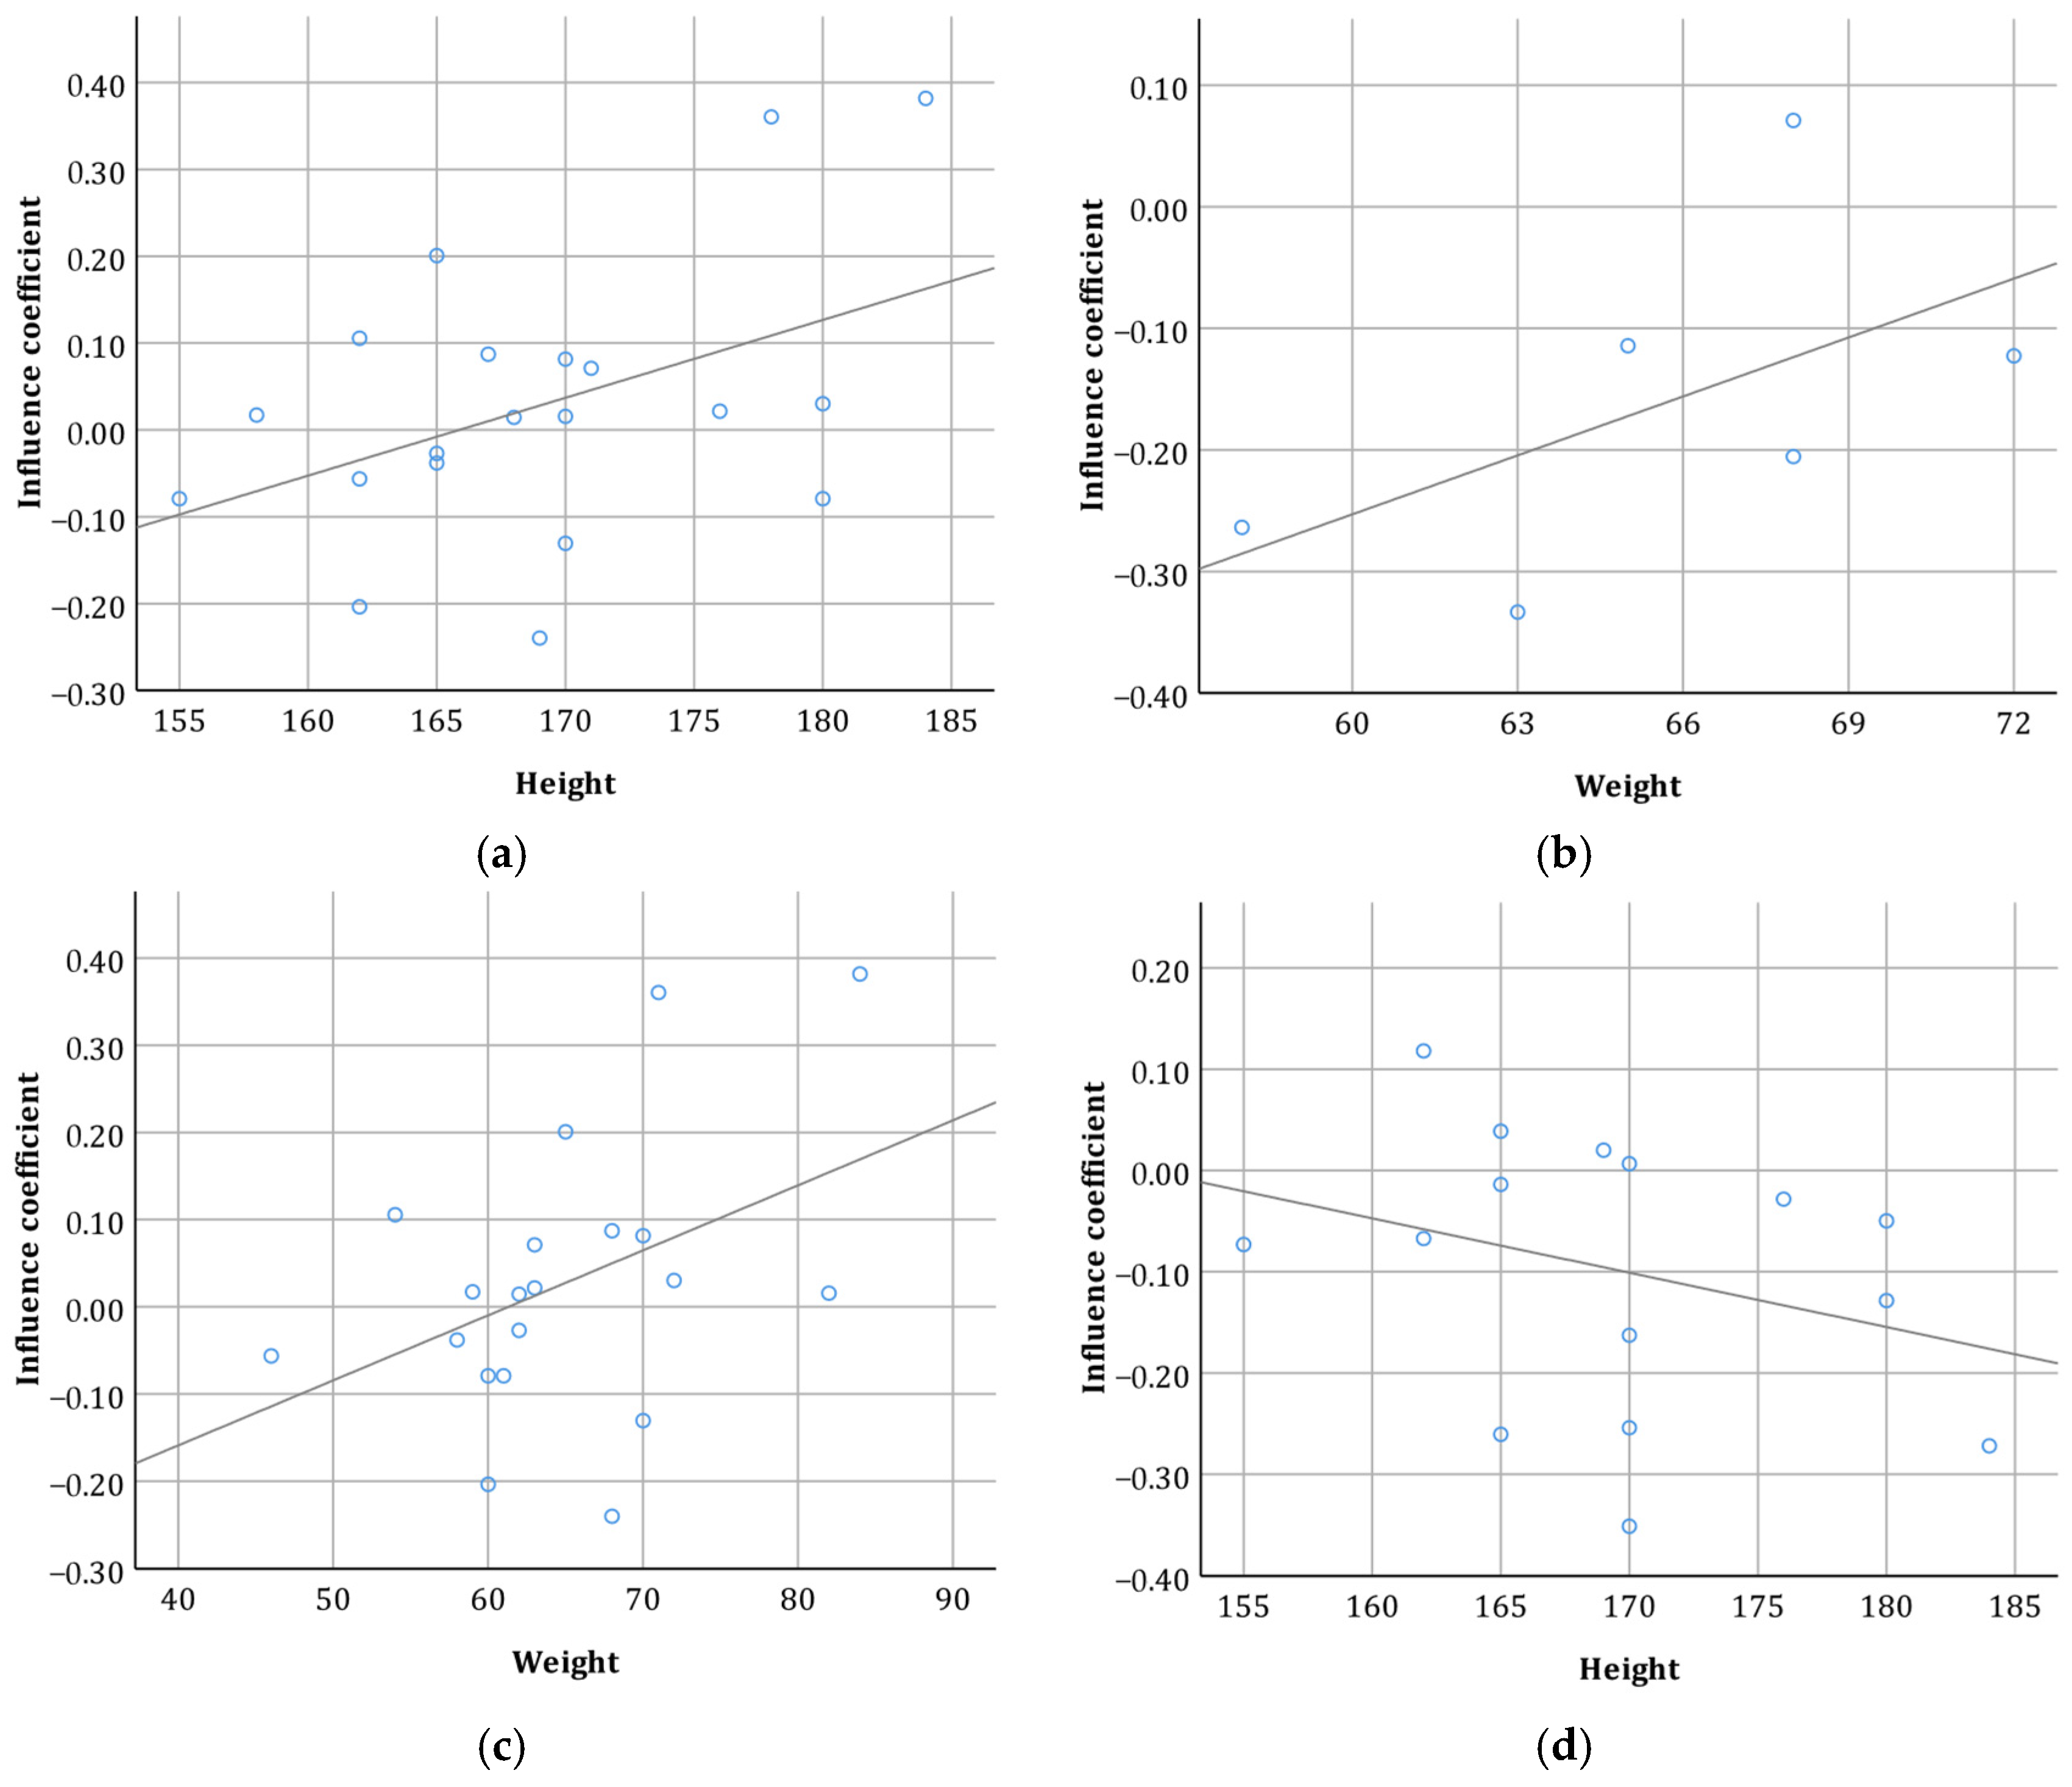
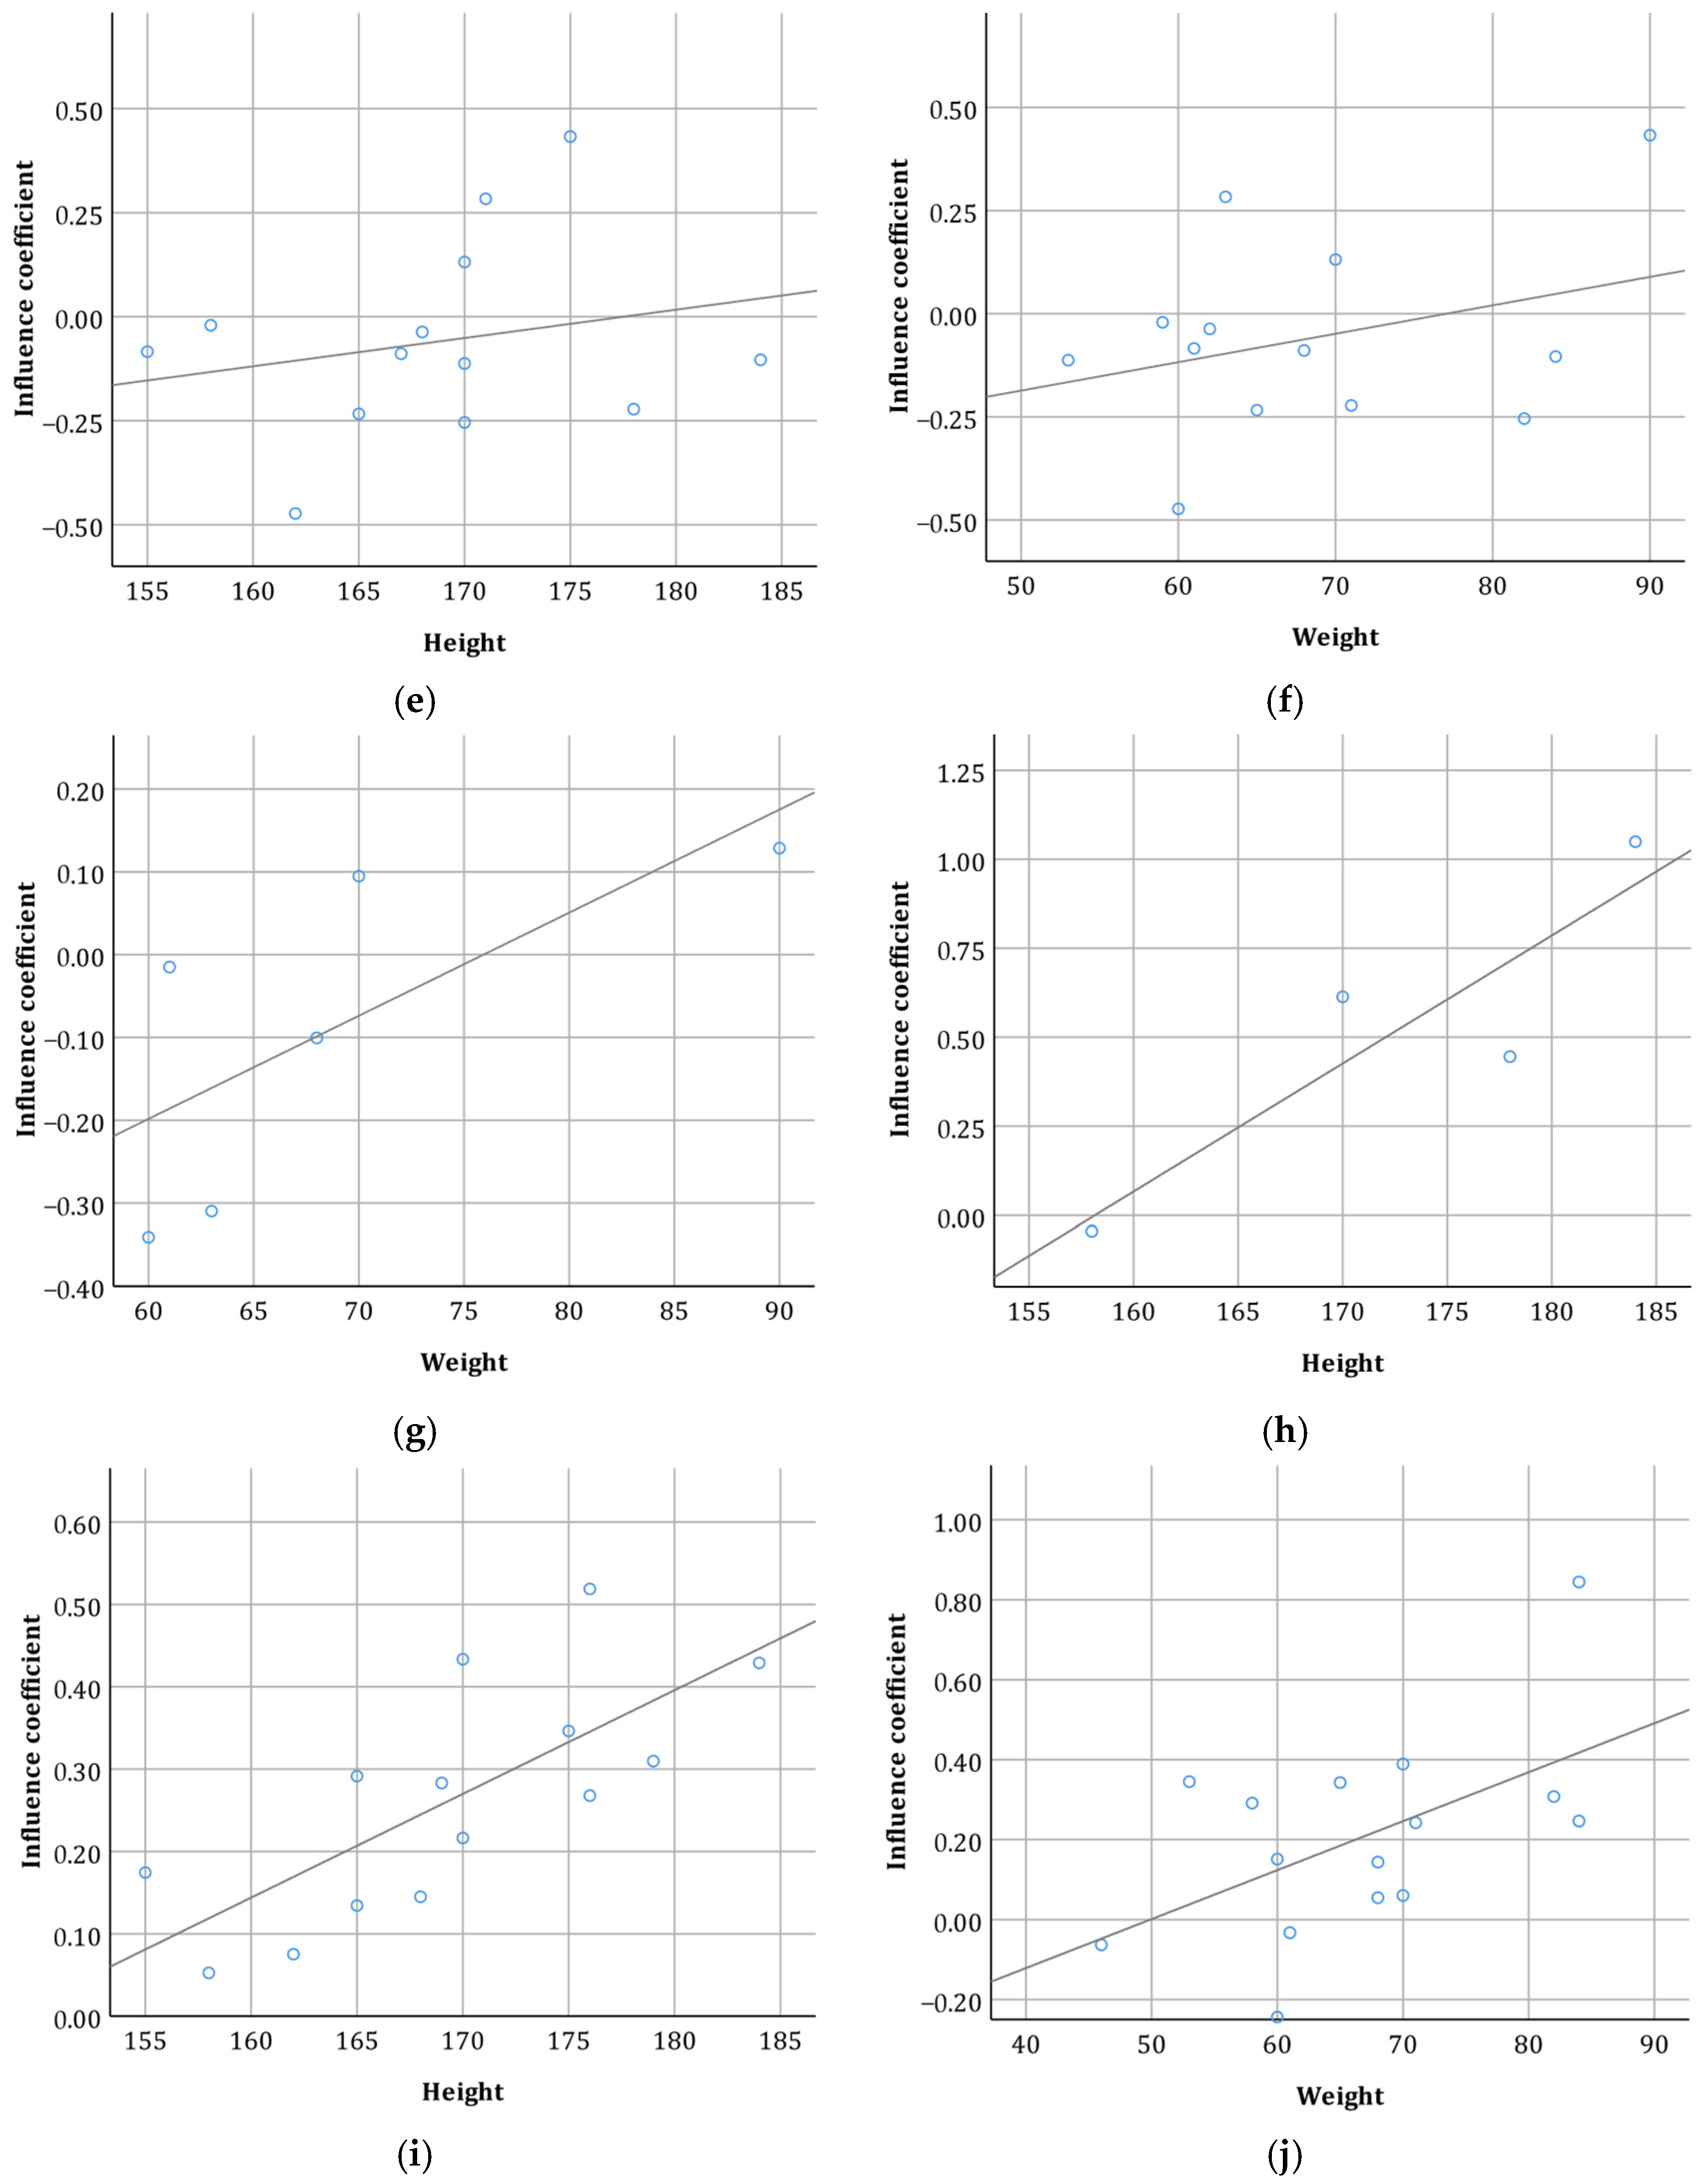
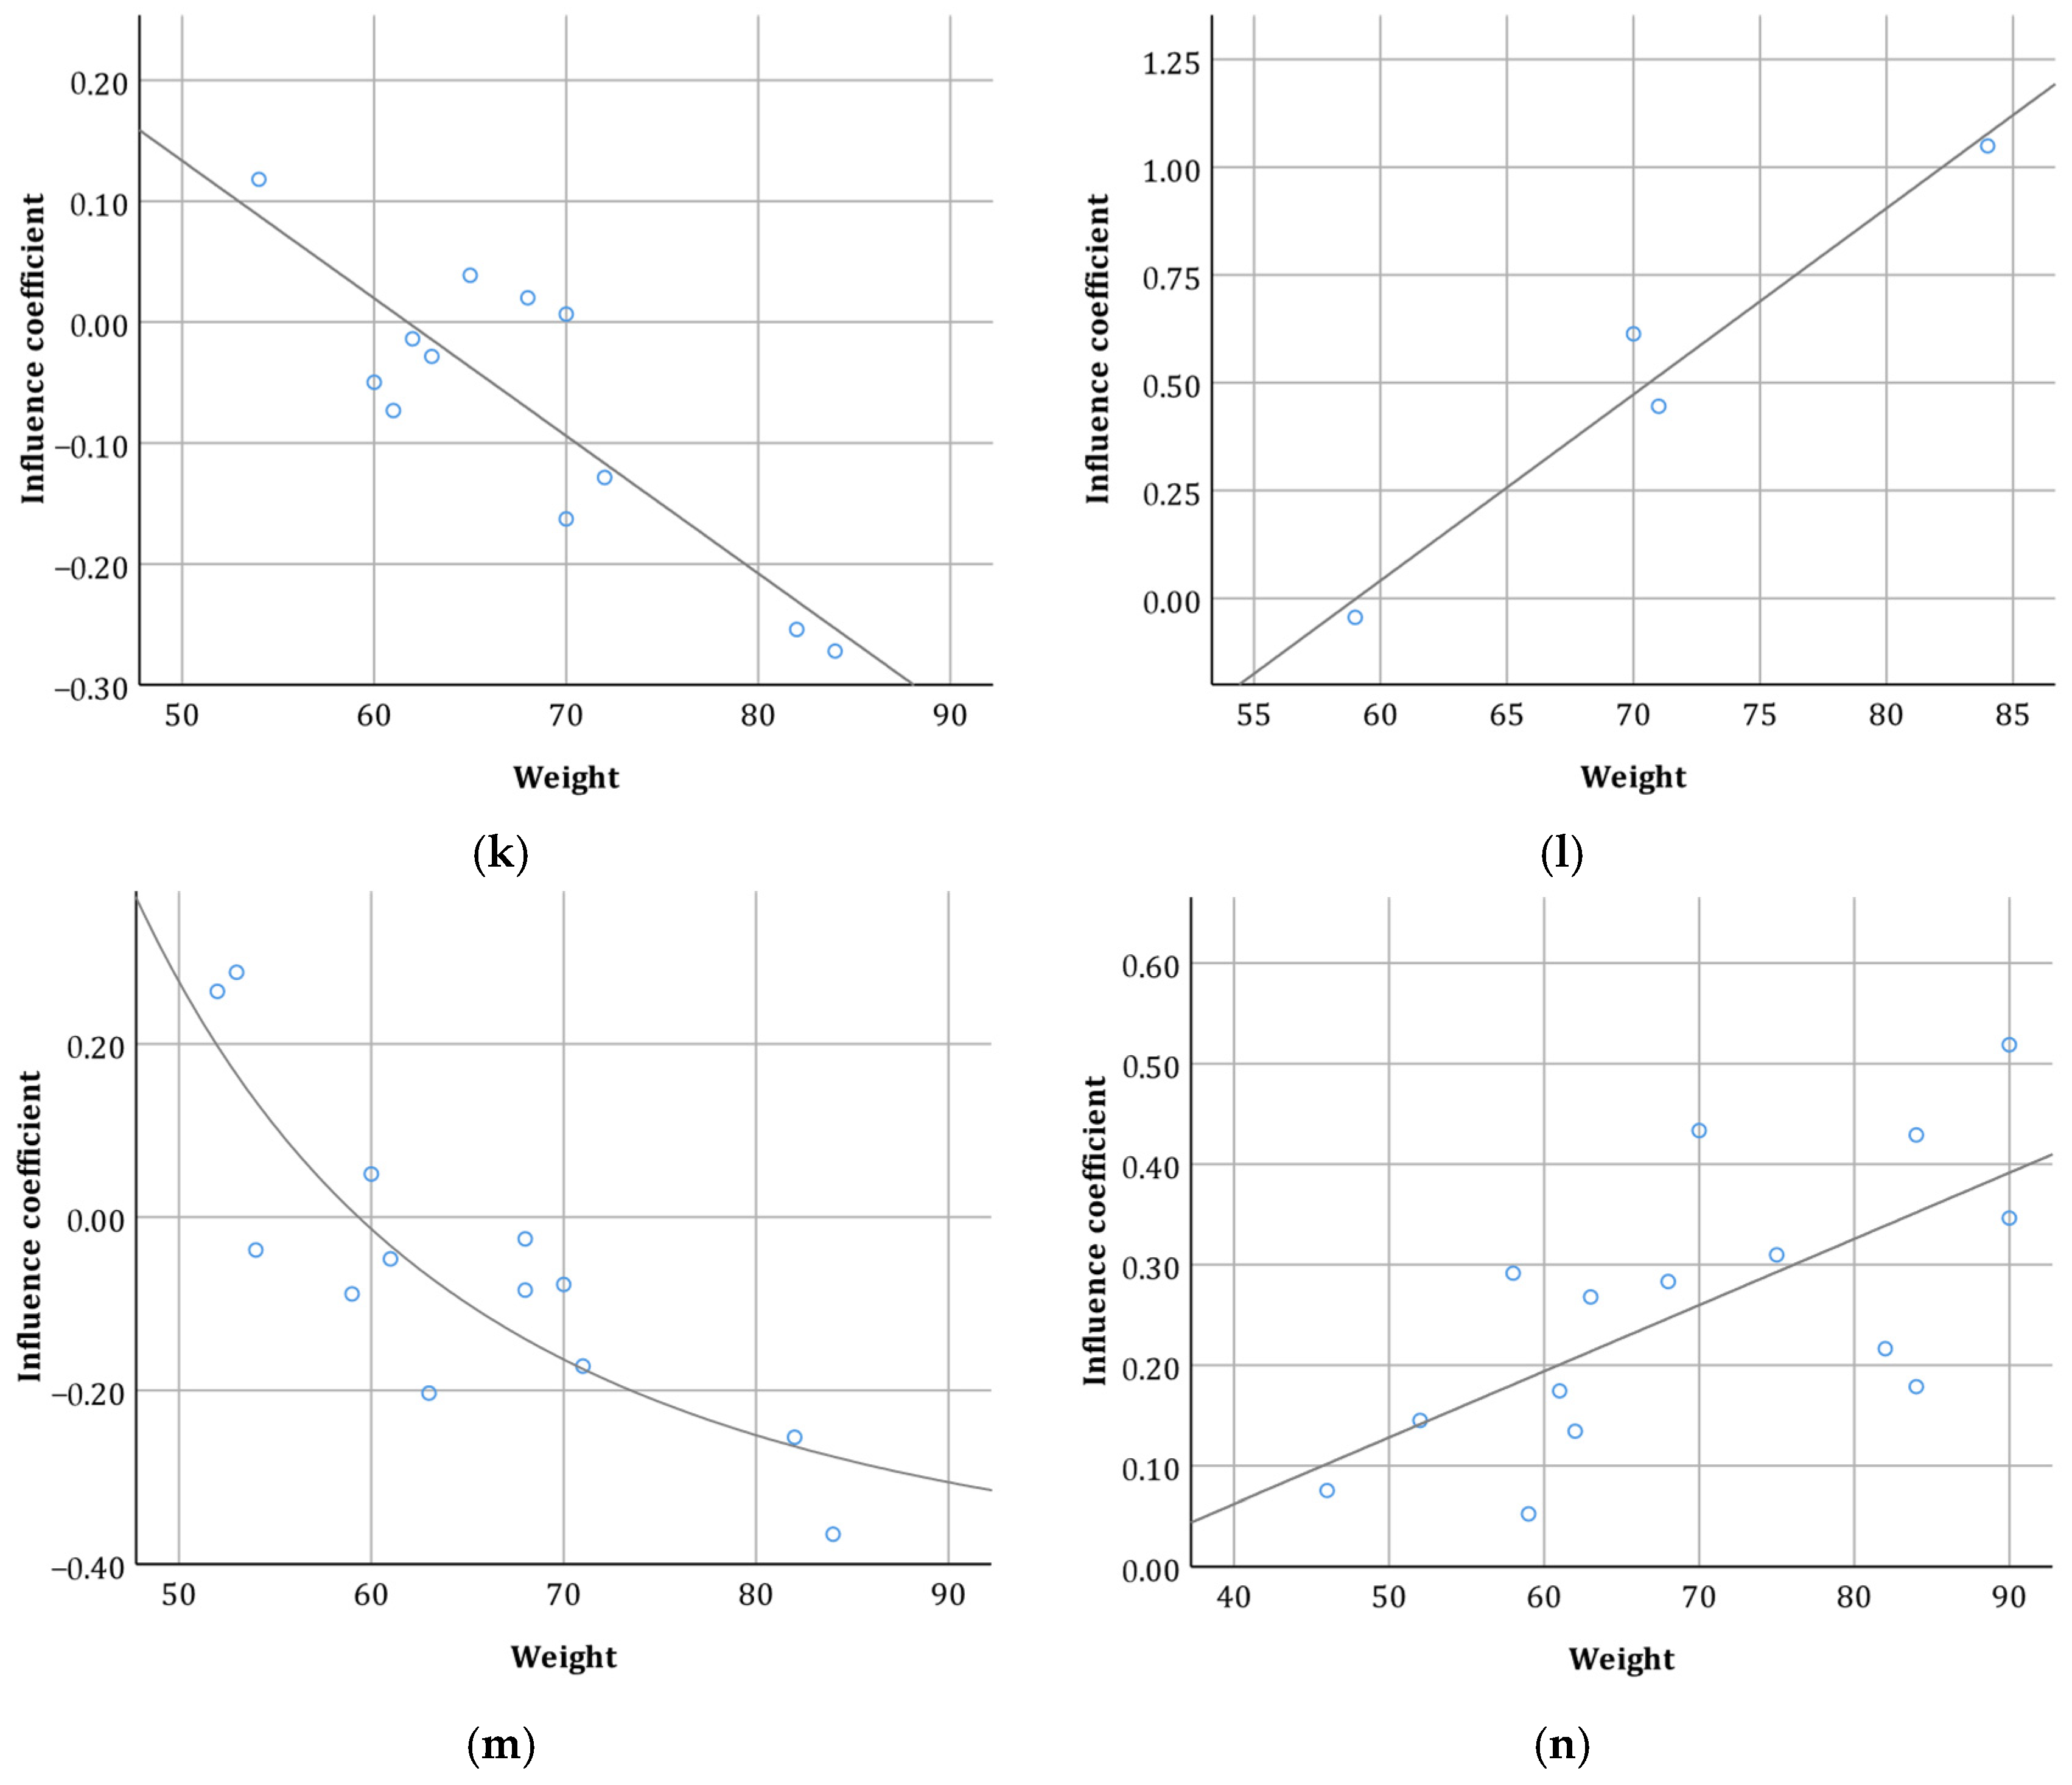
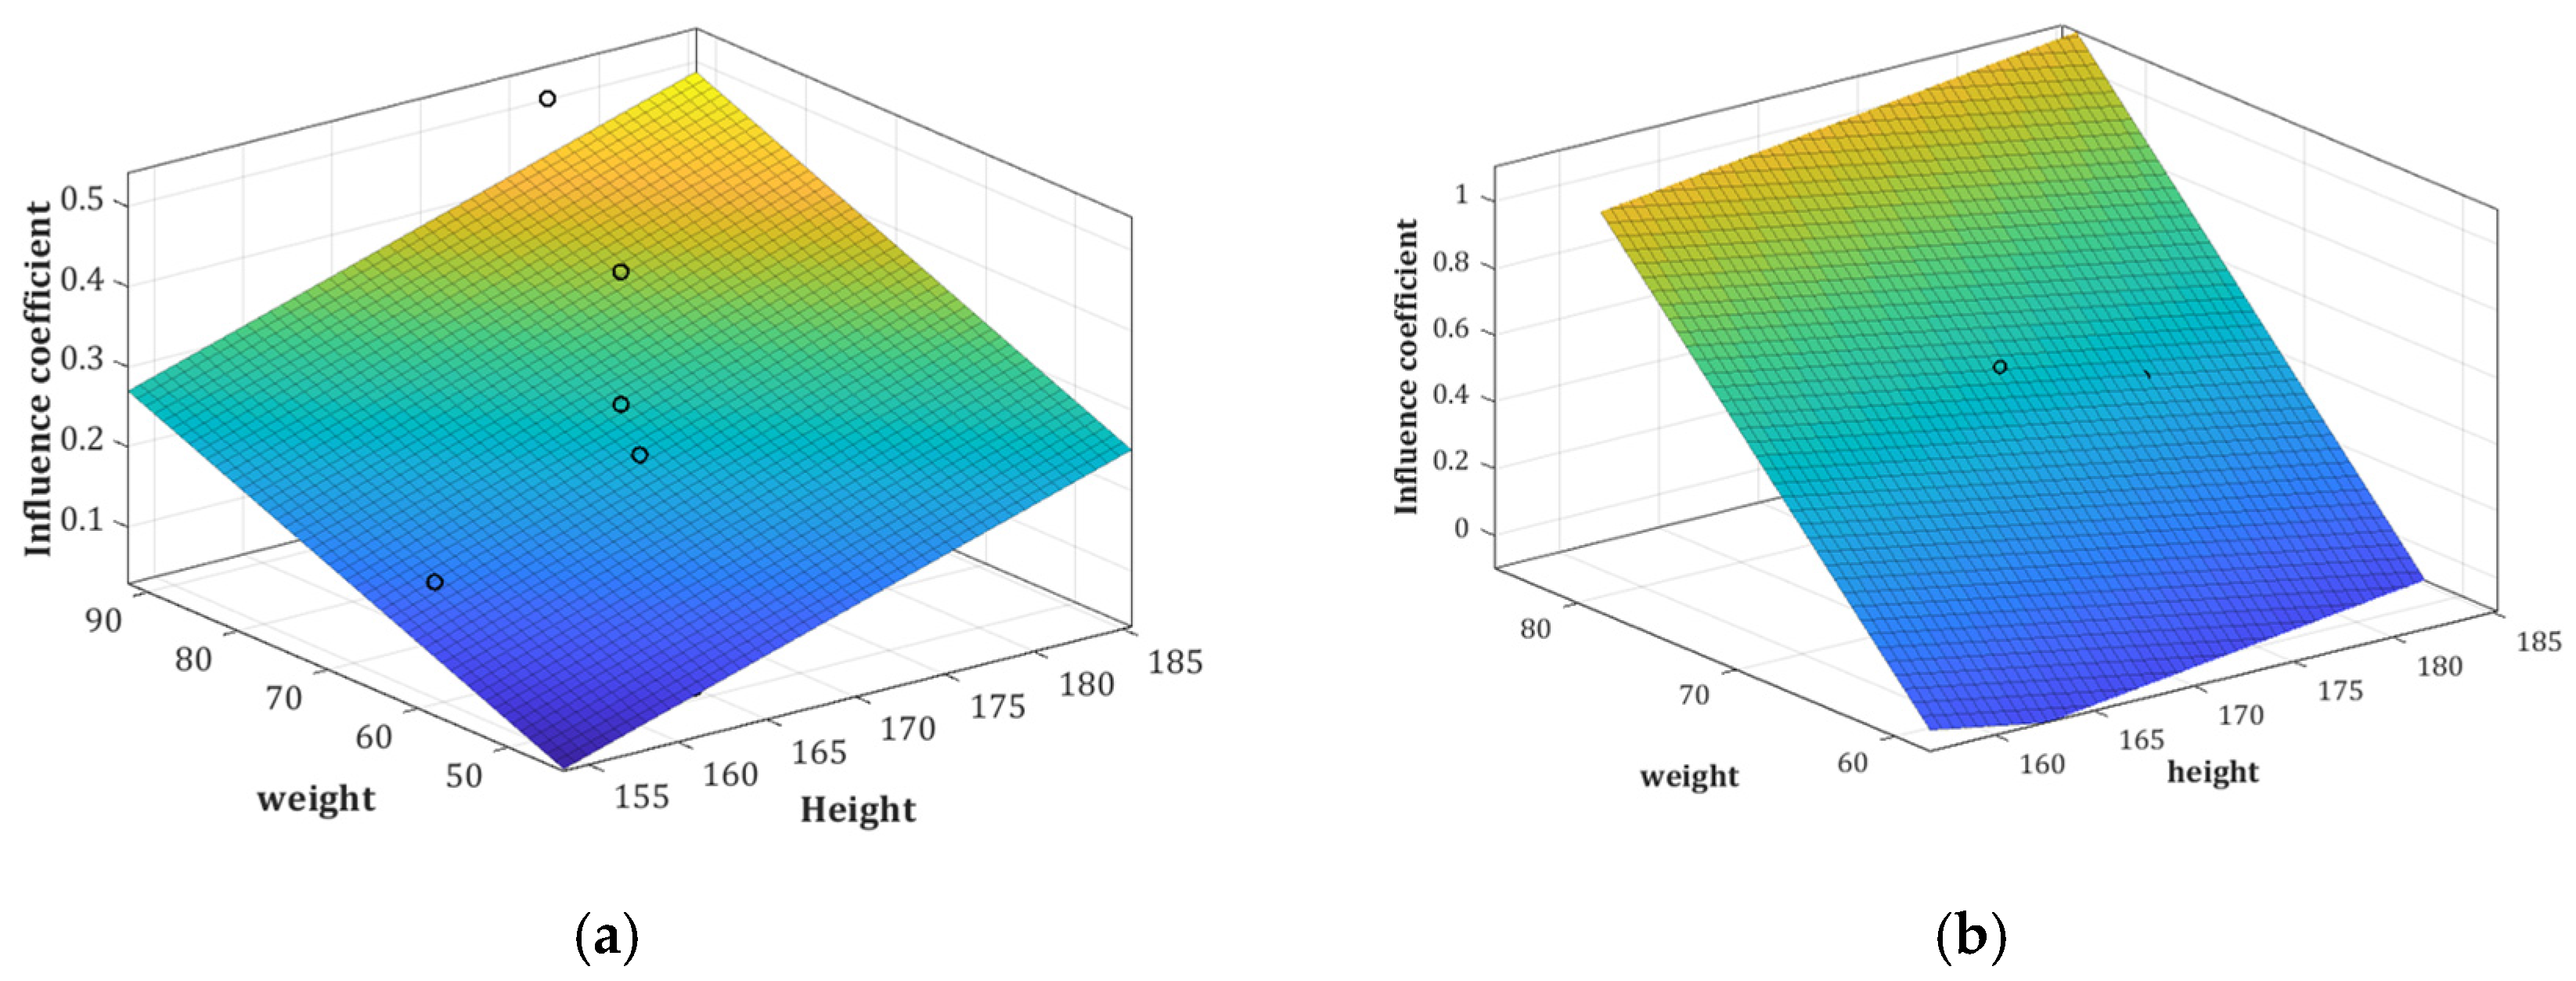
3.2. Establishment of Influence Coefficient Model
4. Discussion
5. Conclusions
Author Contributions
Funding
Institutional Review Board Statement
Informed Consent Statement
Data Availability Statement
Acknowledgments
Conflicts of Interest
References
- Jittrapirom, P.; Caiati, V.; Feneri, A.M.; Ebrahimigharehbaghi, S.; AlonsoGonzález, M.J.; Narayan, J. Mobility as a Service: A Critical Review of Definitions, Assessments of Schemes, and Key Challenges. Urban Plan. 2017, 2, 13–25. [Google Scholar] [CrossRef] [Green Version]
- Li, X.M.; Chen, J.F. Study of Trip Time Prediction Based on Urban Trip Information Service Platform. In Proceedings of the 2008 IEEE International Conference on Service Operations and Logistics, and Informatics, Beijing, China, 12–15 October 2008; Volumes 1–2, pp. 2790–2793. [Google Scholar]
- Rastogi, R.; Thaniarasu, I.; Chandra, S. Design Implications of Walking Speed for Pedestrian Facilities. J. Transp. Eng. 2011, 137, 687–696. [Google Scholar] [CrossRef]
- Bosina, E.; Weidmann, U. Estimating pedestrian speed using aggregated literature data. Phys. A Stat. Mech. Its Appl. 2017, 468, 1–29. [Google Scholar] [CrossRef]
- Arango, J.; Montufar, J. Walking Speed of Older Pedestrians who use Canes or Walkers for Mobility. Transp. Res. Rec. J. Transp. Res. Board 2008, 2073, 79–85. [Google Scholar] [CrossRef]
- Guo, Y.; Sayed, T.; Zaki, M.H. Automated analysis of pedestrian walking behaviour at a signalized intersection in China. IET Intell. Transp. Syst. 2017, 11, 28–36. [Google Scholar] [CrossRef]
- Forde, A.; Daniel, J. Pedestrian walking speed at un-signalized midblock crosswalk and its impact on urban street segment performance. J. Traffic Transp. Eng.-Engl. Ed. 2021, 8, 57–69. [Google Scholar] [CrossRef]
- Yao, Z.G.; Tan, Y. Characteristics of Pedestrian Walking Speeds in Sidewalk in Xi’an of China. Prog. Saf. Sci. Technol. 2010, 8, 1961–1966. [Google Scholar]
- Donoghue, O.A.; Dooley, C.; Kenny, R.A. Usual and Dual-Task Walking Speed: Implications for Pedestrians Crossing the Road. J. Aging Health 2016, 28, 850–862. [Google Scholar] [CrossRef] [PubMed]
- Banerjee, A.; Maurya, A.K. Comparative Study of Pedestrians’ Movement on Different Types of Pedestrian Sidewalks in Sikkim, Gangtok. Transp. Res. 2020, 45, 3–17. [Google Scholar]
- Fitzpatrick, K.; Brewer, M.; Turner, S. Another Look at Pedestrian Walking Speed. Transp. Res. Rec. J. Transp. Res. Board 2006, 1982, 21–29. [Google Scholar] [CrossRef]
- Ye, J.; Chen, X.; Jian, N. Impact analysis of human factors on pedestrian traffic characteristics. Fire Saf. J. 2012, 52, 46–54. [Google Scholar] [CrossRef]
- Fossum; Ryeng, E.O. The walking speed of pedestrians on various pavement surface conditions during winter. Transp. Res. Part D Transp. Environ. 2021, 97, 102934. [Google Scholar] [CrossRef]
- Liang, S.; Leng, H.; Yuan, Q.; Wang, B.W.; Yuan, C. How does weather and climate affect pedestrian walking speed during cool and cold seasons in severely cold areas. Build. Environ. 2020, 175, 106811. [Google Scholar] [CrossRef]
- Yi, S.; Li, H.; Wang, X. Pedestrian Travel Time Estimation in Crowded Scenes. In Proceedings of the 2015 IEEE International Conference on Computer Vision (ICCV), Santiago, Chile, 7–13 December 2015; pp. 3137–3145. [Google Scholar]
- Talamini, G.; Shao, D.; Chow, A.H.F.; Sun, G.B. The controversial impact of pedestrian guardrails on road crossing behaviours. Evidence from Hong Kong. Urban Des. Int. 2022, 27, 156–172. [Google Scholar] [CrossRef]
- Gore, N.; Dave, S.; Shah, J.; Jain, M.; Rathva, D.; Garg, V. Comparative Analysis of Pedestrian Walking Speed on Sidewalk and Carriageway. Transp. Res. 2020, 45, 65–76. [Google Scholar]
- Lee, Y.; Shin, S. Analysis of affecting factors to velocity changes of pedestrian. Korean Soc. Transp. 2018, 36, 360–370. [Google Scholar]
- Franek, M.; Penickova, S.; Ondracek, L.; Brandysky, P. Influence of urban vegetation on the walking speed of pedestrians. Ceskoslovenska Psychol. 2008, 52, 597–608. [Google Scholar]
- Berkouk, D.; Bouzir, T.A.K.; Maffei, L.; Masullo, M. Examining the Associations between Oases Soundscape Components and Walking Speed: Correlation or Causation? Sustainability 2020, 12, 4619. [Google Scholar] [CrossRef]
- Aghabayk, K.; Parishad, N.; Shiwakoti, N. Investigation on the impact of walkways slope and pedestrians physical characteristics on pedestrians normal walking and jogging speeds. Saf. Sci. 2021, 133, 105012. [Google Scholar] [CrossRef]
- Fujita, A.; Feliciani, C.; Yanagisawa, D.; Nishinari, K. Traffic flow in a crowd of pedestrians walking at different speeds. Phys. Rev. E 2019, 99, 062307. [Google Scholar] [CrossRef]
- Miao, S.; Zheng, L.; Li, T.; Tan, B.; Ma, Q.; Ding, T.; Li, Y. A Dynamic Waiting Time-Based Shuttle Service System and Method. Chinese Patent ZL202211653291.5, 28 April 2023. [Google Scholar]

| Symbol | Description | Units |
|---|---|---|
| Age | year | |
| Height | cm | |
| Weight | kg | |
| Travel distance | m | |
| Average walking speed | m/s | |
| Factor | - | |
| Level of factor | - |
| Sample Size | Average (m/s) | Minimum (m/s) | Maximum (m/s) | Percentiles (m/s) | ||
|---|---|---|---|---|---|---|
| 15 | 50 | 85 | ||||
| 325 | 1.28 | 0.43 | 2.52 | 0.94 | 1.27 | 1.58 |
| Factor | Level | Sample Size | Average (m/s) | Minimum (m/s) | Maximum (m/s) | Percentiles (m/s) | |
|---|---|---|---|---|---|---|---|
| 15 | 85 | ||||||
| Gender | Male | 193 | 1.34 | 0.59 | 2.52 | 1.04 | 1.70 |
| Female | 132 | 1.19 | 0.43 | 2.38 | 0.94 | 1.57 | |
| Height (cm) | (0, 160] | 20 | 1.34 | 1.04 | 1.70 | 1.16 | 1.56 |
| (160, 170] | 163 | 1.21 | 0.43 | 2.03 | 0.94 | 1.53 | |
| (170, 180] | 122 | 1.33 | 0.76 | 2.38 | 1.03 | 1.58 | |
| (180, 190] | 20 | 1.50 | 0.59 | 2.52 | 0.96 | 1.97 | |
| Weight (kg) | (0, 55] | 51 | 1.15 | 0.43 | 1.75 | 0.91 | 1.52 |
| (55–70] | 173 | 1.30 | 0.59 | 2.38 | 0.98 | 1.57 | |
| (70–85] | 71 | 1.34 | 0.59 | 2.52 | 0.97 | 1.72 | |
| (85, 100] | 30 | 1.27 | 0.83 | 2.20 | 0.94 | 1.60 | |
| Rushed level | Rushed | 69 | 1.45 | 0.80 | 2.52 | 1.03 | 1.87 |
| Not rushed | 256 | 1.24 | 0.43 | 1.97 | 0.94 | 1.57 | |
| Road smoothness | Smooth | 263 | 1.31 | 0.43 | 2.52 | 0.96 | 1.59 |
| Uneven | 62 | 1.17 | 0.59 | 2.38 | 0.84 | 1.48 | |
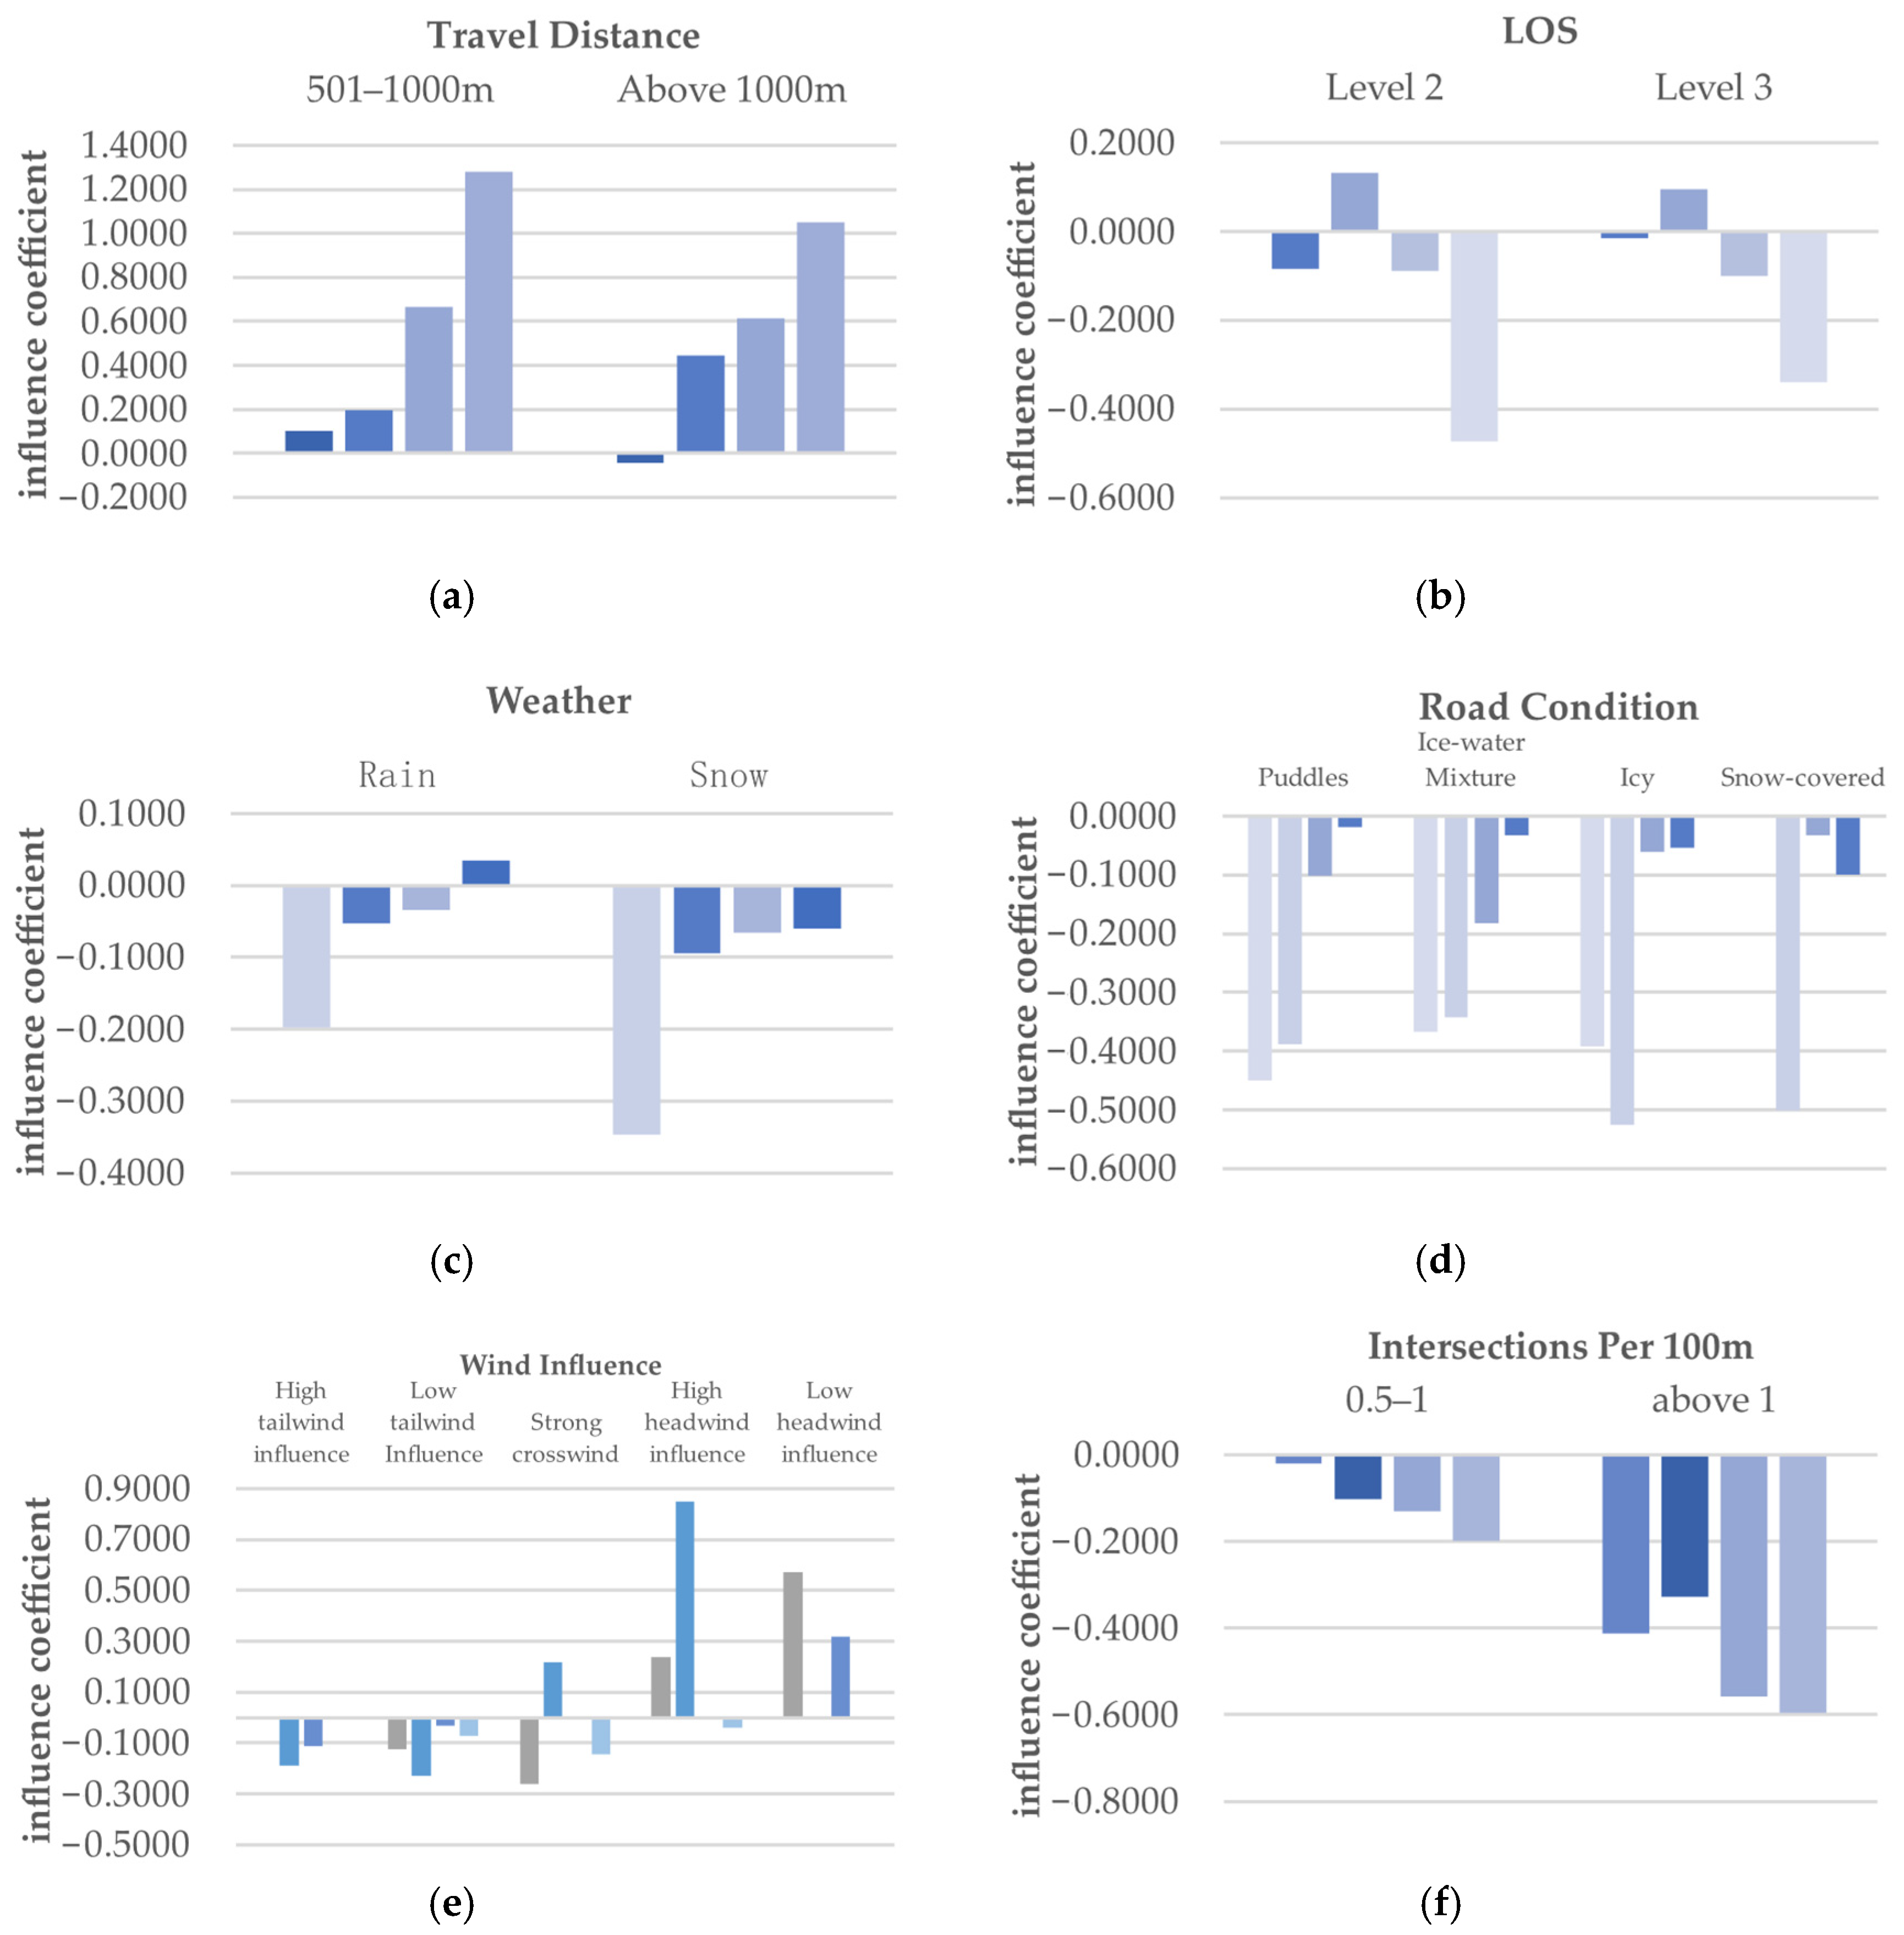
| Travel distance (m) | [0, 500) | 102 | 1.14 | 0.43 | 2.20 | 0.89 | 1.41 |
| [500, 1000) | 190 | 1.34 | 0.69 | 2.52 | 1.00 | 1.60 | |
| [1000, 3000] | 33 | 1.37 | 1.00 | 2.07 | 1.13 | 1.75 | |
| Sidewalk LOS | Level 1 | 168 | 1.36 | 0.43 | 2.52 | 1.07 | 1.64 |
| Level 2 | 93 | 1.26 | 0.59 | 2.38 | 0.93 | 1.57 | |
| Level 3 | 52 | 1.09 | 0.64 | 1.77 | 0.94 | 1.36 | |
| Level 4 | 12 | 1.16 | 0.99 | 1.64 | 0.99 | 1.52 | |
| Weather | Clear | 210 | 1.29 | 0.43 | 2.20 | 0.97 | 1.58 |
| Partly cloudy | 21 | 1.43 | 0.59 | 1.77 | 0.99 | 1.72 | |
| Overcast | 66 | 1.24 | 0.78 | 2.52 | 0.94 | 1.50 | |
| Light rain | 18 | 1.20 | 0.80 | 1.65 | 0.91 | 1.46 | |
| Moderate rain | 4 | 1.11 | 0.91 | 1.41 | - | - | |
| Showers | 1 | 1.63 | 1.63 | 1.63 | - | - | |
| Light snow | 3 | 1.12 | 1.00 | 1.46 | - | - | |
| Moderate snow | 1 | 1.16 | 1.09 | 1.22 | - | - | |
| Haze | 1 | 0.64 | 0.64 | 0.64 | - | - | |
| Road condition | Dry | 158 | 1.36 | 0.80 | 2.52 | 0.96 | 1.59 |
| Puddles | 47 | 1.24 | 0.64 | 1.98 | 0.97 | 1.53 | |
| Snow-covered | 7 | 1.24 | 0.89 | 1.78 | 0.90 | 1.78 | |
| Icy | 51 | 1.12 | 0.43 | 1.86 | 0.83 | 1.49 | |
| Ice–water mixture | 63 | 1.25 | 0.59 | 2.38 | 0.92 | 1.72 | |
| Influence of wind | No influence | 207 | 1.26 | 0.43 | 2.20 | 0.94 | 1.57 |
| Strong crosswind | 20 | 1.39 | 0.59 | 1.96 | 0.95 | 1.72 | |
| Low tailwind influence | 26 | 1.32 | 0.74 | 2.52 | 0.96 | 1.73 | |
| High tailwind influence | 22 | 1.28 | 0.94 | 2.03 | 0.94 | 1.82 | |
| Low headwind influence | 41 | 1.34 | 0.78 | 2.38 | 1.07 | 1.49 | |
| High headwind influence | 10 | 1.14 | 0.89 | 1.63 | 0.92 | 1.59 | |
| Intersections per 100 m | 0 | 6 | 1.07 | 0.71 | 1.57 | 0.74 | 1.57 |
| (0, 0.5] | 186 | 1.34 | 0.59 | 2.38 | 0.99 | 1.65 | |
| (0.5, 1] | 91 | 1.28 | 0.59 | 2.52 | 1.06 | 1.50 | |
| (1, 2) | 5 | 0.79 | 0.43 | 1.10 | - | - | |
| Factor | Correlation Coefficient 1,2 | Significant |
|---|---|---|
| Travel distance | 0.259 ** | 0.000 |
| Intersections per 100 m | 0.054 | 0.382 |
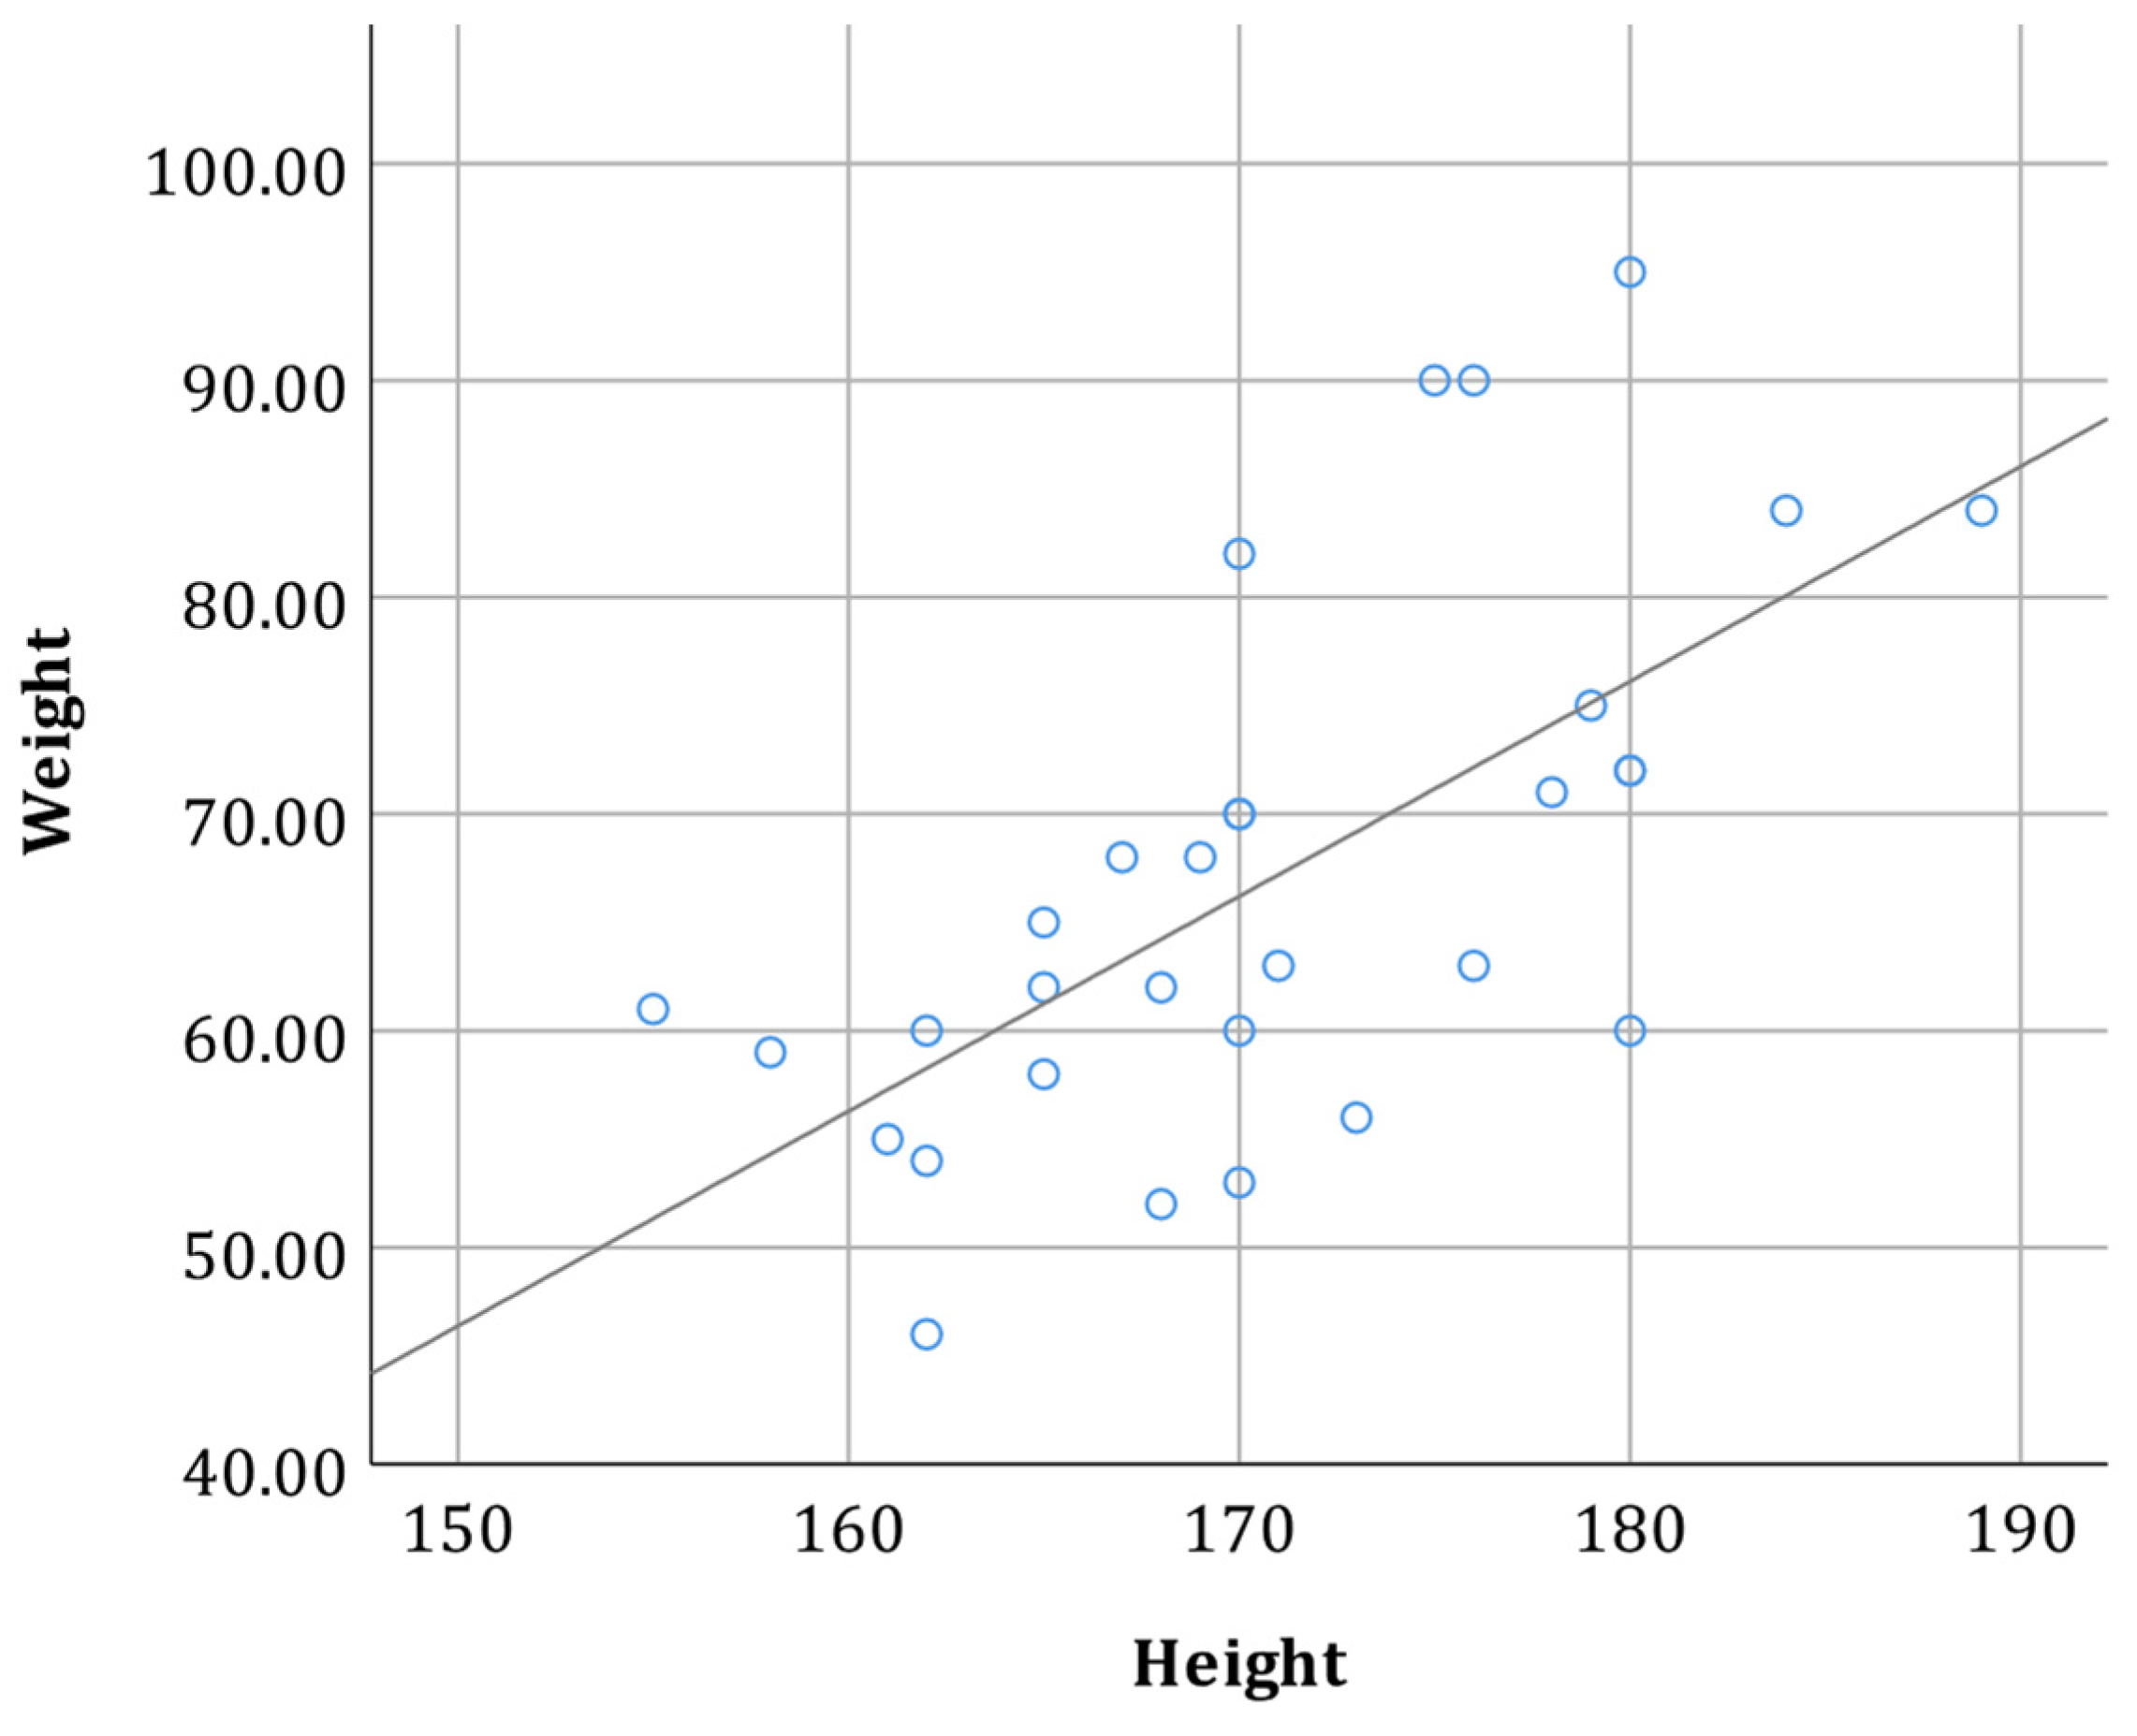
| Height | 0.144 * | 0.013 |
| Weight | 0.051 | 0.373 |
| Sidewalk LOS | −0.340 * | 0.000 |
| Factor | Significant | Significant Influence or Not |
|---|---|---|
| Gender | 0.000 | Yes |
| Height | 0.001 | Yes |
| Weight | 0.008 | Yes |
| Rushed level | 0.000 | Yes |
| Road smoothness | 0.003 | Yes |
| Travel distance | 0.000 | Yes |
| Sidewalk LOS | 0.000 | Yes |
| Weather (3 categories) | 0.084 | No |
| Road condition | 0.000 | Yes |
| Influence of wind | 0.275 | No |
| Intersections per 100 m | 0.000 | Yes |
| Influencing Factor | Control Group Level |
|---|---|
| Rushed level | Not rushed |
| Road smoothness | Smooth |
| Travel distance | Less than 500 m |
| Sidewalk LOS | Level 1 |
| Weather | Dry |
| Road condition | Dry |
| Influence of wind | No influence |
| Intersection per 100 m | (0, 0.5] |
| Influence Coefficient Number | Influence Coefficient | Height | Weight | ||
|---|---|---|---|---|---|
| Correlation Coefficient 1,2 | Significant | Correlation Coefficient | Significant | ||
| 1 | −0.144 | 0.758 | 0.580 | 0.228 | |
| 2 | 0.331 | 0.154 | 0.385 | 0.154 | |
| 3 | 0.137 | 0.542 | −0.036 | 0.875 | |
| 4 | −0.093 | 0.731 | −0.073 | 0.787 | |
| 5 | −0.310 | 0.260 | −0.849 ** | 0.000 | |
| 6 | 0.155 | 0.614 | 0.104 | 0.734 | |
| 7 | 0.429 | 0.397 | 0.829 * | 0.042 | |
| 8 | 0.005 | 0.982 | −0.138 | 0.549 | |
| 9 | 0.800 | 0.200 | 0.674 ** | 0.000 | |
| 10 | −0.113 | 0.688 | −0.829 ** | 0.000 | |
| 11 | 0.734 ** | 0.003 | 0.675 ** | 0.006 | |
| 12 | −0.105 | 0.651 | 0.074 | 0.749 | |
| 13 | 0.200 | 0.749 | −0.400 | 0.600 | |
| Combination | Equation | Equation Number | |
|---|---|---|---|
| (4) | 0.147 | ||
| (5) | 0.134 | ||
| (6) | 0.128 | ||
| (7) | 0.027 | ||
| (8) | −0.036 | ||
| (9) | 0.020 | ||
| (10) | 0.358 | ||
| (11) | 0.699 | ||
| (12) | 0.500 | ||
| (13) | 0.233 | ||
| (14) | 0.693 | ||
| (15) | 0.933 | ||
| (16) | 0.667 | ||
| (17) | 0.414 |
Disclaimer/Publisher’s Note: The statements, opinions and data contained in all publications are solely those of the individual author(s) and contributor(s) and not of MDPI and/or the editor(s). MDPI and/or the editor(s) disclaim responsibility for any injury to people or property resulting from any ideas, methods, instructions or products referred to in the content. |
© 2023 by the authors. Licensee MDPI, Basel, Switzerland. This article is an open access article distributed under the terms and conditions of the Creative Commons Attribution (CC BY) license (https://creativecommons.org/licenses/by/4.0/).
Share and Cite
Miao, S.; Li, T.; Zheng, L.; Tan, B.; Ma, Q. Analysis of Factors Affecting Walking Speed Based on Natural Field Data: Considering the Attributes of Travelers and the Travel Environment. Sustainability 2023, 15, 11433. https://doi.org/10.3390/su151411433
Miao S, Li T, Zheng L, Tan B, Ma Q. Analysis of Factors Affecting Walking Speed Based on Natural Field Data: Considering the Attributes of Travelers and the Travel Environment. Sustainability. 2023; 15(14):11433. https://doi.org/10.3390/su151411433
Chicago/Turabian StyleMiao, Shuqi, Tinghao Li, Lili Zheng, Bowen Tan, and Qianjun Ma. 2023. "Analysis of Factors Affecting Walking Speed Based on Natural Field Data: Considering the Attributes of Travelers and the Travel Environment" Sustainability 15, no. 14: 11433. https://doi.org/10.3390/su151411433