Article

CFD Simulation Based Ventilation and Dust Reduction Strategy for Large Scale Enclosed Spaces in Open Pit Coal Mines—A Case of Coal Shed

1
School of Mines, China University of Mining and Technology, Xuzhou 221116, China
2
State Key Laboratory of Coal Resources and Safe Mining, China University of Mining and Technology, Xuzhou 221116, China
3
High Tech Research Center for Open-Pit Mines, China University of Mining and Technology, Xuzhou 221116, China
4
School of Engineering and Technology, Hulunbuir University, Hulunbuir 021008, China
5
Heidaigou Open-Pit Coal Mine of CHNENERGY Investment Group Co., Ltd., Zhunneng Group Co., Ordos 010300, China
6
Xinjiang Institute of Engineering, Support Xinjiang University Western Energy Development Institute, Urumqi 830023, China
*
Authors to whom correspondence should be addressed.
Sustainability 2023, 15(15), 11651; https://doi.org/10.3390/su151511651
Submission received: 26 June 2023 / Revised: 14 July 2023 / Accepted: 19 July 2023 / Published: 28 July 2023
(This article belongs to the Special Issue Advances in Intelligent and Sustainable Mining)

Abstract

:
The coal shed is an enclosed space where raw coal is stored and handled. The intensive operation of the machinery inside the coal shed generates a large amount of dust, and the wind speed inside the enclosed space easily leads to a high concentration of dust, which endangers the physical and mental health of the workers. In this paper, we first studied the particle size distribution of dust samples in the coal shed and found that 12.2% of the dust in the air of the coal shed was 10–100 μm, 87.8% was less than 10 μm, and 72.9% was less than 2.5 μm. Fluent was used to simulate the law of dust dispersion in the coal shed under different working conditions, and finally, the simulation results were used to guide the design of the ventilation site and dust-reduction scenario. The experimental and simulation results show that under the same working conditions, the average dust reduction efficiency of the ventilation method in which the north side and south side pump air outside was 9.9%. The ventilation method in which the north side blows inside and the south side pumps outside was 23.7%. The average dust reduction efficiency of the ventilation method in which the north side blows inside and the south side pumps outside + placing the fan in the middle was 59.9%. The research results can provide some reference value for indoor air quality improvement.

1. Introduction

Coal is an important energy component for the industrial development of many countries [1]. The problem of dust pollution caused by the use of coal mining has been widely recognized, especially abroad, and in the mining of coal in the form of open-pit mines, due to the large mining operation equipment and operating intensity, dust production problems are inevitable [2,3,4]. The high concentrations of dust in the coal sheds of today’s open-pit mines can cause an immeasurable health risk for workers, who are susceptible to pneumoconiosis if they breathe high concentrations of dust for long periods. Most workers in coal sheds use personal protective measures that cannot solve the problem of high dust concentration at the source. Therefore, in these workplaces with high dust concentrations, strict occupational health and safety measures should be taken or various techniques and equipment should be used to control the dust concentration in the workplace and improve the working environment of workers to ensure workers’ health [5,6]. On the problem of indoor dust pollution, scientists at home and abroad have carried out many related studies.
Jia et al. [6,7] used Fluent software to numerically simulate the trajectory of dust particles in a chute with a semi-enclosed space structure. The results show that the dust concentration is negatively correlated with the moisture content of the material and positively correlated with the height of the chute, the dust concentration is higher for smaller particle sizes, and dust concentration in the chute space gradually increases from top to bottom, and they found that the bottom of the chute is the critical key area for controlling dust pollution. Huang et al. [8,9] developed a reliable hydrodynamic model for dust dispersion mitigation during transport using airflow velocity distribution and pollutant distribution, proposed an airflow optimization model based on particle dispersion and accumulation simulations, modified the spatial arrangement of shed coal buildings, and compared the effects of various factors on dust load distribution. The results showed that the spatial arrangement of the facility significantly affects the airflow and thus the dust dispersion pattern. Xiu et al. [10,11] proposed a new semi-enclosed air curtain device for dust control to reduce dust pollution in a fully mechanized coal mine and conducted numerical simulations of the dust suppression effect. The results showed that the open-air curtain for dust control had an efficiency of 61.8% dust reduction and the diffusion of particles on the downwind side reduced the diffusion distance of ultrahigh concentration dust by about 35 m. Novak et al. [12] calculated the flow velocity using Computational Fluid Dynamics software at a coal and iron ore dump. The results showed that the porous fence and barrier had a positive effect on reducing the local rate and reducing the dust erosion rate, that the actual accumulation geometry with adjacent structures would affect the wind velocity distribution, that the inlet angle was a key factor affecting the effectiveness of solid and porous wind barriers, and that the placement of porous barriers between the stockpiles could effectively reduce dust emissions. Ma et al. [13,14] used theoretical methods and numerical simulations to investigate the extent of dust pollution in open dumps and to determine the size of dust barriers. Using DPM-CFD simulations and field measurements, the dispersion characteristics of dust in open yards were determined. It was concluded that the amount of dust is related to the height difference between the dumped material and the horizontal velocity of the dust, and that the further dispersion of the dust is influenced by different airflows, with the fan airflow being the most important factor. Su et al. [15,16,17] investigated the dust suppression effect of wind-driven ventilation in porous windbreak gables using wind tunnel experiments and computational fluid dynamics by studying wind-driven ventilation and wind speed near the fans. The dust-suppressing effect of ventilation in different coal sheds was compared to open gables by converting the relationship between ventilation rate and dust suppression rate, and they found that the use of mobile fans was more effective than the additional installation of natural ventilation. Zhao et al. [18,19] used DPM-CFD to simulate the diffusion mode of dust in an enclosed space. The results showed that the dust concentration in the enclosed space was unevenly distributed throughout the room, and as the air velocity decreased, the number of particles, the kinetic energy, and the amount of dust cloud decreased. Cheng et al. [20,21] investigated the ventilation effect of natural roof vortex fans to improve indoor environments and ventilation while achieving good energy efficiency. Using multiple nonlinear regression analysis and calculations of natural ventilation theory, a model and calculation method for natural ventilation of enclosed coal storage facilities based on indoor pollutant concentration control was proposed. Shin et al. [22,23] investigated the characteristics of dust scattering in the vicinity of coal stockpiles affected by the height of windbreaks and predicted the wind speed and air pressure distribution in the vicinity of coal stockpiles with four different heights of windbreaks using numerical simulations. The results showed that dust scattering could be reduced by 75%, that the height of the windbreak had an important influence on particle scattering, that ventilation of the windbreak could significantly reduce the wind absorption of the deposition flow on the roof and the windbreak while increasing the overpressure, and that the use of porous windbreaks not only contributed to a good wind climate but also reduced the negative wind load. Jing et al. [24,25] proposed a new technique to control vortex and suction dust. Numerical simulations showed that the vortex and suction technique provided better dust removal, and most of the dust could be captured by the vortex winding from the bottom to the top. Qiu et al. [26] concluded that the commonly used large-span scales are particularly susceptible to wind loads and that aerodynamic performance is largely influenced by their external shape. The optimization of the shape was carried out numerically and the results were verified by wind tunnel tests, which showed that the aerodynamic loads and the optimal geometry depend on the choice of gable type and wind direction.
Many experts and scholars have explored the dust movement law in depth at an early stage, and the conclusions obtained are relatively mature, and the dust reduction work has been carried out effectively at the same time. Different from the previous studies, this paper, based on the research of previous experts and scholars, applies Fluent numerical simulation software to simulate the dust dispersion law based on the dust generation characteristics of semi-enclosed space coal sheds, and proposes a ventilation and dust reduction scheme applicable to this working condition, which fills the knowledge gap of dust transport and dispersion law and effective control in semi-enclosed spaces. A 35 Mt/year open-pit coal mine in northern China, Baorixil Open-Pit Coal Mine, was used as a test base to collect dust samples and monitor dust concentration on-site, and the dust particle size distribution characteristics were obtained through laboratory tests. This paper clarifies that dust management is a must for the coal industry to achieve sustainable development; in particular, coal shed dust management can not only reduce the incidence of occupational diseases among employees and provide a good working environment, but also reduce the failure rate of mining equipment and increase its service life.

2. Materials and Methods

In this paper, a combination of numerical simulation and field application is used. First, the relationship between the dust source in the coal shed and the particle size distribution of the dust is studied, the particle size distribution of the dust is clarified, and the parameter is assigned to the Fluent numerical simulation software. The dust dispersion law in the coal shed is simulated under three working conditions or scenarios, the dust reduction efficiency and dust reduction effect of different ventilation methods are determined, and the numerical simulation results are used as a guide for on-site design. The design of the three working conditions is carried out, and the optimal ventilation method for dust reduction in the coal shed is determined based on the simulation results and on-site measurement results.

2.1. Dust Particle Size Distribution Test

The size distribution of dust particles is an important part of the study of the properties of dust, so the dust scattered in the air is sampled and analyzed on-site. The dust dispersed in the coal shed was determined on-site using the JCF-6H laser environmental dust continuous tester from Qingdao Juchuang Technology. The instrument parameters are listed in Table 1. The dust tester is placed at a height of 2 m, the air inlet and outlet of the instrument are kept clear, and the instrument functions are as shown in Table 1. It can statistically detect the dust in different particle size ranges, and after the completion of the installation, 24 h data are collected and analyzed.

2.2. On-Site Dust Monitoring Network Layout

In order to effectively reduce the concentration of dust in the coal shed of the open-pit coal mine, a site model was first established. The dimension of the coal shed of the open-pit coal mine was 224 m, with a width of 60 m, and a height of 35 m. Forty-five axial flow fans of the type BT35-11-5# manufactured in Wenzhou, China, were installed on both sides, with the specific parameters shown in Table 2. The fans were installed at a height of 2 m above the ground, with 18 axial fans on the north side and 27 axial fans on the south side; the diameter of the fan was 0.5 m.
There are five existing air inlets, including a belt inlet on the east side and air inlet on the west side, and the top has 21 vents with a diameter of 0.5 m. All three vehicle entry and exit gates are deployed on the north side, with a gate width of 13 m and a height of 8 m. The model was built into a three-dimensional schematic of the coal storage shed as shown in Figure 1.
The coal shed site of the open-pit coal mine had a total of 15 detection points, the specific location plan is shown in Figure 2. The dust concentration inside the coal shed for real-time monitoring were measured by the equipment GCG1000 (A)-type dust concentration sensor as shown in Table 3. Its functions include TSP real-time dust concentration and light alarm function. Recording time of the monitoring device is stored once after 30 s and hourly averages are output once an hour.
Layout method: as in Figure 2a, the whole coal shed is divided into five areas from east to west, with three monitoring points in each area; the monitoring points in the middle area are arranged as in Figure 2b, with a row of monitoring points on the top of the coal shed and a row of monitoring points on each side of the coal shed, and the installation method of the monitoring points in the area is hanging, with the sensor in the top area about 30 m from the horizontal ground, and the area on both sides about 8 m from the horizontal ground.

2.3. Fluent Simulation of Dust Dispersion and Transport Patterns in Coal Sheds

The computational fluid dynamic using Workbench makes the whole process more intuitive and easier to control. The numerical simulation consists of three steps: pre-processing, solver, and post-processing. The pre-processing is the creation of the fluid model and meshing, the solver is a set of procedures to perform the calculations, and the post-processing is used to display and output the results. The simulations were performed on Workbench using Space Claim software for modeling, Meshing software for meshing, Fluent software for the solver, and CFD-post software for post-processing (Anasys 2020 R1).

2.3.1. Initial and Boundary Condition Assignment of the Model

According to the data obtained in practice to build the model, the flow field conditions in this simulation are constant, and the uniform field jointly determined by the pressure field and inlet conditions is set as the initial flow field. By combining the mathematical model and the fluent simulation method, the parameters and boundary conditions for the numerical simulation of the gas-phase flow field were set as shown in Table 4. The boundary conditions are a necessary condition for numerical simulation, and the boundary conditions in Fluent mainly include four categories, namely inlet and outlet boundary conditions, wall boundary conditions, internal unit area boundary conditions, and internal surface area boundary conditions. In this study, the effect of different ventilation conditions on dust and the dust transport pattern is investigated. Therefore, the inlet boundary condition is chosen as velocity inlet and the outlet boundary condition is chosen as pressure outlet.
From a macroscopic point of view, the standard k-e model can accurately simulate the specific turbulent process due to the relatively small Mach number. The k-epsilon two-equation model was proposed by Launder and Spalding in 1972. Based on the equation of turbulent kinetic energy k, an equation of turbulent kinetic energy dissipation rate epsilon is introduced to form the k-epsilon two-equation model, which is called the standard k-epsilon model. The standard k-e model is mainly obtained empirically, and the k-equation has a high degree of accuracy, while the e-equation is more empirically obtained.

2.3.2. Simulation of Dust Transport Patterns in Scenario 1

In this paper, the ventilation mode of the north and south sides simultaneously pumping out the air is hereinafter uniformly referred to as Scenario 1, in order to study the diffusion law of dust in different dust-producing points in the coal shed. According to the installation of dust sensors in the length direction of the coal shed the model is divided into five regions, and uniformly arranged in five dust-producing points. The dust particle size parameter of the dust-producing points is set up according to the detected dust particles in the air, the parameters of the model and the boundary conditions are set up according to Table 1, and the fans are set up according to the parameters of the axial flow fan. The cross-sectional area of the air outlet is a circle with a diameter of 0.5 m. The speed of the air outlet of the fan on the north side and the fan on the south side is set at 14 m/s, which is the value of the axial fan equipment parameters. The maximum value of the dust particle size is set at 100 μm, the minimum value of the dust particle size is set at 2.5 μm, and the intermediate value of the dust particle size is set at 10 μm, and after the parameter assignments the model is established as shown in Figure 3.

2.3.3. Simulation of Dust Transport Patterns in Scenario 2

Scenario 2 refers to the ventilation method of compressed air on the north side and exhaust air on the south side. The main working area inside the coal shed is the north side, in order not to hinder the daily work and at the same time reduce the dust concentration in the main working area, the ventilation method of compressed air from the north side and exhaust air from the south side is used, the dust is transported in this way from the north side to the south side. The parameters for this working condition differ from those set in Scenario 1 in that the speed of the fan outlet on the north side is set to −14 m/s, since the direction of the fan in the coal shed is changed, and the influence of the coal pile on the airflow generated by the fan must be taken into account. When the direction of the fan in the coal shed is changed, the effect of the airflow from the coal pile on the fan must be taken into account (Figure 4).
The dust diffusion migration trajectory and diffusion cloud map in Scenario 1 and Scenario 2 were simulated using Fluent software, and the dust transport trajectory and diffusion cloud map of different particles were compared, respectively. The simulation of the dust particle capture rate in the coal shed is divided into five areas for five simulations, and 3000 dust particles are discharged into each area of the coal shed one by one. All the dust particles in the coal shed are monitored (in this work, the dust particles that reach the discharge position are defined as the captured particles), and the capture rates of Scenario 1 and Scenario 2 are matched by the number of monitored dust particles.

2.3.4. Simulation of Dust Transport Patterns in Scenario 3

Scenario 3 refers to the ventilation method of north side compressed and air south side exhaust + air duct. In order to further investigate the dust reduction efficiency proposed in the Scenario 3 dust reduction method, the numerical simulation parameters under this working condition are based on Scenario 2, with three groups of centrifugal fans and a T-shaped air duct. The centrifugal fans were selected from Wucheng County Changsheng Fan Impeller Factory with model number 4-72-10A, air volume of 30,000 m3/h, and power of 18.5 kW. The centrifugal fan must be equipped with air ducts. Since the centrifugal fan is relatively large, the pumping force is relatively large, and the ventilation fan is deformed by excessive wind. One-centimeter thick galvanized steel was selected as the raw material for the air ducts. The ducts were equipped with reserved vents and airflow restrictor valves to ensure that the air velocity of the vents meets the requirements. The total length of the coal shed is about 224 m, and the conveyor belt is about 180 m long. The ducts are evenly arranged from east to south, and the length of the ducts is set to be 60 m in a group, and a total of three groups were laid out. In order to develop a suitably sized duct, the cross-section of the duct was set to a square with a length and width of 0.9 m in accordance with the principles of fluid dynamics and the actual fan parameters (Figure 5).

3. Results and Discussion

3.1. Major Dust Sources and Particle Size Distribution Tests in the Coal Shed

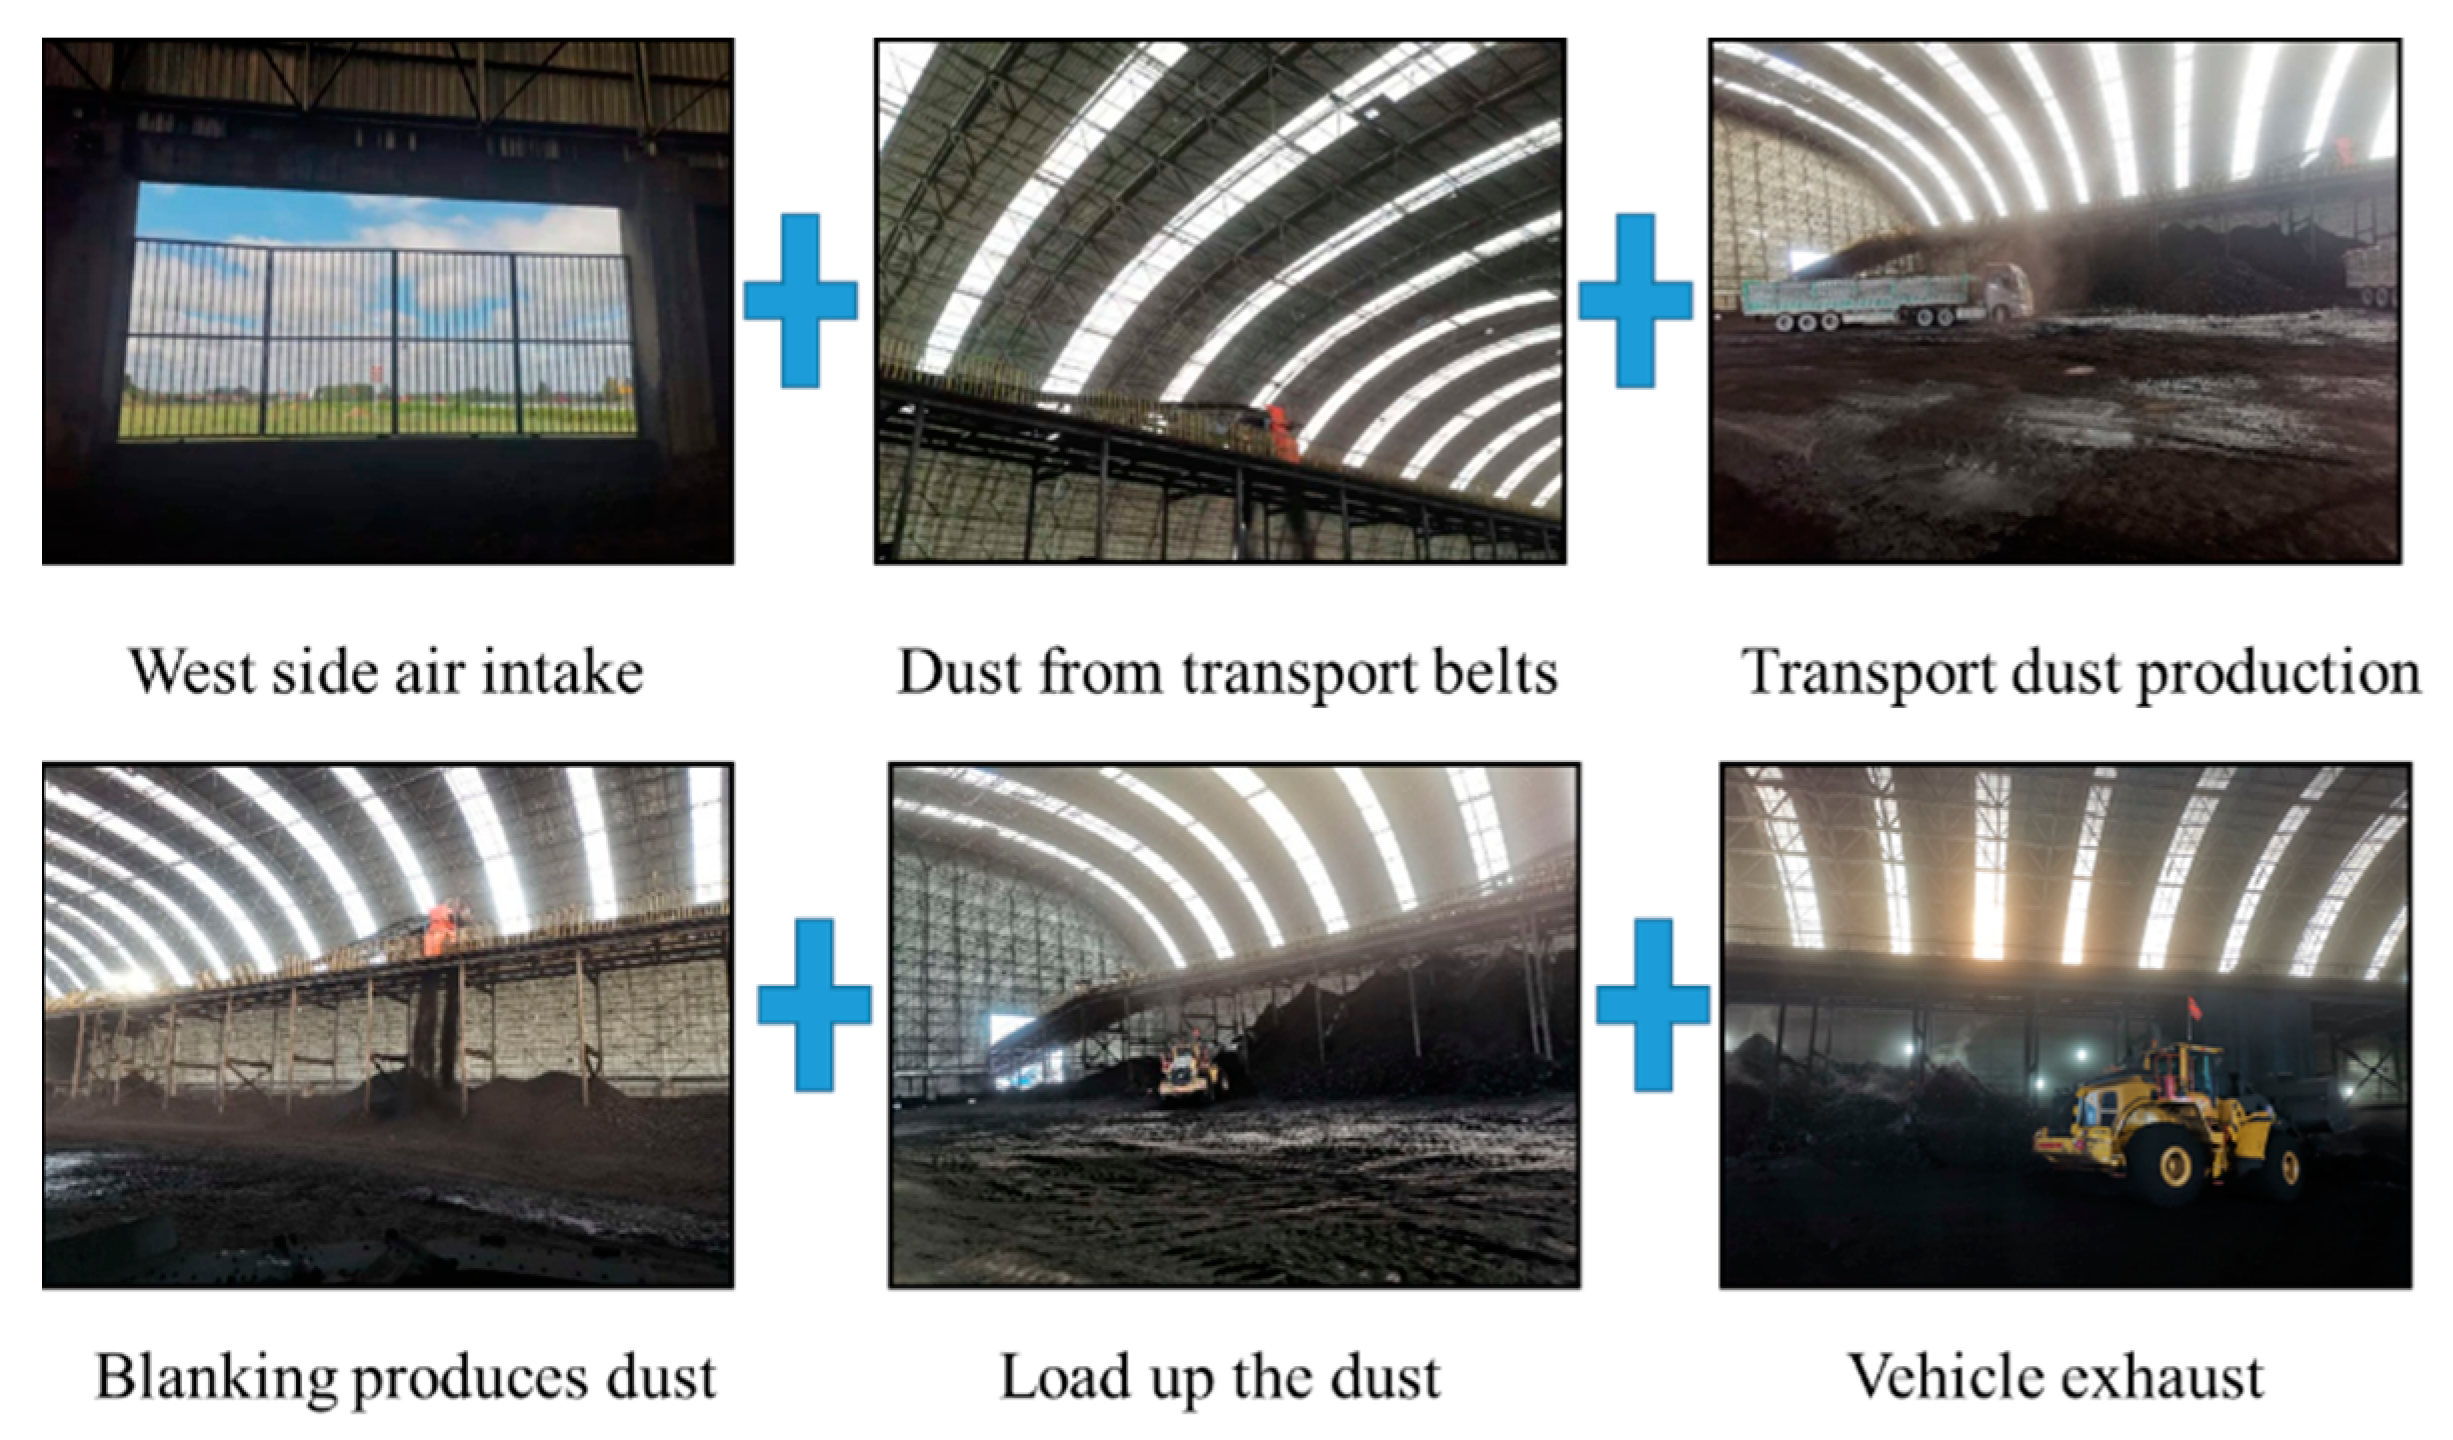
3.1.1. Main Dust Sources in the Coal Shed

Data collection and field observations identified the following six main types of dust in the field:
(1)
There is air intake on the west side of the coal shed. When the natural wind speed is too high, the dust deposited near the air inlet is stirred up by the wind flow and blown into the coal shed, while the dust suspended in the air inside the coal shed is accelerated by the wind speed of the air inlet to increase the amount of dust inside (Figure 6).
(2)
Due to the large amount of coal transported on the belt, some of the coal pieces collide with each other during transportation on the belt and generate dust, while the raw coal also rubs on the belt and generates dust. Some of the dust adhering to the raw coal also generates dust due to the friction between the belt movement and the air.
(3)
When the truck is moving fast, it generates a wind flow at its rear with higher speed, so the dust that was originally deposited is stirred up again by the wind. In addition, the tires of the truck repeatedly shatter the road surface during transportation, causing the large stones to break into smaller dust particles and increase the amount of dust.
(4)
After the material passes the drop opening and moves in free fall, the dust is generated by the collision between the coal blocks during the fall and by the friction between the raw coal and the air, and the dust adhering to the raw coal is blown into the air. At the same time, the material falls to the ground and collides with the ground coal, generating dust.
(5)
During the loading of the coal, the external moisture evaporates more, the loader disturbs the coal pile several times during loading, generating a large amount of dust, and the material collides several times during loading and unloading, including the collision between the material and the truck.
(6)
The pollutants emitted from transport vehicles, mining trucks, loading shovels, etc. are carbon monoxide (CO), hydrocarbons (HC), nitrogen oxides (NOX), and several other solid particles such as PM (particulate matter, soot), which have a negative impact on human health.

3.1.2. Airborne Dust Test

Figure 7 shows the particle size distribution, based on data from field tests of dust concentration in the air.
As shown in Figure 7, dust particles with a size of 10–100 μm accounted for 12.2% of the total dust, dust particles with a size of less than 10 μm accounted for 87.8% of the total dust, and particles with a size of less than 2.5 μm accounted for 72.9% of the total dust. The smaller the particle size, the greater the risk to the human body. The test results show that most of the dust in the air of the coal shed has a particle size of less than 10 μm, and the dust particles in this size range are harmful to the human body. Therefore, it is of utmost importance to control the fine dust particles in the coal shed.

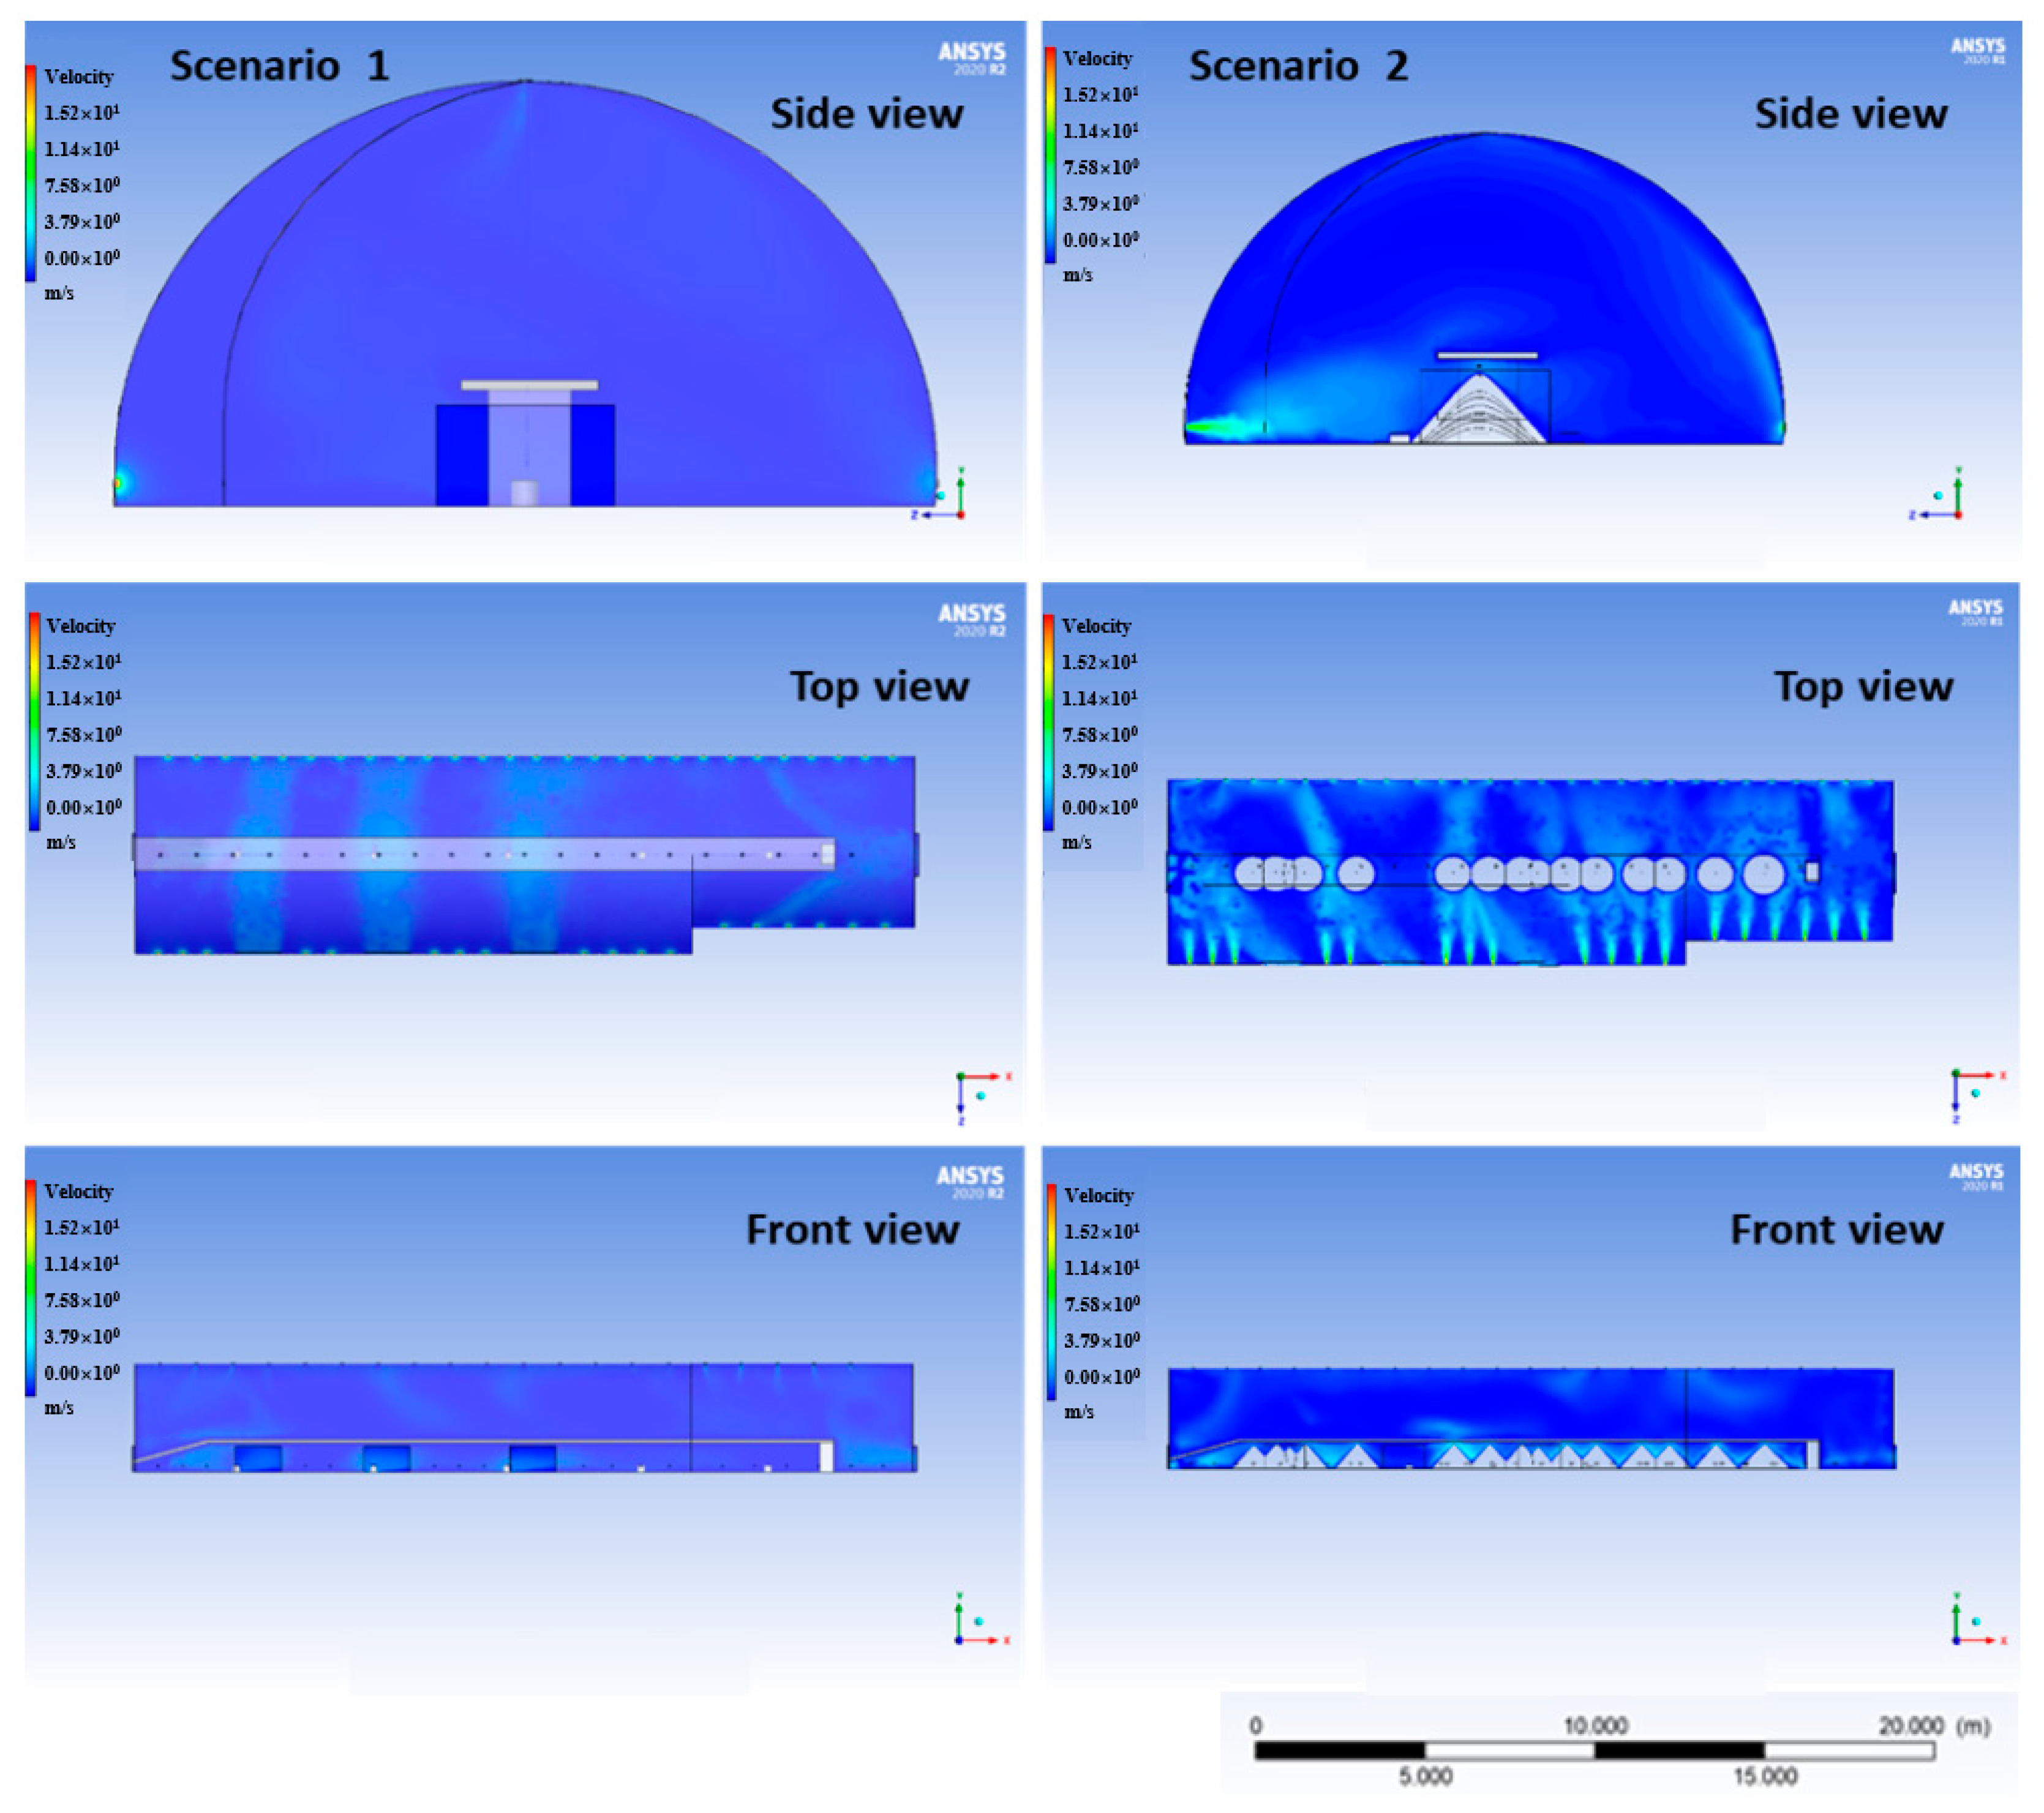
3.2. Numerical Simulation Comparison between Scenario 1 and Scenario 2

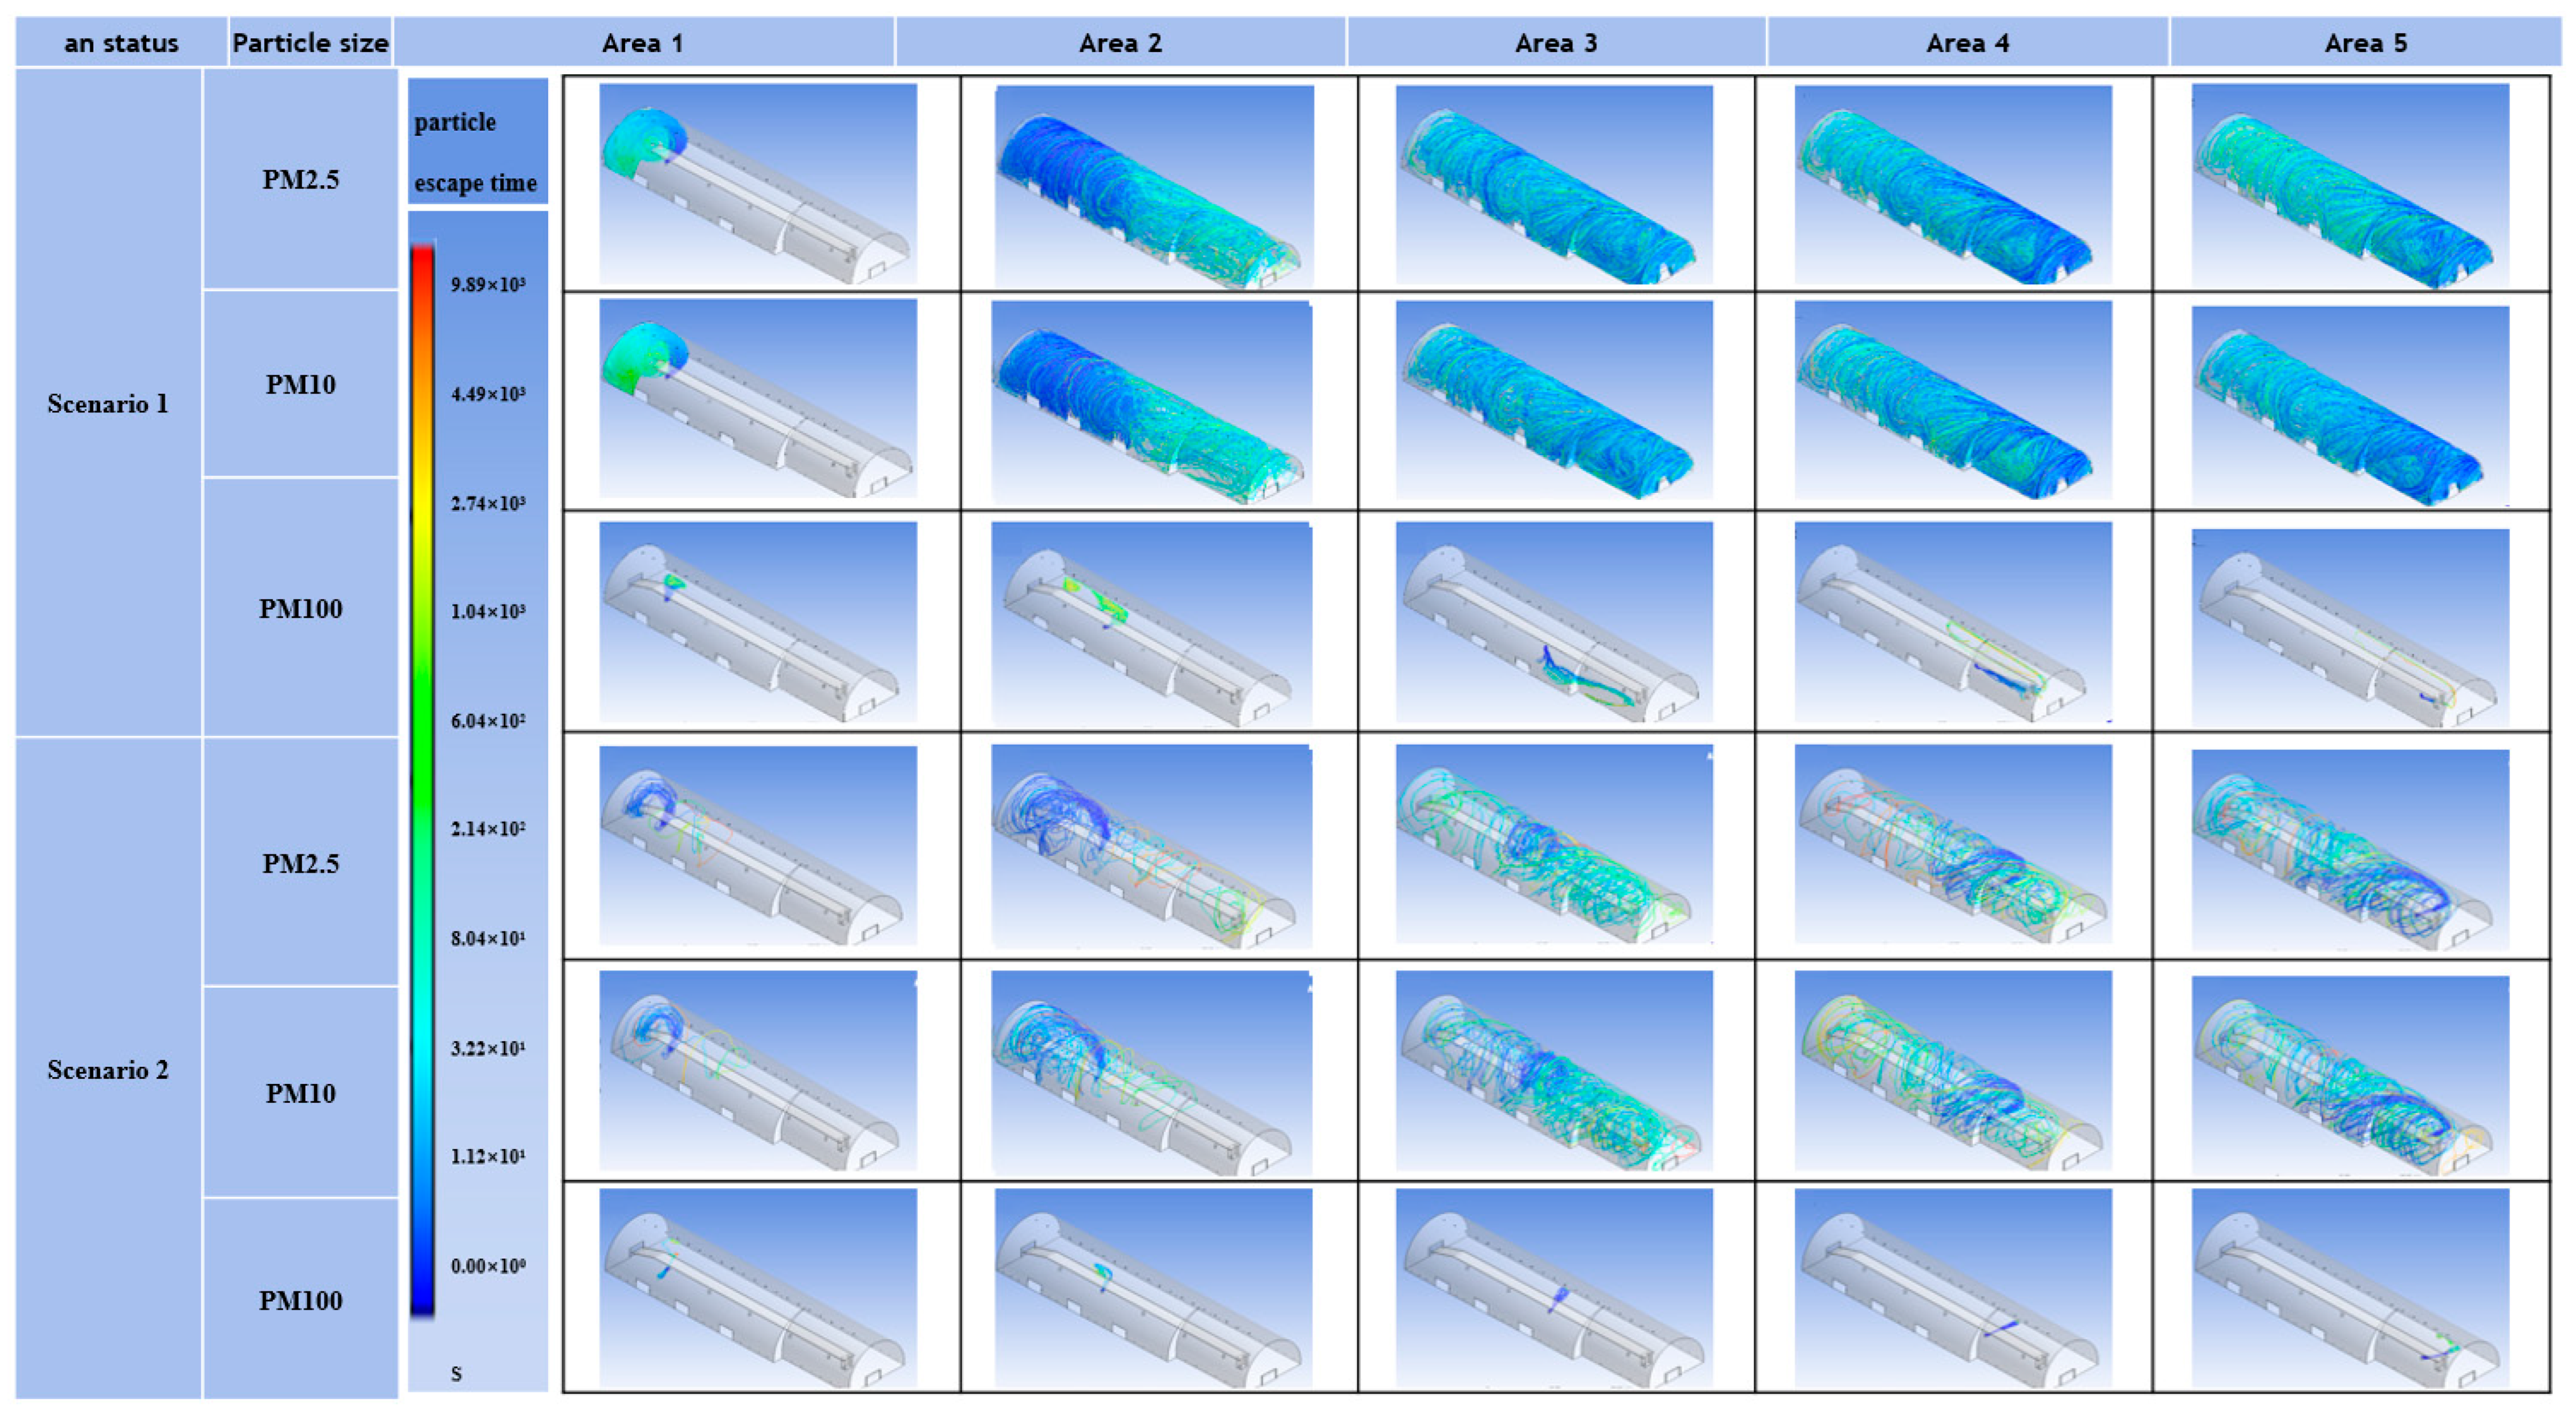
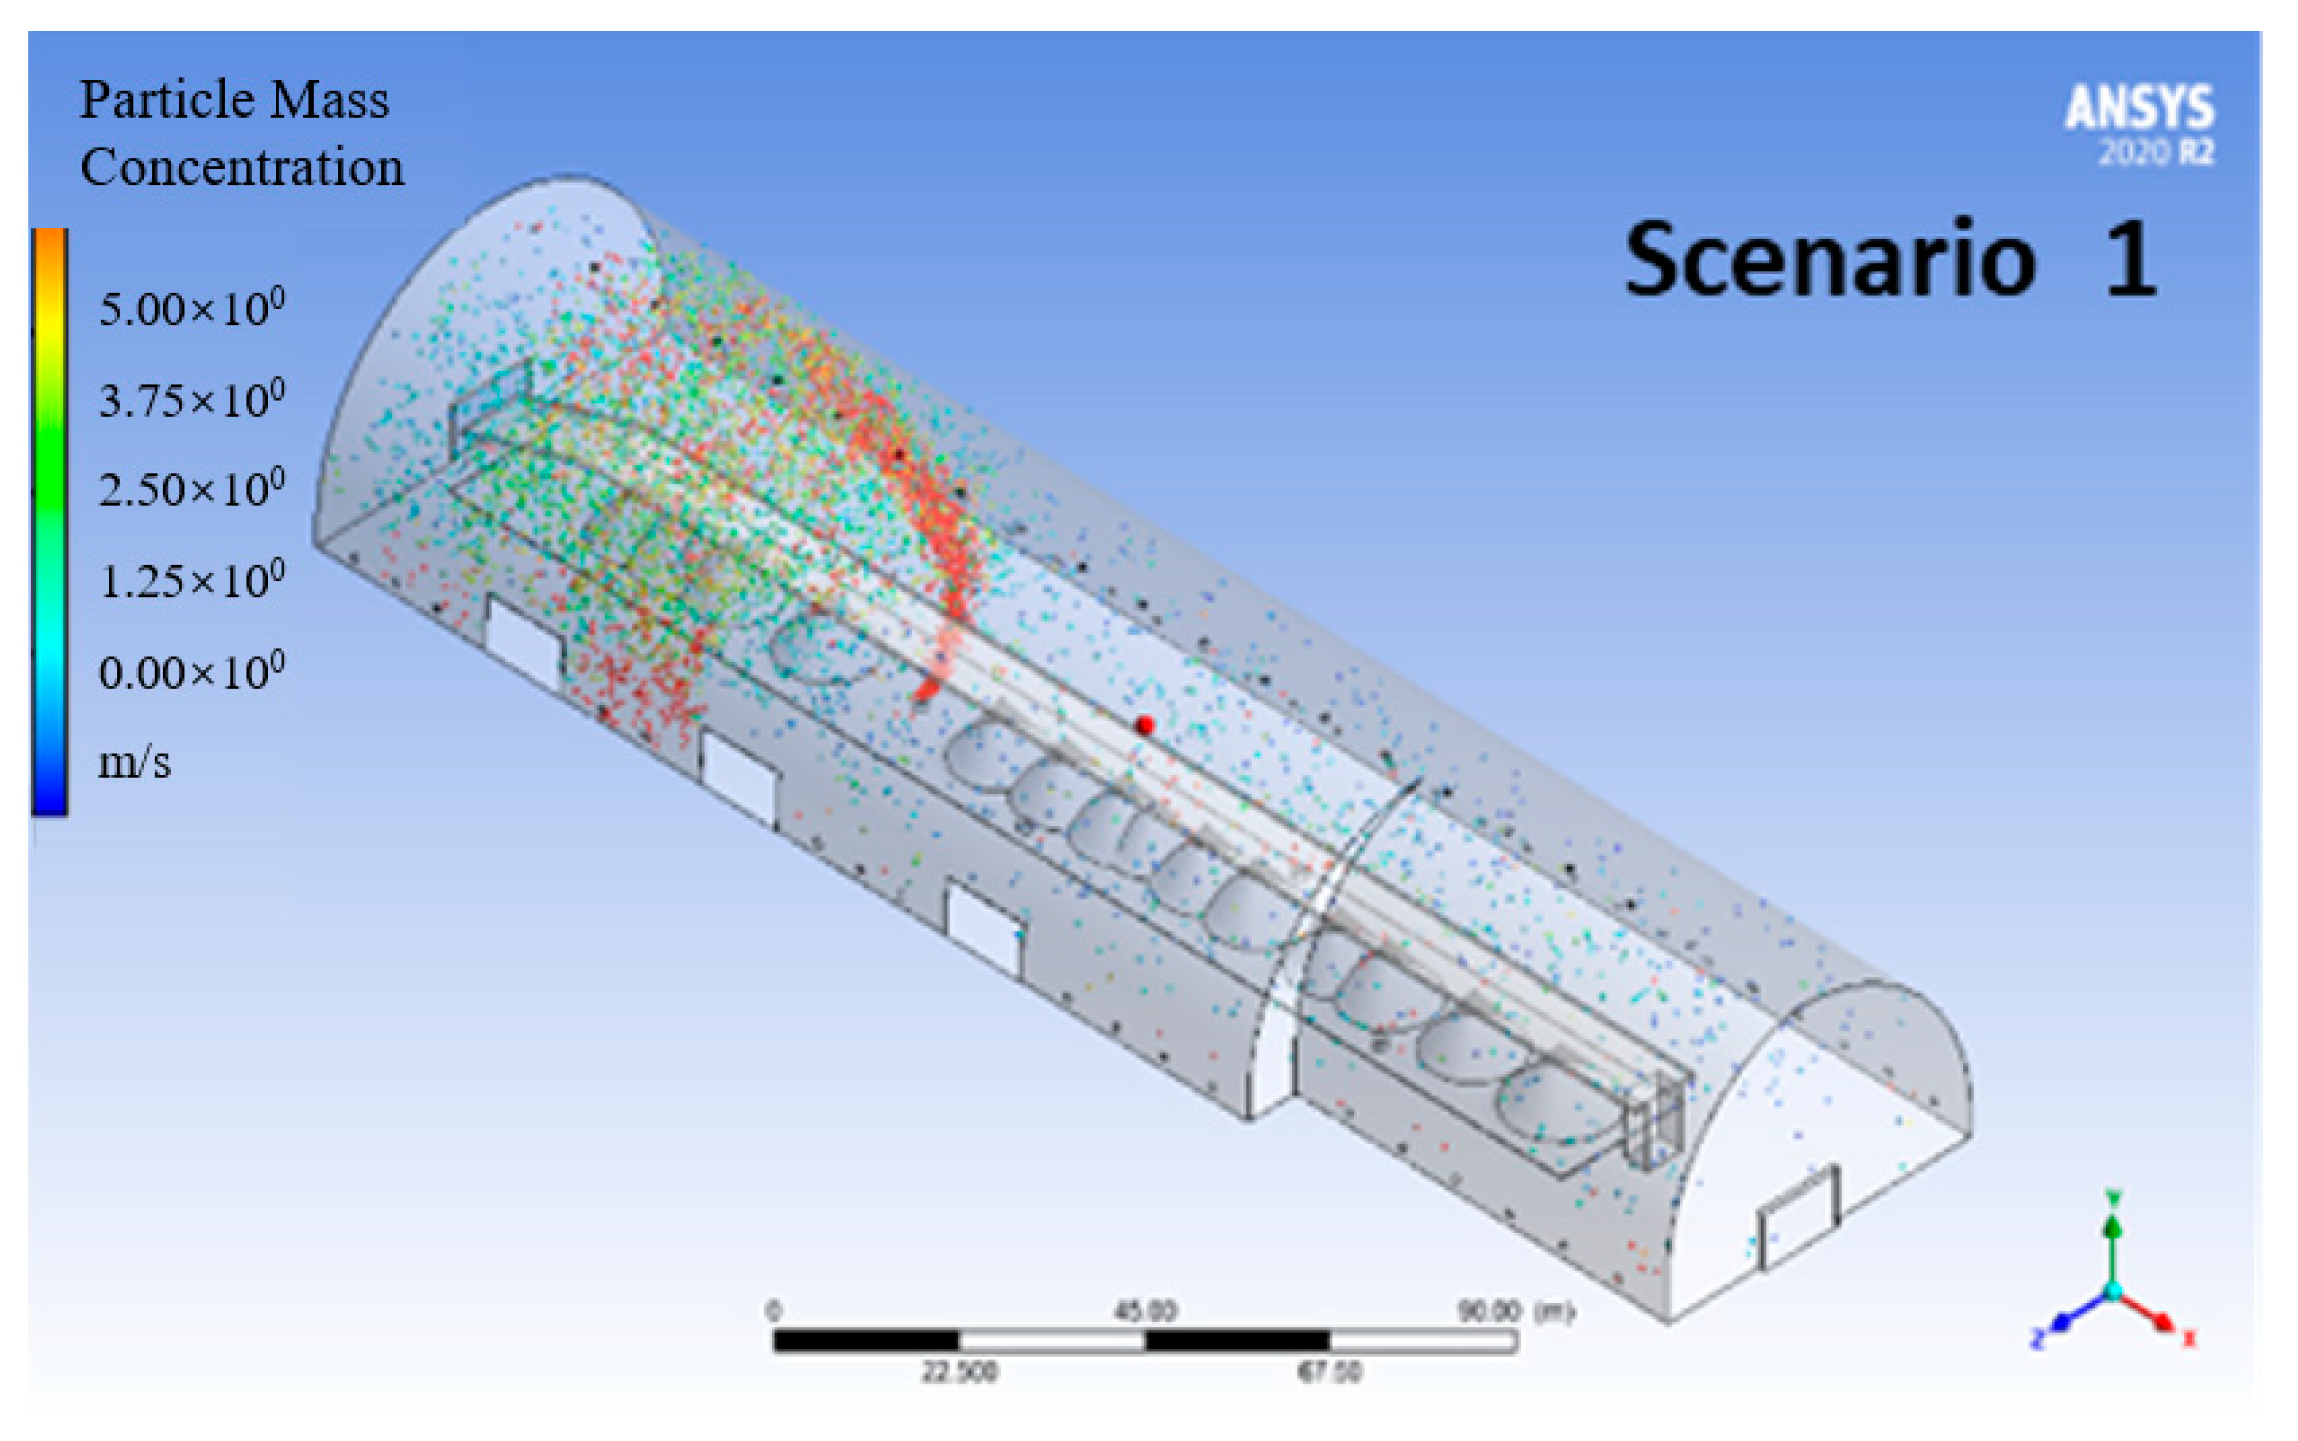
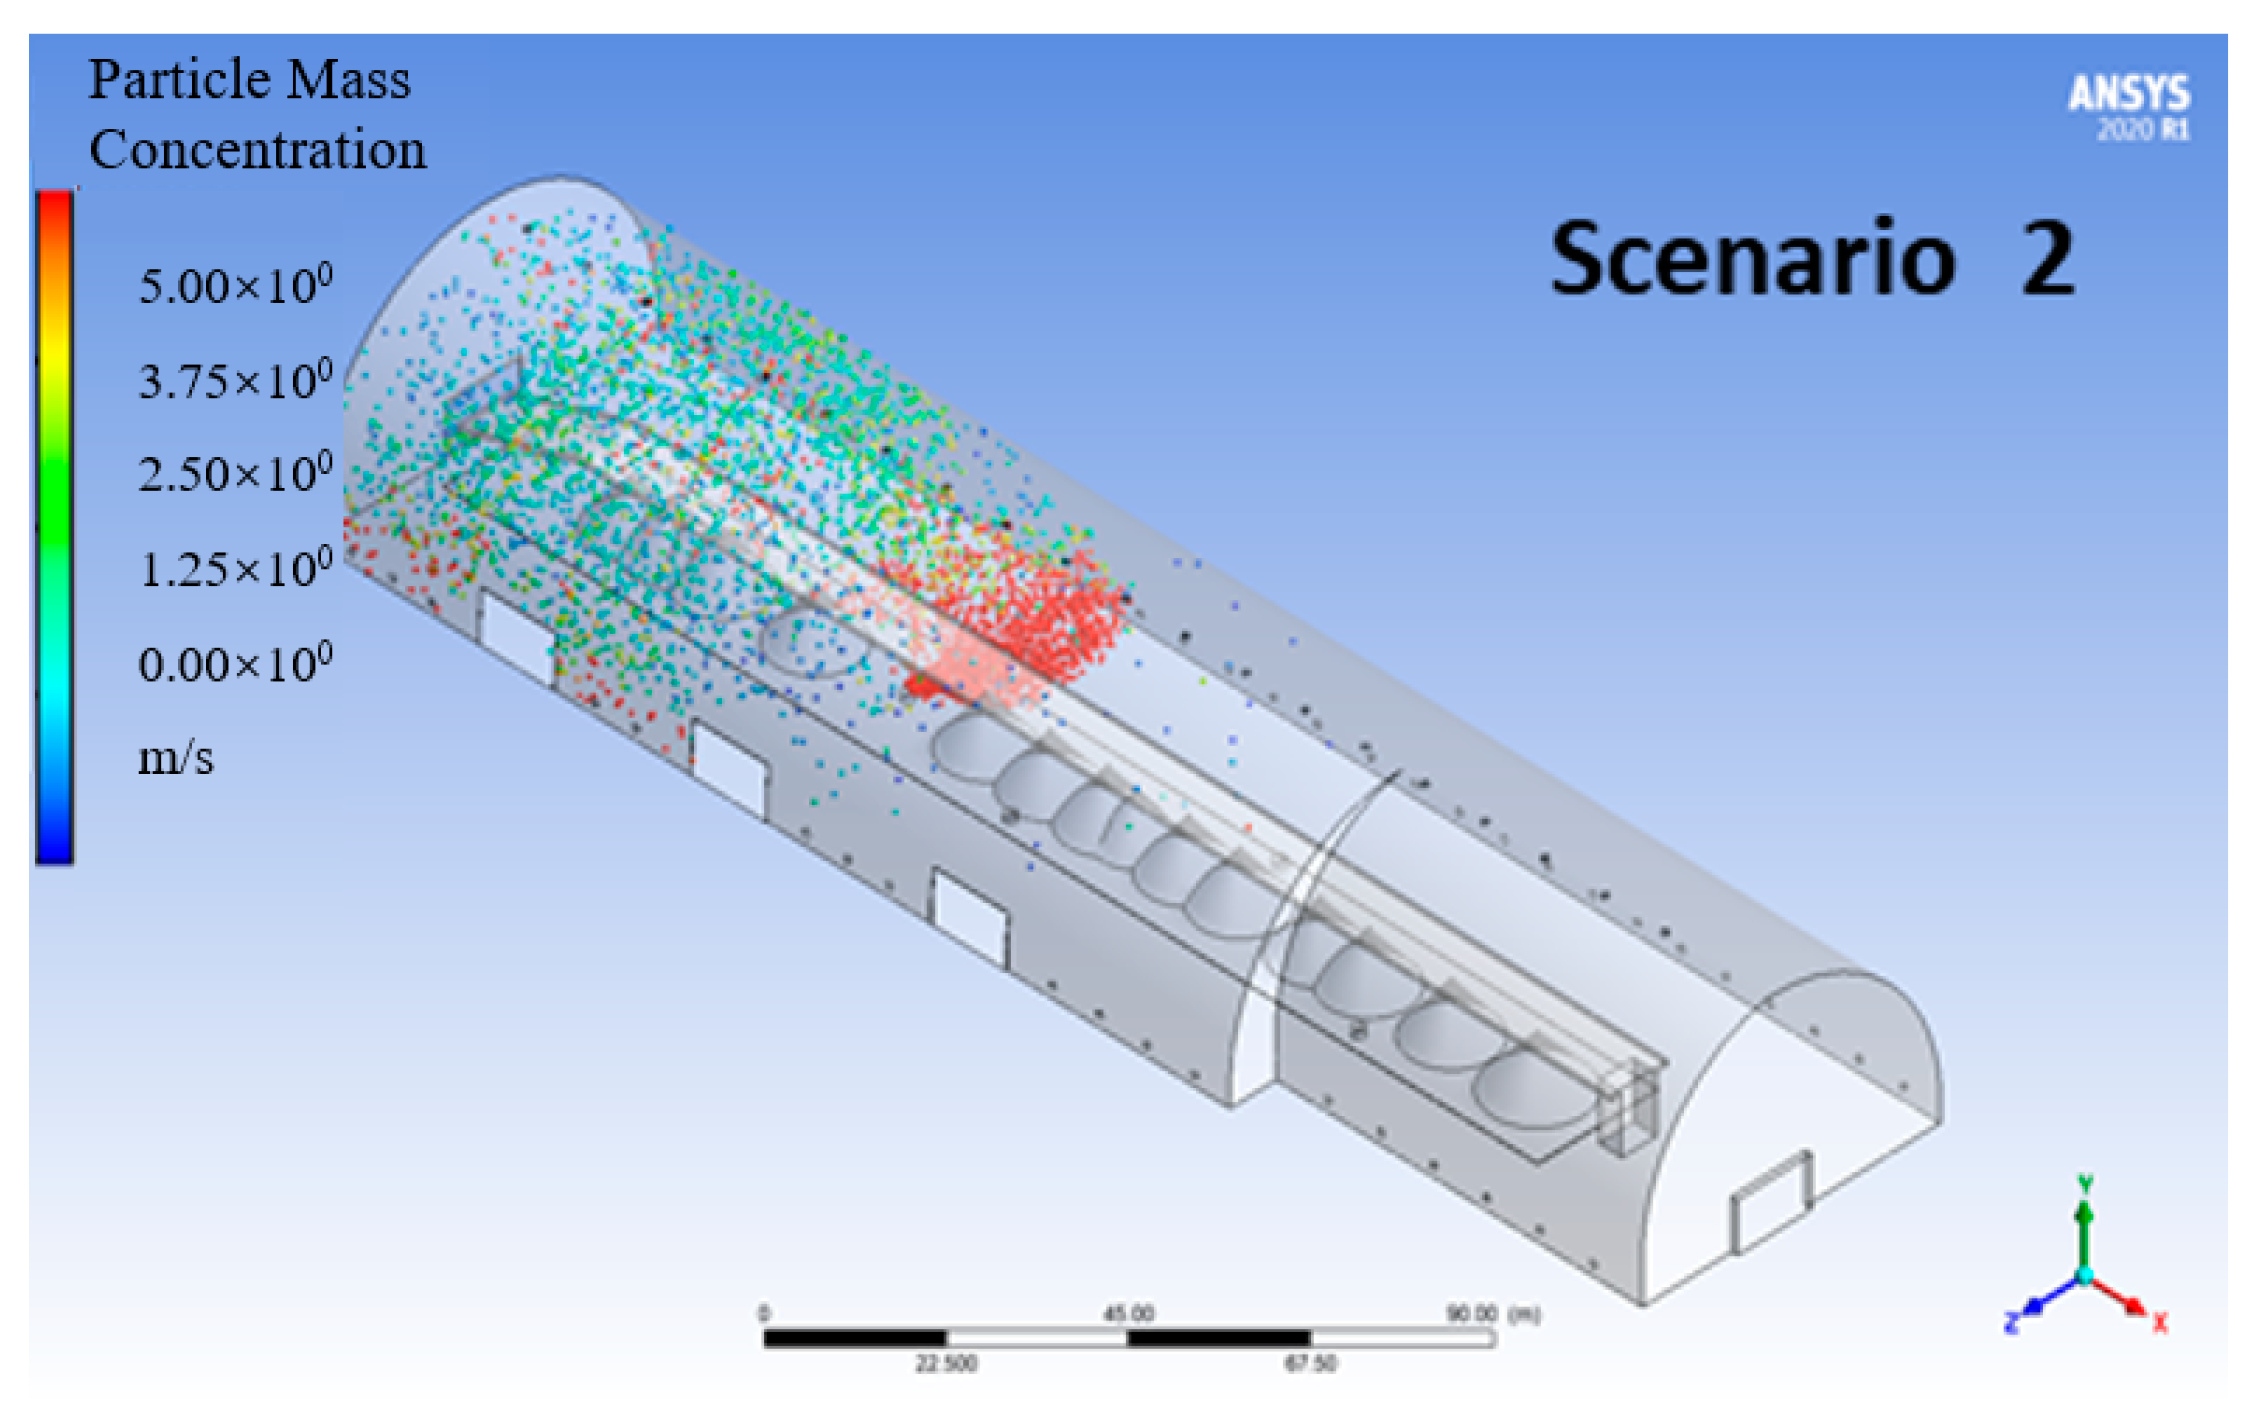
3.2.1. Comparison of Dust Transport Trajectories in Scenario 1 and Scenario 2

In Scenario 1, only dust production Point 1 in the coal shed has the least spread of dust. Most of the dust produced at dust production points 2–5 spreads around the dust production points, but some of it spreads to other areas because dust production points 2–5 are close to the updraft and far from the downdraft, as shown in Figure 8. Under Scenario 2, the airflow field in the coal shed becomes more active and dust is less likely to accumulate. Dust dispersion from dust production Point 1 in the coal shed occurs mainly in Area 1, which is consistent with the status of Scenario 1. Dust production Point 2 is farther from the air outlet and closer to the air inlet than dust production Point 1, so dust dispersion at dust production Point 2 covers a larger area but is mainly concentrated in Area 2. The closer the dust production point is to the air inlet and the farther it is from the air outlet, the larger the area of dust dispersion becomes and the more uniform the dust concentration becomes. In comparison, results show that Scenario 2 has a lower dust concentration and a smaller dispersion area than Scenario 1, and the dust dispersion is more uniform. The smaller the dust particles are under the same working conditions, the more complex and chaotic their transport trajectory, and the more difficult and time-consuming their detection. For example, the smallest particle size, PM2.5, is the most difficult to detect and takes the longest time to do so. PM10 dust is in the same state as PM2.5, while PM100, due to its large particle size and short dispersion distance, quickly sinks to the ground due to gravity and has a simple and short transport trajectory. Comparing the trajectories of dust particles in both cases, it can be seen that Scenario 2 leads to better dust reduction than Scenario 1. The wind-flow field in the coal shed is driven by the natural wind and the fan simultaneously. The escape of dust is completed quickly at a distance from the inlet and outlet positions close to the atmosphere, and an appropriate natural wind facilitates the diffusion of the escaping dust.

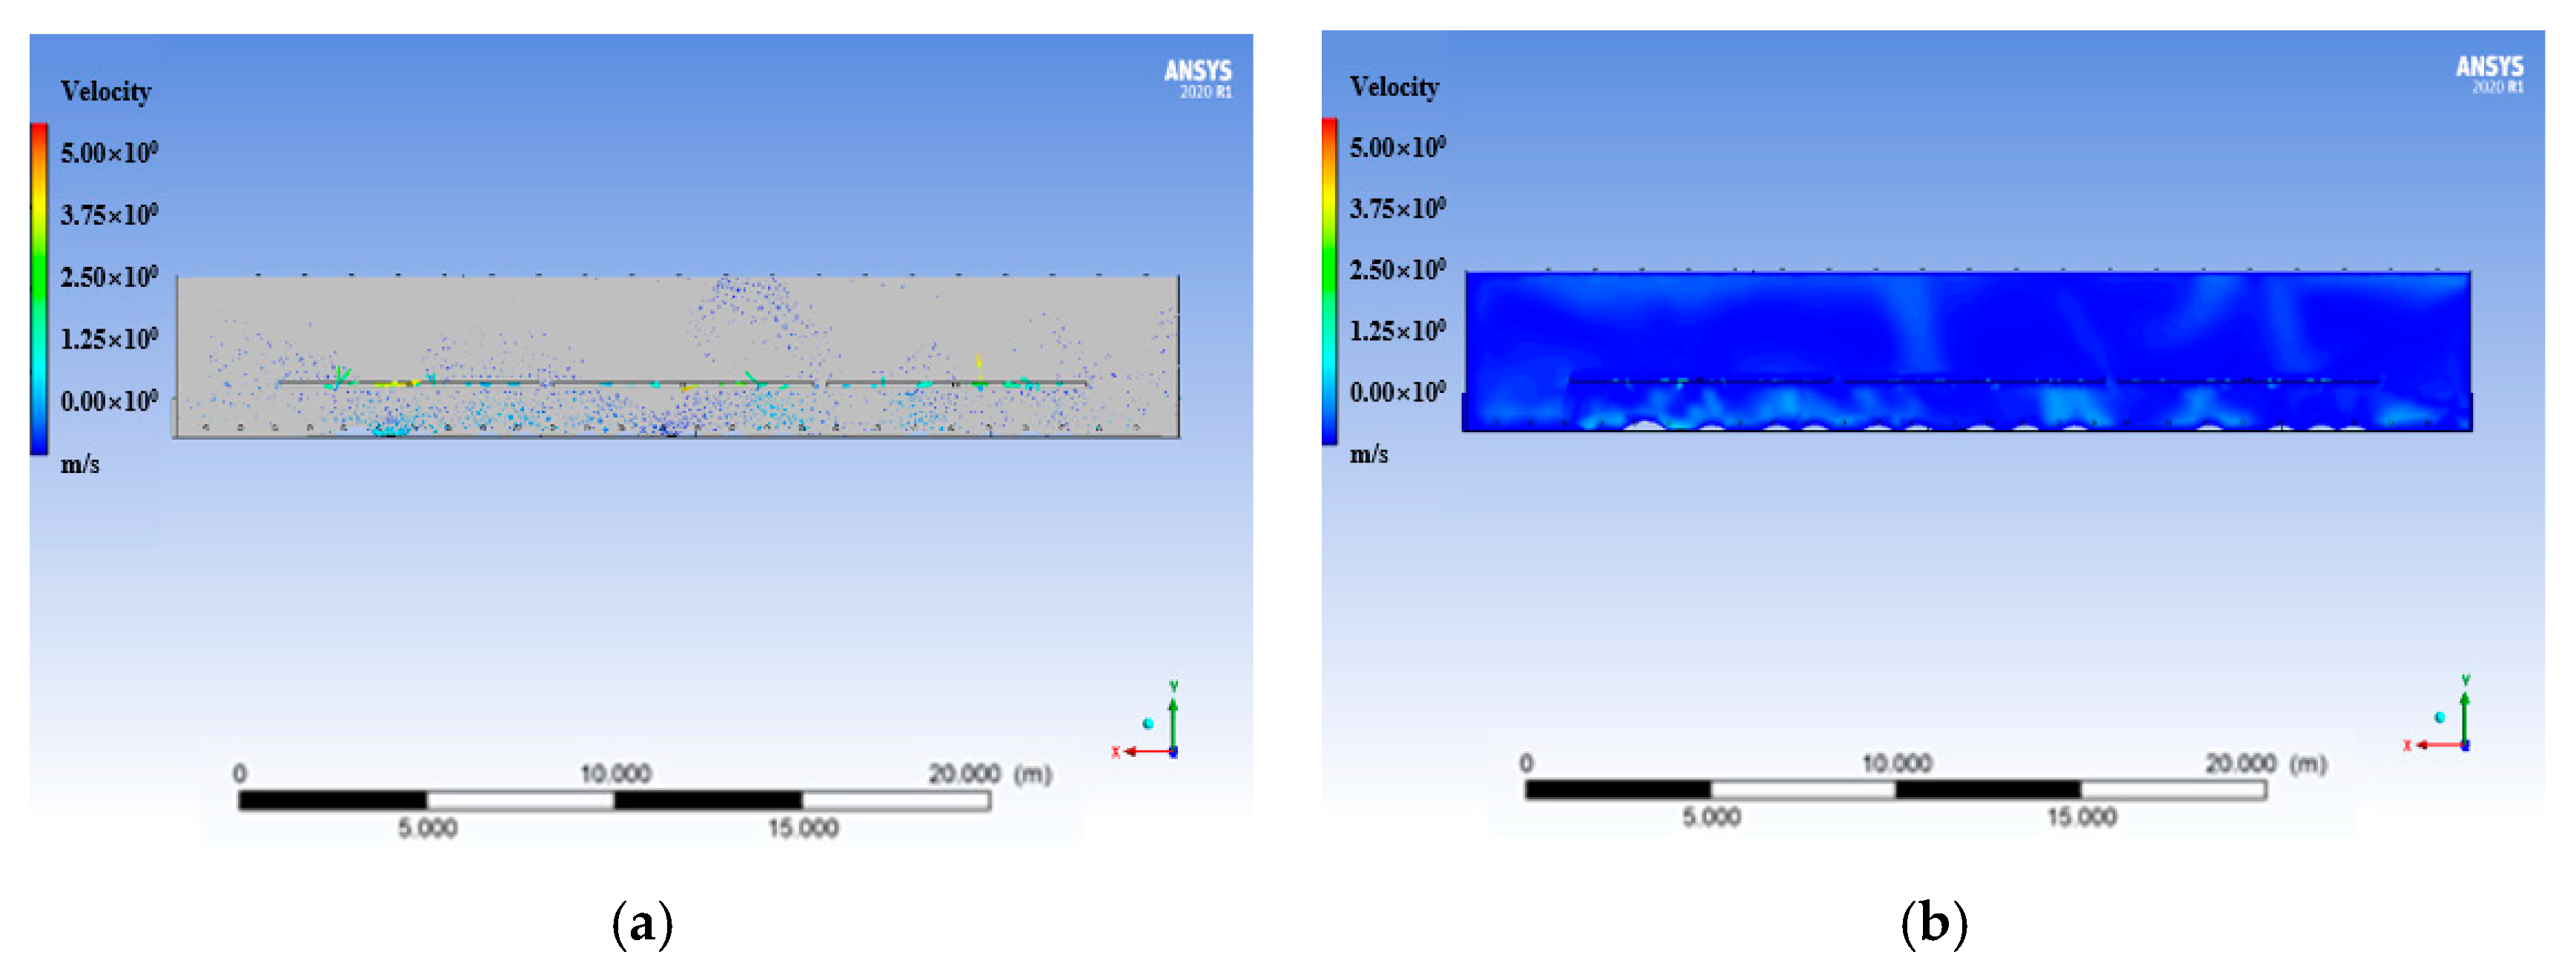
3.2.2. Comparison of Dust Capture in Scenario 1 and Scenario 2

To investigate the dust emission rates from the various dust outlets in the coal shed, dust was recorded and counted from the seven common dust outlets under the different ventilation conditions of Scenario 1 and Scenario 2, and the overall statistics are shown in Figure 9.
In Scenario 2, Areas 1–5 dust collection was, respectively, 4.9%, 11.1%, 67.1, 71.2%, and 53.6%. The dust collection rate was higher than Scenario 1. As shown in Figure 9, for ventilation under Scenario 1, the distance of the dust-producing point from the eastern inlet increases, the number of dust particles captured at the eastern inlet decreases, the number of dust particles captured by the upper fan increases, and the total number of dust particles captured at the upper fan and eastern inlet decreases. The eastern coal inlet is in a downwind position and is the main outlet for the site, so the wind carries the dust out of the coal bin. In addition to the dust collected by the eastern inlet and the upper vent, a large amount of dust is collected by the fans in this area and also the adjacent area. Under Scenario 2, the dust collected by the eastern inlet tends to decrease in Areas 1–4 and increases in Area 5, while the dust collected by the upper vent tends to increase in Areas 1–4 and decrease in Area 5. In Scenario 2, the dust collection in Areas 1–5 was 4.9%, 11.10%, 67.1%, 71.2%, and 53.6% more than in Areas 1–5 in Scenario 1. From Figure 9, the dust particle collection rate under the conditions of Scenario 2 is higher than that under Scenario 1 in all areas. The average collection rate of Scenario 2 increases by 41.6% compared to the whole area of Scenario 1, which proves that changing the wind direction can improve the dust collection rate.

3.2.3. Full Condition Numerical Simulation Analysis for Scenario 1 and Scenario 2 States

The wind velocity vector and the wind velocity cloud diagram from the numerical simulation were analyzed to investigate the variation of the wind-flow field within the whole coal shed. From the velocity vector diagram of Scenario 1 in Figure 10, it can be seen that the wind velocity inside the coal shed does not vary significantly and the wind flow starts to flow outward from the inside of the coal shed after the fans are installed, and the middle part of the coal shed is less affected due to the limited capacity of the fans blower and the large space of the coal shed. When the fan blows the dust to the outside, negative pressure is created in the coal shed, and the outside wind flows into the coal shed from both sides and the main door. The vector diagram of Scenario 2 shows that the wind flow moves from the north side to the south side due to the action of the fan. When the wind flow from the fan hits the coal pile, it continues its movement from the north side to the south side and bypasses the coal pile. At the same time, it can be seen that the wind speed in the coal pile is greater at the bottom than in the middle. The wind flow from the north side of the fan loses speed due to the coal pile, but its influence widens due to the action of the coal pile and spreads in all directions. When the wind stream hits the coal pile, it tends to move upward and forms a negative pressure region behind the pile where the wind stream moves southward, and the dust is accelerated southward by the suction of the fan on the south side and ejected from the fan. Although the overturned coal pile generates a large amount of dust, the increased wind speed in this area will quickly blow away the high dust concentration to achieve efficient dust reduction. The top is a pressure outlet, and the wind flow tends to move upward.
As can be seen from the diagram of the wind velocity cloud of the coal shed in three directions in Figure 11, the wind velocity inside the coal shed is greater at the bottom than in the middle, and the pumping of the wind by the fans on both sides only affects the change of the wind-flow field near the fans, while the middle and upper parts of the coal shed are not greatly affected by the fans. As seen in the diagram of the velocity cloud of Scenario 1 with the fan on, results show that only the airflow near the fan at the bottom of the coal shed is affected by the fan, while the other areas are not affected by the fan. As the air is pumped out from both sides, a negative pressure is created inside the coal shed, and the outside air is supplemented through the three gates and air inlets. Scenario 2: when the fan is on, the air from the north side of the coal shed is blown inward, and the air from the south side of the coal shed is exhausted to form a mutual auxiliary function, which affects the change of airflow at the height of the breathing areas of the whole coal shed, resulting in a greater change of airflow at the height of the breathing areas in the coal shed. The effect of dust removal in the coal shed is not satisfactory in Scenario 1, but in Scenario 2, the effect is better than Scenario 1. The wind flow generated by the fan inside the shed is larger than the wind flow generated by the exhaust air, so blowing air into the shed can increase the speed of dust transport in the shed and the wind flow will carry the dust away from the south side to achieve rapid dust reduction.

3.3. Region 2 Dust Mass Concentration Distribution Pattern

The spatial distribution of the mass concentration of dust particles distributed by Scenario 1 and Scenario 2 is shown in Figure 12. When the fan is turned on for Scenario 2, it can be seen from Figure 13 that this ventilation method is effective in containing the disordered dust transport and the dust in the coal shed follows the wind direction due to the effect of the blower, and the dust collection time is greatly reduced by the presence of the fan.
PM2.5 is the most harmful dust for humans. Therefore, the simulation results of the spatial distribution of the PM2.5 particle size in the coal shed under two different working conditions were statistically calculated, and the coal shed was divided into four different height intervals according to the vertical height: 0 ≤ Y < 2, 2 ≤ Y < 5, 5 ≤ Y < 10, and 10 ≤ Y ≤ 35. The simulation results data were statistically calculated as shown in Figure 14. In Scenario 1, the PM2.5 quantity from the breathing height of ground personnel 0–2 m accounted for 9.9% of the total quantity in the coal shed, the PM2.5 quantity from the height of drivers 2–5 m accounted for 14.7% of the total quantity, the PM2.5 quantity from the height of belt maintenance personnel 2–10 m accounted for 26.7% of the total quantity, and the PM2.5 quantity from the height of non-employees accounted for 48.7% of the total quantity. In Scenario 2, the PM2.5 amount from 0–2 m breathing height of the ground personnel in the coal shed accounted for 5% of the total amount in the coal shed, 10.5% of the PM2.5 amount from 2–5 m height of the driver, 16.8% of the PM2.5 amount from 2–10 m height of the belt maintenance personnel, and 67.7% of the PM2.5 amount from the working height of the non-employees. From the simulation results, when the ventilation method of Scenario 2 is applied, the PM2.5 dust concentration at the height area where the personnel work is reduced by 38.4% on average compared to Scenario 1, and the PM2.5 concentration at the height of the non-employee working area increases by 39.0% on average, indicating that the dust is transported from the height of the worker working area to the height of the non-working area.

3.4. Simulation of Dust Transport Patterns in Scenario 3

The dust in the coal shed was mainly influenced by the wind speed, and the dust will spread with the wind flow. The vector diagram of wind speed in Figure 15 shows that due to the resistance in the ventilation duct, the general tendency is that the further the exhaust port is from the wind speed, the lower the wind speed. The further the exhaust port is from the fan, the more the airflow rate of the exhaust port can be adjusted by the airflow control valve, while the exhaust port that is too far from the fan can also reduce the cross-sectional area of the duct to increase the wind speed and ensure that each exhaust port has the same suction force. Because the ends of the duct are sealed, the inside of the duct is not affected by other airflows and the internal airflow field is only affected by the suction of the fan. The fan is axisymmetric, and the distribution of the internal airflow field is also axisymmetric, so the overall effect can be reproduced by analysing one side.
After learning the effect of the ducts, the ducts were placed inside the coal shed for simulation. The XZ surface simulation results of the coal shed after the ducts were added are shown in Figure 16.
The results of the XY simulation in the coal shed after the duct was installed are shown in Figure 17. The XY section shows that the duct not only acts on the belt, but also draws in the air from the upper part of the belt, which promotes airflow and has a good effect on ventilation and dust reduction. In addition, the air flowing through the coal pile moves south along the pile, making it easier for the dust to escape.
The results of the simulation of the YZ surface in the coal shed are shown in Figure 18. From the YZ surface, it can be seen that the wind-flow field inside the coal shed is more active and the dust accumulation, which was originally located near the belt, is reduced, and the air movement from the north to the south side is enhanced, which also accelerates the dust movement and promotes dust collection and removal. At the same time, the duct is located in the middle of the coal shed at the limit of the influence of the fans on both sides, which plays a good role in the sequence. At the same time, the duct draws the air from the north central side to create negative pressure, and the air from the north side is then replenished, but it is not completely sucked by the duct, and part of it continues to move to the south side, so that the fan on the south side is also more powerful to the outside, and the dust reduction effect is increased.

3.5. Field Test Results

Coal Shed Site Conditions with Different Fan on

The original state of the coal shed and the three different ventilation dust reduction solutions were constructed on-site, and the effect of to the site is compared to Figure 19. By taking a real photo of the dust distribution inside the coal shed under four states of fan work for 4 h, it can be clearly seen that when the coal shed did not adopt any ventilation method to reduce dust, the dust concentration in the whole area of the coal shed was very high, which seriously affected workers’ health and work safety. When Scenario 1 is used, the dust concentration in the whole area of the coal shed is slightly improved, but the improvement is not obvious. The use of Scenario 3 resulted in a significant reduction in dust concentrations throughout the coal shed, which greatly improved the working environment for workers and increased safety in the coal shed. The tests were carried out on the same day and the temperature and wind speed tended to be stable on that day, so it can be assumed that the environment on that day did not affect the dust dispersion, therefore the main influencing factor on the dust concentration in the coal shed was the different ventilation schemes. The lower part of Figure 19 shows the dust concentration in the original state of the site. The dust concentration in the three different fans on states were monitored using sensors for 40 days and the sensors recorded the data every hour. This paper collects the dust concentration data in the four states into a 40-day average daily dust concentration graph. As can be seen from Figure 19, when the coal shed is in its original state, the average dust concentration in the coal shed for the whole day is 3.6 mg/m3. When Scenario 1 is adopted, the average dust concentration in the coal shed is 3.2 mg/m3, which is 9.9% more efficient than the original state. When Scenario 2 is adopted, the average dust concentration in the coal shed is 2.7 mg/m3, which is 23.7% more efficient than the original state and 15.6% more efficient than Scenario 1. The average dust concentration in the coal shed when Scenario 3 is adopted is 1.4 mg/m3, which is 59.9% more efficient than the original state, 55.6% more efficient than Scenario 1, and 48.0% more efficient than Scenario 2.

4. Conclusions

The high concentration of dust in the coal sheds of opencast coal mines is a serious health hazard, pollutes the environment, increases equipment failure rates, and limits the green development of opencast mines. Therefore, the aim of this paper was to study the dust in the coal shed of the Baorixile opencast coal mine, to investigate the dust transport and dispersion law and dust mitigation scheme in the coal shed, and to develop a ventilation strategy for the coal shed based on the results of the study:
(a)
The test of dust particle size distribution shows that dust in a coal shed with a particle size of 10–100 μm accounts for 12.2% of total dust, dust particles whose size is less than 10 μm account for 87.8% of total dust, and dust particles whose size is less than 2.5 μm account for 72.9% of total dust. Dust particles smaller than 10 μm stay in the air longer, and dust in this particle size range is most harmful to humans. Therefore, the treatment of fine dust suspended in the air in the coal shed is of utmost importance.
(b)
When Scenario 2 is adopted, the PM2.5 dust in the height range (0–10 μm) where personnel work in the coal shed is reduced by an average of 38.4% compared to Scenario 1, while the PM2.5 concentration in the height of the non-personnel work range (10–35 μm) is increased by an average of 39.0%, so it can be considered that the PM2.5 dust which is most harmful to personnel is transported from the height of the worker work range to the height of the non-worker work range, the fine particulate dust was effectively managed.
(c)
Through the collection of dust concentration data under the four scenarios on-site, it was determined that when Scenario 1 was adopted, the dust reduction efficiency was increased by 9.9% compared to the original state. When Scenario 2 was adopted, the dust reduction efficiency was increased by 23.7% compared to the original state, and 15.6% compared to Scenario 1. When Scenario 3 was adopted, the dust reduction efficiency was increased by 59.9% compared to the original state, 55.6% compared to Scenario 1, and 48.0% compared to Scenario 2.

Author Contributions

Conceptualization, Z.A.; methodology, W.Z. and Z.W.; validation, Z.A. and Y.Q.; formal analysis, Z.W.; investigation, W.Z.; resources, A.W.; data curation, Z.Y.; writing—original draft preparation, Z.A. and L.Z.; writing—review and editing, Z.L. and S.N.; visualization, Y.Q. All authors have read and agreed to the published version of the manuscript.

Funding

This research were supported by the Postgraduate Research & Practice Innovation Program of Jiangsu Province (KYCX23_2769), the Graduate Innovation Program of China University of Mining and Technology (2023WLKXJ010) and the Fundamental Research Funds for the Central Universities (2023XSCX007).

Institutional Review Board Statement

Informed consent was obtained from all subjects involved in the study.

Informed Consent Statement

Informed consent was obtained from all subjects involved in the study.

Data Availability Statement

Not applicable.

Acknowledgments

The authors thank the Baurichil Open-pit Coal Mine for providing a research base for this paper.

Conflicts of Interest

The authors declare no conflict of interest.

References

  1. Tian, Y.; Jiskani, I.M.; Lu, X.A.; Zhou, W.; Liu, F.M.; Zhang, C.W.; Cai, Q.X. Control mechanism of end-slope deformation in open pit mine based on discrete-continuous coupling method. Comput. Part. Mech. 2022, 13, 951–963. [Google Scholar] [CrossRef]
  2. Wang, Z.M.; Zhou, W.; Jiskani, I.M.; Ding, X.H.; Luo, H.T. Dust pollution in cold region Surface Mines and its prevention and control. Environ. Pollut. 2022, 292, 118293. [Google Scholar] [CrossRef] [PubMed]
  3. Wang, Z.M.; Zhou, W.; Jiskani, I.M.; Luo, H.T.; Ao, Z.C.; Mvula, E.M. Annual dust pollution characteristics and its prevention and control for environmental protection in surface mines. Sci. Total Environ. 2022, 825, 153949. [Google Scholar] [CrossRef] [PubMed]
  4. Luan, B.Y.; Zhou, W.; Jiskani, I.M.; Wang, Z.M. An Improved Machine Learning Approach for Optimizing Dust Concentration Estimation in Open-Pit Mines. Int. J. Environ. Res. Public Health 2023, 20, 1353. [Google Scholar] [CrossRef] [PubMed]
  5. Shen, Z.Y.; Ao, Z.C.; Wang, Z.M.; Yang, Y.Q. Study on Crust-Shaped Dust Suppressant in Non-Disturbance Area of Open-Pit Coal Mine-A Case Study. Int. J. Environ. Res. Public Health 2023, 20, 934. [Google Scholar] [CrossRef]
  6. Wang, H.T.; Wang, X.S.; Xia, S.F.; Li, L. Experimental Study and Numerical Simulation on Dust Concentration Distribution of Chute at Enclosed Stockyard of Steel Works. Minerals 2022, 12, 1164. [Google Scholar] [CrossRef]
  7. Jia, L.; Wang, D.X.; Yu, C.W.; Liang, B. Research of Dust Transport Rule of Large Difference Chute Based on FLUENT. In Proceedings of the 2018 International Conference on Energy Development and Environmental Protection (EDEP 2018), Nanjing, China, 17–19 August 2018; pp. 208–215. [Google Scholar]
  8. Chen, X.L.; Wheeler, C.A.; Donohue, T.J.; McLean, R.; Roberts, A.W. Evaluation of dust emissions from conveyor transfer chutes using experimental and CFD simulation. Int. J. Miner. Process. 2012, 110, 101–108. [Google Scholar] [CrossRef]
  9. Huang, C.H.; Lin, P.Y. Influence of spatial layout on airflow field and particle distribution on the workspace of a factory. Build. Environ. 2014, 71, 212–222. [Google Scholar] [CrossRef]
  10. Xiu, Z.H.; Nie, W.; Cai, P.; Chen, D.W.; Zhang, X. Partially enclosed air curtain dust control technology to prevent pollution in a fully mechanized mining face. J. Environ. Chem. Eng. 2022, 10, 108326. [Google Scholar] [CrossRef]
  11. Ikeguchi, A. Distribution properties of dust concentration in an enclosed model layer house. Trans. Asae 2000, 43, 399–404. [Google Scholar] [CrossRef]
  12. Novak, L.; Bizjan, B.; Praznikar, J.; Horvat, B.; Orbanic, A.; Sirok, B. Numerical Modeling of Dust Lifting from a Complex-Geometry Industrial Stockpile. Stroj. Vestn.-J. Mech. Eng. 2015, 61, 621–631. [Google Scholar] [CrossRef] [Green Version]
  13. Ma, W.W.; Du, W.Q.; Guo, J.X.; Wu, S.Y.; Li, L.Q.; Zeng, Z. Dust Dispersion Characteristics of Open Stockpiles and the Scale of Dust Suppression Shed. Appl. Sci. 2022, 12, 11568. [Google Scholar] [CrossRef]
  14. Zou, S.H.; Zhang, D.C.; Yin, W.; Zou, S. Study of dust production mechanisms during the rotary dumping of powdered materials in hemi-enclosed space. Appl. Mech. Mater. 2013, 295, 1624–1630. [Google Scholar] [CrossRef]
  15. Su, N.; Peng, S.T.; Hong, N.N.; Zhang, J.L. Experimental and numerical evaluation of wind-driven natural ventilation and dust suppression effects of coal sheds with porous gables. Build. Environ. 2020, 177, 10. [Google Scholar] [CrossRef]
  16. Su, N.; Peng, S.T.; Ye, Y.; Hong, N.N. Wind Environment and Loading Mitigation Effects on Coastal Enclosed Coal Yards with Porous Gables. IOP Conf. Ser. Earth Environ. Sci. 2021, 621, 012094. [Google Scholar] [CrossRef]
  17. Cho, M.L.; Ha, J.S.; Kim, T.K. Behavior Characteristics of Hazardous Gas and Scattering Coal Dust in Coal Storage Sheds. Appl. Sci. 2021, 11, 11771. [Google Scholar] [CrossRef]
  18. Zhao, Y.M.; Ambrose, R.P.K. Modeling dust dispersion and suspension pattern under turbulence. J. Loss Prev. Process Ind. 2019, 62, 103934. [Google Scholar] [CrossRef]
  19. Kim, T.K.; Cho, M.-L.; Bae, Y.-W.; Kim, J.-W. Flow Analysis indoor Coal Storage Shed due to Wind Velocity and Wind Direction of Ambient Air. J. Korea Acad.-Ind. Coop. Soc. 2020, 21, 538–545. [Google Scholar] [CrossRef]
  20. Zhao, Y.M.; Ambrose, R.P.K. Predicting continuous dispersion and deposition of explosive dust in confined spaces using a discrete phase model. Powder Technol. 2022, 408, 117704. [Google Scholar] [CrossRef]
  21. Cheng, L.; Feng, H.B.; Gu, Z.Y.; Yan, D.C.; Guo, H.B.; Xu, Q. Analysis and calculation of enclosed coal yard ventilation by using roof vortex flow natural ventilation. IOP Conf. Ser. Earth Environ. Sci. 2019, 295, 042068. [Google Scholar] [CrossRef]
  22. Jeong, C.H.; Lee, J.W.; Shin, D.W.; Kim, M.; Lee, S.H. Numerical Investigation on Influence of Windbreak Wall Height on Dust Scattering Characteristics. J. ILASS-Korea 2014, 19, 136–141. [Google Scholar] [CrossRef]
  23. Su, N.; Peng, S.T.; Hong, N.N.; Hu, T. Wind tunnel investigation on the wind load of large-span coal sheds with porous gables: Influence of gable ventilation. J. Wind Eng. Ind. Aerodyn. 2020, 204, 104242. [Google Scholar] [CrossRef]
  24. Jing, D.J.; Jia, X.; Ge, S.C.; Zhang, T.; Ma, M.X. Numerical simulation and experimental study of vortex blowing suction dust control in a coal yard with multiple dust production points. Powder Technol. 2021, 388, 554–565. [Google Scholar] [CrossRef]
  25. Wang, K.P.; Ji, W.D.; Zhang, F.F.; Yu, W.; Zheng, R.Q. Dustfall design of open coal yard in the power plant-a case study on the closed reconstruction project of coal storage yard in shengli power plant. IOP Conf. Ser. Earth Environ. Sci. 2018, 121, 032037. [Google Scholar] [CrossRef] [Green Version]
  26. Qiu, Y.; Yu, R.; San, B.B.; Li, J.H. Aerodynamic shape optimization of large-span coal sheds for wind-induced effect mitigation using surrogate models. Eng. Struct. 2022, 253, 113818. [Google Scholar] [CrossRef]
Figure 1. Coal shed model.
Sustainability 15 11651 g001
Figure 2. Diagram of the coal shed dust-monitoring point layout. (a) Top view of monitoring site layout. (b) Left view of monitoring point layout.
Sustainability 15 11651 g002
Figure 3. Scenario 1 3D view of the coal shed space.
Sustainability 15 11651 g003
Figure 4. Scenario 2 Coal shed 3D view.
Sustainability 15 11651 g004
Figure 5. Scenario 3 Air duct layout diagram.
Sustainability 15 11651 g005
Figure 6. Main dust sources in the coal shed.
Sustainability 15 11651 g006
Figure 7. Airborne dust particle size share diagram.
Sustainability 15 11651 g007
Figure 8. Scenario 1 and Scenario 2 dust dispersion trajectories.
Sustainability 15 11651 g008
Figure 9. Number of dust particles captured at each dust outlet for Scenario 1 and Scenario 2.
Sustainability 15 11651 g009
Figure 10. Scenario 1 and Scenario 2 coal shed speed vector diagram.
Sustainability 15 11651 g010
Figure 11. Scenario 1 and Scenario 2 coal shed wind-flow field clouds.
Sustainability 15 11651 g011
Figure 12. Scenario 1 dust mass concentration distribution diagram.
Sustainability 15 11651 g012
Figure 13. Scenario 2 dust mass concentration distribution diagram.
Sustainability 15 11651 g013
Figure 14. Percentage of total PM2.5.
Sustainability 15 11651 g014
Figure 15. Vector diagram of the wind speed inside the duct.
Sustainability 15 11651 g015
Figure 16. Simulation of wind speed in XZ section of coal shed with additional ducts. (a) Adding a ducted coal shed XZ cross-sectional wind speed vector diagram. (b) Adding a ducted coal shed XZ cross-sectional wind speed cloud chart.
Sustainability 15 11651 g016
Figure 17. Simulation of XY section wind speed in coal shed with additional ducts. (a) Adding a ducted coal shed XY cross-sectional wind speed vector diagram. (b) Adding a ducted coal shed XY cross-sectional wind speed cloud diagram.
Sustainability 15 11651 g017
Figure 18. Simulation of wind speed at section YZ in coal shed with additional ducts. (a) Addition of ducted coal shed YZ section air velocity. (b) Addition of ducted coal shed YZ section air velocity.
Sustainability 15 11651 g018
Figure 19. Variation in the 40-day average daily dust concentration in the coal shed under four working conditions.
Sustainability 15 11651 g019
Table 1. JCF-6H direct reading dust detector product parameters.
NameModelFunctional Parameters
Direct reading dust detectorJCF-6HDust measurement class: PM10, PM2.5, TSP;
Respirable dust measurement range: 0.001–10 mg/m3; Large range in TSP mode: 100 mg/m3;
Detection sensitivity: 0.001 mg/m3;
Repeatability error: ≤±2%;
Measuring particle size class: (0.3, 0.5, 0.7, 1.0, 2.5, 5.0) μm;
Measuring particle concentration range: 1–999,999 μm;
Air sampling flow rate: 2.0 L/min (0.1 ft 3/min);
Sampling time: 1 min, 2 min, 30 min, manual arbitrary time;
Table 2. BT35-11-5# Axial fan parameters.
NameParameter
ModelBT35-11-5#
TypeAxial fans
Voltage220 V, 380 V
Frequency50 Hz
Rotate speed1450 (r/mim)
Air volume9133 m3/h
Wind pressure185 pa
Power0.75 kw
Table 3. Product parameters of GCG1000 (A) type dust concentration sensor.
NameParameters
Explosion-proof type:Intrinsically safe for mining ExibI Mb;
Measurement Range:(0~1000) mg/m3;
Operating Voltage:DC (9~24.5) V;
Output Signal:RS485;
Rated current:≤110 mA @DC18V;
Equipment protection level:IP54;
External dimensions (l × b × h) mm:21× 144 × 77
Table 4. Table for setting model parameters and boundary conditions.
ModelDefine
TimeTransient
GravityY = −9.81 m/s2
Viscous Modelk-epsilon realizable
EnergyOff
Discrete Phase ModelON
Boundary ConditionsDefine
Inlet Boundary TypeVelocity-inlet
Inlet Velocity Magnitude5 m/s
Turbulence Intensity3.4%
Outlet Boundary TypeOutflow
Wall Shear ConditionNo Slip
Wall RoughnessStandard
Disclaimer/Publisher’s Note: The statements, opinions and data contained in all publications are solely those of the individual author(s) and contributor(s) and not of MDPI and/or the editor(s). MDPI and/or the editor(s) disclaim responsibility for any injury to people or property resulting from any ideas, methods, instructions or products referred to in the content.

