Article

Research on the Physical and Chemical Characteristics of Dust in Open Pit Coal Mine Crushing Stations and Closed Dust Reduction Methods

1
School of Mines, China University of Mining and Technology, Xuzhou 221116, China
2
CHNENERGY Investment Group Co., Ltd., Zhunneng Group Co., Ordos 017000, China
3
Xinjiang Institute of Engineering, Support Xinjiang University Western Energy Development Institute, Urumqi 830023, China
*
Authors to whom correspondence should be addressed.
Sustainability 2023, 15(16), 12202; https://doi.org/10.3390/su151612202
Submission received: 12 April 2023 / Revised: 24 May 2023 / Accepted: 19 July 2023 / Published: 9 August 2023
(This article belongs to the Special Issue Advances in Intelligent and Sustainable Mining)

Abstract

:
As an important link in open-pit mining production, the crushing station produces a large amount of dust during the production process. Dust has the characteristics of a wide spread area, great harm, and difficult governance. Therefore, dust control has become a key issue that needs to be solved in open-pit mining. In this article, we assess results after high-speed cameras and dust concentration detectors are installed around the crushing station to monitor the dust concentration in the surrounding air. It is found that in the air, dust with a particle size of less than 2.5 μm accounts for 67.43%, less than 10 μm accounts for 17.30%, and less than 100 μm accounts for 15.27%. In settled dust on the ground, particles with a particle size of less than 100 μm account for 42.69% of the sample, and particles less than 10 μm account for 16.60% of the sample. Secondly, physical and chemical properties testing is conducted on the dust. XRD test results show that SiO2 in the dust accounts for 65.80%; XRF test results show that the oxide Al2O3 in the dust accounts for up to 46.84%; ICP test results show that the element Al accounts for 42.62% of the total amount of trace elements detected; and Si accounts for 35.11%, clarifying the content of harmful substances to the human body. Finally, Fluent software, Ansys 2020 R1, is used to simulate the diffusion law of dust under different states of the crushing station, including an open state, a closed state, and the installation of a dust removal system. Based on the simulation results and the actual situation on site, the optimal dust reduction method suitable for the crushing station is proposed, and the diffusion law of dust under this method is simulated. The tracked dust shows that the dust removal efficiency of PM2.5 reaches 97.00%, PM10 reaches 99.60%, and TSP reaches 98.30%.

1. Introduction

The proportion of total coal production from surface mining in China has increased from 5% (50 million tons) in 2003 to 25% (1.04 billion tons) in 2021. With this increase in production, the problem of dust pollution is becoming increasingly serious, with workers working in heavily dust-polluted workplaces for long periods of time, inhaling large amounts of dust leading to serious pneumoconiosis, and high concentrations of dust can also explode causing injuries and equipment damage. Dust is one of the five hazards of coal production, a serious threat to the lives and safety of operators, and has been an important subject of research in various countries [1,2]. The crushing station at the Halsey opencast coal mine is a necessary part of the mine’s production, and its high dust production and wide impact have become a very important issue for the company [3]. The crushing stations in open-pit coal mines today are mostly open-sided. Most dust management methods use wet spray dust reduction. Spray dust reduction has a suppressive effect on some dust, but the dust reduction efficiency is low. Most of the dust is still diffused into the atmosphere with the induced airflow, polluting the surrounding environment. Most of the open-pit mines in China are located in the north where the summers are semi-arid and the winters are alpine, and water resources are very scarce in the mining areas [4]. However, the use of sprinkler technology wastes valuable water resources and the winter temperatures in the north remain at around −25° for 4–5 months. During this time, spraying and dust reduction techniques are restricted by icing and therefore, no dust reduction measures are used at the crushing stations in winter, which results in higher dust concentrations at the crushing stations at this time than in other seasons.
Many studies have been conducted by domestic and international scholars on the particle size distribution and physicochemical properties of different particulate dusts. Among them, Cvetkovic, Z. [5,6,7] where samples were collected near power plants and opencast coal mines and characterised by XRD tests for concentration, morphology, particle size distribution, and elemental composition. Zhang, R. [8] completed a comprehensive study of the chemical and physical properties of micron/nano coal particles, using XRD tests, which showed that nano coal dust inhaled by coal miners was more significantly toxic. For Li, X.L. [9] XRD analysis of raw coal and solid residues from coal dust explosions showed that various functional groups were consumed to varying degrees during the coal dust explosion. Sarver, E. [10] collected respirable dust samples from underground coal mines and used ICP-MS to test particle size and mineralogical grade distributions in the 100–10,000 nm size range to determine the metal and trace element content of the particles. LaBranche, N. et al. [11,12] collected respirable dust samples from four underground coal mines and found that differences between mines appeared to have a greater effect on the particle size distribution than differences in the mining process within individual mines. Particle size distribution appeared to have a greater effect than differences in the mining process within individual mines. Silvester, S.A. [13,14] carried out a CFD simulation study of dust generated by crushing equipment and the results indicated that the material undergoes parabolic motion during dumping, which generates an updraft, and it was determined that the amount of dust was related to the height difference of the dumped material and the horizontal velocity of the dust.
Numerical simulations and dust reduction measures for dust in enclosed spaces have been studied in depth by domestic and international scholars. Among them, Huang, Z. [15,16,17] carried out a real-time simulation of blasting dust pollution in opencast mines through Fluent software, Ansys 2020 R1, simulation and field tests, and the results showed that a large amount of dust rushed into the atmospheric space under the action of blasting impact kinetic energy. Li, Y.J. [18,19] used Fluent software to simulate the airflow field and dust dispersion at the heaving face. The results show that wall-mounted ventilation can effectively control dust dispersion at the heaving face and reduce the particle mass concentration at the back of the travel lane and tunnel. Tang W.J., et al. [20,21,22] used β-ray particle monitors and laser monitors to study the movement of dust in the pit and the escape rate and exit time through Fluent simulations in the Halwusu opencast coal mine in Inner Mongolia. Lu, G.L. [23,24] used Fluent software to carry out numerical simulations to study the air flow pattern and dust concentration at the working face under different ventilation modes. The results show that in a large inclined angle header mining face, using the descending ventilation method has a more significant dust removal effect compared to using the ascending ventilation method. Zhang, Z.Y. [25] used Fluent software to simulate the diffusion path of dust particles in the mine and concluded that the local airflow field in the alpine zone is controlled by the “cold and hot double island effect” formed by the mine and the glacier. Xiu, Z.H. [26,27] proposed a new type of semi-enclosed air curtain device for dust control and conducted numerical simulations of its dust suppression effect, the results showed that after the dust control air curtain device was opened, a closed dust control air chamber was formed in the driver’s working area of the coal mining machine. Gao, D.H. [28] used orthogonal experimental design optimization for dust removal equipment in confined spaces and found that when the optimal parameters θ = 55 degrees, D = 80 mm and L = 0 mm, the average dust concentration at the exit of the equipment was reduced by 11 5%. Cheng, L. [29,30] analyzed the propagation characteristics of coal dust explosions in a large experimental roadway induced by a gas explosion and showed that the peak overpressure statistics increased and then decreased with increasing distance from the explosion source. Geng, F. [31] investigated the dispersion characteristics of dust contaminants in a typical coal tunnel under an auxiliary ventilation system and showed that the dust suspended in the air was mainly particles < 20 μm. Saurabh, K. et al. [32,33] developed an intelligent dry mist dust removal system that reduced dust concentrations in the work area from the prevailing 0.62–1.73 mg/m3 to 0.10–0.17 mg/m3. Song, F.L. [34] developed an intelligent dry dust extraction plant, driven by compressed air, with a cyclone filter collecting the dust, achieving zero water consumption and zero emissions for the treatment of dry dust. Ge, S.C. [35] found through simulation that dust contamination at the transfer point is mainly formed by the combined effect of traction airflow, induced airflow and shock waves, and concluded that the installation of appropriate dust fans and guide chutes will effectively reduce and eliminate the positive pressure generated by coal fall impact, and also avoid secondary contamination. Wu, D.M. [36,37] designed and applied a dust cover to achieve non-contact dust control in the borehole, resulting in a reduction in dust concentration from 540 mg/m3 to 15 mg/m3 and a dust control efficiency of 97.2%. Ifelola, E.O. [38] designed and built a local ventilation system for dust control in a closed mine environment and the conclusions showed increased cleaning efficiency of the machine at higher fan speeds and lower particle sizes. Li, Y.C. [39] proposed a dust control method using an air curtain to collect dust and an air cylinder to extract dust. The conclusion showed that the air curtain of the jet plant can fully function as a dust collector when the jet outlet air velocity is between 10–20 m/s and the jet outlet width is between 6 and 20 mm.
Previous studies have achieved significant results in the physicochemical properties of coal dust. XRD was commonly used to study the structure and component content of coal dust, but there were few analyses on the qualitative and semi-quantitative chemical elements of coal dust. This article added XRF and ICP-MS tests for the chemical composition analysis of coal dust to gain a deeper understanding of its physicochemical properties, reduce the concentration of dust in crushing stations, and achieve green mining in coal mines. Previous research has achieved more results in dust reduction in enclosed spaces, but there is little research on dust control in crushing stations, especially using Fluent simulation to evaluate the dust reduction effect in closed and open environments. In this study, a three-dimensional geometric model of an open-pit concave discharge port was established, and the dust control plan was determined through data collection and numerical simulation methods. The dust diffusion characteristics under open, semi-closed, and dust removal system conditions were compared, and the location with the highest concentration of dust was analyzed. A fan was installed at that location to control the mass concentration of dust in the crushing station. The Haerwusu open-pit coal mine in China, which has an annual output of over 35 Mt, was selected as a case study. As this mine is located in a typical cold region that accounts for over 90% of China’s open-pit coal production, serious dust pollution occurs during winter mining due to the long period of severe cold, low precipitation, high evaporation rate, and difficulties in spraying water. Therefore, the research findings can be applied to other mines with similar conditions.

2. Materials and Methods

This passage describes a process of monitoring and sampling dust on site, testing the particle size distribution, and the physical and chemical characteristics of the collected dust samples. The particle size distribution, structure, and trace element content of the dust are determined based on the test results. Then, the obtained parameters are input into Fluent for numerical simulation. Based on the field-measured data, a similar model is established, and the gas-solid two-phase flow theory is used to simulate the dust transport and diffusion under three different conditions: open, closed, and with a dust removal system installed. The installation position of the dust removal system is determined, and the dust removal efficiency of the system is verified through simulation.

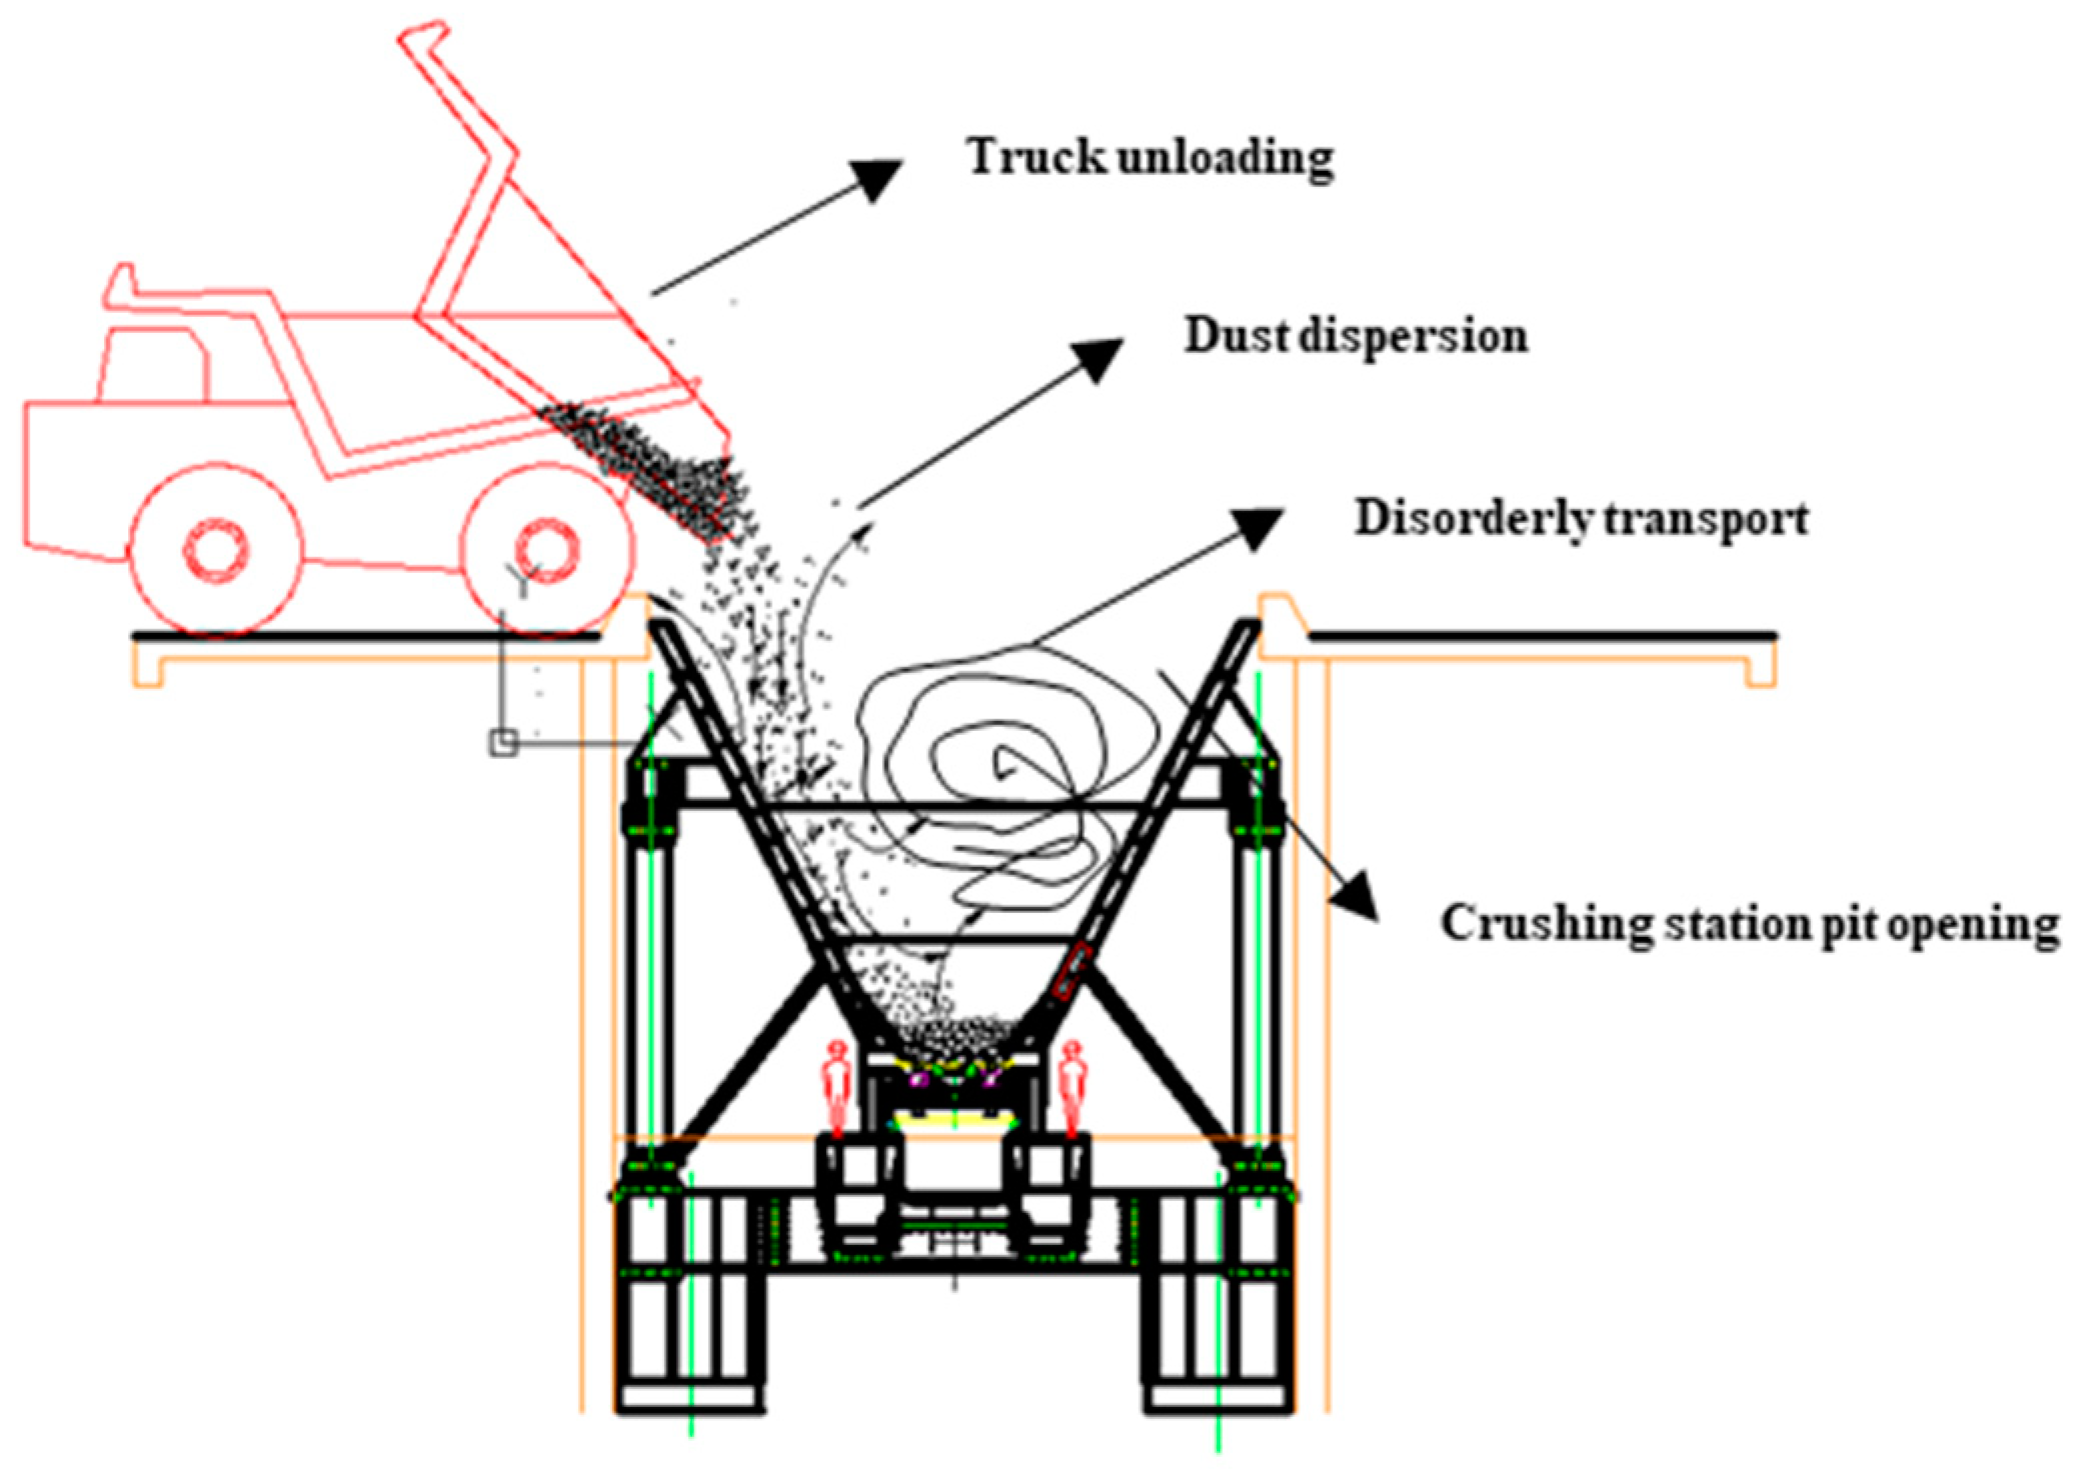
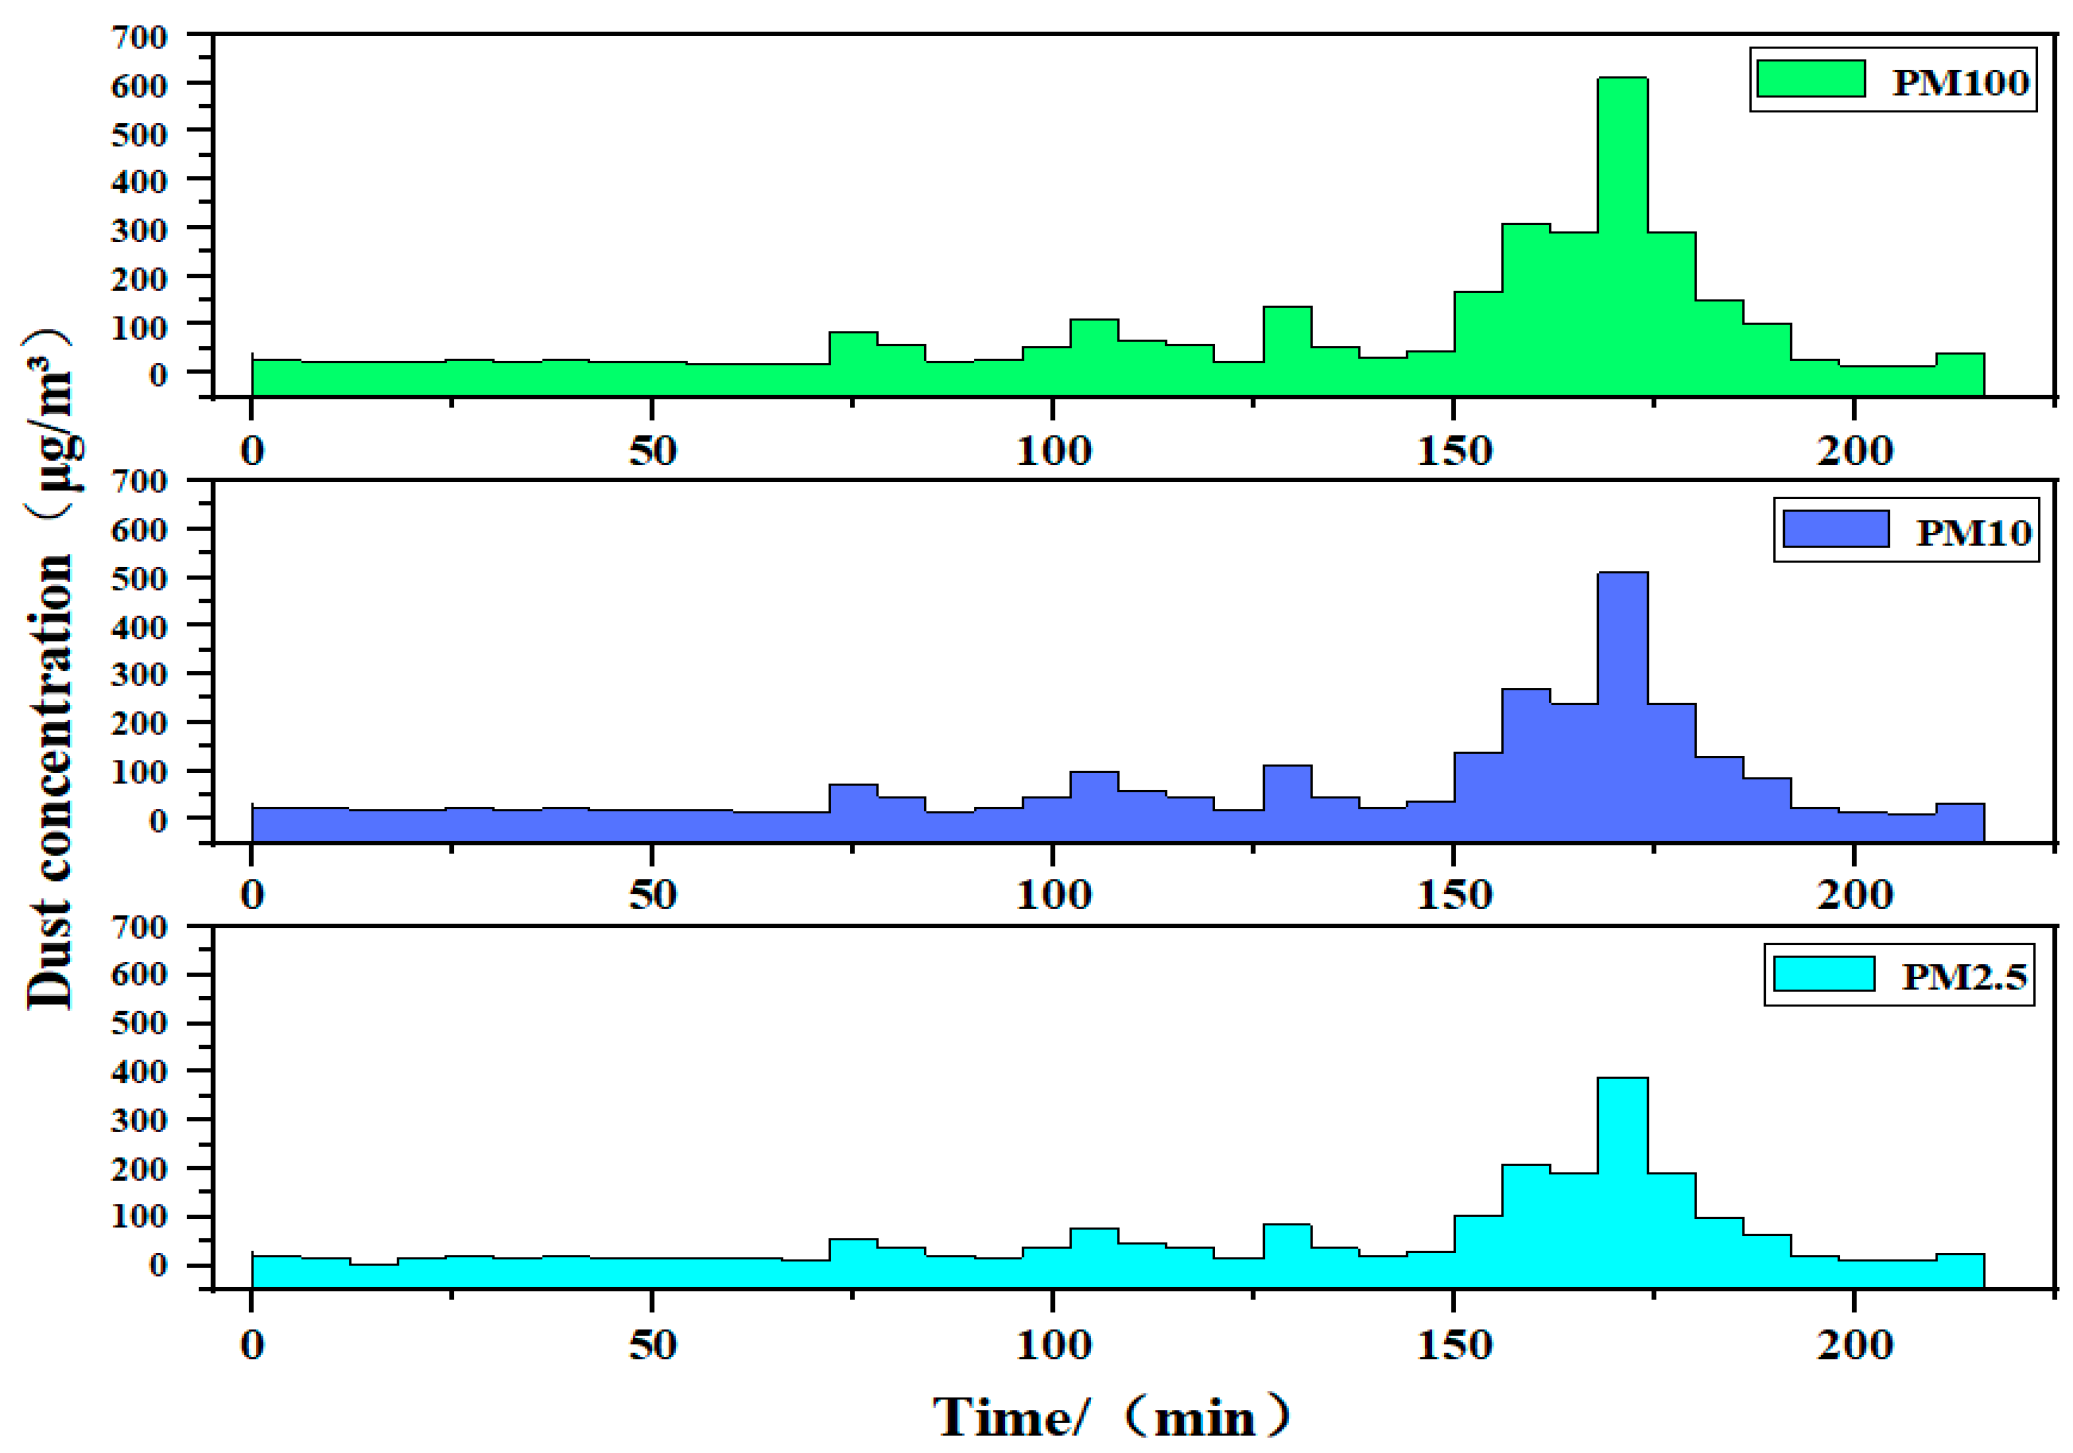
2.1. On-Site Dust Concentration Monitoring

The Ha’erwu Su open-pit mine is located in Ordos City, Inner Mongolia, belonging to the northwest region of China. The average altitude is 1200 m, and the climate is semi-arid. The Ha’erwu Su open-pit mine has an annual output of 3500 wt and is equipped with a CP70-16-M-148 high-speed camera set up at a distance of 200 m from the unloading point of the open-pit crushing station to capture panoramic images of dust diffusion. At the same time, a JCF-6H direct-reading dust detector is placed 2 m away from the unloading point to monitor and record the on-site dust. The locations of the CP70-16-M-148 high-speed camera and JCF-6H direct-reading dust detector are shown in Figure 1. The dust monitoring location is where the staff work for a long time and is the most direct and serious place that causes harm to workers. Therefore, we have identified it as our key monitoring area.
The process of dust emission during the unloading of the crushing station is fast and the movement pattern of the dust is extremely complex. A CP70-16-M-148 high-speed camera manufactured by Optronis TM in Germany is used on site, with a shooting frame rate of 148 fps and a maximum resolution of 4672 × 1708. The dust concentration is monitored using a JCF-6H direct-reading dust detector for data acquisition. This instrument is commonly used to measure the concentration of fine particles in the air in open workspaces, and can simultaneously monitor PM2.5, PM10, and TSP dust concentrations and record the data. The equipment parameters are shown in Table 1.

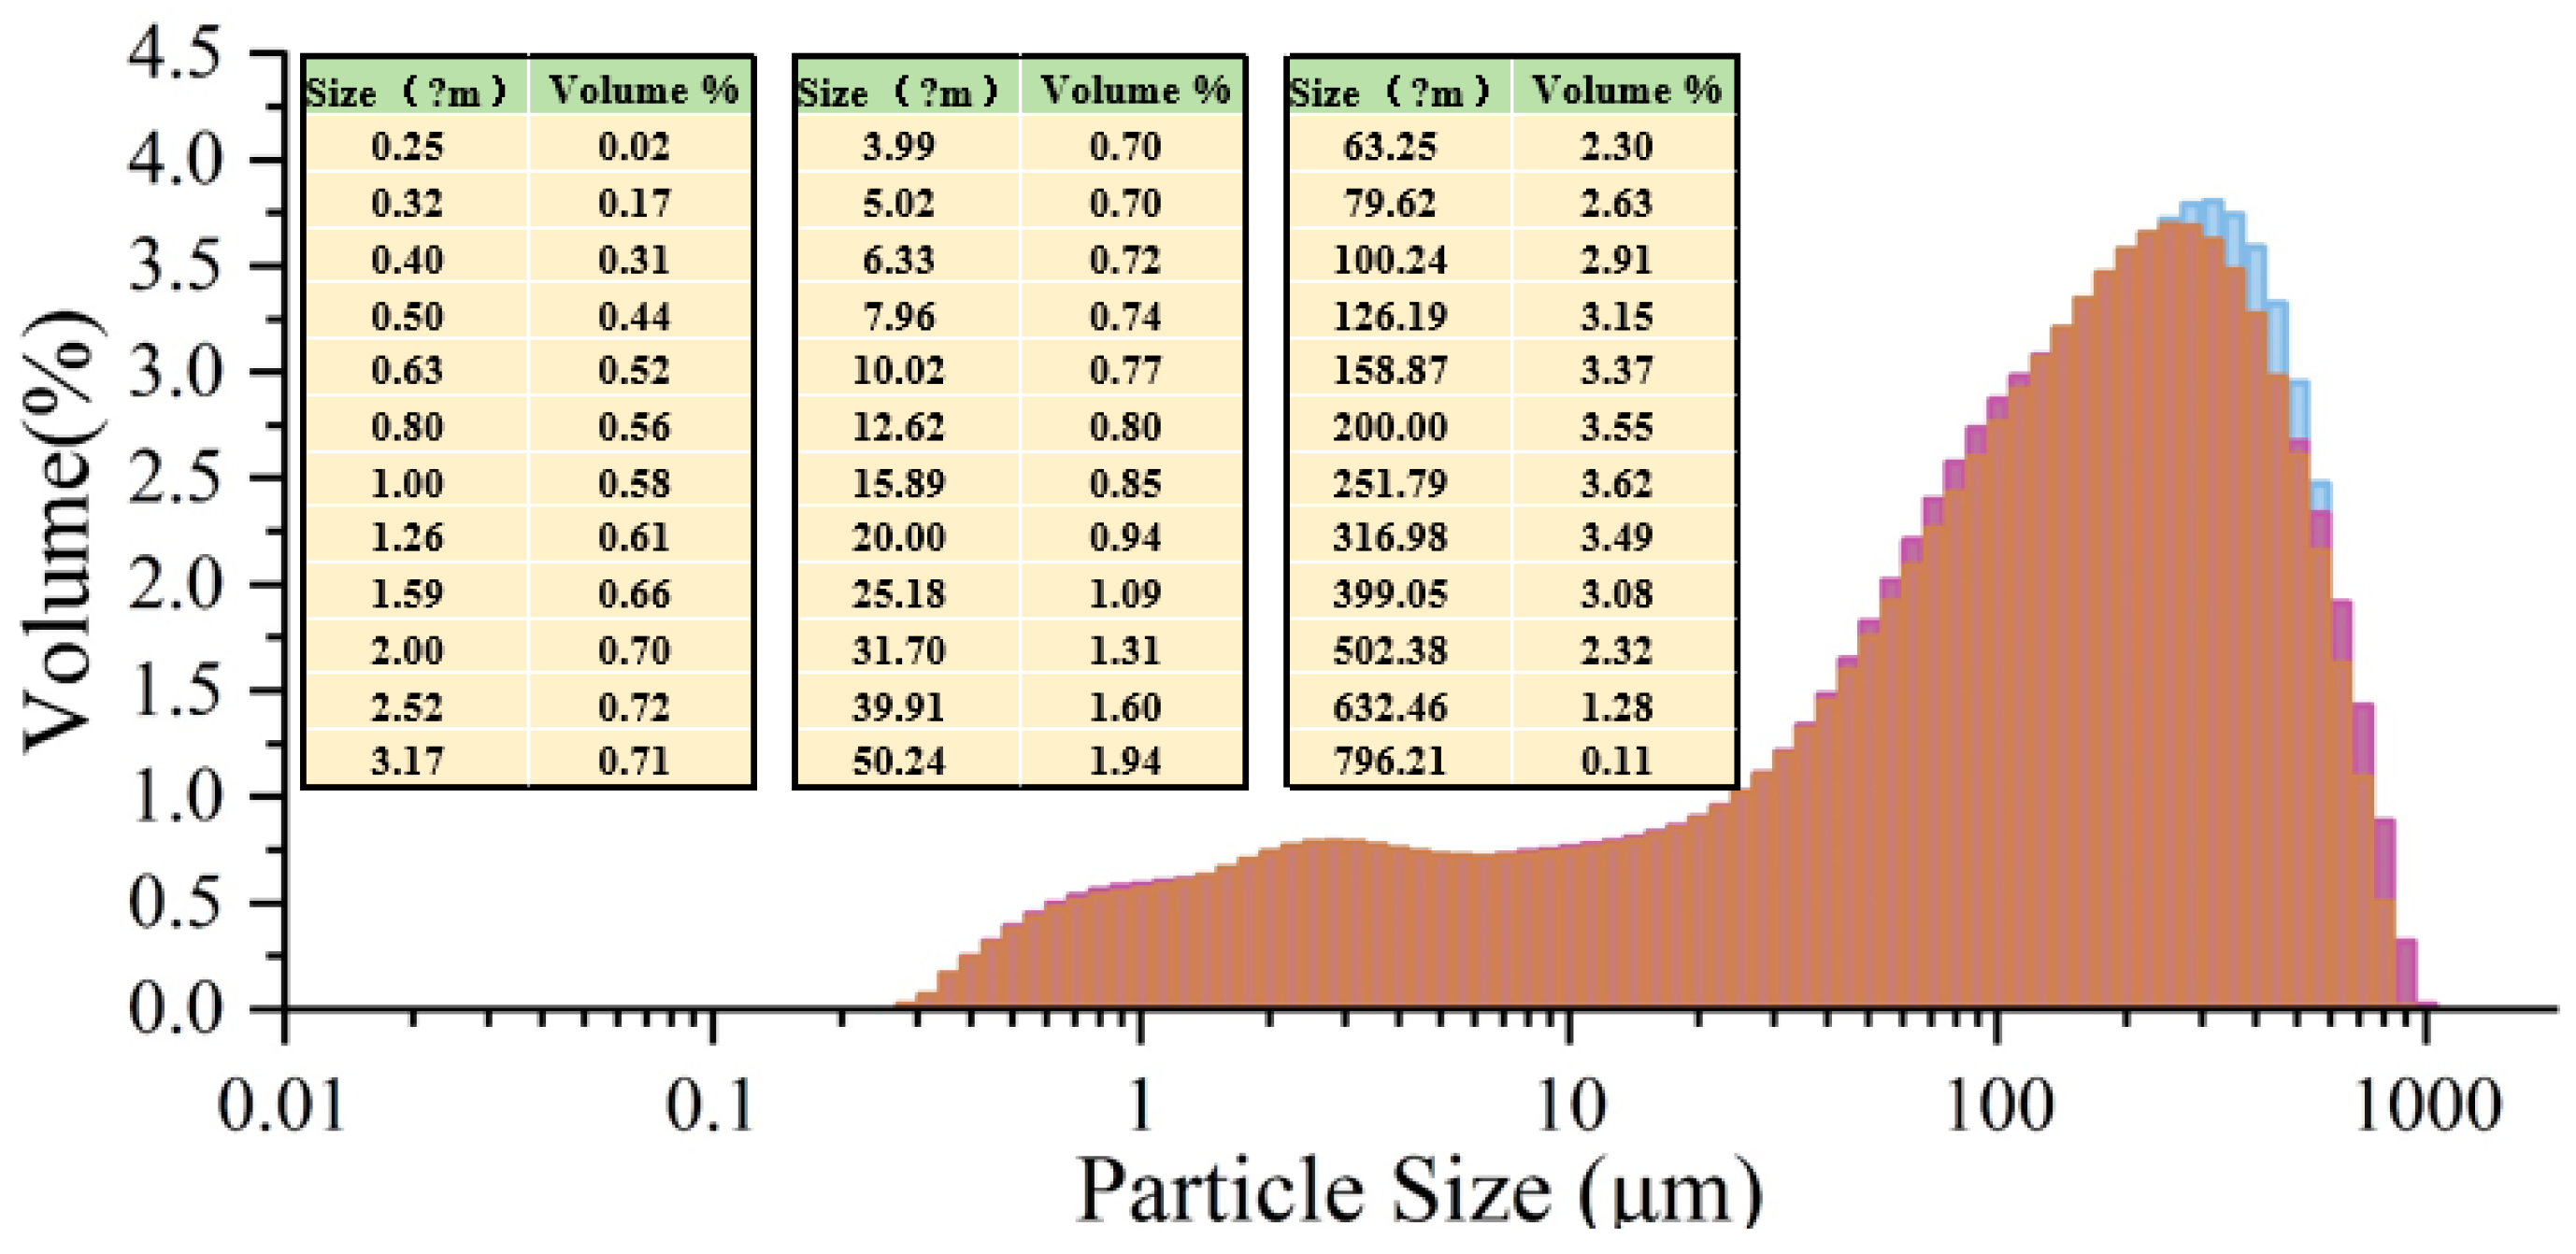
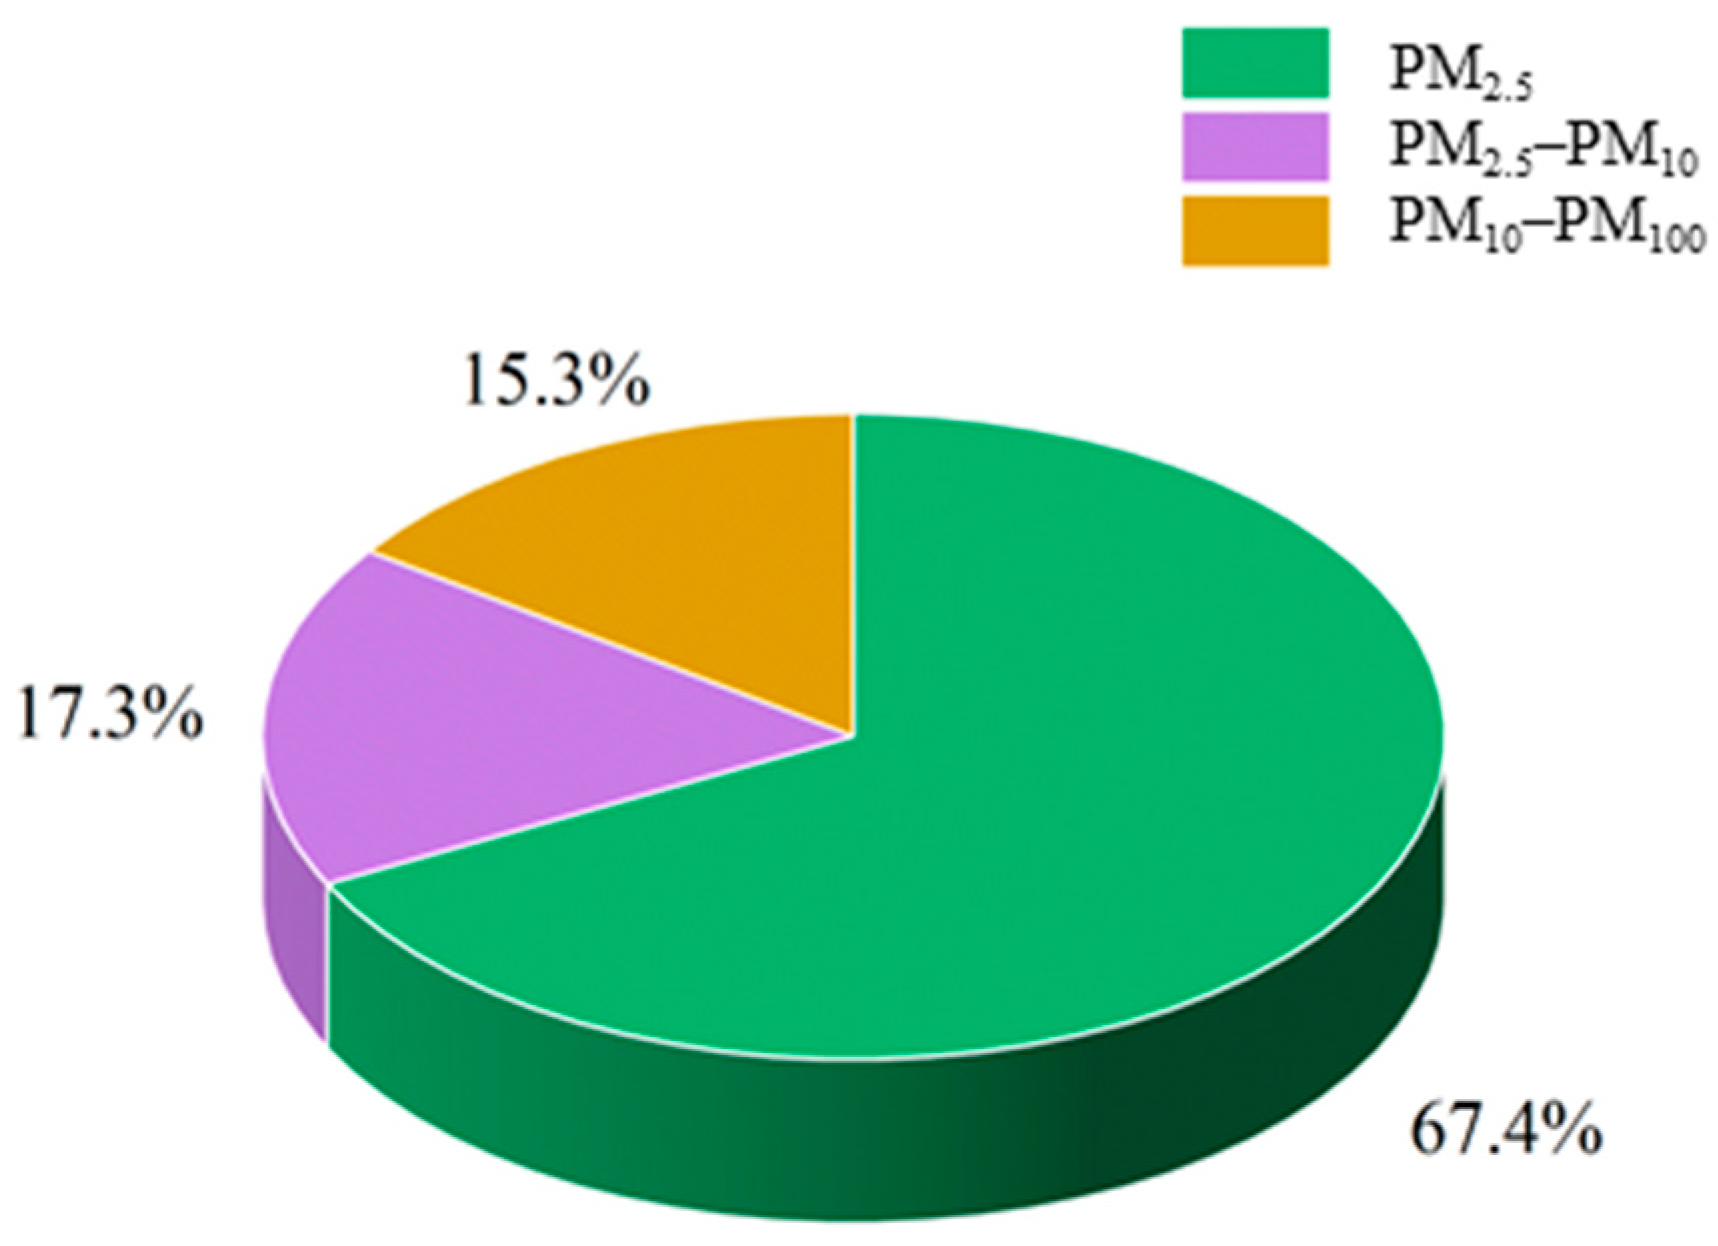
2.2. Dust Particle Size Distribution Testing

The particle size distribution of dust is an important part of studying its properties. Therefore, the dust settled on the ground at the site is tested for particle size distribution in the laboratory using an LT3600 laser particle analyzer produced by Zhuhai Zhenli Optical Instrument Co., Ltd. (Zhuhai, China). The dry method is used for testing. As it is difficult to collect dust dispersed in the air, a JCF-6H direct-reading dust detector is used for data acquisition, and the data particle size includes three ranges: PM2.5, PM10, and TSP.

2.3. Dust Physical and Chemical Properties Testing

2.3.1. Dust XRD Testing

The physical and chemical properties of the dust are key to its management. XRD experiments were carried out in the laboratory using a SmartLab 9 kW manufactured in Japan to study the structure of the dust.

2.3.2. Dust XRF Testing

Having obtained the dust structure through XRD experiments, the dust still needed to be analyzed qualitatively, semi-quantitatively, and quantitatively in terms of substance, so XRF experiments were carried out in the laboratory using an ARLAdvant’X Intellipower 3600 instrument manufactured in the Thermo Fisher Scientific, Waltham, MA, USA.

2.3.3. Dust ICP-MS Testing

Qualitative, semi-quantitative, and quantitative analysis of the structure and material of the dust was obtained by XRD and XRF tests, but the analysis of trace elements in the dust was inadequate, so ICP-MS testing was carried out using an Agilent 7700 (MS) manufactured in the Santa Clara, CA, USA.

2.4. Fluent Numerical Simulation of Dust Transport Patterns in Crushing Plants

Computational Fluid Dynamics (CFD) is a technology based on solving control equations to directly solve fluid flow. It uses numerical simulation on a computer to analyze and predict the state of fluid motion. Numerical simulation transforms the continuous physical fields in the time domain and the space domain into a set of discrete points, and establishes an equation group using certain methods to obtain approximate values. Experimental costs are relatively high, and it takes a lot of time. If CFD simulation can be used instead, costs can be effectively reduced, and more flow field data can be obtained from building simulations, which cannot be compared with experiments. Overall, this method effectively compensates for the problems encountered in actual experiments.

2.4.1. Modelling Based on Actual Site Conditions

The maximum distance from the bottom of the pit to the top of the crushing station at the Ha’erwu Su open-pit mine is 7 m, and the angle of the unloading port wall is 50 degrees. The most commonly used truck in the mine is the MT5500B electric wheel dump truck, so the parameters of this truck are used as modeling settings. First, the simulation size is set. Based on the actual measured dust data on-site, a rectangular sealed cover with a length of 40 m, a width of 20 m, and a height of 25 m is set above the crushing station. Due to the complexity of the actual situation at the open-pit mine crushing station, it is difficult to consider all factors during the modeling process. In accordance with the requirements of numerical simulation, the following simplifications and assumptions are made for the three-dimensional geometric model of the crushing station: (1) Assume that the dispersed dust particles are spherical particles, and the air is an incompressible fluid. (2) The semi-enclosed space is not affected by external wind speed; (3) Assume that all walls of the crushing station are surfaces that reflect dust particles. Based on the above simplifications and assumptions, the established three-dimensional geometric model is shown in Figure 2 below.
The model chosen for the simulations is the standard k-ε model, the Eulerian model is used for the simulation of the wind flow, the Lagrangian model is used for the dust particles, and the Eulerian-Lagrangian discrete phase model is used for the transport of dust particles in the airflow, the specific equations are expressed as follows.
Continuity equation
𝜕 ρ 𝜕 t + 𝜕 𝜕 x i ( ρ u i ) = 0
In the equation, ρ is the gas density, kg/m3; x is the coordinate, m; u is the velocity vector, m/s; t is the time, s.
The standard kε equation
Turbulent pulsation kinetic energy equation (k-equation):
𝜕 ( ρ k ) 𝜕 t + 𝜕 ( ρ k u i ) 𝜕 x i = 𝜕 𝜕 x j [ [ μ + μ t σ k ] 𝜕 k 𝜕 x j ] + G k ρ ε
Turbulent pulsation kinetic energy dissipation rate equation (ε equation):
𝜕 ( ρ ε ) 𝜕 t + 𝜕 ( ρ ε u i ) 𝜕 x i = 𝜕 𝜕 x j [ [ μ + μ t σ ε ] 𝜕 ε 𝜕 x j ] + C 1 ε ε k G k C 2 ε ρ ε 2 k
G k = μ t [ 𝜕 u i 𝜕 x j + 𝜕 u j 𝜕 x i ] 𝜕 u i 𝜕 x j
In the equation, G k is the coefficient of the rate of change of turbulent kinetic energy as affected by the change in shear, kg/(s3·m); The values of C 1 ε ε , C 2 ε ε , σ ε , σ k are 1.44, 1.92, 1.00, 1.30, respectively. Solved by integrating the differential equations for the particle forces in Lagrangian coordinates, the equilibrium equations for the particle phase forces are as follows:
m p d u p d t = F = F d + F g + F f + F x
In the equation, m p is the mass of the particle, mg; u p is the velocity of the particle, m/s; F is the combined force on the particle, N; F d is the drag force on the particle, N; F g is the gravitational force on the particle, N; F f is the buoyancy force on the particle, N; F x is the other forces on the particle, including Magnus lift, Saffman lift, additional mass force, Brownian force, Thermal swimming force, etc.

2.4.2. Numerical Simulation Parameter Setting

To simulate the dust dispersion, relevant parameters of the dust source need to be set. This article simulates the dust concentration, velocity, pressure changes, etc. within a time range of 30 s from the start of dust injection. The relevant parameters are set as shown in Table 2, where the dust injection source is selected as the surface, and the particle size range of the dust is based on the results of the dust concentration particle size distribution test noted above. Diffusion parameters, total flow rate, and turbulence intensity are conventional parameters selected by the system, and the intake velocity is based on the actual measured results on-site.
After the grid is divided according to the actual situation of the discharge port of the open pit crushing station, the mathematical model and Fluent simulation method are combined to determine each parameter of the numerical simulation of the gas phase flow field as shown in Table 3. The discrete phase boundary conditions are selected and set based on the results of the continuous phase flow field calculations, using the method of interphase coupling.
If the fluid happens to behave in a turbulent state, there are no rules and it is very complicated. Even when the boundary conditions are stable and constant, the flow is always in a state of change, especially the velocity, which shows a random pattern of variation, so it is vital to carry out simulations and analysis. From a macroscopic point of view, the standard k-e model is able to accurately simulate specific turbulent processes due to the relatively small Mach number. The standard k-e model is mainly empirical and is based on turbulent kinetic energy and diffusivity. k-equations are highly accurate, whereas e-equations are more empirical. The software can be used to solve incompressible fluids, and the results are accurate, reliable, and efficient. In this study, the dust dispersion law of the crushing station, whose airflow is an incompressible fluid. Therefore, it was decided to use a pressure coupler for the solution in this study.

3. Results and Discussion

After the unloaded material enters the discharge port, the material will undergo a vertical free-fall motion due to gravity. A large amount of material will produce high rebound stress due to contact with the bottom surface, and the rebound stress increases as the velocity of the material contacting it increases. When the stress limit that the material can bear is exceeded, the material will break at the contact point. The dust particles produced by the crushing, which have smaller particle sizes, will move with the airflow, and the materials with kinetic energy will transfer energy to the surrounding coal and rock and the wall of the discharge port, causing the dust adhering to the bottom of the pit and the dust generated by collision to gain initial energy and fly into the air. Due to the splashing of the broken material caused by the rebound effect, some materials will produce secondary collisions during this process, which will raise more dust. The collision between the materials will cause the gaps between the material flows to rapidly decrease, squeezing the gas distributed in the material gaps out into the atmosphere. This part of the impact airflow will carry smaller dust particles adhering to the material flow into the atmosphere and sweep the dust generated by collision along with it, causing the dust to fly as shown in Figure 3.
From Figure 4, we can see the overall movement of dust and the range of its diffusion from the crushing station’s discharge port. The current spray dust control technology cannot capture and manage it within a controllable range in a timely manner, which will create significant obstacles to the surrounding environmental management. The dust has already spread to a height of 50 m visible to the naked eye, and the dust concentration above the crushing station is higher than that of the surrounding area. As the dust moves according to the concentration gradient in the air, it floats towards farther locations, causing extremely serious atmospheric pollution. The dust emission and diffusion from the crushing station’s discharge port can be divided into three stages: dust emission stage, dynamic-induced diffusion stage, and Brownian diffusion motion stage. The dust emission stage includes frictional dust emission, collision-induced dust emission, and induced dust emission. Once the dust escapes from the controllable range, it becomes unrealistic to capture and manage it, so it is essential to treat the dust at its source.

3.1. On-Site Dust Concentration Monitoring Results

After several on-site data collection, extraction, and collation, the dust concentration was recorded for truck unloading over a period of time and measured by the JCF-6H dust concentration meter to obtain the dust concentration near the discharge port of the crushing station and to produce Figure 5.
In Figure 5, it can be observed that there are a total of five peaks in the graph. According to on-site measurements, these peaks are caused by the dust generated during truck unloading. After unloading, the dust disperses and eventually returns to its original concentration after some time. Therefore, it is necessary to accurately control the dust during truck unloading. The dust concentration generated from unloading under different coal qualities is also quite different, indicating that coal quality is a major factor affecting dust emissions during unloading. Based on the data, it can be seen that the average PM2.5 concentration of dust in the crushing station before unloading is 18.57 μg/m3, the PM10 concentration is 23.42 μg/m3, and the PM2.5 concentration is 27.75 μg/m3. When unloading, the average PM2.5 concentration in the crushing station is 146.4 μg/m3, the PM10 concentration is 189.4 μg/m3, and the PM2.5 concentration is 225.6 μg/m3. Compared with the dust concentration before unloading, the dust concentration increases by an average of 8.03 times during unloading. In special coal types and environmental conditions, the dust concentration during unloading can increase by 25–30 times compared to the dust concentration before unloading.

3.2. Dust Particle Size Distribution Results

3.2.1. Analysis of Dust Falling on the Ground

The dust samples deposited on the ground were tested with a laser particle size analyzer and the dust particle size distribution statistics are shown in Figure 6 below.
Usually, particles larger than 100 μm can all settle in the air. Therefore, this article mainly focuses on dust particles with a diameter of less than 100 μm. According to the test analysis of on-site dust samples, the dust particles that settle on the ground with a diameter of less than 100 μm account for 42.69% of the samples. The human nose and mouth can absorb almost 100% of particles larger than 10 μm in the air, but dust particles smaller than 10 μm can enter the lungs. Among the dust samples settled on the ground, 16.6% of the dust particles have a diameter smaller than 10 μm, and this part of the dust particles will severely affect the health of workers.

3.2.2. Analysis of Airborne Dust

The dust dispersed in the air at the site was measured in the coal shed using the JCF-6H laser ambient dust continuity tester produced by Qingdao Juchuang Technology, and the average dust particle size percentage relationship was plotted according to the measured data as shown in Figure 7.
In the TSP (Total Suspended Particles) of Crushing Figure 7, PM2.5 accounted for 67.43%, PM2.5–PM10 accounted for 17.3% of the total dust, and PM10–PM100 accounted for 15.27%. These fine particles with a diameter smaller than 10 μm can be inhaled by humans and remain in the upper respiratory tract or even enter the lungs, with smaller particles posing greater harm to human health. As the test results showed that 84.7% of the coal dust suspended in the air inside the coal shed had a diameter smaller than 10 μm, controlling PM2.5 and PM10 should be given priority when managing dust in the crushing station.

3.3. Dust Physical and Chemical Properties Test Results

3.3.1. Dust XRD Testing

The results of XRD testing of dust samples are shown in Figure 8:
The data obtained from XRD testing was refined using Topas Rietveld, which revealed that Al2(Si2O5)(OH)4 accounted for 14.8% of the dust mineral content, SiO2 accounted for 65.8%, AlO(OH) accounted for 8.1%, and Ca(CO3) accounted for 11.3%. The results by Szymczykiewicz, K.E. [40] showed that the higher the free SiO2 content in the dust, the faster the speed of pulmonary fibrosis in workers and the shorter the time to onset. Therefore, reducing the concentration of SiO2 in the dust below relevant limits during dust hazard management can greatly reduce the probability of developing silicosis.
By adjusting the correlation coefficient and using nonlinear least squares to minimize the following Equations (2) and (3), an Rwp value generally less than 10% is considered acceptable, and the peak fitting in this article stopped after the 41st iteration, with the final error value of Rwp being 9.86%, meeting the requirements and indicating that the calculated results are consistent with the actual detected results.
M P = w ( I e I c ) 2
R w p = M P w I o 2
M P : Mean error, w : weight, I e : expected value, I c : actual value, I o : measured intensity value for the 2 theta angle, R w p : weighted residual mean.

3.3.2. Dust XRF Testing

The dust sample XRF test is shown in Figure 9:
According to Figure 9, the proportion of Al2O3 in the dust is as high as 46.835%, followed by SiO2 with a proportion of 29.074%. Other components in descending order based on their content include CaO, SO3, TiO2, Na2O, Fe2O3, K2O, Cl, P2O5, MgO, NiO, CuO, ZrO2, SrO, and ZnO. The research by Liu, H.L. [41] shows that a high content of Al2O3 can be harmful to the nervous system, especially to brain tissue and intelligence, causing abnormal behavior, intellectual disability, tremors, and delayed reactions. Fe2O3 was included in the list of carcinogens published by the International Agency for Research on Cancer of the World Health Organization on 27 October 2017. A high CaO content can cause strong respiratory irritation and inhalation of CaO dust can lead to chemical pneumonitis. Inhalation of a large amount of Na2O can cause chemical bronchitis, chemical pneumonitis, and pulmonary edema. High levels of SO3 can affect the pH value of mucous membranes in the respiratory tract and pose a health hazard.

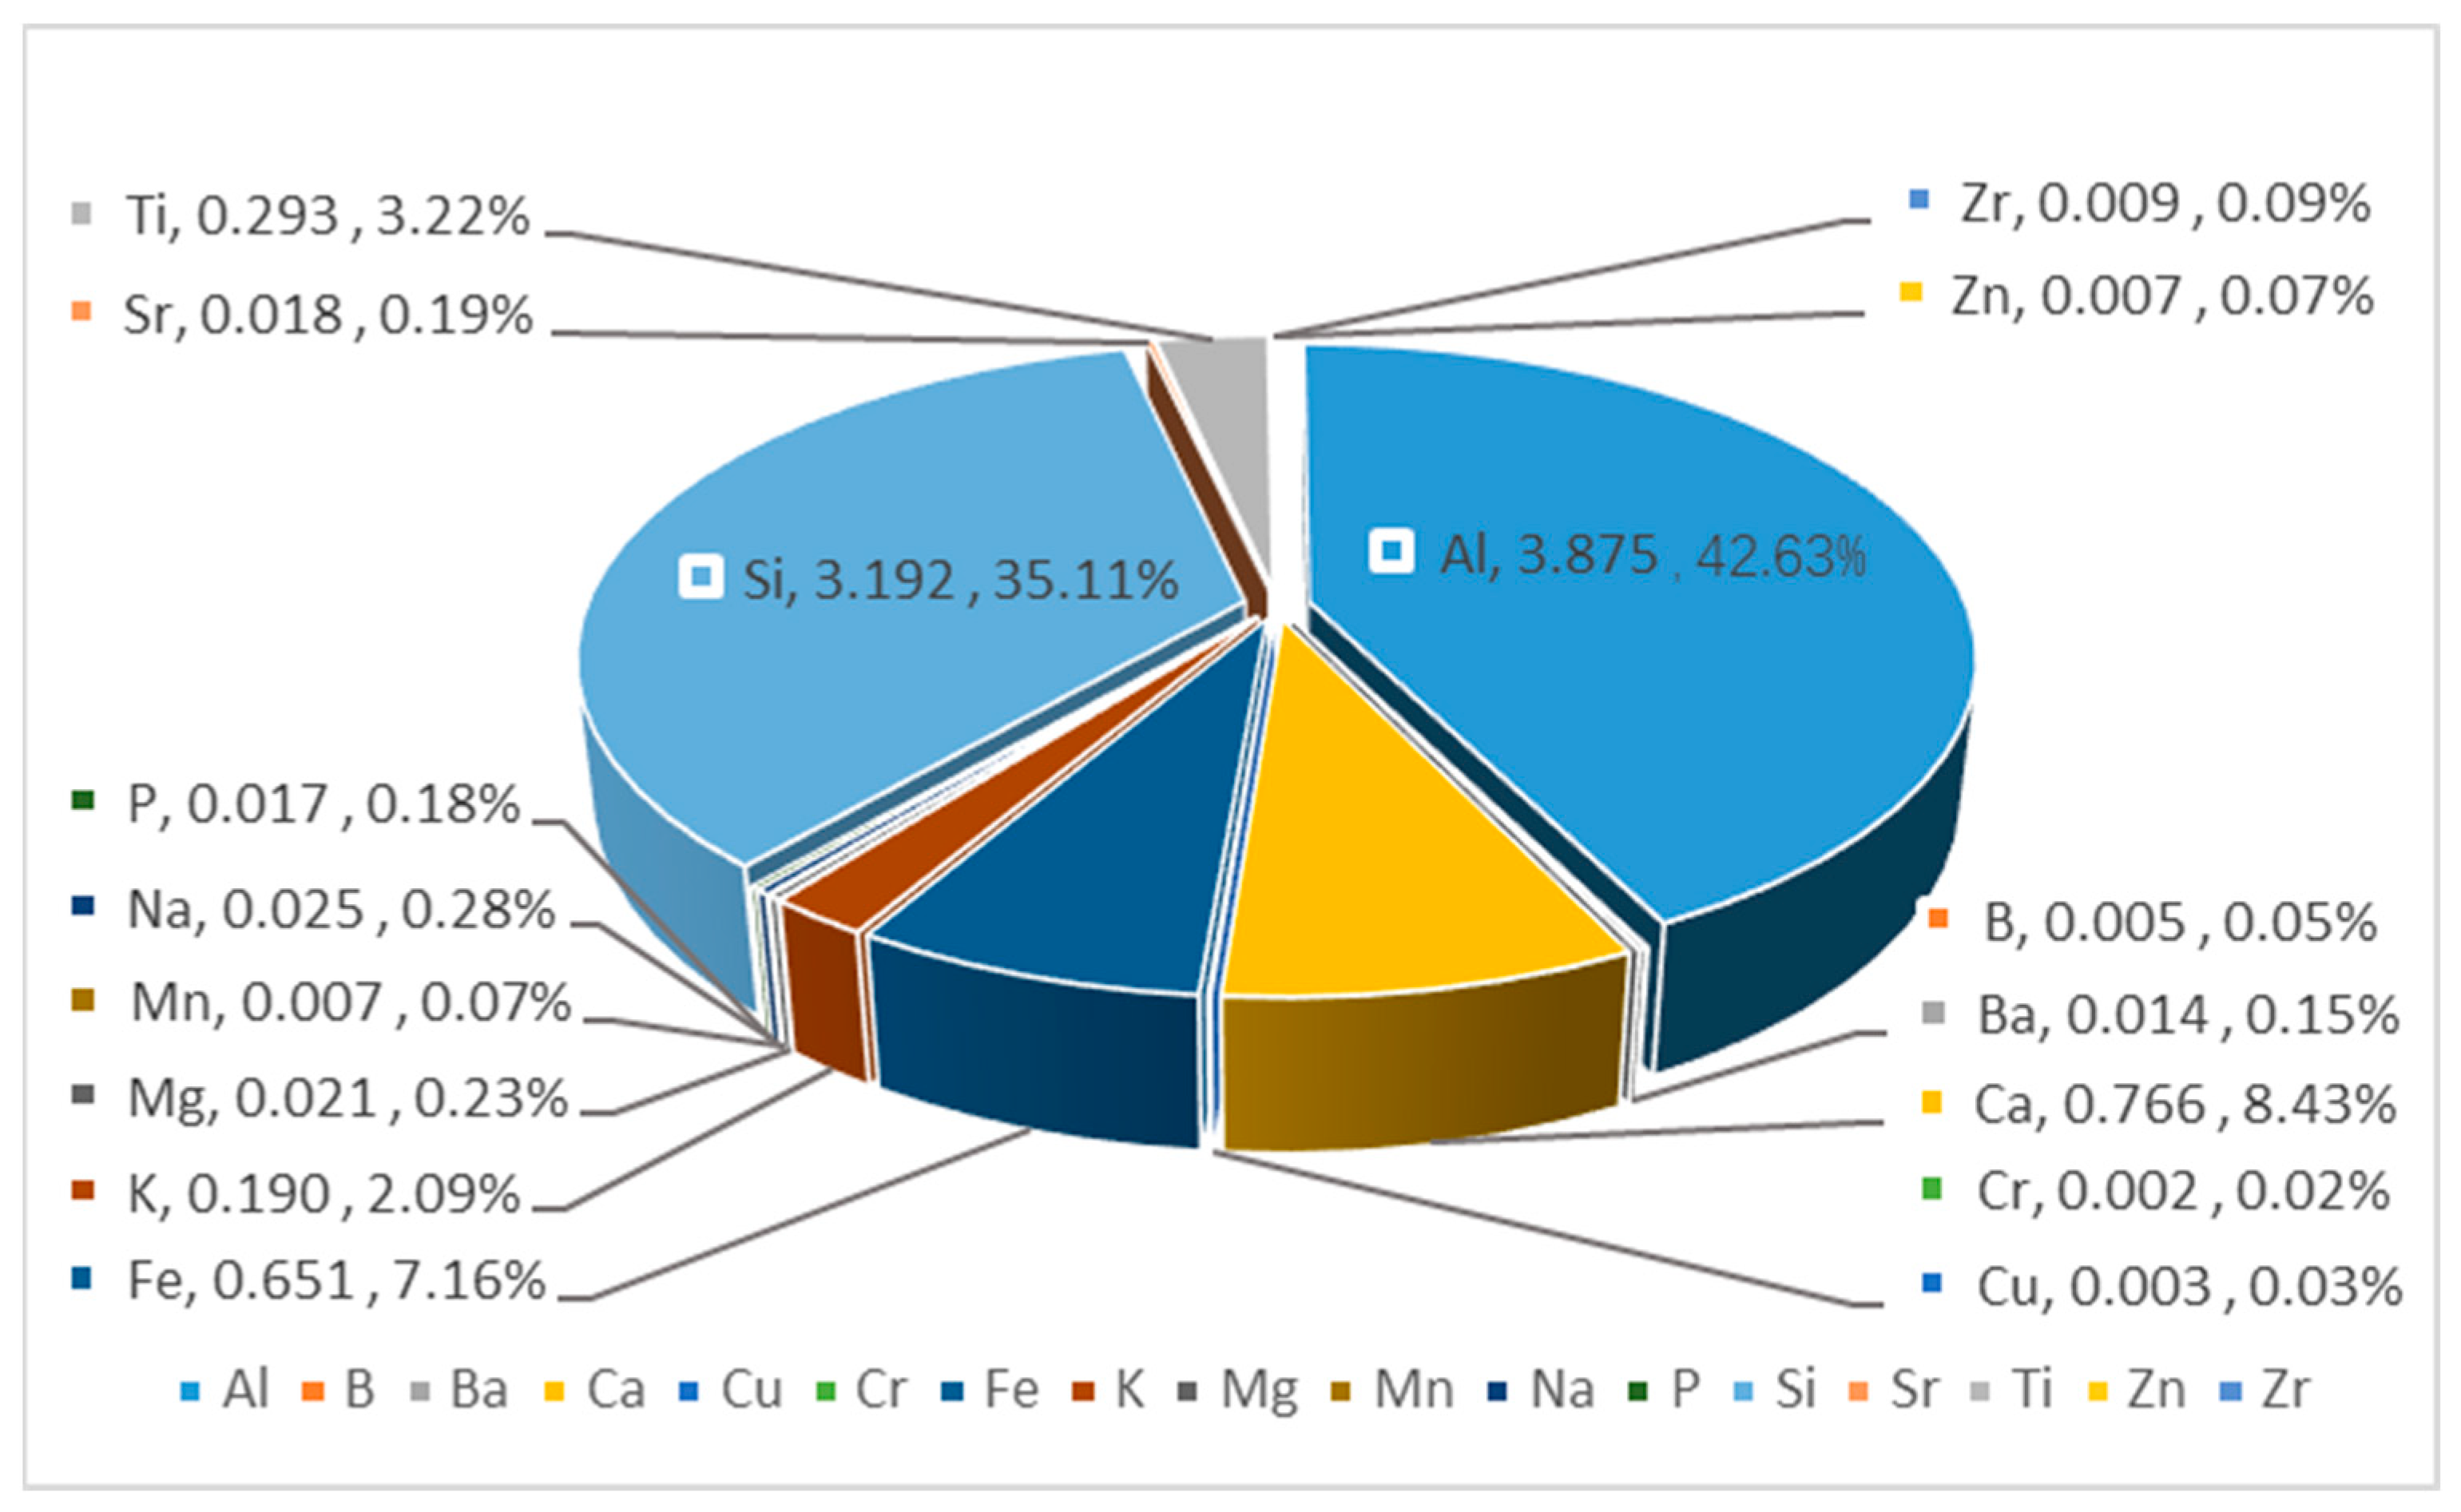
3.3.3. Dust ICP-MS Testing

The dust samples were tested by ICP-MS as shown in Figure 10:
The statistics on detected trace elements show that Al accounts for 42.62% of the total amount of trace elements detected, Si accounts for 35.11%, Ca accounts for 8.43%, Fe accounts for 7.16%, Ti accounts for 3.22%, and K accounts for 2.09%. The individual percentage composition of the remaining 11 trace elements, Na, Mg, Sr, P, Ba, Zr, Zn, Mn, B, Cu, and Cr, is all less than 0.28%. Research by Zhang, X. [42] has shown that iron and copper metal elements in trace elements in dust can form free radicals on the surface of dust, participating in toxic reactions within lung tissue cells. Manganese is an essential element for animals, but if exposed to high concentrations of manganese dust for a long time, it can cause increased lipid peroxidation and internal damage. Ca and Mg metal elements have a growth-promoting effect on Staphylococcus epidermidis, but when there is external interference or the host’s own resistance is reduced, it can lead to bacterial dysbiosis and harmful effects. In addition, dust in the air is a carrier of many harmful bacteria and can cause many diseases. If dust promotes the growth of these bacteria, it will increase their harmfulness.

3.4. Analysis of Simulation Results

3.4.1. Simulation of Truck Unloading Dust in Open Condition

1.
A dust dispersion simulation was carried out for truck discharge in the open condition of the crushing plant, and the dust dispersion results 30 s after discharge were as follows:
(1)
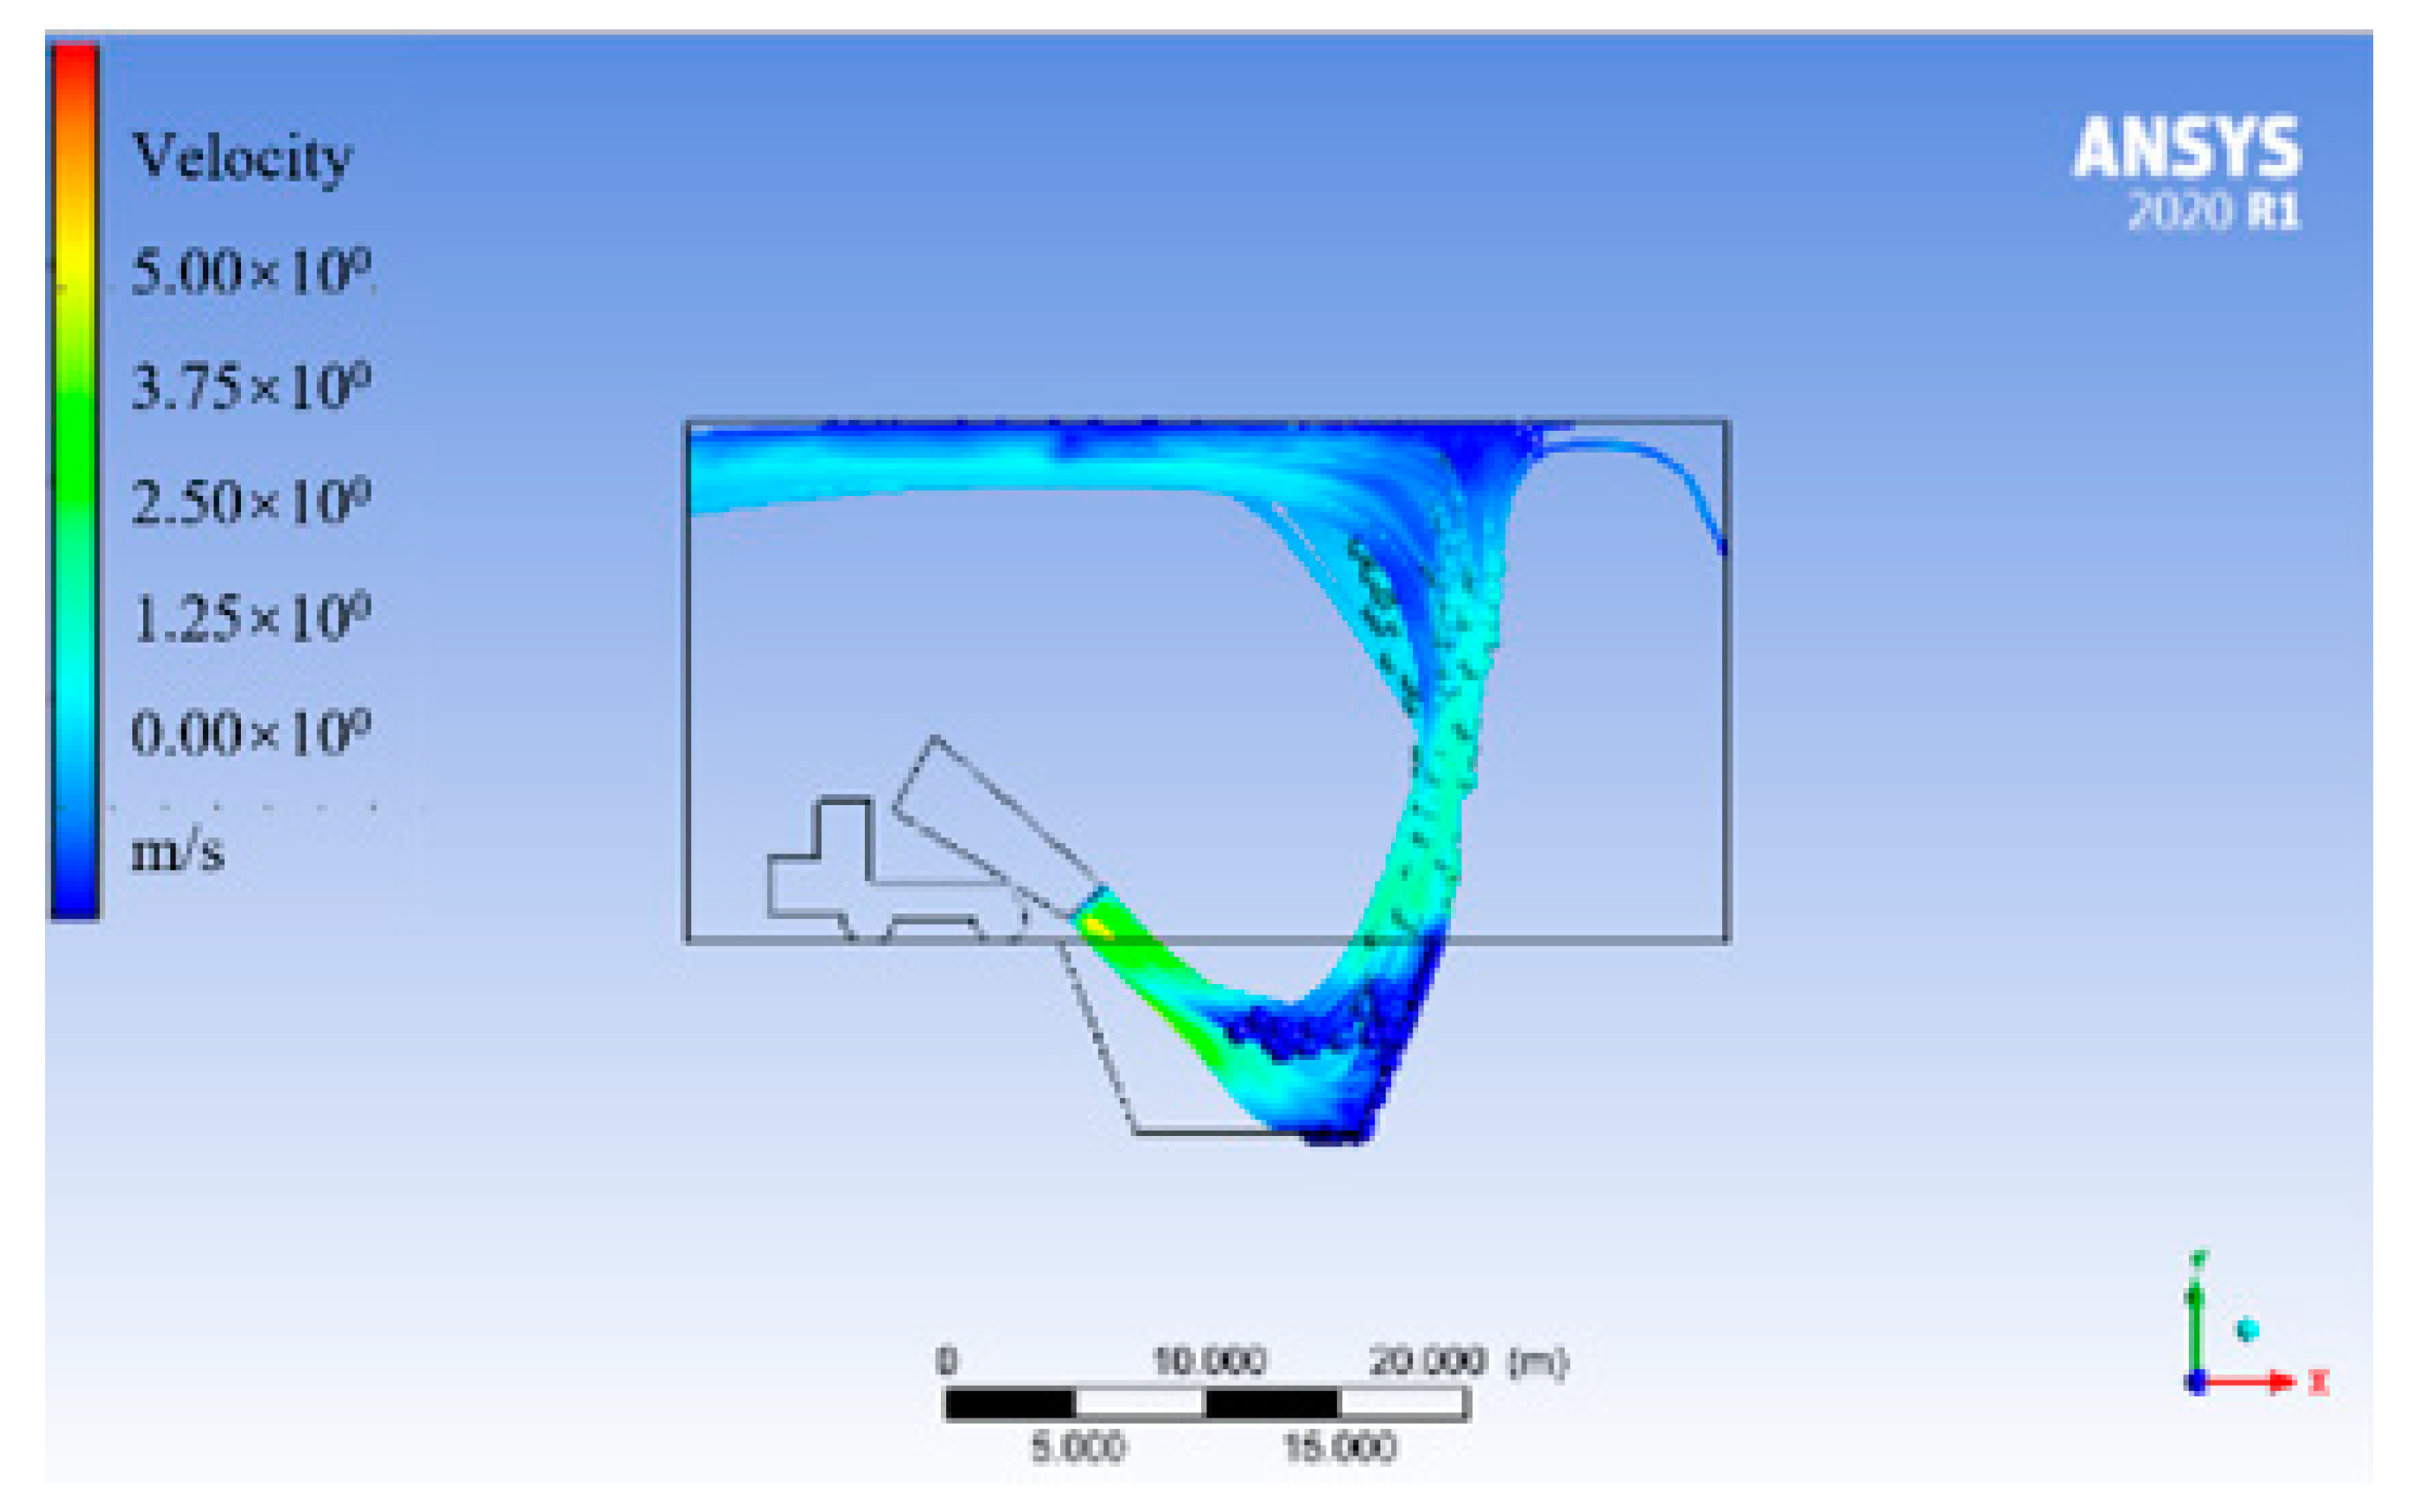
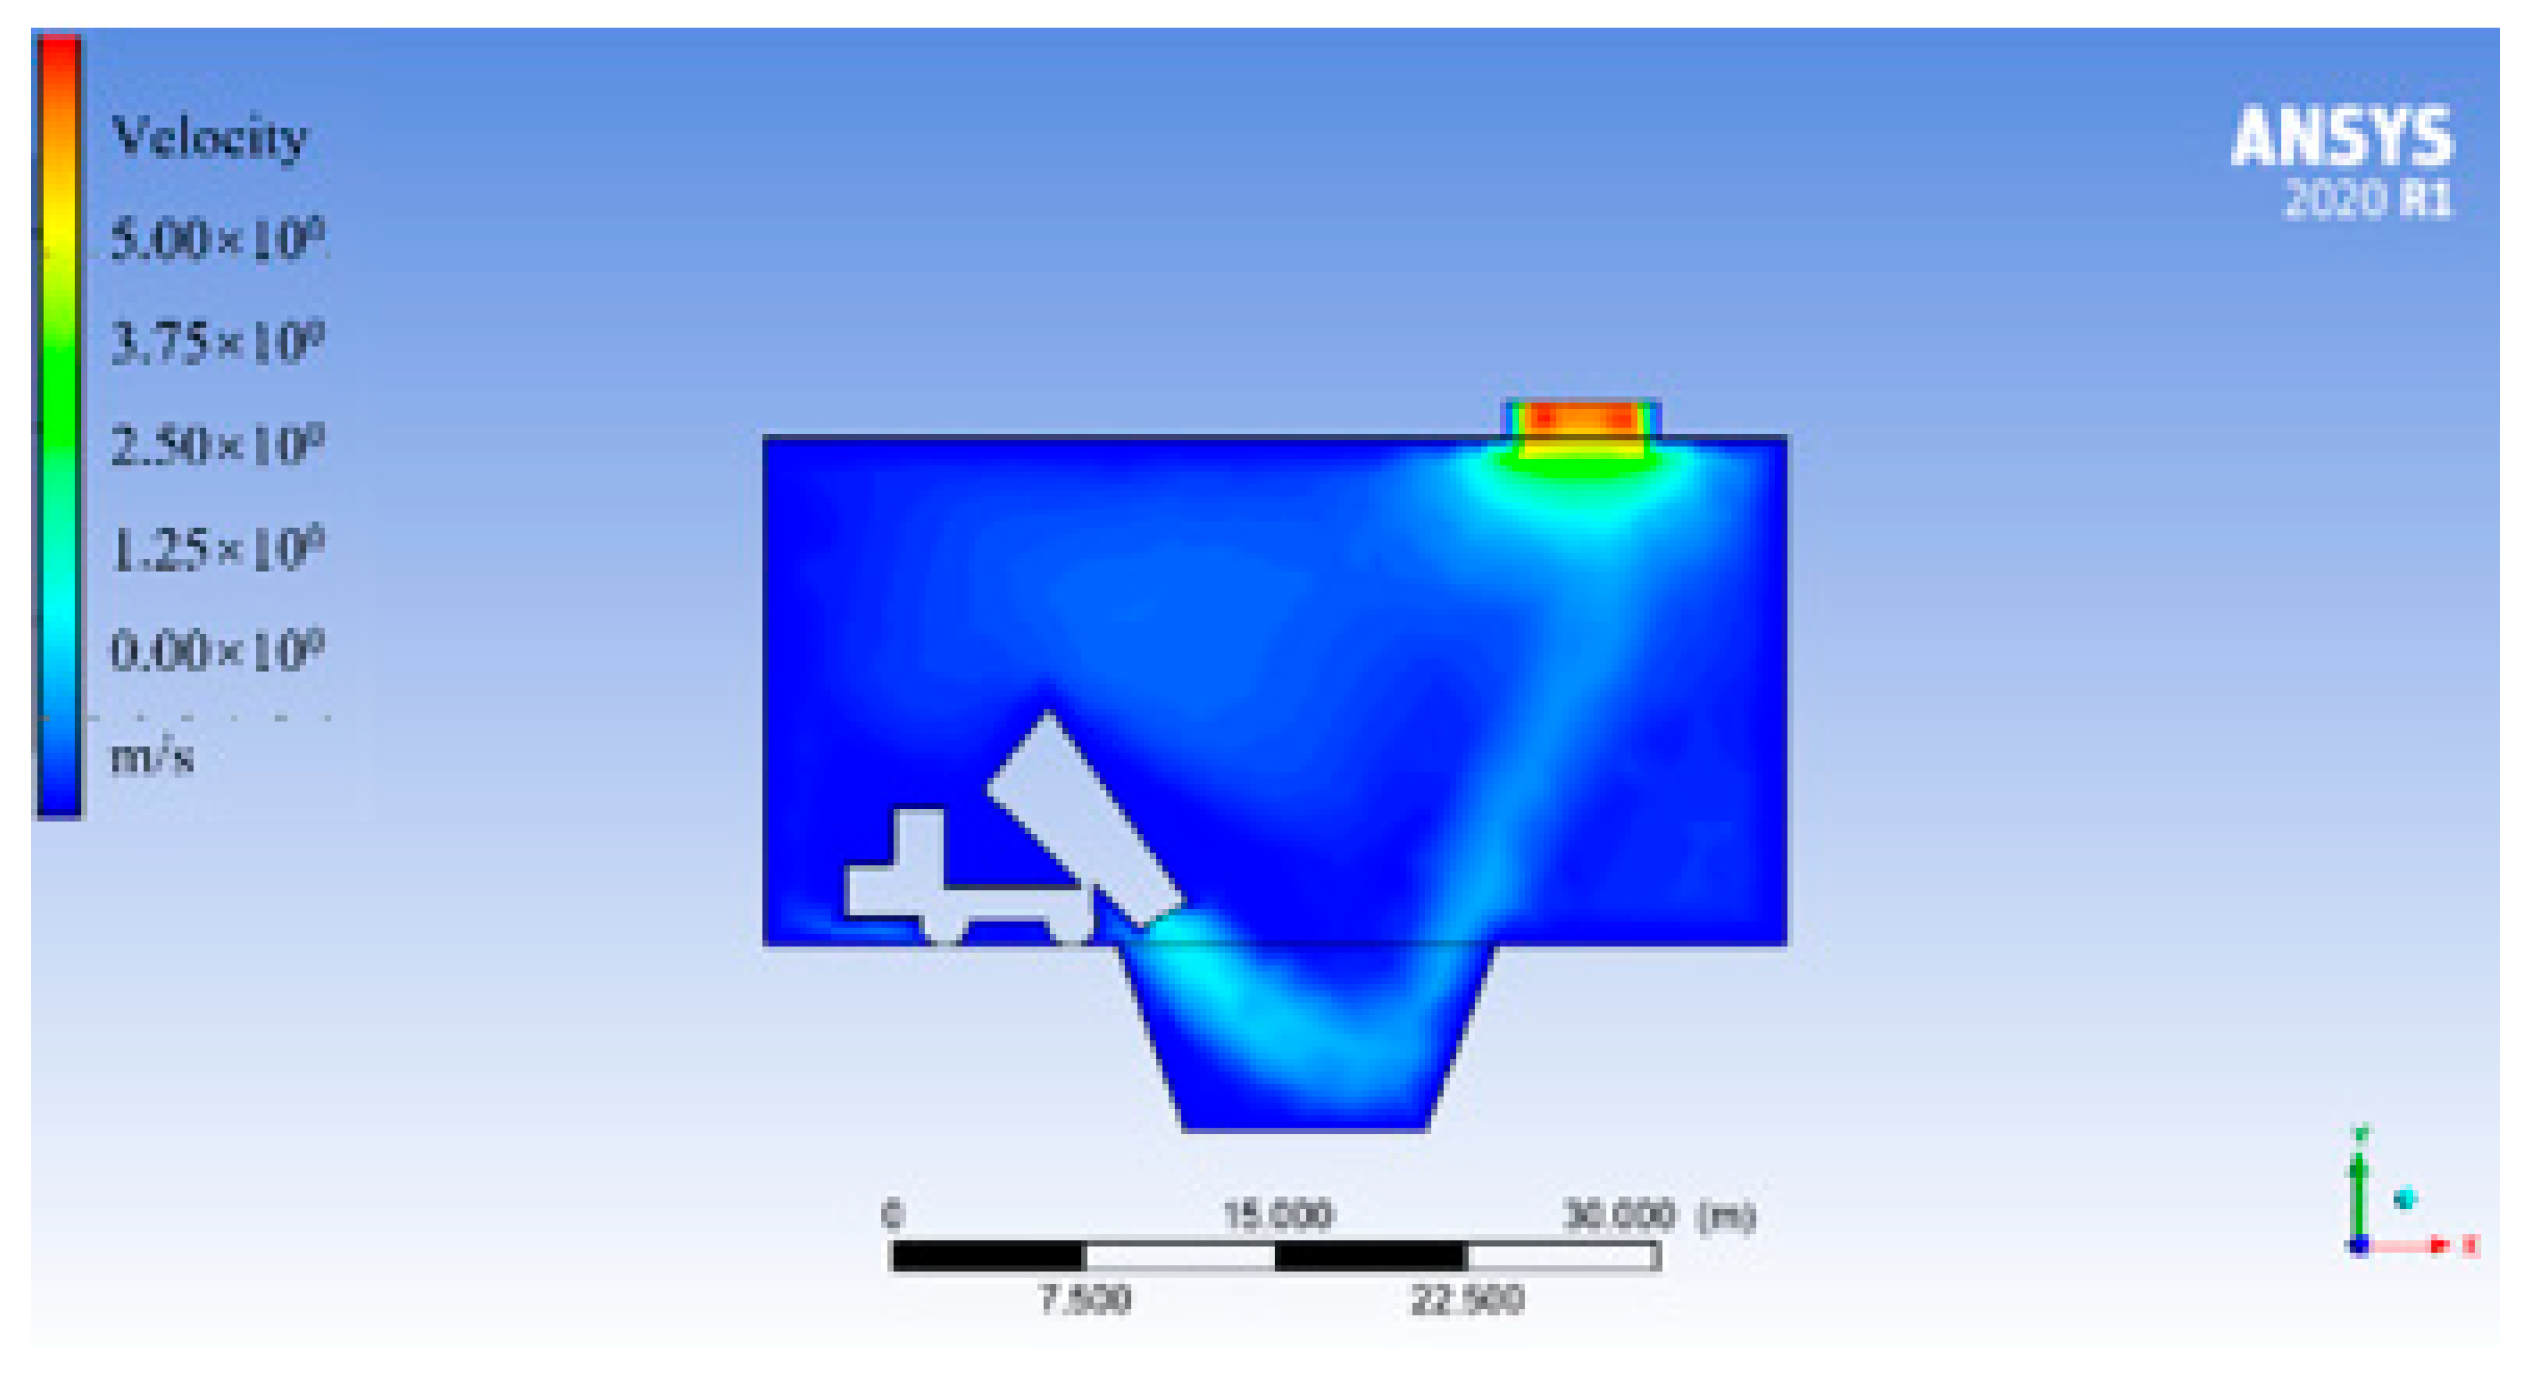
Within the first 5 s of the sliding and falling of the material, the dust diffusion range is large on the X-axis and Y-axis. As shown in Figure 11a, it can be seen that the area with the highest dust concentration is located below the material accumulation point, and the farther away from the center of the dust source, the lower the dust concentration. This pattern conforms to the law of dust diffusion movement.
(2)
Within 1–15 s of the material’s falling, as time passes, the dust diffusion range at the crusher discharge port also increases. The speed of material unloading has a direct impact on the diffusion of dust. The faster the unloading speed, the greater the velocity along the X and Y directions. During this stage, the dust diffusion speed along the X-axis is greater than that along the Y- and Z-axes.
(3)
Within 15–30 s, due to the end of unloading, the dust source stops generating dust. The dust starts to accelerate and diffuse along the Y-axis due to the upward drag force and the impact airflow generated by rebounding. At this time, the movement of dust along the Y-axis is greater than that along the X and Z axes. Due to the existence of vortex flow in the lower part of the material flow, the dust will disperse in multiple directions.
2.
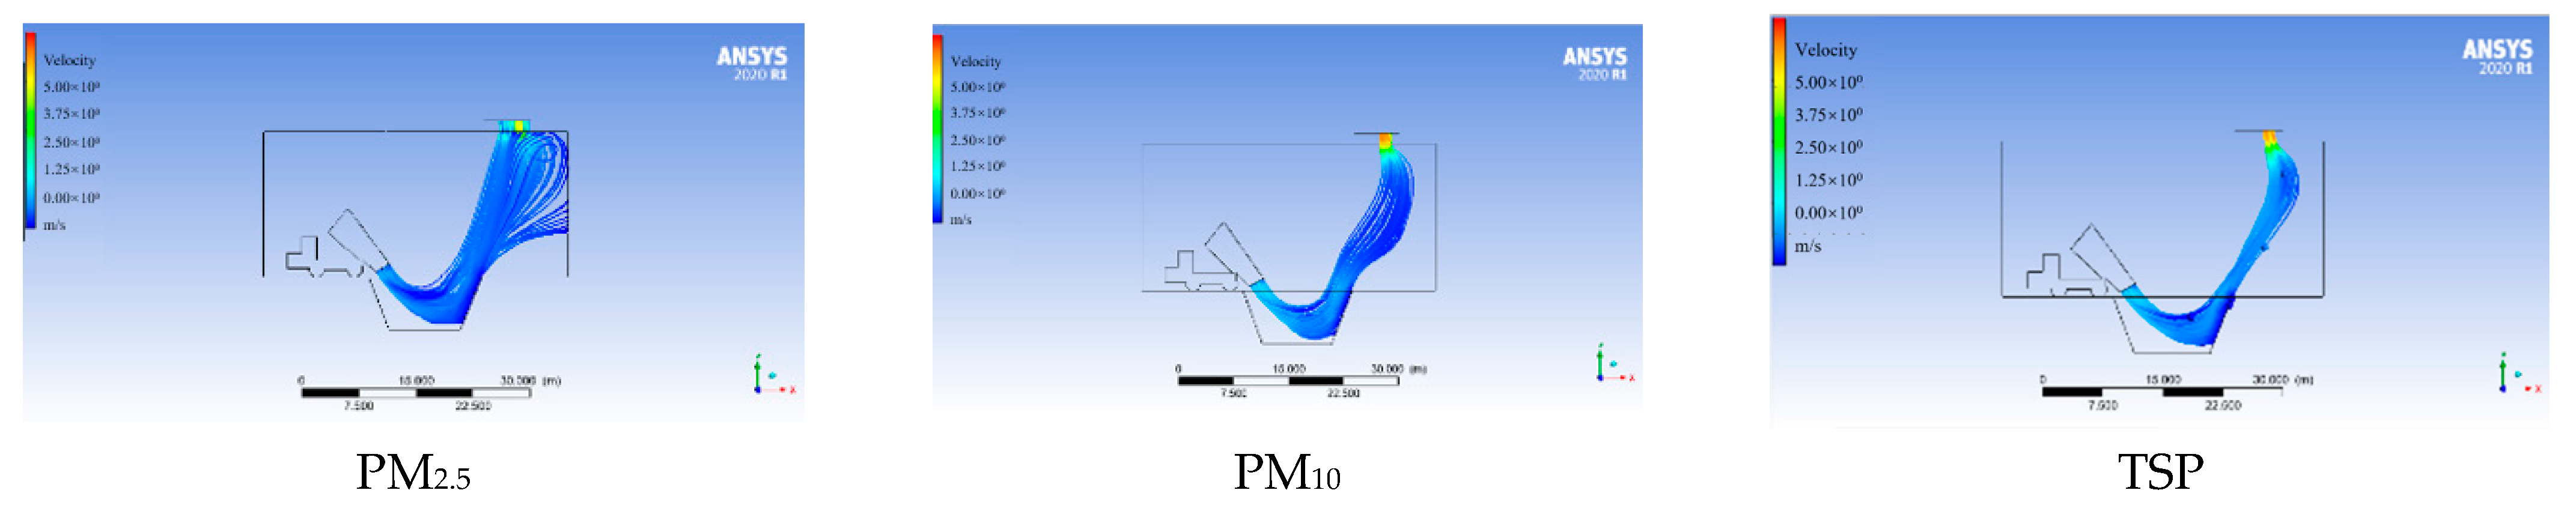
The dust dispersion pattern of the truck unloading can be clearly seen when photographed at 2 m from the truck unloading point in the open condition of the crushing plant, 30 s after unloading the dust dispersion results are as follows:
(1)
During the 5 s material unloading process, the material falls to form a high-quality concentration of dust in a concentrated area. Small dust particles rapidly spread in an irregular manner under the induction and impact of airflows, while large dust particles rotate and fall under centrifugal and gravitational forces.
(2)
During the 5–15 s material unloading process, the high-quality dust concentration area gradually expands, creating a low-quality dust concentration area. When the dust reaches its highest point in the vertical direction, its vertical speed becomes zero, and it begins to move horizontally, influenced by factors such as wind speed, temperature, and dust concentration gradient in the space.
(3)
During the 15–30 s material unloading process, the dust loses its impact and vortex airflow effects and moves irregularly in the atmosphere through Brownian motion. It spreads along the periphery from the unloading point, and the pollution diffusion area continues to increase. Small dust particles are difficult to settle naturally and will float farther away with the airflows (Figure 12).

3.4.2. Closed Truck Unloading Simulation

The crushing station was first modelled as a three-dimensional seal, leaving the truck inlet and outlet open to the atmosphere and the remaining three faces sealed for treatment, which was obtained after fluent simulations as shown in Figure 13 and Figure 14.
From the dust velocity cloud diagram in Figure 13 and the dust trajectory diagram in Figure 14, it can be seen that most of the dust will move along the wall towards the area of low pressure when it reaches the upper boundary, most of the dust will fall back to the ground by gravity if it is not captured in time. The dust trajectory diagram shows that the dust will escape through an outlet that is connected to the atmosphere and can be collected at the outlet and where the dust collects.
From the dust motion vector diagram in Figure 15, it can be seen that the dust has the highest velocity at the bottom of the pit and its speed decreases as it moves upward. Eventually, 90% of the dust will move towards and escape through the surface connected to the atmosphere. At the same time, during the upward movement, swirling flows of various sizes will be generated around the dust, promoting the dispersion of dust to the surroundings. Without dust suppression measures, the dust concentration in the space will remain high, especially above the discharge port and in the corners. In a sealed state, dust control on the upper wall surface of the outlet should be emphasized. A negative pressure suction port can be installed at the outlet. From the pressure cloud chart, it can be seen that there is a relatively high-pressure area above the discharge port of the crushing station, which is caused by the pressure increase resulting from the collision and rebound of dust moving upward with the upper wall surface. When designing a negative pressure dust removal device, priority should be given to the design of a negative pressure exhaust device in this area.

3.4.3. Simulation of Dust Dispersion after Installation of Dust Extraction Systems in Enclosed Spaces

The de-dusting system is set at the point of highest pressure and concentration, i.e., 8 m from the right-hand boundary at the top of the suction outlet, with a diameter of 2 m and a suction air velocity of 18 m/s.
From the dust velocity cloud chart in Figure 16 and the velocity vector diagram in Figure 17, it can be seen that the dust will move towards the suction port under the influence of the induced airflow disturbance in the surroundings during its movement. At the same time, dust particles accompanying the airflow movement under the disturbance effect will also enter the suction port, achieving dust reduction.
Research has been conducted to increase dust collection efficiency under sealed conditions by adding suction ports. Due to the effect of wind pressure, the dust will move towards the suction port. Apart from large particles settling down, 99% of the dust will be collected and processed by the suction port. Only 1% of the dust will move irregularly in the space. This greatly improves the dust reduction efficiency of the crushing station. Based on the actual unloading conditions at the site, the trajectories of PM2.5, PM10, and TSP dust particles were tracked in the geometric model. Three sets of 1000 dust particles with different particle sizes were placed in the model, and the Euler-Lagrange method was used to calculate particle motion laws. The trajectories of dust particles at different times were tracked. The simulation results are shown in Figure 18.
Among the 1000 dust particles tracked for PM2.5, 970 particles were captured while 30 particles continued to move in the sealed space. Due to the small particle size of PM2.5, the path and time of dust movement are long, making it difficult for them to settle naturally. They are greatly affected by changes in the surrounding conditions. According to the tracking results, the dust removal efficiency for PM2.5 reaches 97% after adding the dust removal system.
Out of the 1000 dust particles tracked for PM10, 996 particles were captured, while only 4 particles continued to move in the space. The results show that after adding the dust removal system, the PM10 dust removal rate is the highest, with a dust removal efficiency of 99.6%.
Among the 1000 dust particles tracked for TSP, 983 particles were captured while 17 particles were not captured. The results show that the dust reduction rate after adding the dust removal system is 98.3%. Some particles will undergo natural settling due to gravity and fall back to the ground.

4. Conclusions

This article is based on the actual situation of the Haerwusu Open-pit Mine to collect dust data and simulate the dust diffusion law numerically for the crushing station. Based on the numerical simulation results, it is suggested that the optimal dust reduction scheme for the crushing station in this mine is to install a dust removal system in a closed space. The data collection in this article is singular, so this scheme has certain limitations. The following conclusions are drawn through the study in this article:
(1) According to the dust concentration monitoring data, it can be seen that the average dust concentration increases by 8.03 times when trucks are unloading compared to when they are not unloading. When unloading under special coal quality and environmental conditions, the dust concentration increases by 25–30 times compared to when not unloading.
(2) The dust floating in the air near the discharge port of the crushing station is mostly fine particles, of which those with a particle size smaller than 2.5 μm account for 67.43%, those with a particle size of 2.5–10 μm account for 17.3% of the total dust, and those with a particle size of 10–100 μm account for 15.27% of the total dust
(3) XRD test results show that SiO2 accounts for 65.8% of the dust, XRF test results show that Al2O3 oxide accounts for 46.835% of the dust, and ICP test results show that Al element accounts for 42.62% of the total detected trace elements, and Si element accounts for 35.11%.
(4) Based on the Fluent simulation of the dust movement law and on-site measured data, it is determined that the optimal dust reduction scheme is to install a dust removal system in a closed space. Results show that after installing the dust removal system, the dust removal efficiency for PM2.5 reaches 97%, for PM10 it is 99.6%, and for TSP it is 98.3%.

Author Contributions

Conceptualization, Z.L. and Z.A.; methodology, Z.W., Z.L., Z.A. and B.Z.; validation, Z.L., W.Z., Z.L. and B.Z.; formal analysis, Z.A.; investigation, Z.W.; resources, J.N.; data curation, J.N.; writing—original draft preparation, Z.L., Z.A. and W.L.; writing—review and editing, W.L., K.X., L.Z. and L.L.; visualization, Z.A. and Z.Y. All authors have read and agreed to the published version of the manuscript.

Funding

This research was supported by the Fundamental Research Funds for the Central Universities (2021ZDPY0227).

Institutional Review Board Statement

Not applicable.

Informed Consent Statement

Informed consent was obtained from all subjects involved in this study.

Data Availability Statement

Not applicable.

Acknowledgments

The authors would like to thank the National Energy Group’s Halwusu Open Sky Mine for providing an important test site for this paper.

Conflicts of Interest

The authors declare no conflict of interest.

References

  1. Wang, Z.M.; Zhou, W.; Jiskani, I.M.; Luo, H.T.; Ao, Z.C.; Mvula, E.M. Annual dust pollution characteristics and its prevention and control for environmental protection in surface mines. Sci. Total Environ. 2022, 825, 153949. [Google Scholar] [CrossRef] [PubMed]
  2. Wang, Z.M.; Zhou, W.; Jiskani, I.M.; Ding, X.H.; Luo, H.T. Dust pollution in cold region Surface Mines and its prevention and control. Environ. Pollut. 2022, 292, 118293. [Google Scholar] [CrossRef] [PubMed]
  3. Luan, B.Y.; Zhou, W.; Jiskani, I.M.; Wang, Z.M. An Improved Machine Learning Approach for Optimizing Dust Concentration Estimation in Open-Pit Mines. Int. J. Environ. Res. Public Health 2023, 20, 1353. [Google Scholar] [CrossRef]
  4. Tian, Y.; Jiskani, I.M.; Lu, X.A.; Zhou, W.; Liu, F.M.; Zhang, C.W.; Cai, Q.X. Control mechanism of end-slope deformation in open pit mine based on discrete-continuous coupling method. Comput. Part. Mech. 2023, 10, 951–963. [Google Scholar] [CrossRef]
  5. Huertas, J.I.; Huertas, M.E.; Solis, D.A. Characterization of airborne particles in an open pit mining region. Sci. Total Environ. 2012, 423, 39–46. [Google Scholar] [CrossRef]
  6. Cvetkovic, Z.; Logar, M.; Rosic, A. Mineralogy and characterization of deposited particles of the aero sediments collected in the vicinity of power plants and the open pit coal mine: Kolubara (Serbia). Environ. Sci. Pollut. Res. 2013, 20, 3034–3049. [Google Scholar] [CrossRef] [PubMed]
  7. Shen, Z.Y.; Ao, Z.C.; Wang, Z.M.; Yang, Y.Q. Study on Crust-Shaped Dust Suppressant in Non-Disturbance Area of Open-Pit Coal Mine-A Case Study. Int. J. Environ. Res. Public Health 2023, 20, 934. [Google Scholar] [CrossRef]
  8. Zhang, R.; Liu, S.M.; Zheng, S.Y. Characterization of nano-to-micron sized respirable coal dust: Particle surface alteration and the health impact. J. Hazard. Mater. 2021, 413, 125447. [Google Scholar] [CrossRef]
  9. Li, X.L.; Liu, Z.T.; Qian, J.F.; Zhou, D. Analysis on the Changes of Functional Groups after Coal Dust Explosion at Different Concentrations Based on FTIR and XRD. Combust. Sci. Technol. 2021, 193, 2482–2504. [Google Scholar] [CrossRef]
  10. Sarver, E.; Keles, C.; Rezaee, M. Characteristics of respirable dust in eight appalachian coal mines: A dataset including particle size and mineralogy distributions, and metal and trace element mass concentrations. Data Brief 2019, 25, 104032. [Google Scholar] [CrossRef]
  11. LaBranche, N.; Keles, C.; Sarver, E.; Johnstone, K.; Cliff, D. Characterization of Particulates from Australian Underground Coal Mines. Minerals 2021, 11, 447. [Google Scholar] [CrossRef]
  12. Gonzalez, J.; Keles, C.; Pokhrel, N.; Jaramillo, L.; Sarver, E. Respirable dust constituents and particle size: A case study in a thin-seam coal mine. Min. Metall. Explor. 2022, 39, 1007–1015. [Google Scholar] [CrossRef]
  13. Zou, S.H.; Zhang, D.C.; Yin, W.; Zou, S. Study of dust production mechanisms during the rotary dumping of powdered materials in hemi-enclosed space. In Proceedings of the International Conference on Sustainable Energy and Environmental Engineering (ICSEEE 2012), Guangzhou, China, 29–30 December 2012; p. 1624. [Google Scholar]
  14. Silvester, S.A.; Lowndes, I.S.; Kingman, S.W.; Arroussi, A. Improved dust capture methods for crushing plant. Appl. Math. Model. 2007, 31, 311–331. [Google Scholar] [CrossRef]
  15. Huang, Z.; Ge, S.; Jing, D.; Yang, L. Numerical simulation of blasting dust pollution in open-pit mines. Appl. Ecol. Environ. Res. 2019, 17, 10313–10333. [Google Scholar] [CrossRef]
  16. Jia, L.; Wang, D.X.; Yu, C.W.; Liang, B. Research of Dust Transport Rule of Large Difference Chute Based on FLUENT. In Proceedings of the International Conference on Energy Development and Environmental Protection (EDEP), Nanjing, China, 17–19 August 2018; pp. 208–215. [Google Scholar]
  17. Ding, X.H.; Ao, Z.C.; Li, X.S.; Xiao, S.S.; Wu, M.; Xing, B.K.; Ge, R.H.; Zhang, D.H. The Mechanism of Plugging Open-Pit Mine Cannon Holes and the Modification of Plugging Materials. Sustainability 2023, 15, 4257. [Google Scholar] [CrossRef]
  18. Hua, Y.; Nie, W.; Cai, P.; Liu, Y.H.; Peng, H.T.; Liu, Q. Pattern characterization concerning spatial and temporal evolution of dust pollution associated with two typical ventilation methods at fully mechanized excavation faces in rock tunnels. Powder Technol. 2018, 334, 117–131. [Google Scholar] [CrossRef]
  19. Li, Y.J.; Wang, P.F.; Liu, R.H.; Han, H.; Tan, X.H.; Jiang, Y.D. Influence of the strip-shaped air-out slits’ width in the fully mechanized working face under wall-attached swirling ventilation condition. In Proceedings of the 1st International Symposium on Water Resource and Environmental Management (WREM), Kunming, China, 28–30 November 2018. [Google Scholar]
  20. Wu, T.; Yang, Z.; Wang, A.A.; Zhang, K.; Wang, B. A study on movement characteristics and distribution law of dust particles in open-pit coal mine. Sci. Rep. 2021, 11, 14703. [Google Scholar] [CrossRef]
  21. Tang, W.J.; Cai, Q.X. Dust distribution in open-pit mines based on monitoring data and fluent simulation. Environ. Monit. Assess. 2018, 190, 632. [Google Scholar] [CrossRef]
  22. Fardin, N.; Feng, Q.; Stephansson, O. Application of a new in situ 3D laser scanner to study the scale effect on the rock joint surface roughness. Int. J. Rock Mech. Min. Sci. 2004, 41, 329–335. [Google Scholar] [CrossRef]
  23. Lu, G.L.; Yao, X.W.; Li, X. The Study of Ventilation Dust Removal System in fully mechanized caving face with large inclination based on Fluent. In Proceedings of the 3rd International Workshop on Mine Hazards Prevention and Control, CSIRO Earth Sci & Resource Engn, Brisbane, Australia, 19–21 November 2013; pp. 134–139. [Google Scholar]
  24. Xie, X.; Liu, S.; Wang, Y.; Xu, Y.; Cao, X.; Zhang, C. Analysis of mechanical property of floor rocks at grout-reinforced working face based on ultrasonic detection: A case study in China. Arab. J. Geosci. 2022, 15, 1493. [Google Scholar] [CrossRef]
  25. Zhang, Z.Y.; Song, Y.Z.; Xu, X.Y.; Hou, D.Z. Enhanced Effect of Mining Dust Diffusion on Melting of the Adjacent Glacier: A Case Study in Xinjiang, China. Water 2023, 15, 224. [Google Scholar] [CrossRef]
  26. Xiu, Z.H.; Nie, W.; Cai, P.; Chen, D.W.; Zhang, X. Partially enclosed air curtain dust control technology to prevent pollution in a fully mechanized mining face. J. Environ. Chem. Eng. 2022, 10, 632. [Google Scholar] [CrossRef]
  27. Zhang, X.; Nie, W.; Peng, H.T.; Chen, D.W.; Du, T.; Yang, B.; Niu, W.J. Onboard air curtain dust removal method for longwall mining: Environmental pollution prevention. J. Environ. Chem. Eng. 2021, 9, 106387. [Google Scholar] [CrossRef]
  28. Gao, D.H.; Zhou, G.; Yang, Y.; Duan, J.J.; Kong, Y.; Meng, Q.Z. Design of pulse cleaning device for single-filter cartridge dust collector by multi-factor orthogonal method based numerical simulation. Powder Technol. 2021, 391, 494–509. [Google Scholar] [CrossRef]
  29. Ge, Y.F.; Cao, B.; Tang, H.M. Rock Discontinuities Identification from 3D Point Clouds Using Artificial Neural Network. Rock Mech. Rock Eng. 2022, 55, 1705–1720. [Google Scholar] [CrossRef]
  30. Cheng, L.; Jing, G.X.; Yang, S.Z.; Duan, Z.W. Experimental Study on Transmission Characteristics of Coal Dust Explosion in Confined Laneway Space. In Progress in Safety Science and Technology Series; United States Environmental Protection Agency: Washington, DC, USA, 2010; pp. 1536–1540. [Google Scholar]
  31. Geng, F.; Gui, C.G.; Teng, H.X.; Tang, J.H.; Niu, H.W.; Zhou, F.B.; Liu, C.; Hu, S.D.; Li, S.H. Dispersion characteristics of dust pollutant in a typical coal roadway under an auxiliary ventilation system. J. Clean. Prod. 2020, 275, 122889. [Google Scholar] [CrossRef]
  32. Saurabh, K.; Chaulya, S.K.; Singh, R.S.; Kumar, S.; Mishra, K.K. Intelligent dry fog dust suppression system: An efficient technique for controlling air pollution in the mineral processing plant. Clean Technol. Environ. Policy 2022, 24, 1037–1051. [Google Scholar] [CrossRef]
  33. Duan, Z.Y. Research on Dust Suppression of A Copper Mine Underground Middle Level Crushing Station. In Proceedings of the 2nd International Conference on Energy and Environmental Protection (ICEEP 2013), Guilin, China, 19–21 April 2013; pp. 907–912. [Google Scholar]
  34. Song, F.L.; Sheng, Z.J.; Xu, Z.S.; Lu, Q. A development of intelligent dry dust removal equipment for coal and ash handling system of thermal power plant. In Proceedings of the 1st International Conference on Energy and Environmental Protection (ICEEP 2012), Hohhot, China, 23–24 June 2012; pp. 2283–2287. [Google Scholar]
  35. Ge, S.C.; Shao, L.S.; Zhang, Q.F.; Jing, D.J. Simulation Study of a Feasible Dry-type Dust Control Plan. In Proceedings of the International Symposium on Safety Science and Technology, Beijing, China, 24–27 September 2008; pp. 1736–1738. [Google Scholar]
  36. Wu, D.M.; Gao, J.; Lu, K. Dust Control Technology in Dry Directional Drilling in Soft and Broken Coal Seams. Energies 2022, 15, 3804. [Google Scholar] [CrossRef]
  37. Wang, J.C.; Xu, H.H.; Zou, J.P. Fine detection technology of rock mass structure based on borehole acousto-optic combined measurement. Measurement 2022, 187, 110259. [Google Scholar] [CrossRef]
  38. Ifelola, E.O.; Afu, D.J. Development of an Integrated Dust Collector and Local Exhaust Ventilation System for Controlling Industrial Mine Dust. In Proceedings of the 4th International Conference on Engineering Research and Development (ICERD 2012), Benin, Nigeria, 4–6 September 2012; pp. 217–224. [Google Scholar]
  39. Li, Y.C.; Liu, J.; Liu, B. Study on dust collection and removal systems in heading face based on air curtain technology. In Proceedings of the International Mining Forum on Mine Safety and Efficient Exploitation Facing Challenge of the 21st Century, Huainan, China, 19–22 September 2010; pp. 299–305. [Google Scholar]
  40. Szymczykiewicz, K.E. The influence of dust originated in different coal mines on pneumoconiotic changes in white rats. Med. Pr. 1982, 33, 171–181. [Google Scholar]
  41. Liu, H.L.; Zhang, W.; Fang, Y.J.; Yang, H.L.; Tian, L.; Li, K.; Lai, W.Q.; Bian, L.P.; Lin, B.C.; Liu, X.H.; et al. Neurotoxicity of aluminum oxide nanoparticles and their mechanistic role in dopaminergic neuron injury involving p53-related pathways. J. Hazard. Mater. 2020, 392, 122312. [Google Scholar] [CrossRef] [PubMed]
  42. Zhang, X.; Zhang, Z.; Wang, P.; Xiao, S.Y.; Han, K.; Tang, Y.L.; Liu, H.L.; Bai, Y.P.; Jin, Y.L.; Li, J.L.; et al. Comparison of properties of dust in alveolar of rats and the workplace. Exp. Lung Res. 2021, 47, 239–249. [Google Scholar] [CrossRef] [PubMed]
Figure 1. Dust concentration meter placement map and data extraction.
Sustainability 15 12202 g001
Figure 2. 3D modelling of the crushing station discharge opening.
Sustainability 15 12202 g002
Figure 3. Geometric model of the open pit crushing station.
Sustainability 15 12202 g003
Figure 4. 28 s dust dispersion map at 100 m from the crushing station.
Sustainability 15 12202 g004
Figure 5. Crushing station discharge port dust concentration data.
Sustainability 15 12202 g005
Figure 6. Particle size distribution of settled ground dust.
Sustainability 15 12202 g006
Figure 7. Airborne dust particle size share diagram.
Sustainability 15 12202 g007
Figure 8. Dust sample XRD test results.
Sustainability 15 12202 g008
Figure 9. Dust sample XRF test results.
Sustainability 15 12202 g009
Figure 10. Trace element content.
Sustainability 15 12202 g010
Figure 11. Fluent simulated dust fugitive 5–30 s concentration map.
Sustainability 15 12202 g011
Figure 12. 5–30 s dust rise from discharge at 5 m from crushing station.
Sustainability 15 12202 g012
Figure 13. Dust velocity cloud map.
Sustainability 15 12202 g013
Figure 14. Dust particle trajectory diagram.
Sustainability 15 12202 g014
Figure 15. Fluent numerical simulation of dust movement vector diagram.
Sustainability 15 12202 g015
Figure 16. Fluent simulation of dust motion velocity clouds.
Sustainability 15 12202 g016
Figure 17. Fluent numerical simulation of velocity vector plots.
Sustainability 15 12202 g017
Figure 18. Dust particle transport trajectory.
Sustainability 15 12202 g018
Table 1. JCF-6H direct reading dust detector product parameters.
NameModelFunctional Parameters
Direct reading dust detectorJCF-6HDust measurement class: PM10, PM2.5, TSP;
Respirable dust measurement range: 0.001–10 mg/m3; Large range in TSP mode: 100 mg/m3;
Detection sensitivity: 0.001 mg/m3;
Repeatability error: ≤±2%;
Measuring particle size class: (0.3, 0.5, 0.7, 1.0, 2.5, 5.0) μm;
Measuring particle concentration range: 1–999,999 capsules;
Air sampling flow rate: 2.0 L/min (0.1 ft3/min);
Sampling time: 1 min, 2 min, 30 min, manual arbitrary time.
Table 2. Jet source parameter setting table (discrete phase).
InjectionUnitDefine
Injection Surface
Release from surfaces Inlet
Diameter distribution rosin-rammler
Start times0
Stop times30
Minimum diameter mPm2.5 2.5 × 10⁻⁶
Maximum diameter mPm100 1 × 10⁻⁴
Mean diameter mPM10 1 × 10⁻⁵
Spread parameter 1.12
Total flow ratekg/s0.004
Time scale constant 0.15
Inlet Velocity Magnitude m/s5
Turbulence Intensity %3.4
Table 3. Calculation of model parameter settings.
ModelDefine
TimeTransient
GravityY = −9.81 m/s2
Viscous Modelk-epsilon realizable
EnergyOff
Pressure-Velocity Coupling Pressure DiscretizationON
SIMPLEC
Disclaimer/Publisher’s Note: The statements, opinions and data contained in all publications are solely those of the individual author(s) and contributor(s) and not of MDPI and/or the editor(s). MDPI and/or the editor(s) disclaim responsibility for any injury to people or property resulting from any ideas, methods, instructions or products referred to in the content.

