


Subjective and Simulation-Based Analysis of Discomfort Glare Metrics in Office Buildings with Light Shelf Systems
 ,
,  , and
, and
Abstract
:1. Introduction
- Visual Comfort Probability (VCP): This index initially was introduced in order to evaluate discomfort glare probability [16,25] and then it was edited for use in various lighting systems. VCP was only developed to evaluate typical sizes, such as ceiling-mounted lights with uniform illumination. Therefore, it is not suitable for evaluating non-uniform illuminance or for predicting daylight glare [26,27].
- Discomfort Glare Index (DGI): This index is derived from the CGI and its purpose is to predict the glare caused by large glare sources such as a window [29]. The metric is based on subjective ratings from human subjects in a daylit office space. The DGI value is associated with different levels of discomfort glare. A value of 22 is considered a logically acceptable threshold [30,31,32].
- Daylight Glare Probability (DGP): To determine glare, DGP combines vertical eye illuminance with elements of existing glare indices. In comparison with the existing glare indices, DGP shows a very strong correlation with occupants’ glare perception [6,18,21,23,35]. A comparison between glare metrics values is tabulated in Table 1.
2. Methodology
2.1. Initial Data Collection
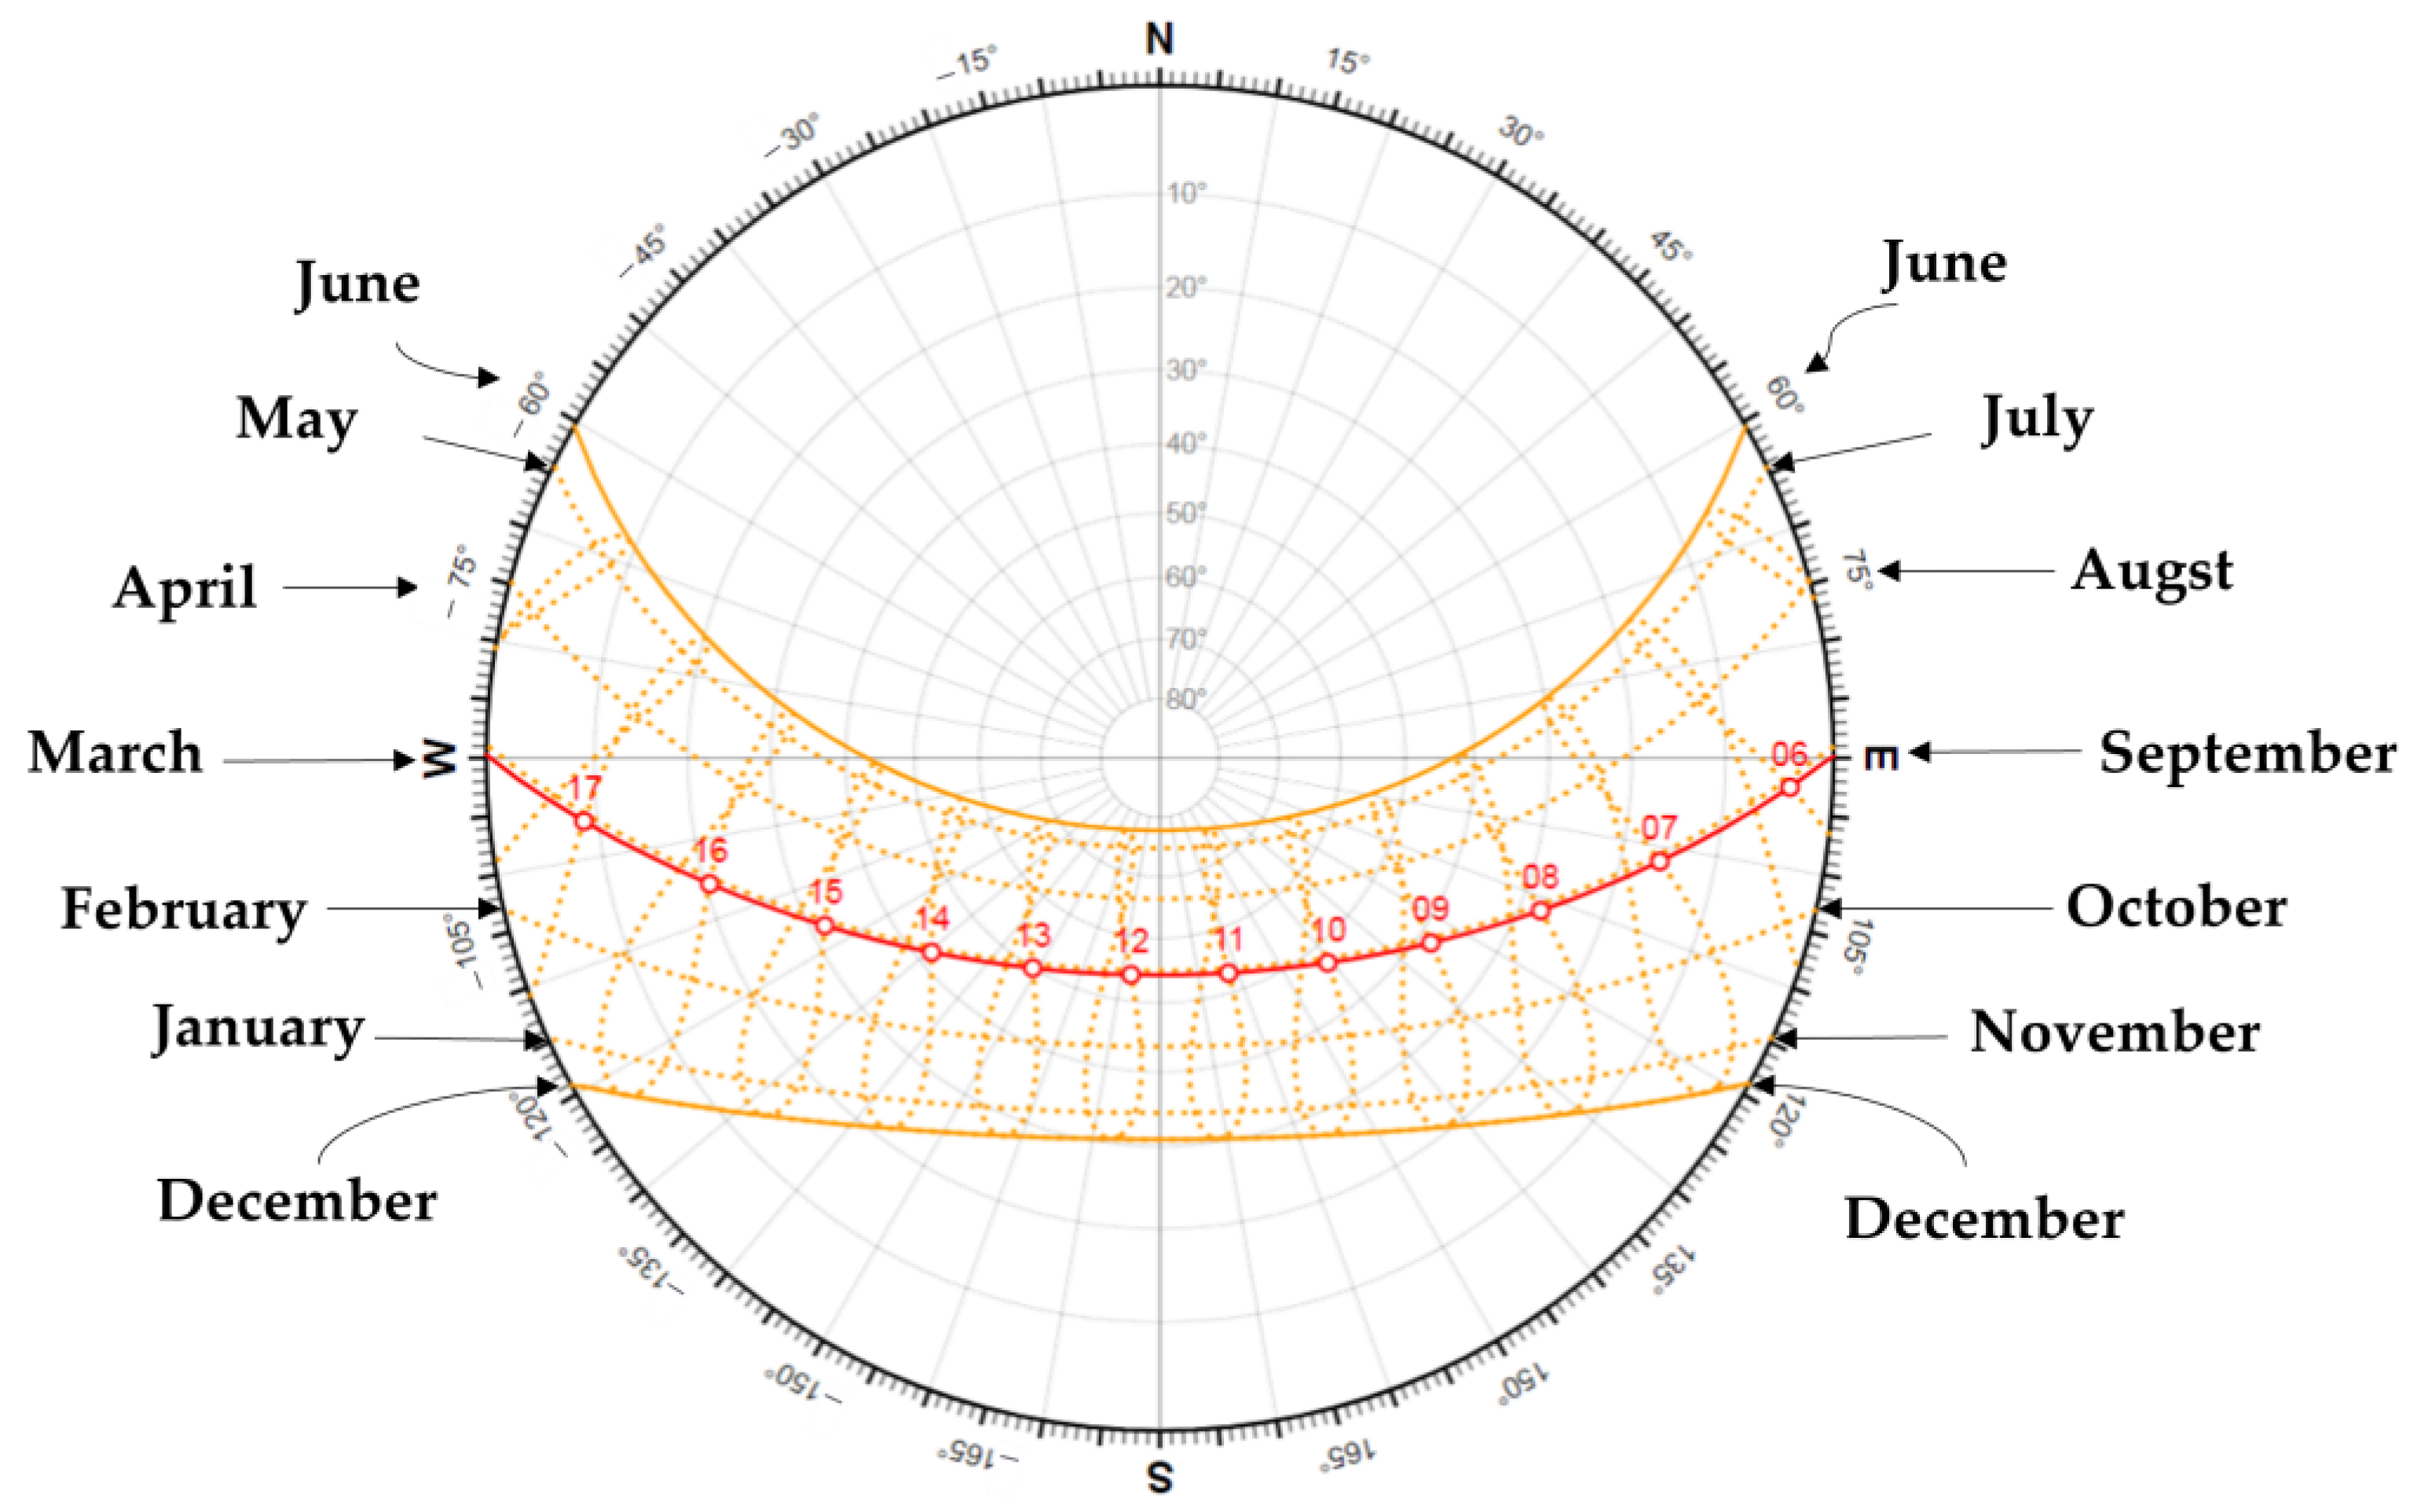
2.1.1. Climatic Data of the Case Study Location
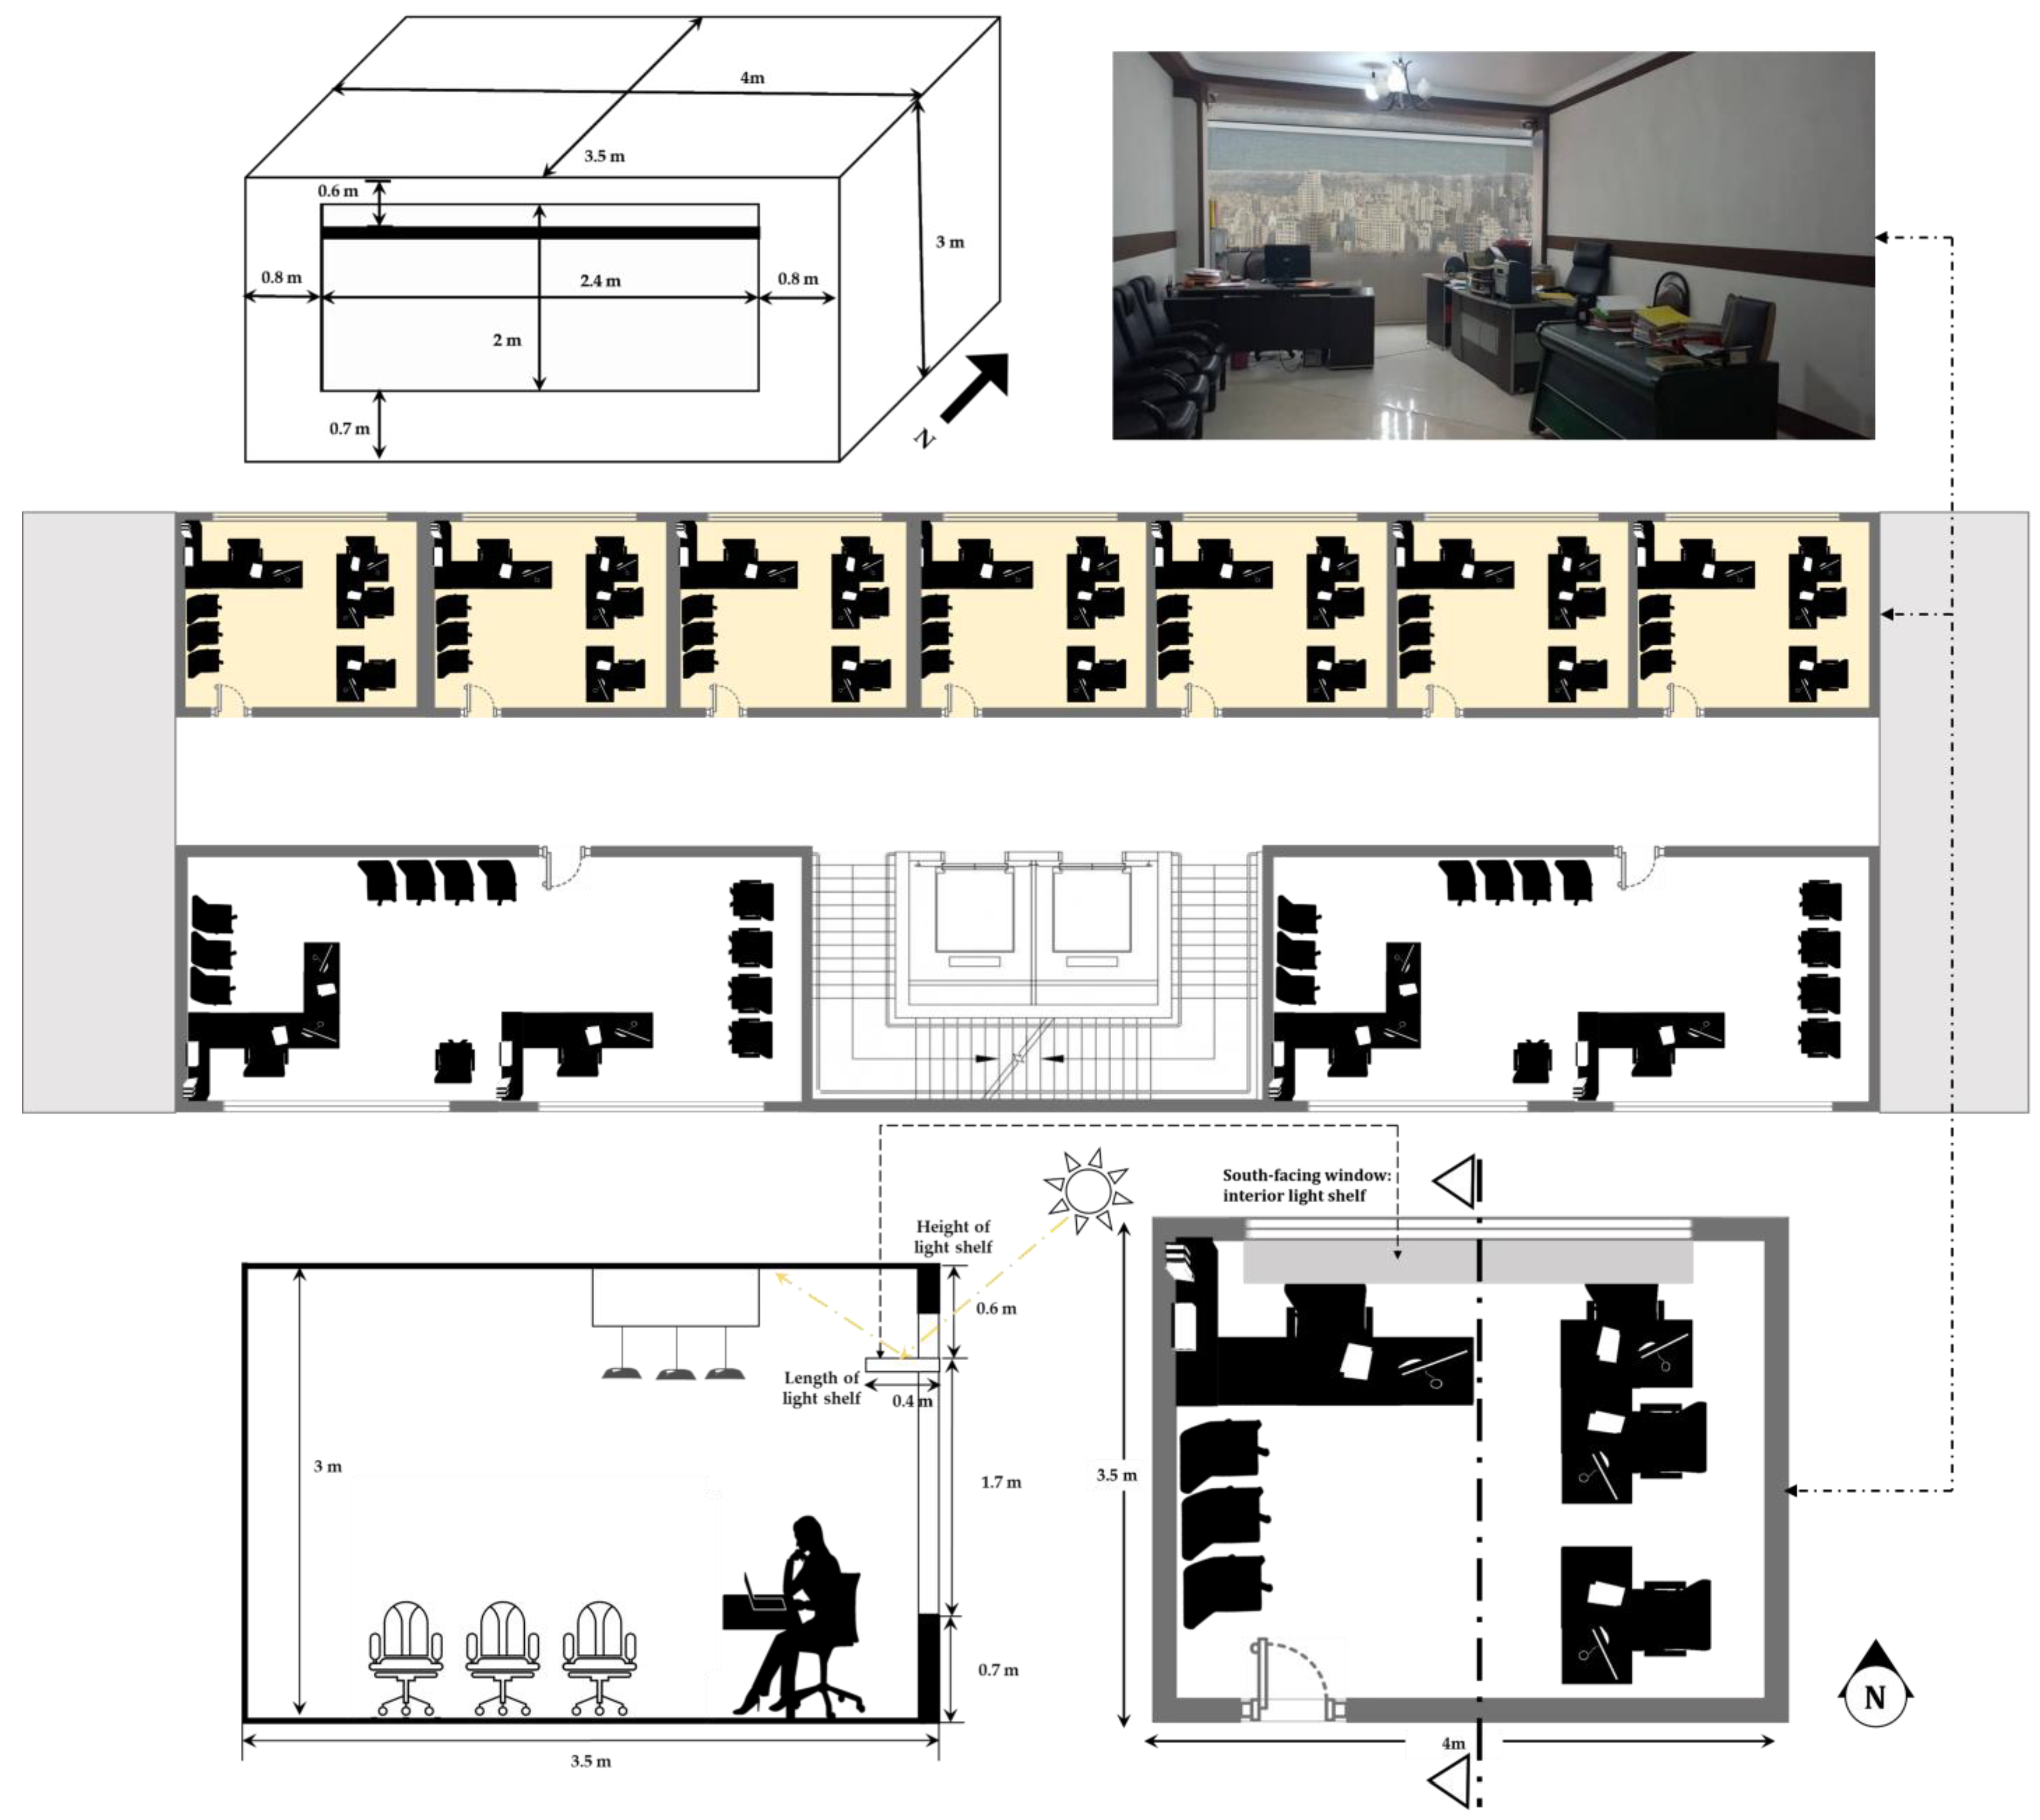
2.1.2. Physical Characteristics of the Case Study
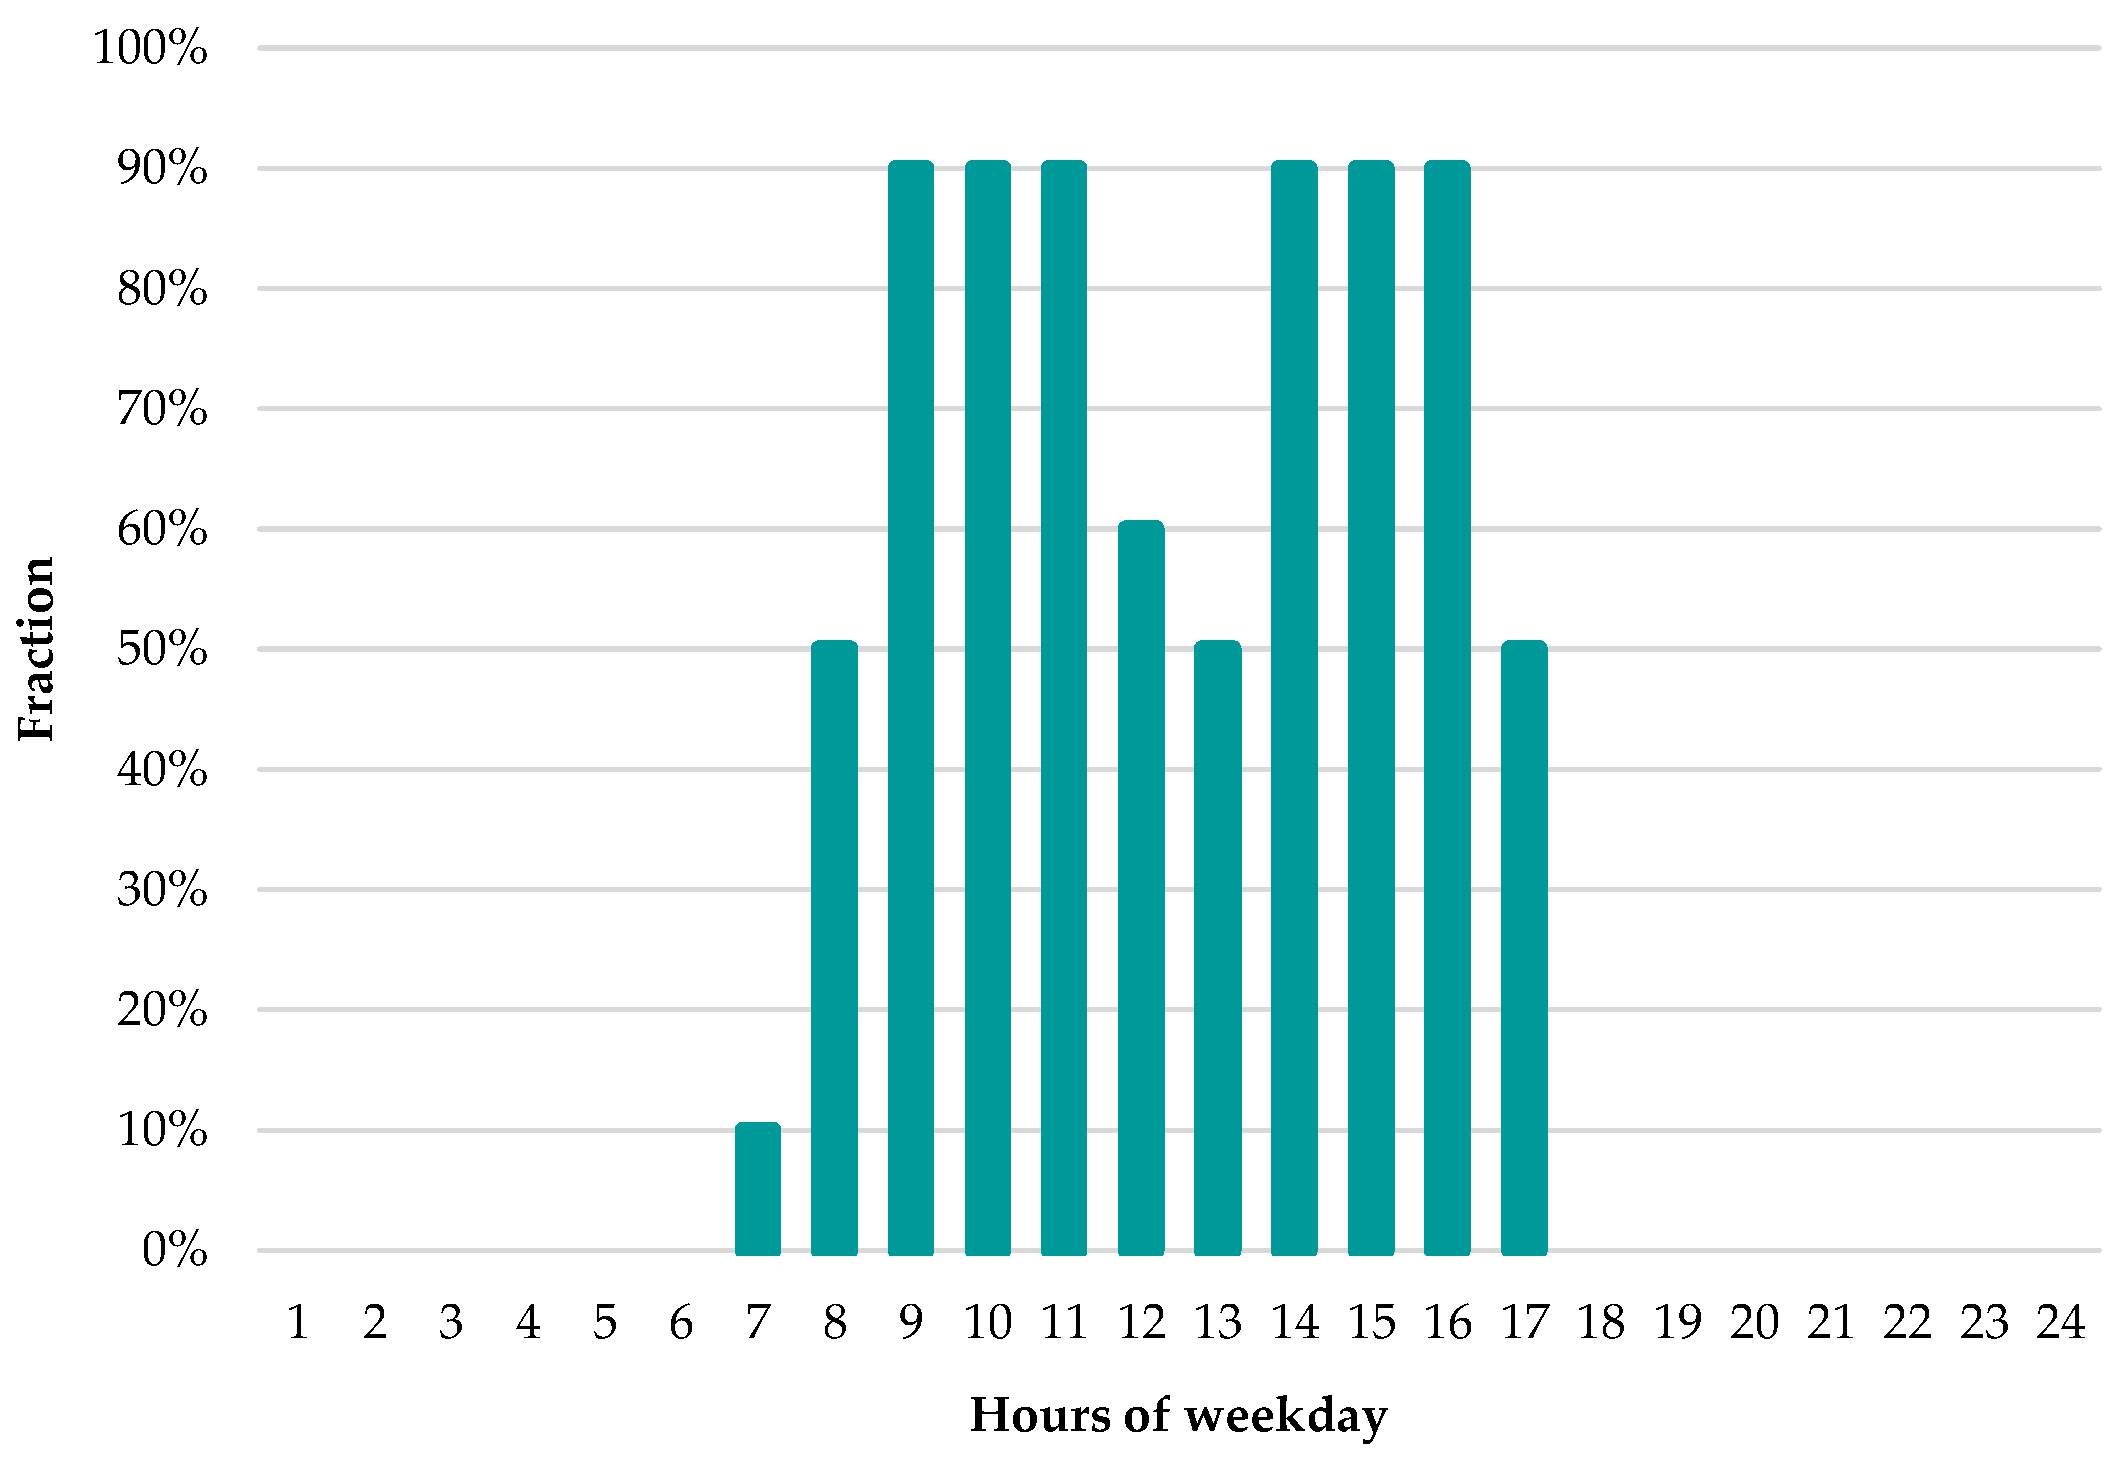
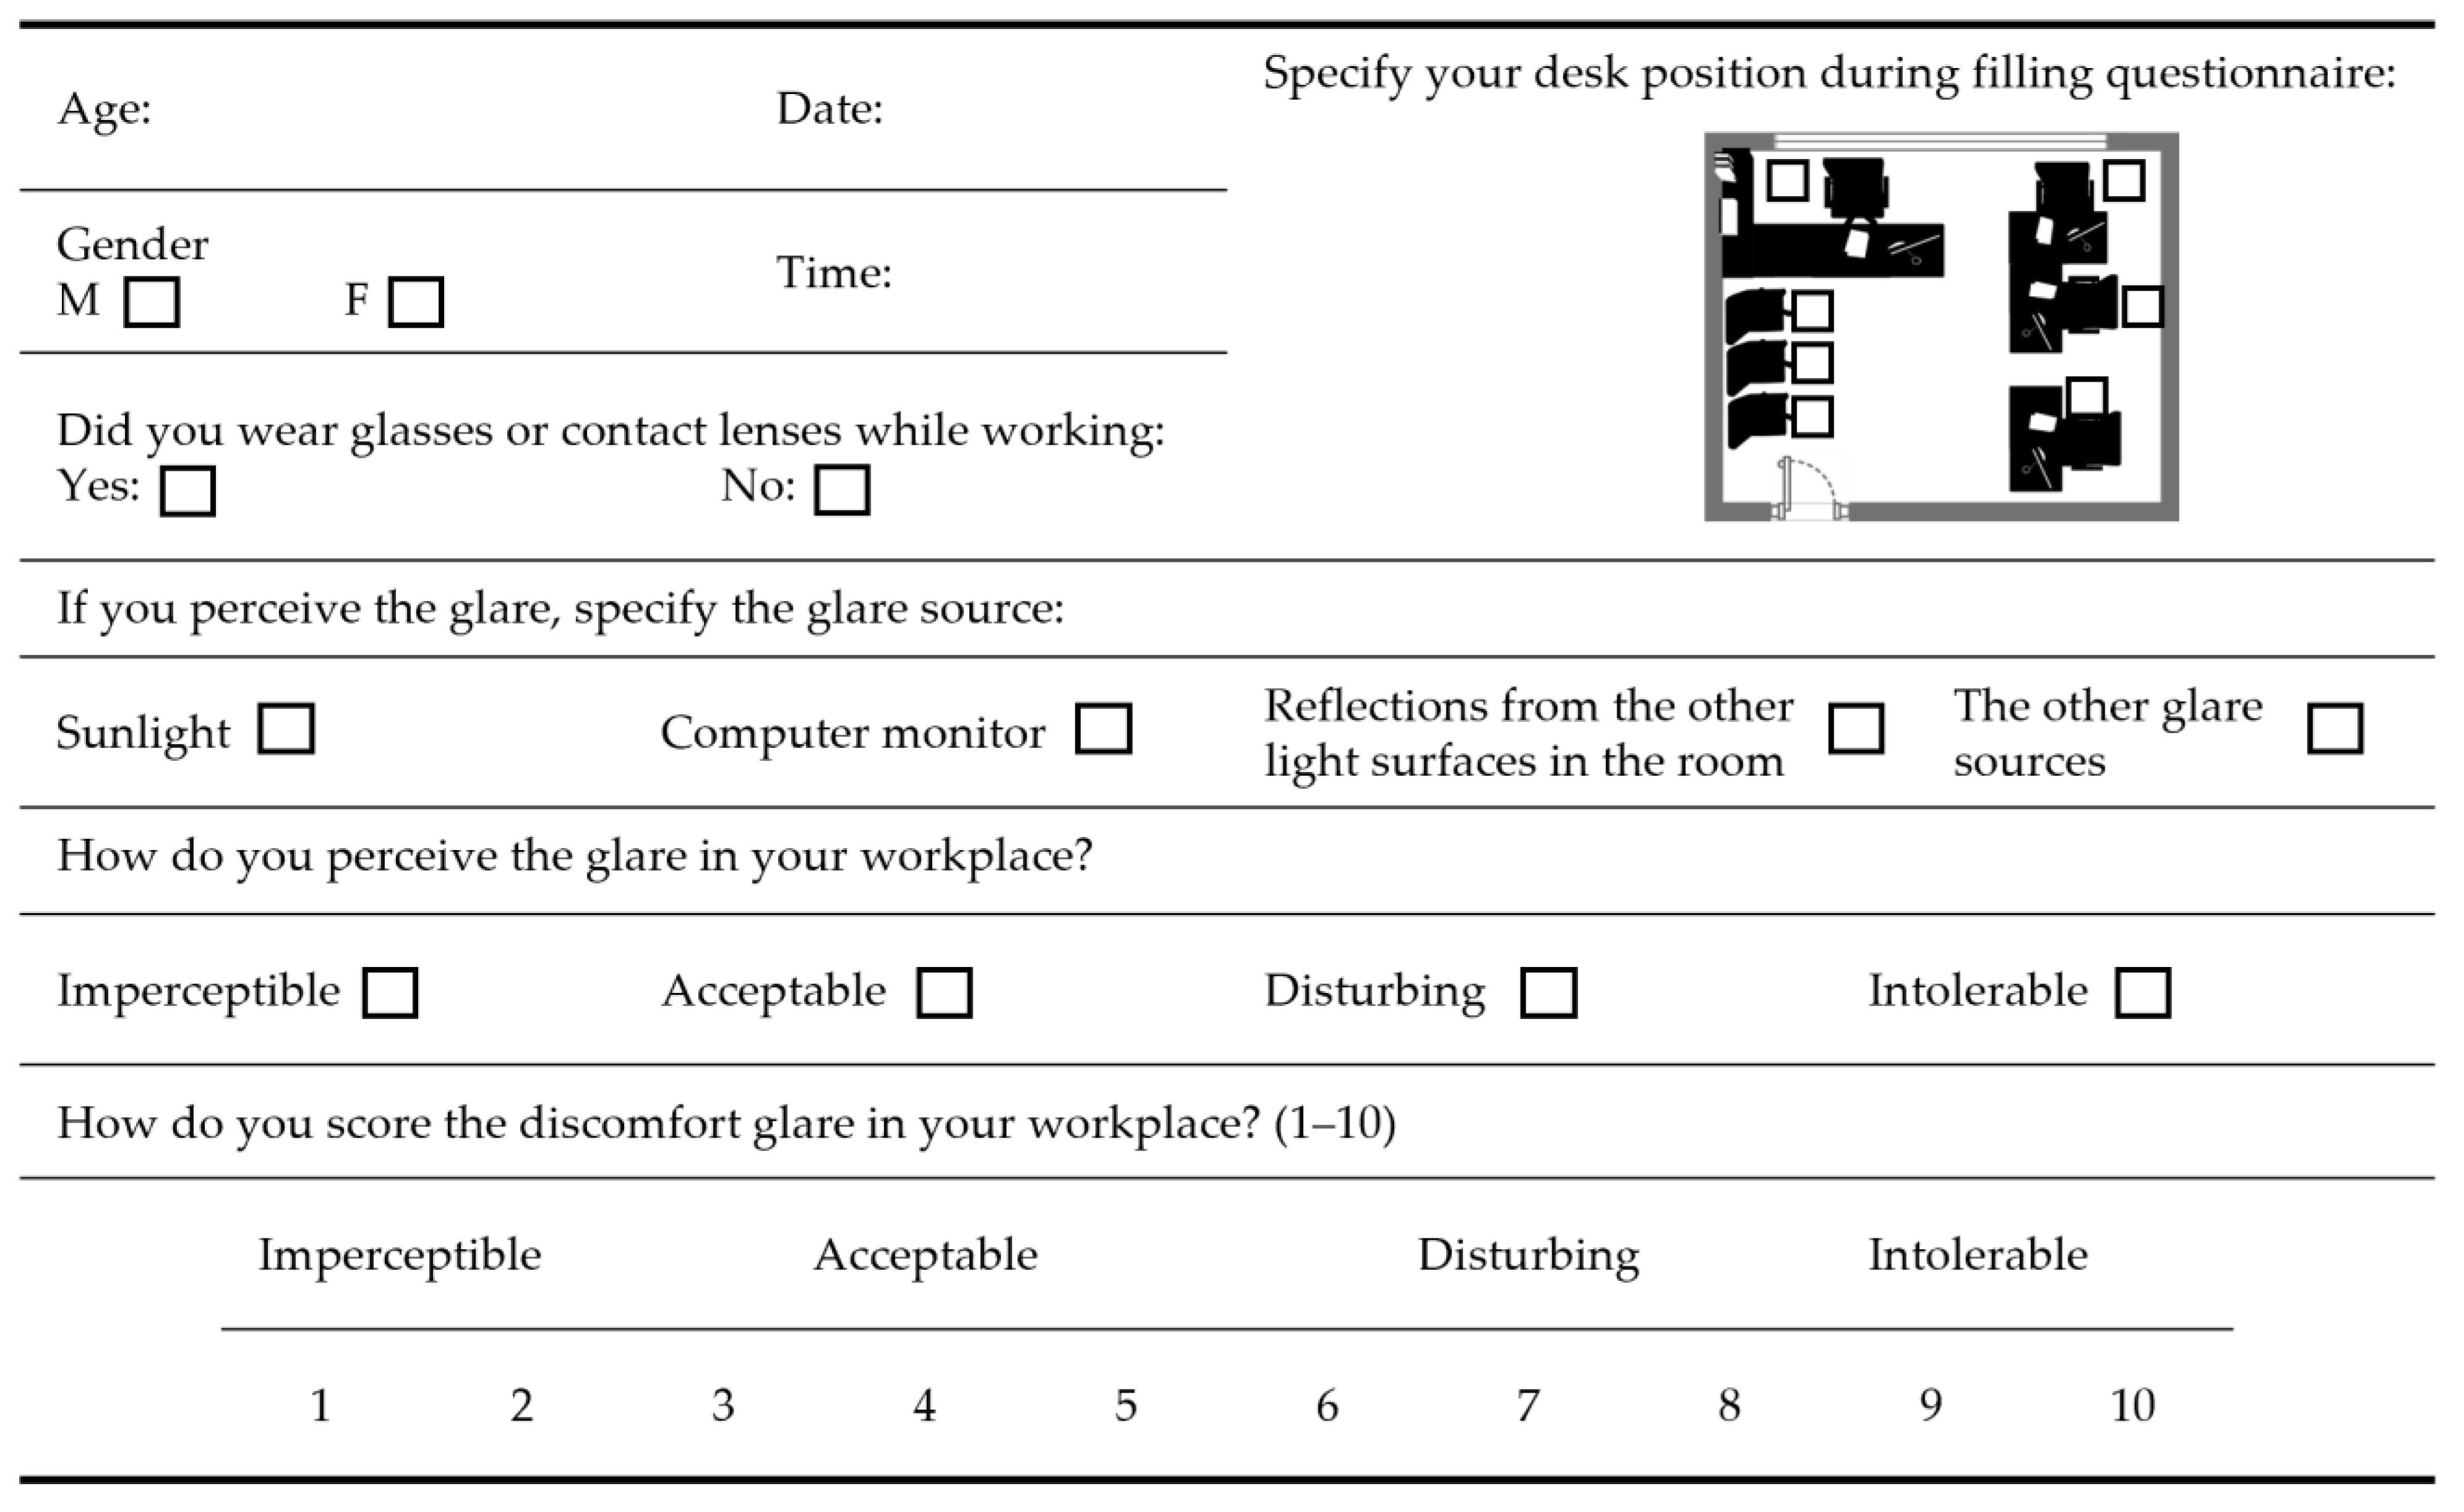
2.2. Subjective Data Collection
2.3. Simulation Data Set
2.4. Analysis Process
2.5. Discomfort Glare Metrics Rating Process
3. Results
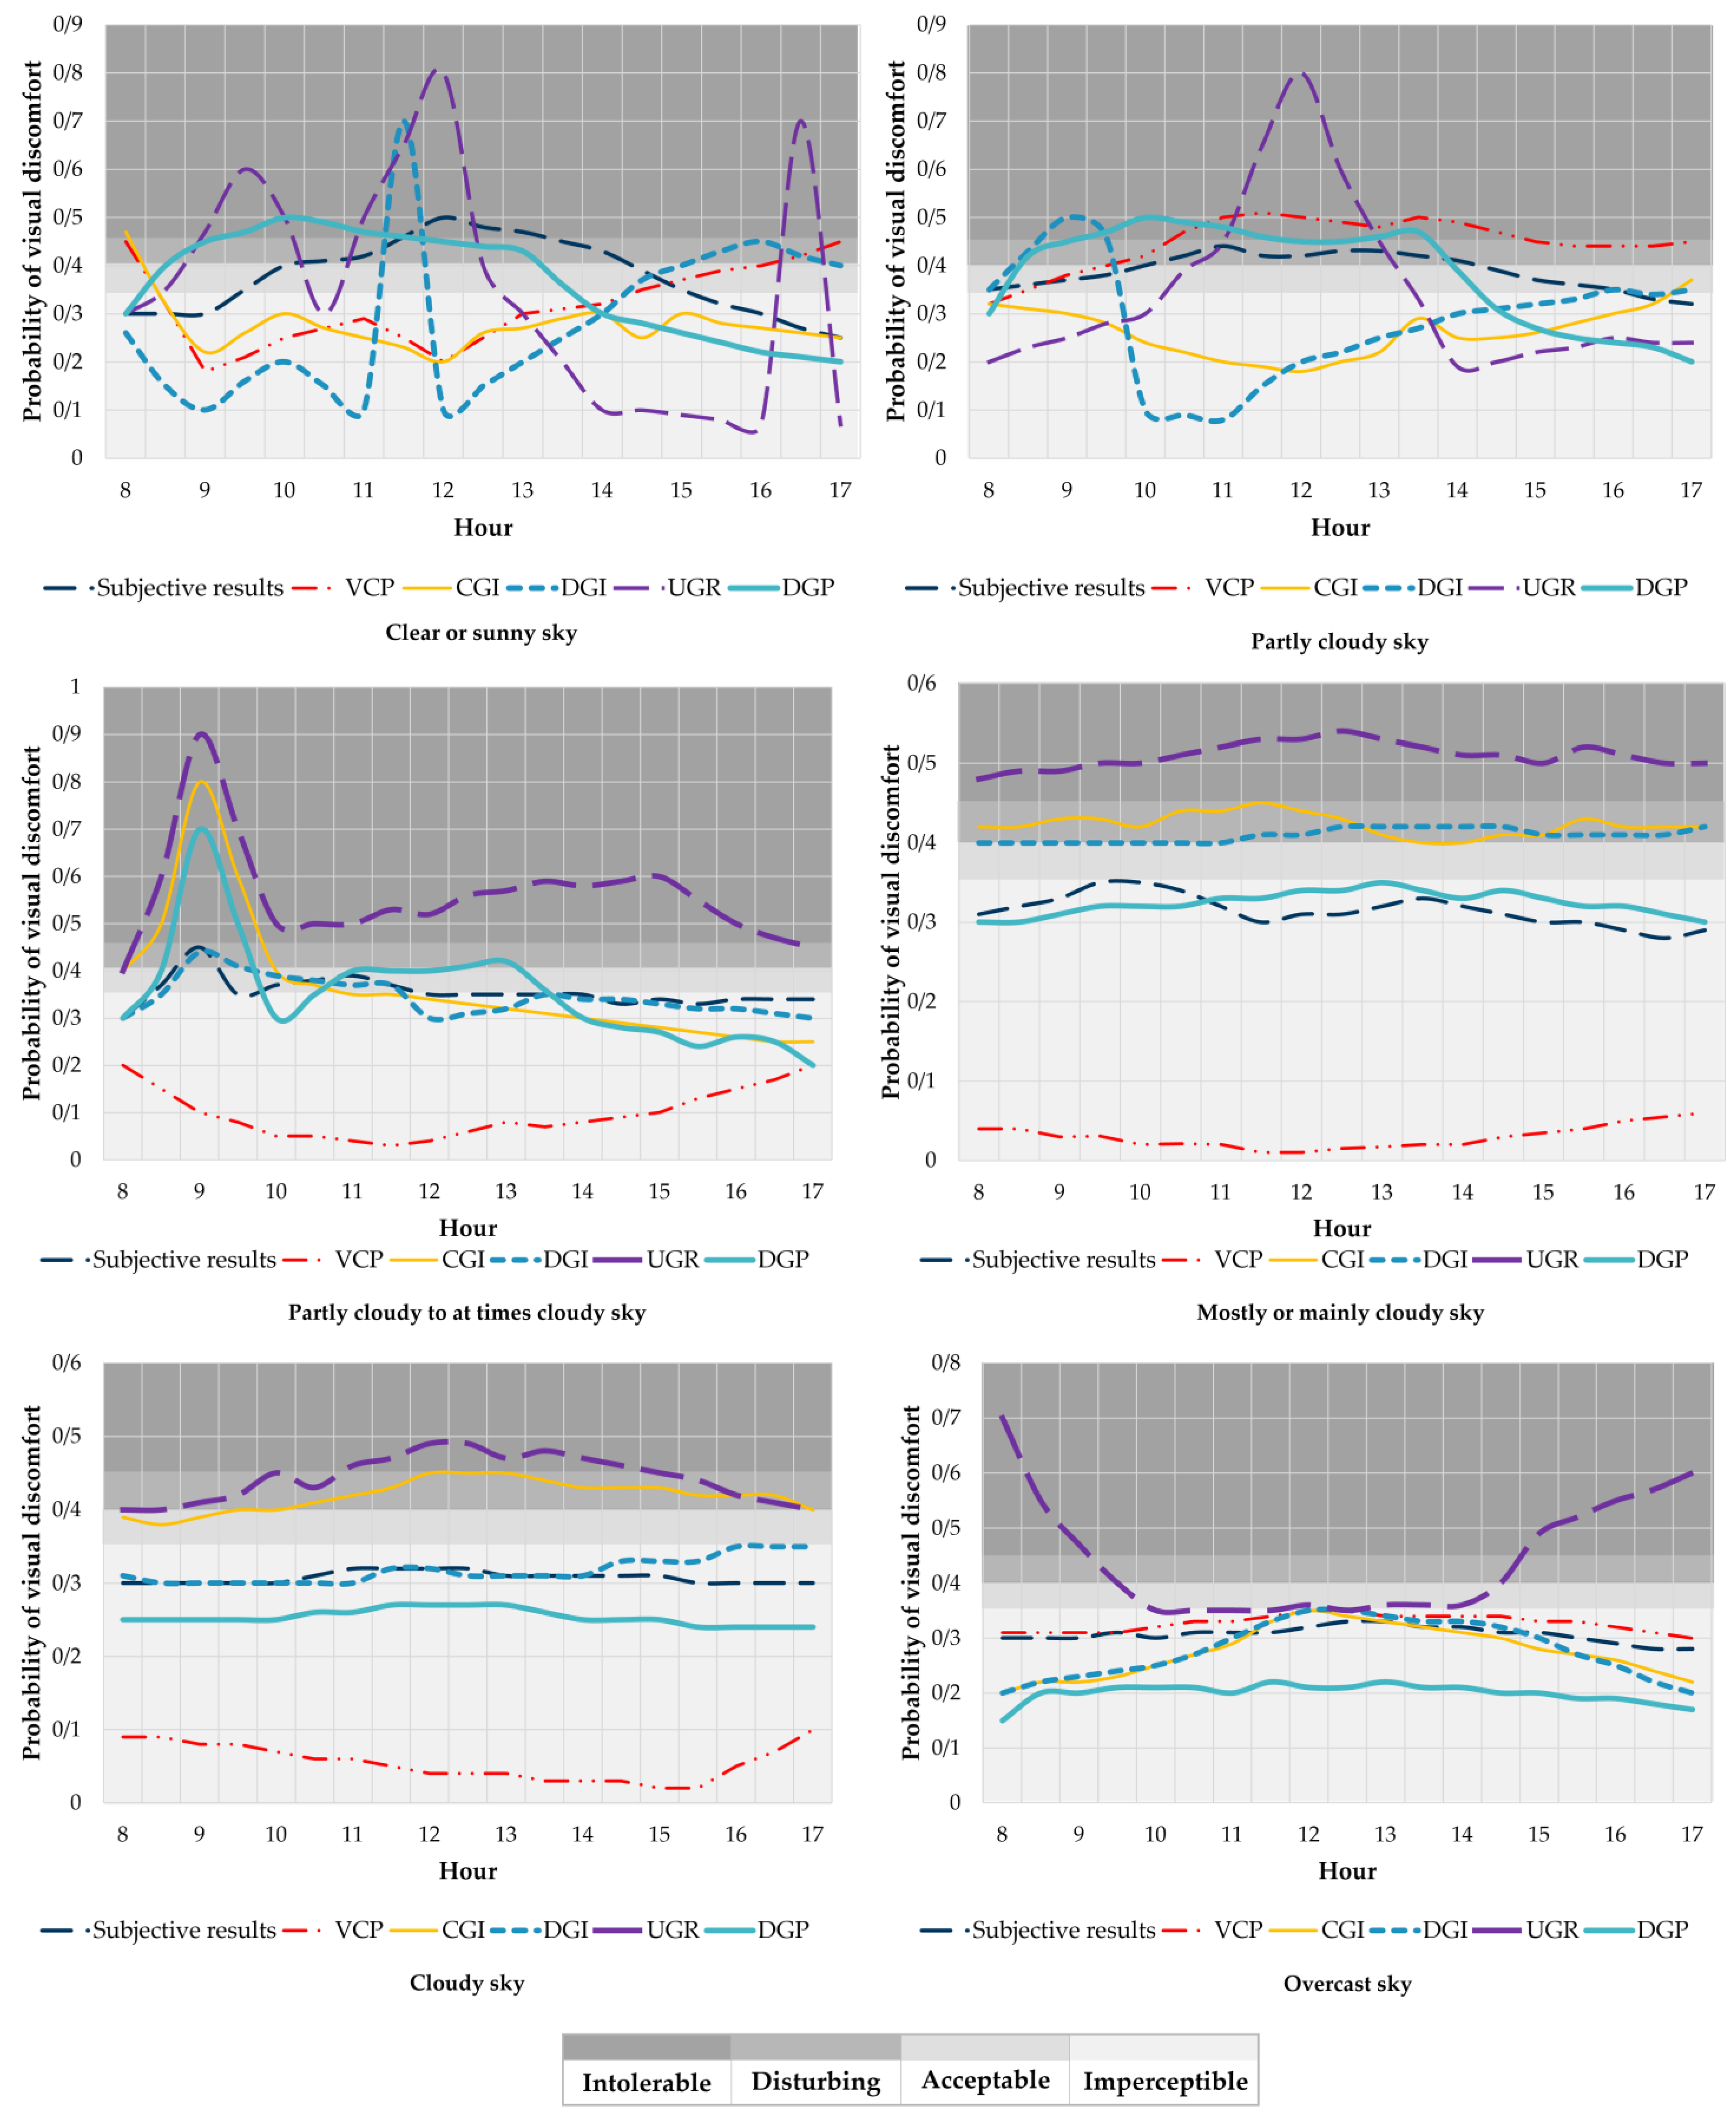
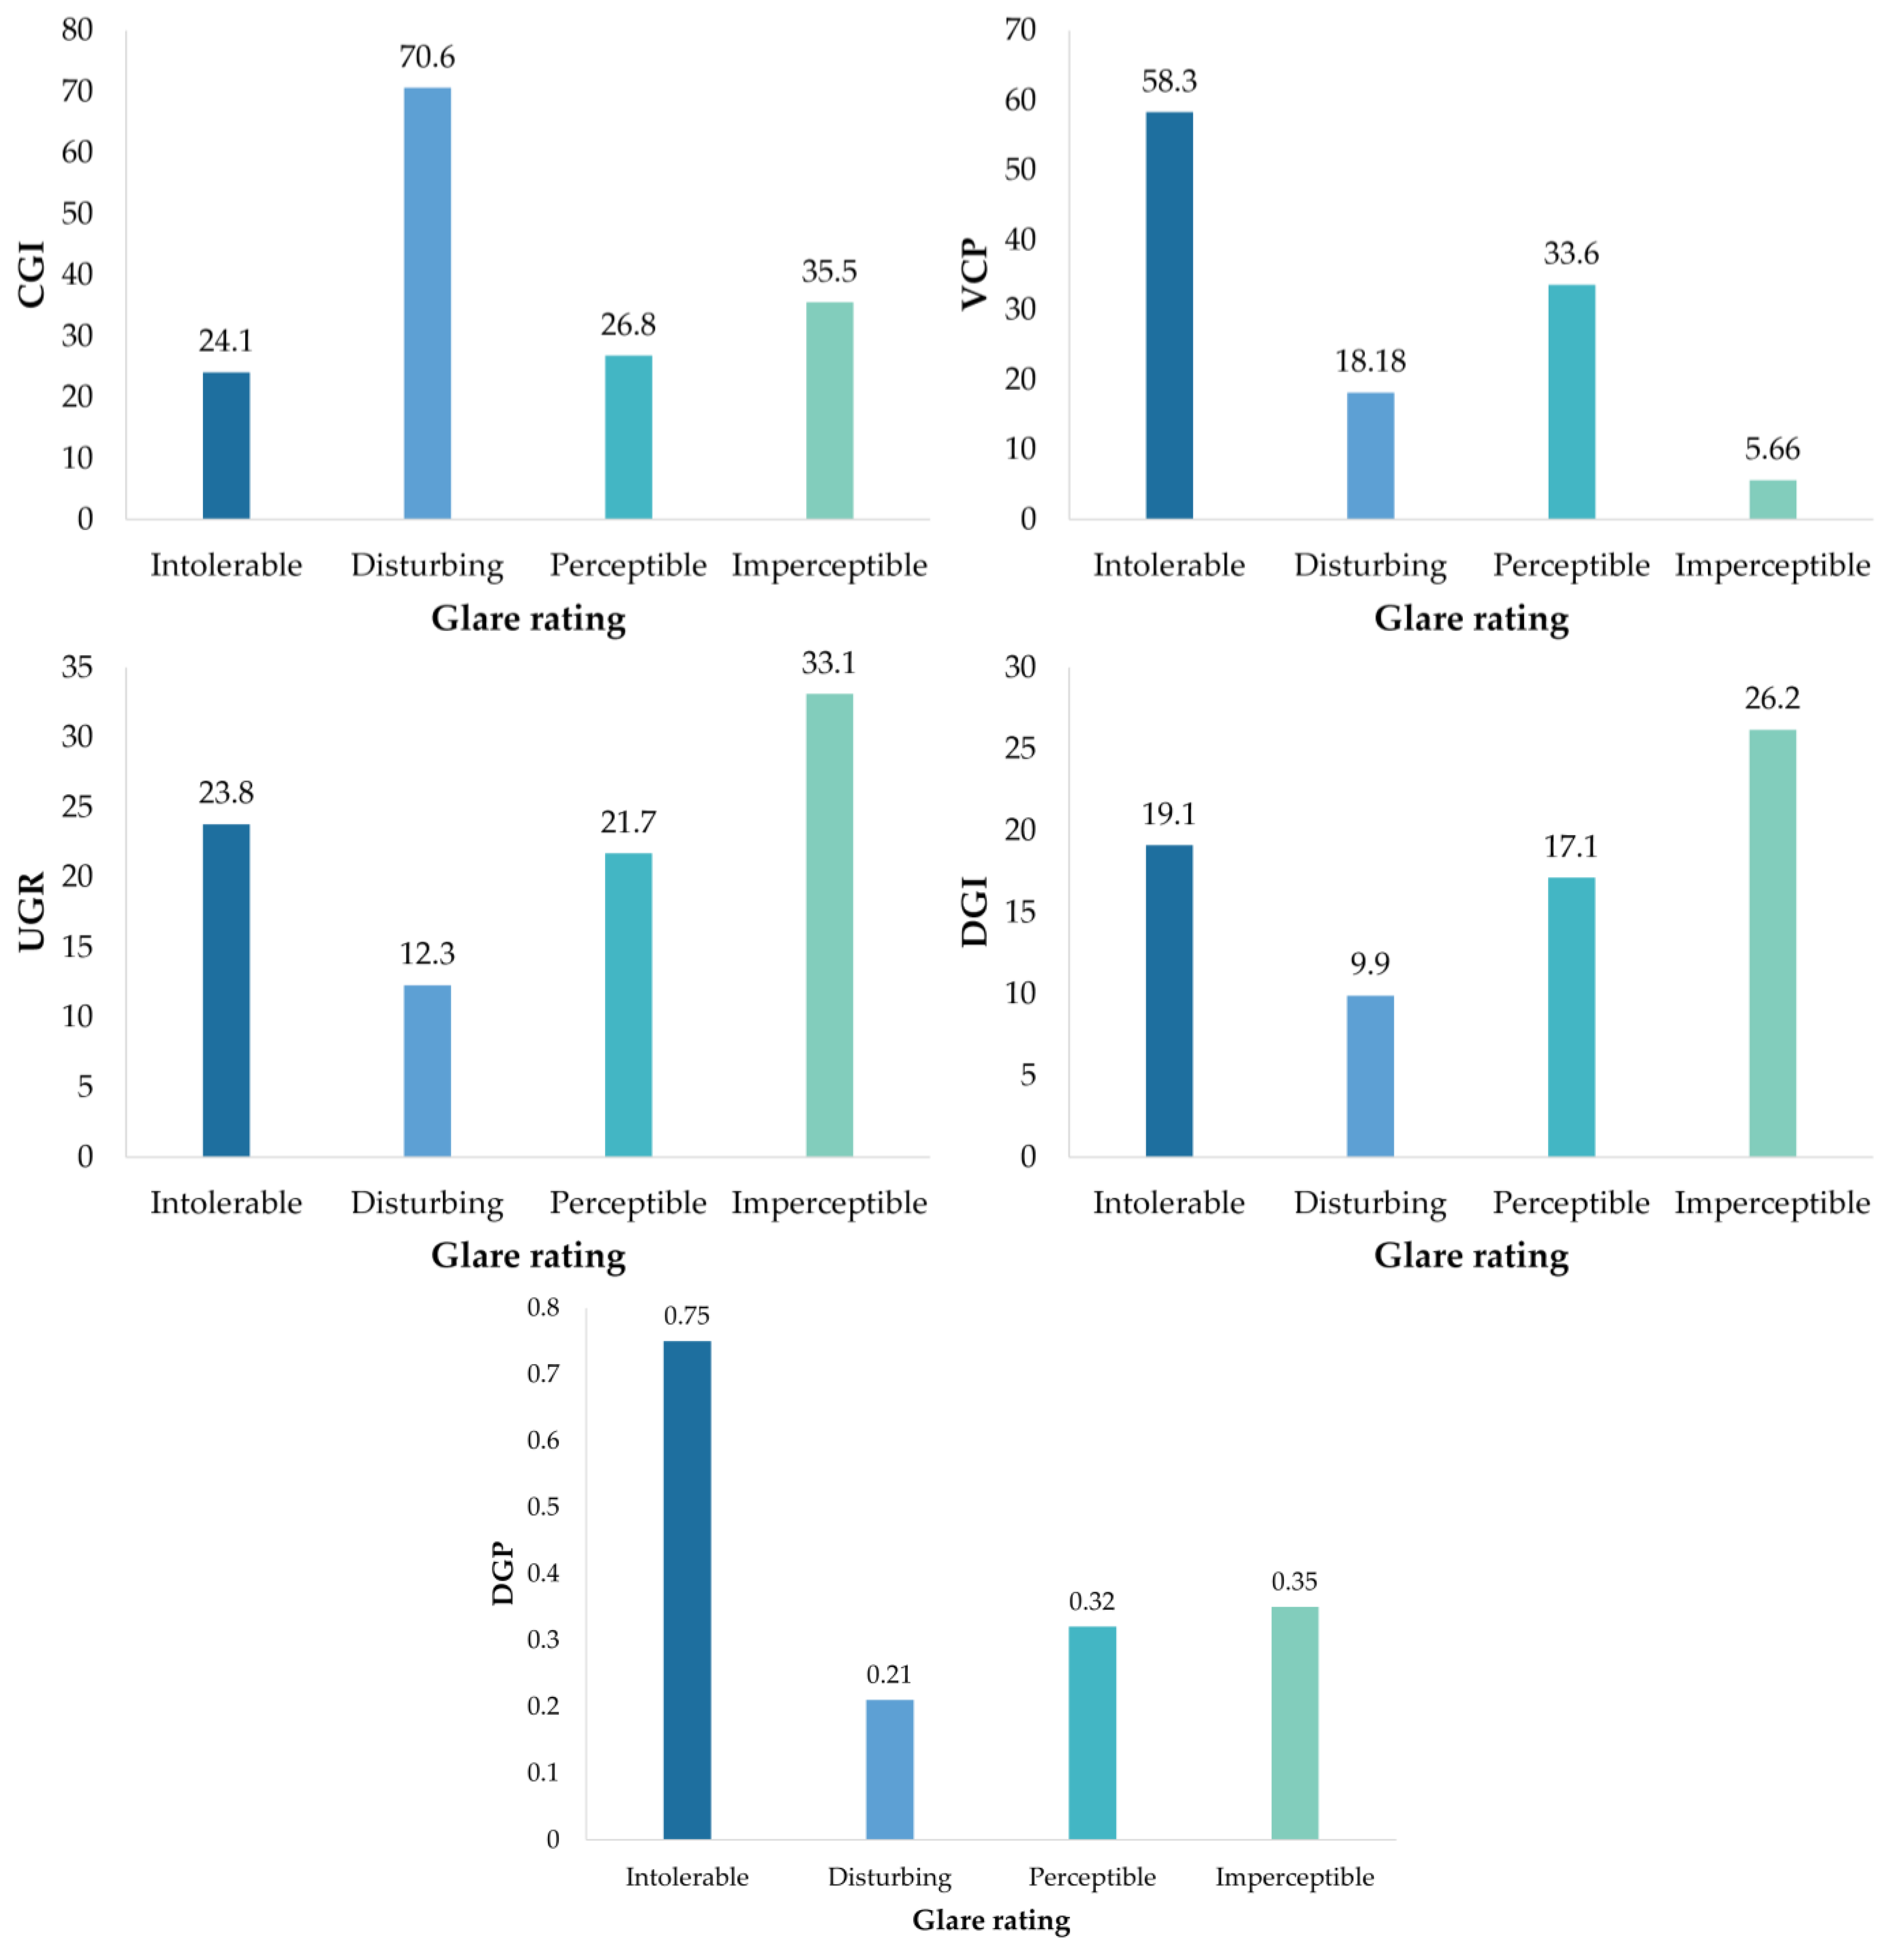
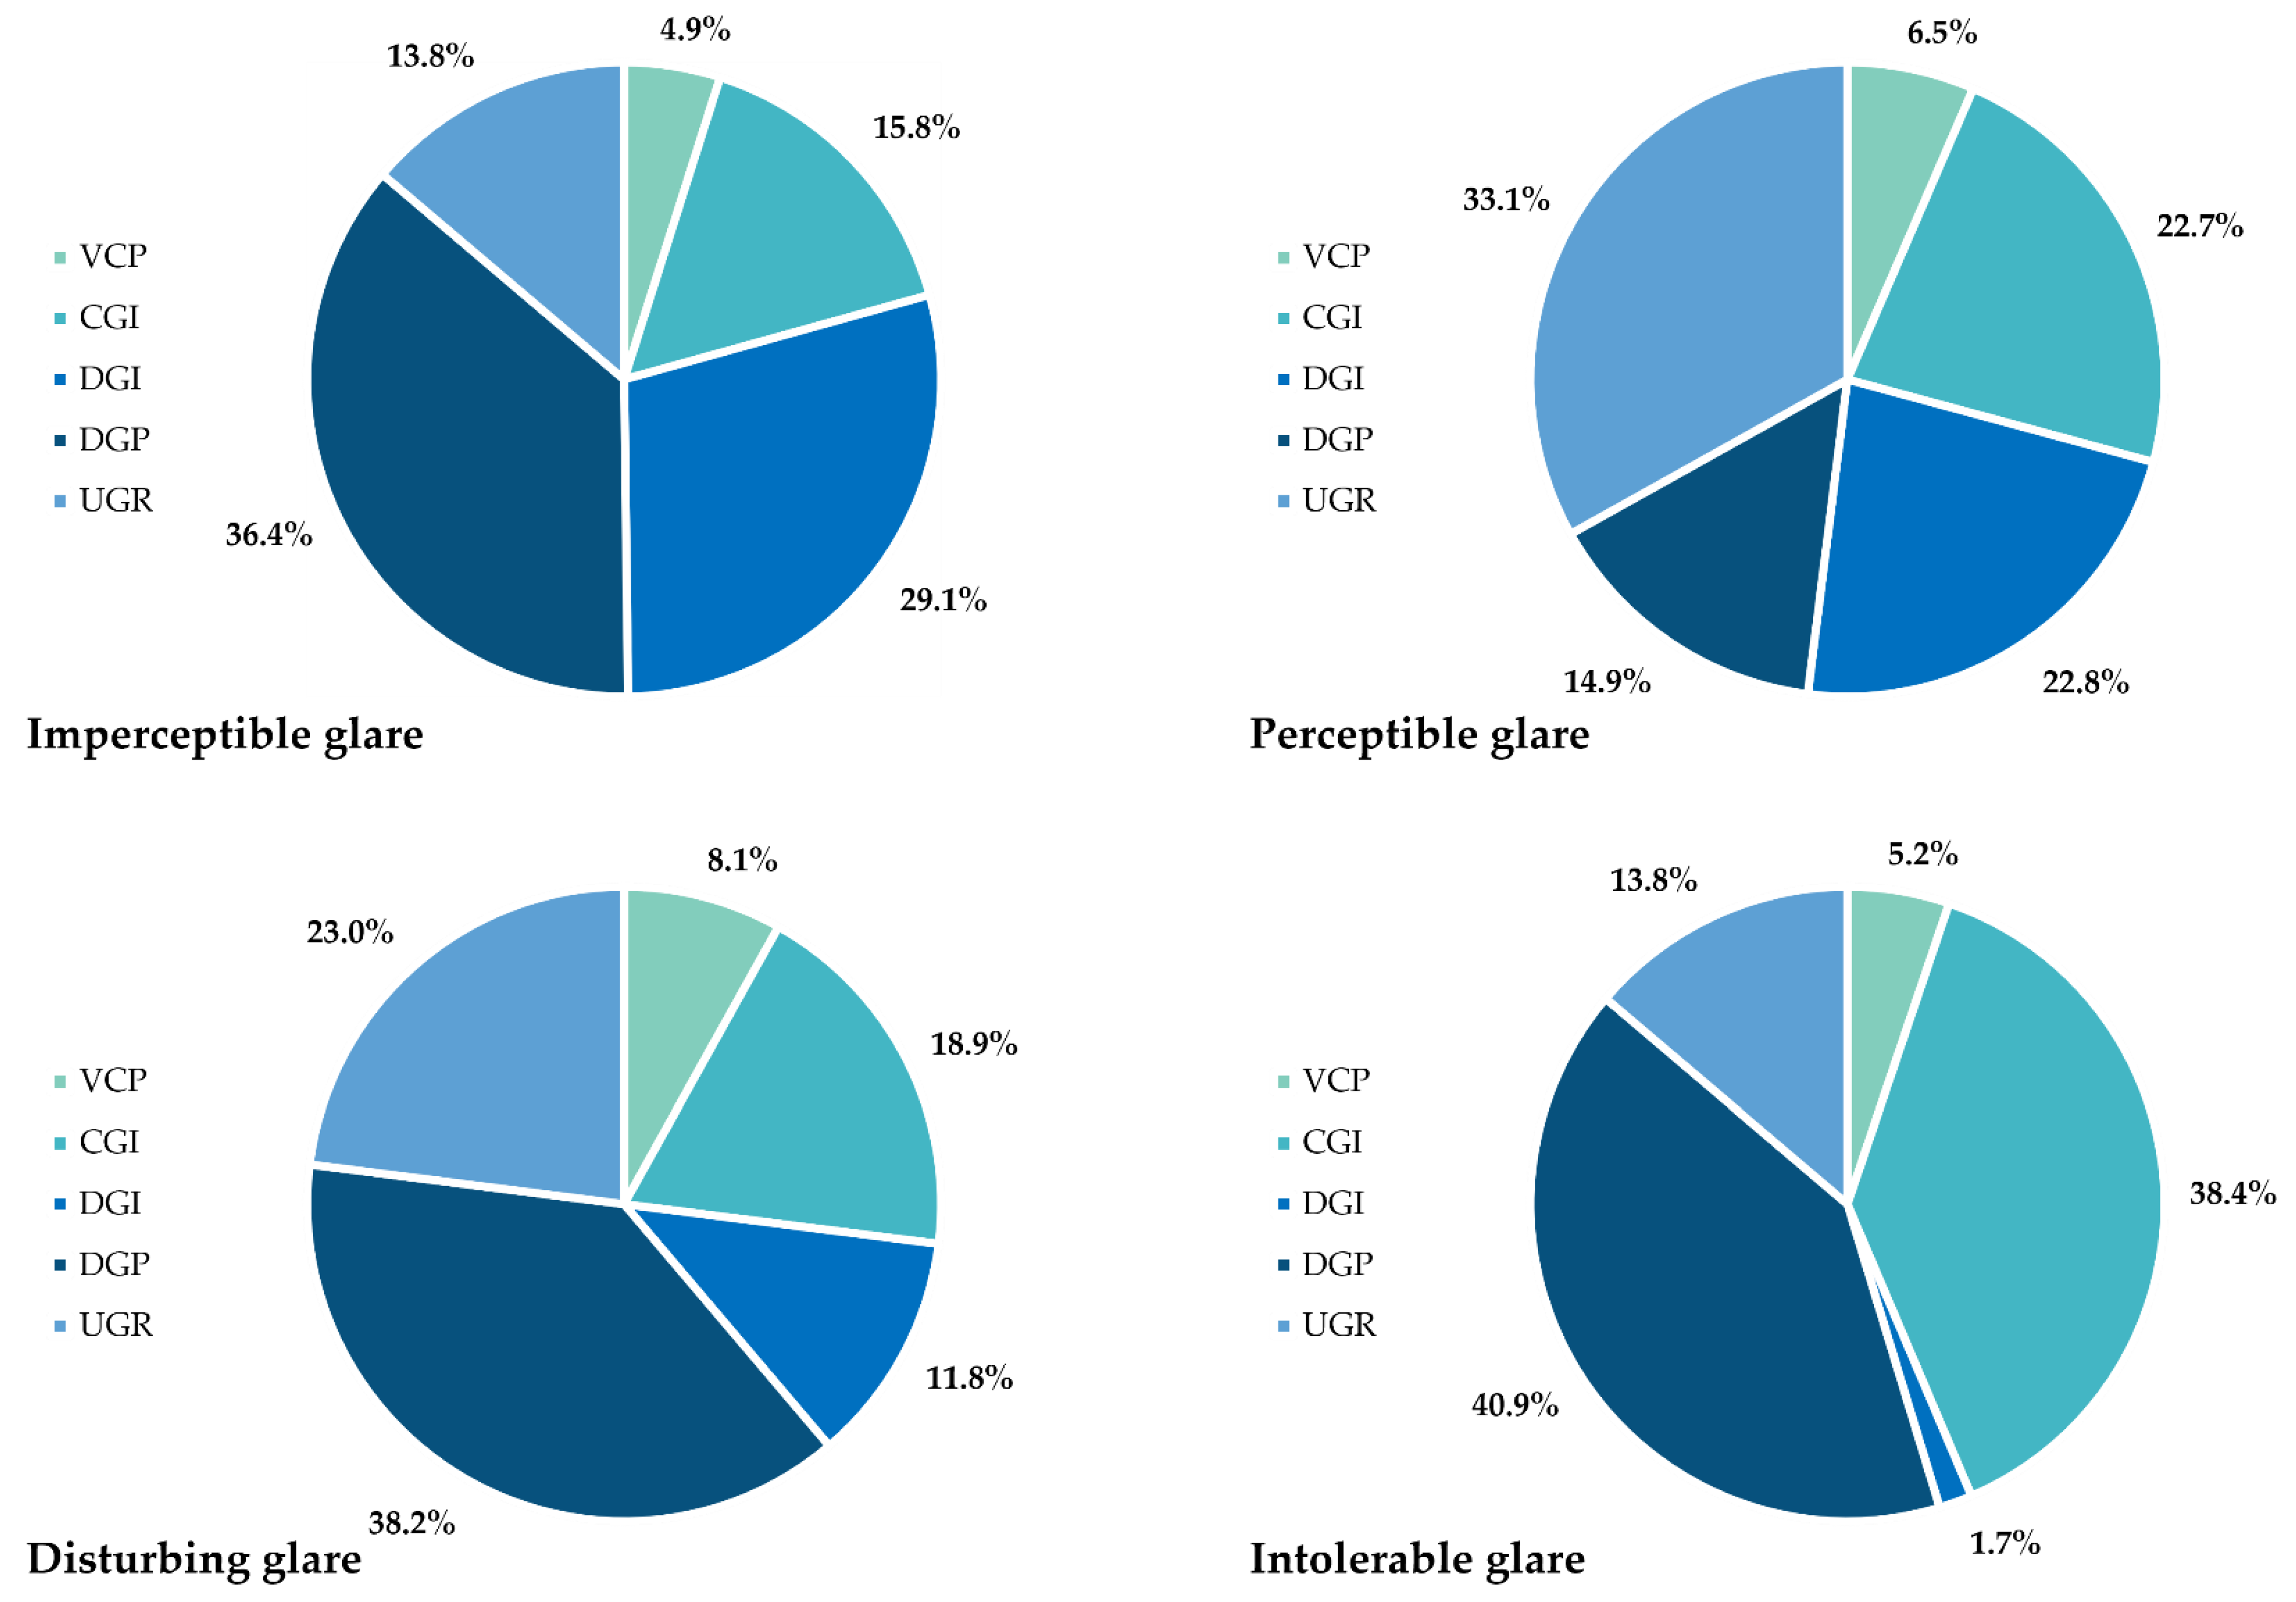
- DGP is the most reliable index in the evaluation of imperceptible, disturbing, and intolerable glare conditions, but its performance for assessing perceptible glare scenes is relatively weak. From the results, it is obvious that DGP has the highest correlation with human subjective evaluations to a large extent.
- UGR has the highest accuracy rate for evaluating perceptible glare scenes and has an acceptable performance in the evaluation of disturbing glare.
- DGI has very high accuracy in the assessment of imperceptible glare scenes, but it shows weak performance in disturbing glare evaluation.
- CGI has the best performance in the assessment of annoying glare and its accuracy rate for the rest of the glare scenes is low.
- Finally, VCP has the lowest accuracy rate in the evaluation of different glare ratings, and it confirms the previous findings that indicated that VCP is not suitable for assessing daylight glare.
4. Discussion
4.1. Implications and Key Findings of the Study
4.2. Limitations and Future Research Recommendations
- According to the results, most of the current glare indices show a low correlation with human subjective data, and there is a high contradiction between different levels of predicted and perceived glare. Since glare is a kind of subjective phenomenon, the policymakers on building energy codes should be encouraged to involve more human-centered factors in regulating visual metrics, hence the contradictions are eliminated.
- For the subjective approach, we utilized a developed questionnaire to collect human subjective data. To yield a better outcome, it is recommended to use smart building sensors such as image-based sensing technologies and surveying methods simultaneously. Sensing technology helps to monitor building occupancy data and collect occupancy-related information more precisely.
- As mentioned before, our case study was located in a semi-arid climate and the research outcomes can be practical in similar climates. Further studies should confirm these novel findings by conducting research in similar climatic conditions.
- The main common feature among glare indices is their dependency on the occupants, although the main attention of this paper is on office buildings with fixed light shelves. Further research could be conducted to investigate the performance of glare indices in office buildings with dynamic light shelf systems to evaluate visual metrics according to changing conditions and compare the results with the current study’s findings, since applying these metrics in other setups might not end with the same results.
5. Conclusions
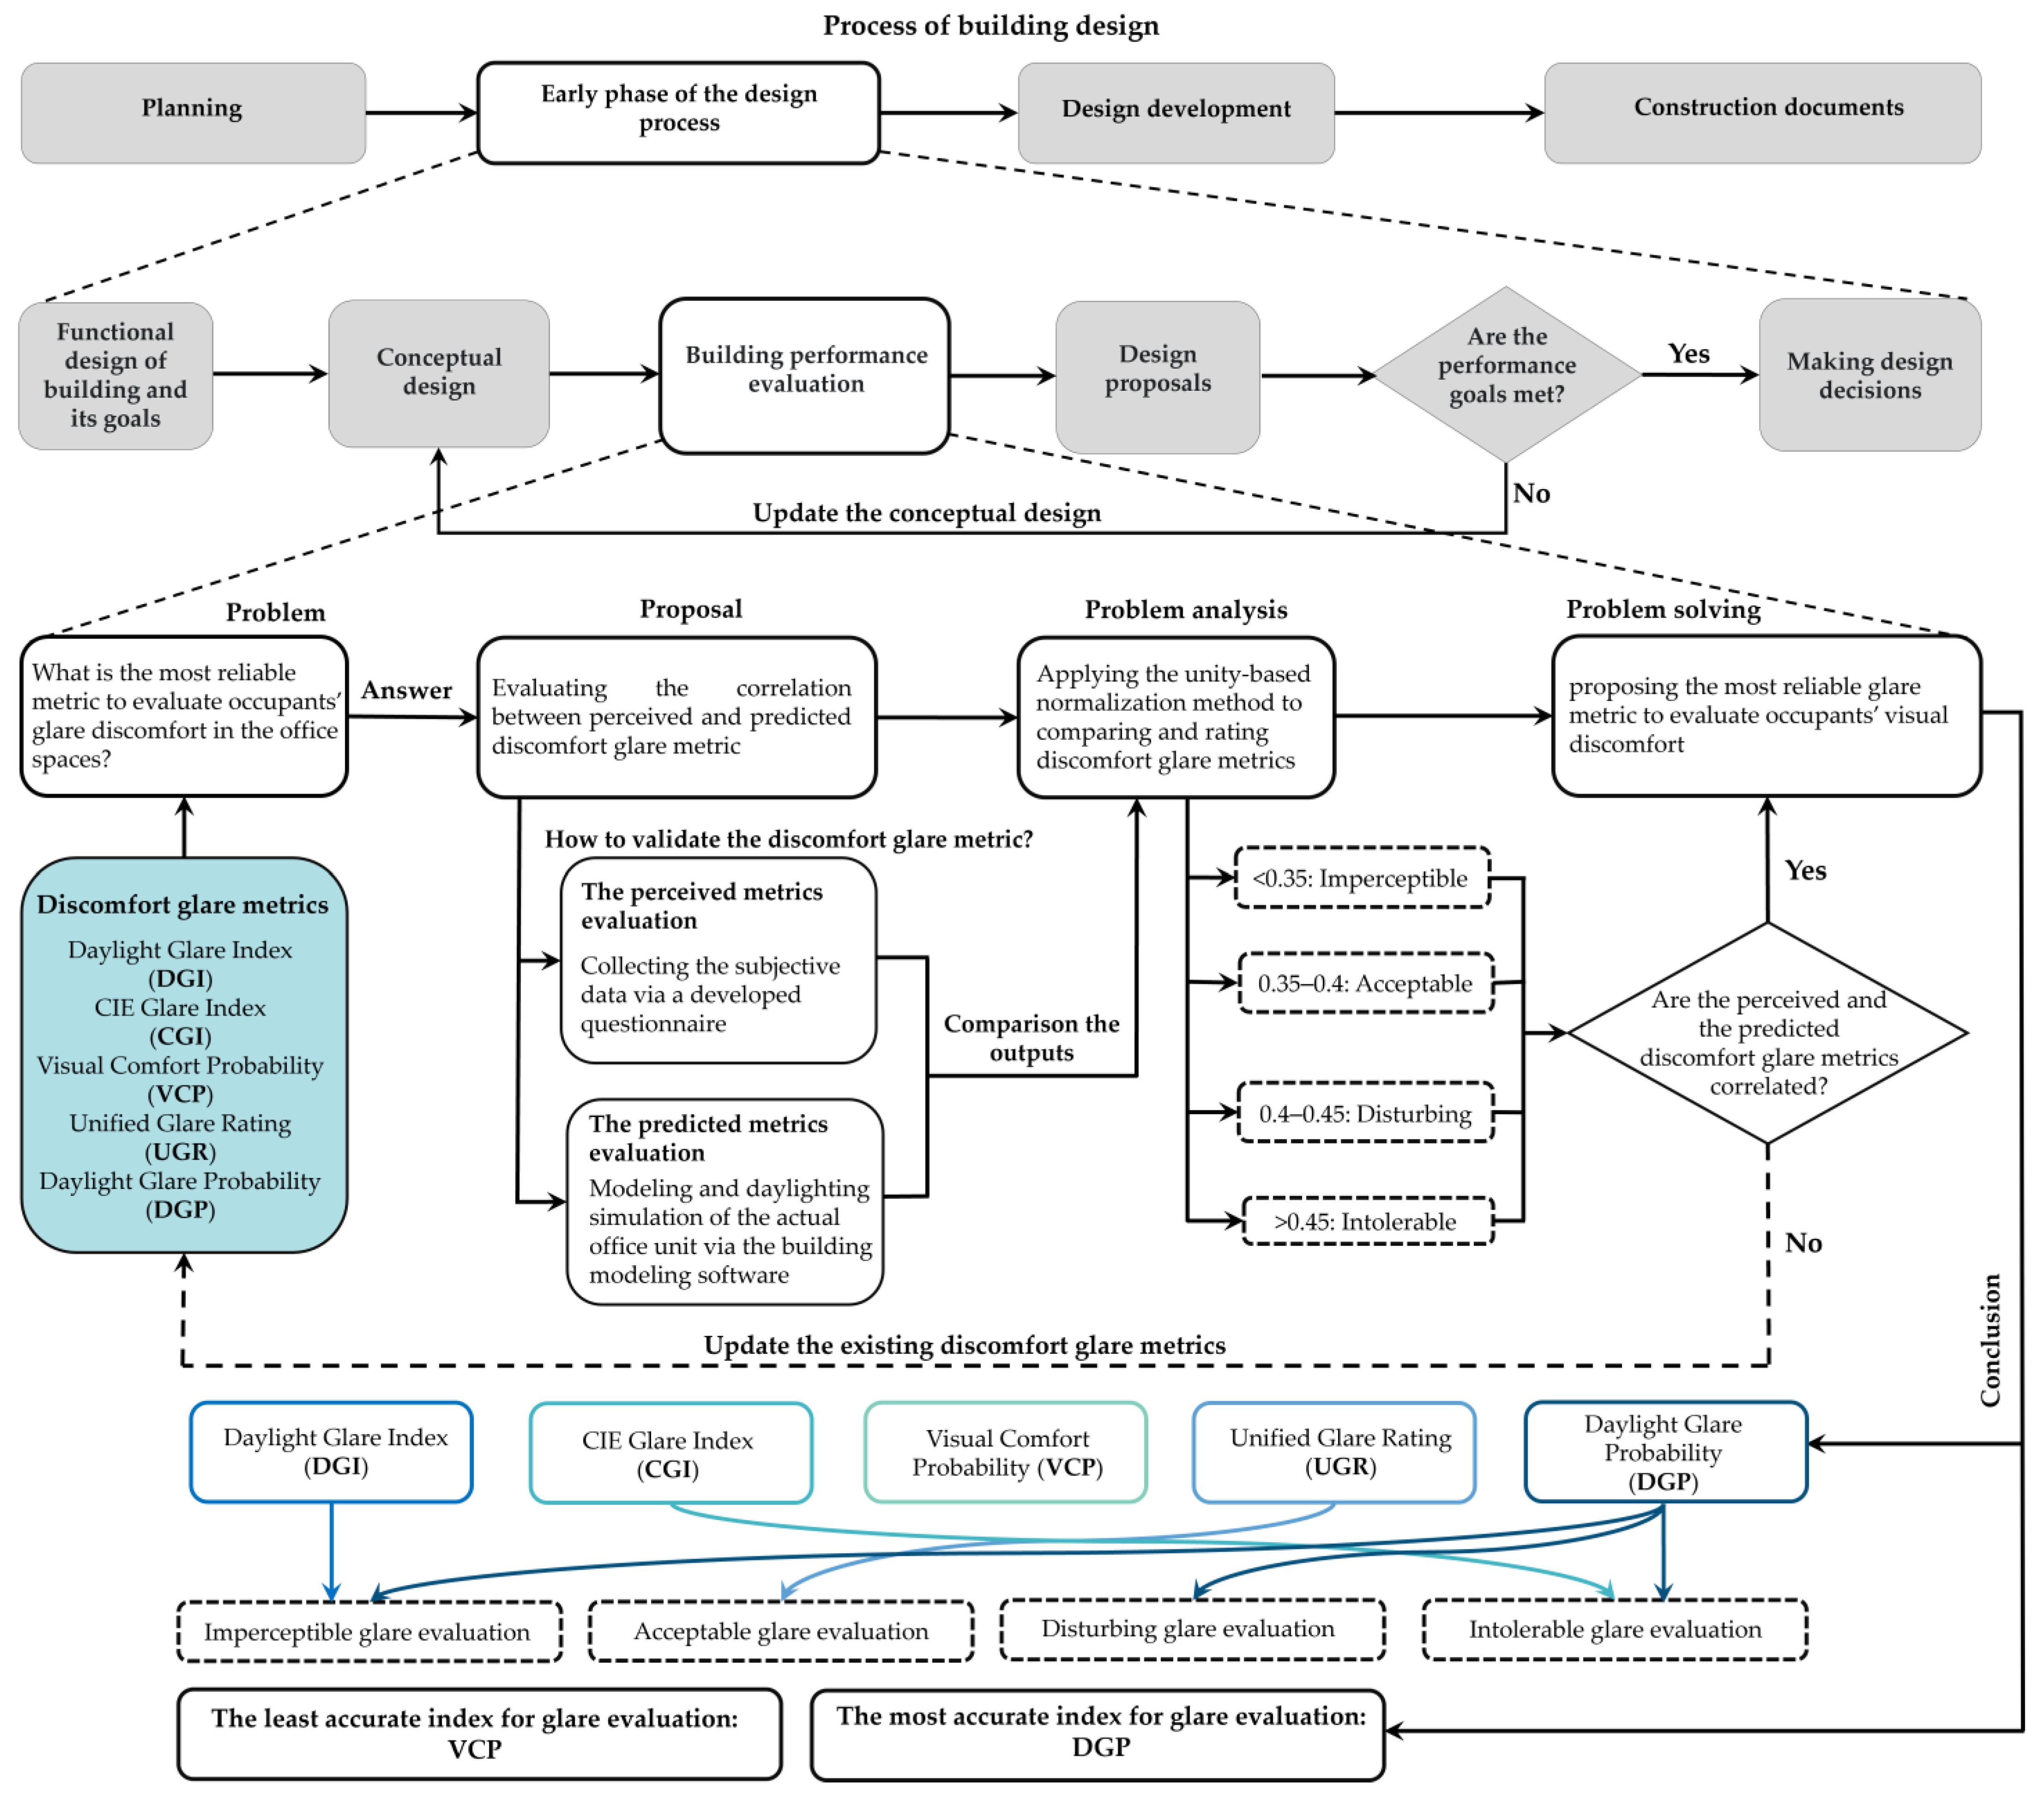
- According to the results, only one or two discomfort glare metrics are correlated with human subjective data in each stage, and in some cases none of the metrics are in alignment with the survey results. So, this finding supports the previous research which stated that the glare indices have wide contradictions in discomfort glare evaluations. There is no significant relationship between subjective and simulation-based analysis of discomfort glare metrics in different glare ratings.
- At almost all different levels of glare, comparing the subjective and simulation analysis of visual criteria indicated that DGP is the most accurate and reliable index for assessing glare and has the highest correlation with human subject data. However, some of the discomfort glare metrics in the special condition had better performance in glare evaluation. For example, UGR had the highest accuracy rate for evaluating perceptible glare level, DGI was applicable for imperceptible glare assessment, and the best discomfort glare metric in assessing intolerable glare was CGI.
- Based on the obtained results from the comparison of glare metrics with surveying outcomes, VCP has the least correlation with subjective evaluation and its’ assessment accuracy in each level of glare is very low. So, VCP is not appropriate for discomfort glare evaluation in offices with a light shelf system and needs deep research to consider suitable human-centered design factors for development in the future.
- The study indicated that there are highly significant differences between the subjective and simulation-based analysis of visual metrics in offices using light shelf systems. Although, for a more accurate investigation, it would be better to consider two or more glare indices simultaneously to alleviate this contradiction.
Author Contributions
Funding
Institutional Review Board Statement
Informed Consent Statement
Data Availability Statement
Conflicts of Interest
References
- Sabbagh, M.; Mandourah, S.; Hareri, R. Light Shelves Optimization for Daylight Improvement in Typical Public Classrooms in Saudi Arabia. Sustainability 2022, 14, 13297. [Google Scholar] [CrossRef]
- Sun, C.; Liu, Q.; Han, Y. Many-objective optimization design of a public building for energy, daylighting and cost performance improvement. Appl. Sci. 2020, 10, 2435. [Google Scholar] [CrossRef] [Green Version]
- Fernandes, L.L.; Lee, E.S.; Thanachareonkit, A.; Selkowitz, S.E. Potential annual daylighting performance of a high-efficiency daylight redirecting slat system. Build. Simul. 2021, 14, 495–510. [Google Scholar] [CrossRef]
- Sorooshnia, E.; Rashidi, M.; Rahnamayiezekavat, P.; Rezaei, F.; Samali, B. Optimum external shading system for counterbalancing glare probability and daylight illuminance in Sydney’s residential buildings. Eng. Constr. Archit. Manag. 2021, 30, 296–320. [Google Scholar] [CrossRef]
- Al-masrani, S.M.; Al-obaidi, K.M.; Azizah, N.; Isma, M.I.A. Design optimisation of solar shading systems for tropical o ffi ce buildings: Challenges and future trends. Sol. Energy 2018, 170, 849–872. [Google Scholar] [CrossRef]
- Brzezicki, M. An evaluation of useful daylight illuminance in an office room with a light shelf and translucent ceiling at 51° n. Buildings 2021, 11, 494. [Google Scholar] [CrossRef]
- Bakmohammadi, P.; Noorzai, E. Investigating the optimization potential of daylight, energy and occupant satisfaction performance in classrooms using innovative photovoltaic integrated light shelf systems. Sci. Technol. Built Environ. 2022, 28, 467–482. [Google Scholar] [CrossRef]
- Chinazzo, G.; Wienold, J.; Andersen, M. Daylight affects human thermal perception. Sci. Rep. 2019, 9, 13690. [Google Scholar] [CrossRef] [Green Version]
- Kwon, M.; Remoy, H.; van den Bogaard, M. Influential design factors on occupant satisfaction with indoor environment in workplaces. Build. Environ. 2019, 157, 356–365. [Google Scholar] [CrossRef]
- Lim, Y.-W.; Heng, C.Y.S. Dynamic internal light shelf for tropical daylighting in high-rise office buildings. Build. Environ. 2016, 106, 155–166. [Google Scholar] [CrossRef]
- Albuainain, N.; Sweis, G.; AlBalkhy, W.; Sweis, R.; Lafhaj, Z. Factors Affecting Occupants’ Satisfaction in Governmental Buildings: The Case of the Kingdom of Bahrain. Buildings 2021, 11, 231. [Google Scholar] [CrossRef]
- Sadick, A.-M.; Kpamma, Z.E.; Agyefi-Mensah, S. Impact of indoor environmental quality on job satisfaction and self-reported productivity of university employees in a tropical African climate. Build. Environ. 2020, 181, 107102. [Google Scholar] [CrossRef]
- Kozusznik, M.W.; Maricutoiu, L.P.; Peiro, J.M.; Virga, D.M.; Soriano, A.; Mateo-Cecilia, C. Decoupling Office Energy Efficiency From Employees’ Well-Being and Performance: A Systematic Review. Front. Psychol. 2019, 10, 293. [Google Scholar] [CrossRef]
- Settino, J.; Carpino, C.; Perrella, S.; Arcuri, N. Multi-Objective Analysis of a Fixed Solar Shading System in Different Climatic Areas. Energies 2020, 13, 3249. [Google Scholar] [CrossRef]
- Pourahmadi, M.; Khanmohamadi, M.; Mozafar, F. Investigation the Performance of Glare Indices in Iran’s Hot and Dry Climate. J. Environ. Sci. Technol. 2021, 23, 41–52. [Google Scholar]
- Khanmohamadi, M.; Pourahmadi, F.M. Windows optimization based on the glare performance in educational building of Iran hot and dry climate. J. Sustain. Archit. Urban Des. 2019, 7, 113–128. [Google Scholar] [CrossRef]
- Pilechiha, P.; Mahdavinejad, M.; Pour Rahimian, F.; Carnemolla, P.; Seyedzadeh, S. Multi-objective optimisation framework for designing office windows: Quality of view, daylight and energy efficiency. Appl. Energy 2020, 261, 114356. [Google Scholar] [CrossRef]
- Bahdad, A.A.S.; Fadzil, S.F.S.; Onubi, H.O.; BenLasod, S.A. Sensitivity analysis linked to multi-objective optimization for adjustments of light-shelves design parameters in response to visual comfort and thermal energy performance. J. Build. Eng. 2021, 44, 102996. [Google Scholar] [CrossRef]
- Ziaee, N.; Vakilinezhad, R. Multi-objective optimization of daylight performance and thermal comfort in classrooms with light-shelves: Case studies in Tehran and Sari, Iran. Energy Build. 2022, 254, 111590. [Google Scholar] [CrossRef]
- Tzouvaras, C.; Dimara, A.; Papaioannou, A.; Karatzia, K.; Anagnostopoulos, C.-N.; Krinidis, S.; Arvanitis, K.I.; Ioannidis, D.; Tzovaras, D. A Guide to Visual Comfort: An Overview of Indices and Its Applications. In Proceedings of the IFIP International Conference on Artificial Intelligence Applications and Innovations, León, Spain, 14–17 June 2023; Springer: Berlin/Heidelberg, Germany, 2023; pp. 183–194. [Google Scholar]
- Warrier, G.A.; Raphael, B. Performance evaluation of light shelves. Energy Build. 2017, 140, 19–27. [Google Scholar] [CrossRef]
- Hamedani, Z.; Solgi, E.; Skates, H.; Hine, T.; Fernando, R.; Lyons, J.; Dupre, K. Visual discomfort and glare assessment in office environments: A review of light-induced physiological and perceptual responses. Build. Environ. 2019, 153, 267–280. [Google Scholar] [CrossRef]
- Van Den Wymelenberg, K.; Inanici, M. A Critical Investigation of Common Lighting Design Metrics for Predicting Human Visual Comfort in Offices with Daylight. Leukos 2014, 10, 145–164. [Google Scholar] [CrossRef]
- Hirning, M.B.; Isoardi, G.L.; Coyne, S.; Garcia Hansen, V.R.; Cowling, I. Post occupancy evaluations relating to discomfort glare: A study of green buildings in Brisbane. Build. Environ. 2013, 59, 349–357. [Google Scholar] [CrossRef] [Green Version]
- Guth, S.K. A method for the evaluation of discomfort glare. Illum. Eng. 1963, 58, 351–364. [Google Scholar]
- Faraji, A.; Rashidi, M.; Rezaei, F. A Meta-Synthesis Review of Occupant Comfort Assessment in Buildings (2002–2022). Sustainability 2023, 15, 4303. [Google Scholar] [CrossRef]
- Lim, Y.-W.; Kandar, M.Z.; Ahmad, M.H.; Ossen, D.R.; Abdullah, A.M. Building façade design for daylighting quality in typical government office building. Build. Environ. 2012, 57, 194–204. [Google Scholar] [CrossRef] [Green Version]
- Einhorn, H.D. A new method for the assessment of discomfort glare. Light. Res. Technol. 1969, 1, 235–247. [Google Scholar] [CrossRef]
- Tuaycharoen, N.; Tregenza, P.R. View and discomfort glare from windows. Light. Res. Technol. 2007, 39, 185–198. [Google Scholar] [CrossRef]
- Chauvel, P.; Collins, J.B.; Dogniaux, R.; Longmore, J. Glare from windows: Current views of the problem. Light. Res. Technol. 1982, 14, 31–46. [Google Scholar] [CrossRef]
- Naderi, E.; Sajadi, B.; Behabadi, M.A.; Naderi, E. Multi-objective simulation-based optimization of controlled blind specifications to reduce energy consumption, and thermal and visual discomfort: Case studies in Iran. Build. Environ. 2020, 169, 106570. [Google Scholar] [CrossRef]
- Valitabar, M.; GhaffarianHoseini, A.; GhaffarianHoseini, A.; Attia, S. Advanced control strategy to maximize view and control discomforting glare: A complex adaptive façade. Archit. Eng. Des. Manag. 2022, 18, 829–849. [Google Scholar] [CrossRef]
- Linney, A.S. Maximum Luminances and Luminance Ratios and Their Impact on Users’ Discomfort Glare Perception and Productivity in Daylit Offices: Testing the Hypothesis: Maximum Luminance and Ratio Recommendations for Visual Comfort Should Be Specific to the Luminous. 2008. Available online: https://openaccess.wgtn.ac.nz/articles/thesis/Maximum_Luminances_and_Luminance_Ratios_and_their_Impact_on_Users_Discomfort_Glare_Perception_and_Productivity_in_Daylit_Offices_Testing_the_Hypothesis_Maximum_Luminance_and_Ratio_Recommendations_For_Visual_Comfort_Should_be_Specific_to_the/16946593 (accessed on 27 June 2023).
- Tabadkani, A.; Roetzel, A.; Li, H.X.; Tsangrassoulis, A. Daylight in Buildings and Visual Comfort Evaluation: The Advantages and Limitations. J. Daylighting 2021, 8, 181–203. [Google Scholar] [CrossRef]
- Wienold, J.; Christoffersen, J. Towards a New Daylight Glare Rating. Lux Europa, Berlin. 2005, pp. 157–161. Available online: https://www.researchgate.net/publication/313608753_Towards_a_new_daylight_glare_rating (accessed on 27 June 2023).
- Commission Internationale de l’é clairage. Discomfort Glare in the Interior Working Environment; CIE: Vienna, Austria, 1983. [Google Scholar]
- Guth, S.K. Outline of a standard procedure for computing visual comfort ratings for interior lighting. Illum. Eng. 1966, 61, 634–642. [Google Scholar]
- Cai, H.; Chung, T. Evaluating discomfort glare from non-uniform electric light sources. Light. Res. Technol. 2013, 45, 267–294. [Google Scholar] [CrossRef]
- Jakubiec, J.A.; Reinhart, C.F. The ‘adaptive zone’–A concept for assessing discomfort glare throughout daylit spaces. Light. Res. Technol. 2012, 44, 149–170. [Google Scholar] [CrossRef]
- Hopkinson, R.G. Glare from daylighting in buildings. Appl. Ergon. 1972, 3, 206–215. [Google Scholar] [CrossRef]
- CIE. 117: Discomfort Glare in Interior Lighting; CIE: Vienna, Austria, 1995. [Google Scholar]
- Wienold, J.; Christoffersen, J. Evaluation methods and development of a new glare prediction model for daylight environments with the use of CCD cameras. Energy Build. 2006, 38, 743–757. [Google Scholar] [CrossRef]
- Lee, H.; Zhao, X.; Seo, J. A Study of Optimal Specifications for Light Shelves with Photovoltaic Modules to Improve Indoor Comfort and Save Building Energy. Int. J. Environ. Res. Public Health 2021, 18, 2574. [Google Scholar] [CrossRef]
- Lee, H. A Basic Study on the Performance Evaluation of a Movable Light Shelf with a Rolling Reflector That Can Change Reflectivity to Improve the Visual Environment. Int. J. Environ. Res. Public Health 2020, 17, 8338. [Google Scholar] [CrossRef]
- Raphael, B. Active Control of Daylighting Features in Buildings. Comput. Civ. Infrastruct. Eng. 2011, 26, 393–405. [Google Scholar] [CrossRef]
- Lim, T.; Yim, W.S.; Kim, D.D. Evaluation of daylight and cooling performance of shading devices in residential buildings in South Korea. Energies 2020, 13, 4749. [Google Scholar] [CrossRef]
- Assimakopoulos, M.N.; De Masi, R.F.; de Rossi, F.; Ferrante, A.; Fotopoulou, A.; Papadaki, D.; Ruggiero, S.; Vanoli, G.P. Application of light shelves in a refurbished student dormitory: Energy, lightings and comfort aspects. Energy Rep. 2021, 7, 253–258. [Google Scholar] [CrossRef]
- Mesloub, A.; Ghosh, A. Daylighting performance of light shelf photovoltaics (LSPV) for office buildings in hot desert-like regions. Appl. Sci. 2020, 10, 7959. [Google Scholar] [CrossRef]
- Lim, Y.W.; Ahmad, M.H. The effects of direct sunlight on light shelf performance under tropical sky. Indoor Built Environ. 2015, 24, 788–802. [Google Scholar] [CrossRef]
- Ruggiero, S.; Assimakopoulos, M.N.; De Masi, R.F.; De Rossi, F.; Fotopoulou, A.; Papadaki, D.; Vanoli, G.P.; Ferrante, A. Multi-disciplinary analysis of light shelves application within a student dormitory refurbishment. Sustainability 2021, 13, 8251. [Google Scholar] [CrossRef]
- Meresi, A. Evaluating daylight performance of light shelves combined with external blinds in south-facing classrooms in Athens, Greece. Energy Build. 2016, 116, 190–205. [Google Scholar] [CrossRef]
- Al-Sallal, K.A. Easing high brightness and contrast glare problems in universal space design studios in the UAE: Real models testing. Renew. Energy 2006, 31, 617–630. [Google Scholar] [CrossRef]
- Öner, M.; Kazanasmaz, T. Illuminance and luminance based ratios in the scope of performance testing of a light shelf-reflective louver system in a library reading room. Light Eng. 2019, 27, 39–46. [Google Scholar] [CrossRef]
- Cheong, K.H.; Teo, Y.H.; Koh, J.M.; Acharya, U.R.; Man Yu, S.C. A simulation-aided approach in improving thermal-visual comfort and power efficiency in buildings. J. Build. Eng. 2020, 27, 100936. [Google Scholar] [CrossRef]
- Ebrahimi-Moghadam, A.; Ildarabadi, P.; Aliakbari, K.; Arabkoohsar, A.; Fadaee, F. Performance analysis of light shelves in providing visual and thermal comfort and energy savings in residential buildings. J. Braz. Soc. Mech. Sci. Eng. 2020, 42, 484. [Google Scholar] [CrossRef]
- Suk, J.Y.; Schiler, M.; Kensek, K. Investigation of existing discomfort glare indices using human subject study data. Build. Environ. 2017, 113, 121–130. [Google Scholar] [CrossRef]
- Golabchi, M.; Faraji, A. Project Strategic Management; University of Tehran Press: Tehran, Iran, 2010. [Google Scholar]
- Faraji, A.; Rashidi, M.; Agha, T.M.H.; Rahnamayiezekavat, P.; Samali, B. Quality Management Framework for Housing Construction in a Design-Build Project Delivery System: A BIM-UAV Approach. Buildings 2022, 12, 554. [Google Scholar] [CrossRef]
- Bakmohammadi, P.; Noorzai, E. Optimization of the design of the primary school classrooms in terms of energy and daylight performance considering occupants’ thermal and visual comfort. Energy Rep. 2020, 6, 1590–1607. [Google Scholar] [CrossRef]
- Nakhaee Sharif, A.; Keshavarz Saleh, S.; Afzal, S.; Shoja Razavi, N.; Fadaei Nasab, M.; Kadaei, S. Evaluating and Identifying Climatic Design Features in Traditional Iranian Architecture for Energy Saving (Case Study of Residential Architecture in Northwest of Iran). Complexity 2022, 2022, 3522883. [Google Scholar] [CrossRef]
- Abravesh, M.; Bueno, B.; Heidari, S.; Kuhn, T.E. A method to evaluate glare risk from operable fenestration systems throughout a year. Build. Environ. 2019, 160, 106213. [Google Scholar] [CrossRef]
- Jalali, Z.; Noorzai, E.; Heidari, S. Design and optimization of form and facade of an office building using the genetic algorithm. Sci. Technol. Built Environ. 2020, 26, 128–140. [Google Scholar] [CrossRef]
- Iranian National Building Code, Part 19: Energy Conservation; Ministry of Roads and Urban Development: Tehran, Iran, 2020.
- ANSI/ASHRAE. Pnnl-255130. ANSI/ASHRAE/IES Standard 90.1-2010 Performance Rating Method Reference Manual. May 2016. Available online: http://www.pnnl.gov/main/publications/external/technical_reports/PNNL-25130.pdf (accessed on 21 May 2023).
- Hoseinzadeh, P.; Khalaji Assadi, M.; Heidari, S.; Khalatbari, M.; Saidur, R.; Haghighat Nejad, K.; Sangin, H. Energy performance of building integrated photovoltaic high-rise building: Case study, Tehran, Iran. Energy Build. 2021, 235, 110707. [Google Scholar] [CrossRef]
- Liaison, S.; Jakob, F.E.; Dunn, W.A.; Brager, G.S.; Brown, K.A.; Clark, D.R.; Deringer, J.J.; Hogeling, J.J.; Int-hout, D.; Jones, B.W.; et al. ASHRAE STANDARD Thermal Environmental Conditions for Human Occupancy. 2004, Volume 2004. Available online: http://www.ditar.cl/archivos/Normas_ASHRAE/T0080ASHRAE-55-2004-ThermalEnviromCondiHO.pdf (accessed on 27 June 2023).
- USDOE. Input Output Reference. The Encyclopedic Reference to EnergyPlus Input and Output. 2019, pp. 1996–2016. Available online: https://energyplus.net/assets/nrel_custom/pdfs/pdfs_v9.6.0/InputOutputReference.pdf (accessed on 27 June 2023).
- NOVEDGE. Rhino 6 For Windows and Mac. 2020. Available online: https://novedge.com/products/2217 (accessed on 27 June 2023).
- Talaei, M.; Mahdavinejad, M.; Azari, R.; Prieto, A.; Sangin, H. Multi-objective optimization of building-integrated microalgae photobioreactors for energy and daylighting performance. J. Build. Eng. 2021, 42, 102832. [Google Scholar] [CrossRef]
- Rabie, S.; Sangin, H.; Zandieh, M. The Orientation of Village, the Most Important Factor in Rural Sustainability in Cold Climate (Case study: Masuleh and Uramantakht). J. Sol. Energy Res. 2021, 6, 761–776. [Google Scholar]
- Tabadkani, A.; Valinejad Shoubi, M.; Soflaei, F.; Banihashemi, S. Integrated parametric design of adaptive facades for user’s visual comfort. Autom. Constr. 2019, 106, 102857. [Google Scholar] [CrossRef]
- Jakubiec, J.A.; Reinhart, C.F. Towards Validated Urban Photovoltaic Potential and Solar Radiation Maps Based on Lidar Measurements, GIS Data, and Hourly Daysim Simulations. Proceedings of Simbuild, Madison. 2012. Available online: https://web.mit.edu/sustainabledesignlab/publications/SimBuild2012_jakubiec,reinhart_towards-validated-urban-solar-radiation-maps.pdf (accessed on 27 June 2023).
- Kontadakis, A.; Tsangrassoulis, A.; Doulos, L.; Zerefos, S. A review of light shelf designs for daylit environments. Sustainability 2018, 10, 71. [Google Scholar] [CrossRef] [Green Version]
- Faraji, A.; Rashidi, M.; Rezaei, F.; Sorooshnia, E. Determining Appropriate Thermal Comfort Period based on PET and PMV using the RayMan Model: A Case Study in the Subtropical City of Sari. Iran Univ. Sci. Technol. 2022, 32, 3. [Google Scholar] [CrossRef]


| Level of Discomfort Glare | VCP [25,36,37] | CGI [28,38,39] | DGI [30,40] | UGR [33,41] | DGP [35,42] |
|---|---|---|---|---|---|
| just imperceptible | >80 | <13 | <18 | <13 | <0.35 |
| just acceptable | 60–80 | 13–22 | 18–24 | 13–22 | 0.35–0.4 |
| just disturbing | 40–60 | 22–28 | 24–31 | 22–28 | 0.4–0.45 |
| just intolerable | <40 | >28 | >31 | >28 | >0.45 |
| Source | Methodology | Type of LS | LS Variable (s) | Glare | Daylighting | Considered Metric (s) | Type of Sky | Window Orientation(s) | Case Study Dimensions (Length × Width × Height) | Case Study Space | Climate and Region | Software Platform |
|---|---|---|---|---|---|---|---|---|---|---|---|---|
| [43] | Experimental | Internal/External | Width, height, angle, and reflectivity | × | ✓ | Light uniformity | All | South | Dimensions: 6.6 × 4.9 × 2.5 (m) | T | Seoul, Korea; Dwa | - |
| [27] | Experimental, Simulation | Internal/External | N/A | ✓ | × | CIE Glare Index, VCP | Intermediate sky | All orientations | Dimensions: 6.6 × 3 × 3 (m) | O | Johor Bahru, Malaysia; Af | Radiance |
| [7] | Simulation | Internal/External | Position, width, height, and angle | ✓ | ✓ | UDI, ASE, and DGP | Clear sky | South | Dimensions: 10 × 9 × 3.5 (m) | E | Tehran, Iran; BSk | Honeybee |
| [44] | Experimental | External | Angle and reflectivity | ✓ | × | Glare caused by light reflectivity | All | South | Dimensions: 6.6 × 4.9 × 2.5 (m) | T | Seoul, Korea: Dwa | - |
| [6] | Simulation | External | Angle and material | ✓ | ✓ | UDI, DGP | Clear sky | South | Dimensions: 12 × 6 × 5 (m) | O | Wroclaw, Poland; Cfb | DeLuminæ |
| [45] | Simulation | Internal/External | Angle and width | × | ✓ | Daylighting performance | Clear/Overcast | East and west | Dimensions: 18 × 6 × 4.1 (m) | O | Singapore; Af | Radiance |
| [46] | Simulation | Internal/External | Angle | × | ✓ | Daylighting performance | Clear sky | South | Dimensions: 12.6 × 5 × 2.3 (m) | R | Seoul, Korea; Dwa | Radiance |
| [19] | Simulation | Light shelf | Length, angle, and height | × | ✓ | UDI, ASE, and sDA | Different sky cloud cover | WWR, height, length, and angle of light shelves | Dimensions: 8 × 5.8 × 2.9 (m) | E | Sari, Iran: Csa. Tehran, Iran; BSk | Honeybee |
| [47] | Simulation | Internal/External | Width, height, distance from floor and top of the window | × | ✓ | Daylighting performance | Clear sky | East, West | Dimensions: 7.9 × 3.2 × 2.8 (m) | E | Athens, Greece; Cfa | EnergyPlus |
| [1] | Experimental, Simulation | Internal/External | Position, shape, material, and width | × | ✓ | Illuminance values, Daylighting performance | Clear sky | North, West | Dimensions: 9 × 7 × 3.3 (m) | E | Riyadh, Saudi Arabia; BWh | Revit |
| [48] | Experimental, Simulation | Internal/External | Reflectivity, height, and internal light shelf (ILS) curve | ✓ | ✓ | UDI, DA, UI, DGP, Illuminance & luminance values, Daylighting performance | Clear sky | South | Dimensions: 4.6 × 8 × 3 (m) | O | Ha’il, Saudi Arabia; BWh | Diva |
| [49] | Experimental | Internal | Heigh, length, and number | × | ✓ | Daylight ratio or daylight factor and WPI uniformity ratio | various sky conditions | All | Dimensions: 4.2 × 4.2 × 3 (m) | T | Johor, Malaysia; Af | - |
| [50] | Experimental, Simulation | Internal/External | Width, height, distance from floor and top of the window | × | ✓ | Daylighting performance | All type | East, West | Dimensions: 7.9 × 3.2 × 2.8 (m) | E | Athens, Greece; Csa | EnergyPlus |
| [51] | Experimental, Simulation | Internal/External | Width, mounting height, inclination, and reflection index | × | ✓ | Uniformity of daylight distribution, DF | Overcast | South | Dimensions: 7 × 7 × 3.2 (m) | E | Athens, Greece; Csa | Radiance |
| [21] | Experimental, Simulation | Internal/External | Angle, material, and orientation | × | ✓ | Useful Daylight Enhancement. | Clear, cloudy | All | Dimensions: 7 × 7 × 3.2 (m) | E | Chennai, India; Aw | Radiance |
| [52] | Experimental | External | Slope angle | ✓ | ✓ | DF, glare brightness contrast | Clear | North | Dimensions: 14.9 × 8.5 × 2.9 (m) | E | Al-Ain, UAE; BWh | - |
| [53] | Experimental | Internal/External | Distance from the floor | × | ✓ | Illuminance and luminance performance factors | CIE intermediate sky | north-east, south-west, and north-west | Dimensions: 29.7 × 19 × 4.3 (m) | E | Izmir, Turkey; Csa | - |
| [10] | Experimental, Simulation | Internal | Height, length, and number | ✓ | × | CIE Glare Index (CGI), Guth Visual Comfort Probability (GVCP) | Inconsistent cloud formations of intermediate skies | All | Dimensions: 8.4 × 8.4 × 2.7 (m) | O | Johor Bahru, Malaysia; Af | Radiance |
| [54] | Simulation | Internal | N/A | × | ✓ | Daylight illumination | CIE overcast | All | Total area: 937.9 m2 | O | Singapore; Af | Radiance IES-VE |
| [18] | Simulation | Combination of external and internal | Height, angle, and Depth | ✓ | ✓ | UDI and DGP | - | South | Dimensions: 8 × 5 × 2.8 (m) | O | Penang, Malaysia; Af | Honeybee |
| [55] | Simulation | Internal | Position (Vertical and horizontal) | × | ✓ | DR | Clear | North-west, South-east | Dimensions: 6 × 5 × 3.5 (m) | R | Mashhad, Iran; BSk | Honeybee |
| City | Latitude | Longitude | Elevation (m) | Mean Cloud Cover | Climate | HDD | CDD |
|---|---|---|---|---|---|---|---|
| Tehran | 35.7219° N | 51.3347° E | 1219 | 44.7% | Cold semi-arid (BSk) | 1810 | 865 |
| Weather Data | Hourly | Monthly | |||
|---|---|---|---|---|---|
| Avg. | Max. | Min. | Max. | Min. | |
| Dry-bulb temperature (°C) | 17.27 | 40 | −5 | 30.07 | 3.88 |
| Relative humidity (%) | 40.57 | 99 | 3 | 62.99 | 21.92 |
| Dew point temperature (°C) | 1.61 | 18.5 | 20 | 6.78 | −3.5 |
| Wind speed (m/s) | 2.71 | 16.3 | 0 | 4.25 | 1.67 |
| Direct normal radiation (Wh/m2) | 206.98 | 775 | 0 | 299.97 | 120.21 |
| Diffuse horizontal radiation (Wh/m2) | 121.15 | 540 | 0 | 177.11 | 64.73 |
| Global horizontal radiation (Wh/m2) | 244.25 | 1069 | 0 | 364.24 | 117.26 |
| Horizontal infrared radiation (Wh/m2) | 340.58 | 489 | 229 | 409.04 | 274.93 |
| Barometric pressure (Pa) | 87,943.21 | 98,300 | 86,900 | 88,416.26 | 87,419.58 |
| Zone | <4000 Lux | 4000–8000 Lux | 8000–16,000 Lux | >16,000 Lux |
|---|---|---|---|---|
| 3 | 4923 | 756 | 1094 | 1977 |
| Month | January | February | March | April | May | June | July | August | September | October | November | December | Annual |
|---|---|---|---|---|---|---|---|---|---|---|---|---|---|
| Number of hours | 10:20 | 10:50 | 11:55 | 13:04 | 14:02 | 14:31 | 14:18 | 13:28 | 12:22 | 11:12 | 10:15 | 9:47 | 12:00 |
| The sun’s altitude at noon on the 21st day of every month (Degree) | 34/4 | 43/7 | 54/5 | 66/2 | 74/5 | 77/7 | 74/7 | 40/66 | 55 | 43/5 | 43/3 | 30/9 | 54/7 |
| Component | Material | U-Value (W/m2 K) |
|---|---|---|
| External Wall | 1-inch stucco | 0.7813 |
| 8-inch concrete heavyweight | ||
| Wall insulation | ||
| 0.5-inch gypsum | ||
| Roof | Roof membrane | 0.2296 |
| Roof insulation | ||
| Metal decking | ||
| Floor | 0.5-inch gypsum | 0.1994 |
| Attic floor | ||
| Floor insulation | ||
| 0.5-inch gypsum | ||
| Window | Theoretical glass | 13.88 |
| Window frame | UPVC | 1.6 |
| Light shelf | Aluminum | 1.5 |
| Attributes | Unit | Values |
|---|---|---|
| Case study type | - | Medium office building |
| Working hours | - | 8:00–17:00 |
| Number of people per area | ppl/m2 | 0.0565 |
| Ventilation per area | m3/s·m2 | 0.0003 |
| Equipment loads per area | w/m2 | 7.6424 |
| Lighting density per area | w/m2 | 11.8404 |
| Window orientation | - | South |
| Dimensions of the window (Width × Height) | m | 2.4 × 2 |
| Dimensions of the office room (Length × Width × Height) | m | 4 × 3.5 × 3 (m) |
| Location and climate of case study | - | Tehran (Bsk), Iran |
| Window to Wall Ratio (WWR) | % | 40% |
| Light shelf thickness | m | 0.4 |
| The angle of the light shelf with the window plane | ° | 90 |
| TG (Transmission of Glass) | % | 0.4 |
| LSL (Light shelf Length) | m | 0.4 |
| LSH (Light shelf Height) | m | 0.6 |
| Type of Surface | Reflectance Values (%) |
|---|---|
| Interior wall | 45 |
| Exterior wall | 70 |
| Ceiling | 70 |
| Floor | 40 |
| Light shelf | 52 |
| Window | 79 |
| Frame of window | 50 |
| Door | 29 |
| Equipment (monitor, furniture, etc.) | 20–50 |
| Type of Radiance Parameters | Value |
|---|---|
| Ambient bounces (-ab) | 2 |
| Ambient divisions (-ad) | 1024 |
| Ambient super samples (-as) | 1024 |
| Ambient resolution (-ar) | 128 |
| Ambient accuracy (-aa) | 0.25 |
Disclaimer/Publisher’s Note: The statements, opinions and data contained in all publications are solely those of the individual author(s) and contributor(s) and not of MDPI and/or the editor(s). MDPI and/or the editor(s) disclaim responsibility for any injury to people or property resulting from any ideas, methods, instructions or products referred to in the content. |
© 2023 by the authors. Licensee MDPI, Basel, Switzerland. This article is an open access article distributed under the terms and conditions of the Creative Commons Attribution (CC BY) license (https://creativecommons.org/licenses/by/4.0/).
Share and Cite
Faraji, A.; Rezaei, F.; Rahnamayiezekavat, P.; Rashidi, M.; Soleimani, H. Subjective and Simulation-Based Analysis of Discomfort Glare Metrics in Office Buildings with Light Shelf Systems. Sustainability 2023, 15, 11885. https://doi.org/10.3390/su151511885
Faraji A, Rezaei F, Rahnamayiezekavat P, Rashidi M, Soleimani H. Subjective and Simulation-Based Analysis of Discomfort Glare Metrics in Office Buildings with Light Shelf Systems. Sustainability. 2023; 15(15):11885. https://doi.org/10.3390/su151511885
Chicago/Turabian StyleFaraji, Amir, Fatemeh Rezaei, Payam Rahnamayiezekavat, Maria Rashidi, and Hossein Soleimani. 2023. "Subjective and Simulation-Based Analysis of Discomfort Glare Metrics in Office Buildings with Light Shelf Systems" Sustainability 15, no. 15: 11885. https://doi.org/10.3390/su151511885