Article

Predicting Critical Factors Impacting Hotel Online Ratings: A Comparison of Religious and Commercial Destinations in Saudi Arabia

by
Harman Preet Singh
1,*,
Mohammad Alshallaqi
1 and
Mohammed Altamimi
2
1
Department of Management and Information Systems, College of Business Administration, University of Ha’il, P.O. Box 2440, Ha’il 81451, Saudi Arabia
2
Department of Information and Computer Science, College of Computer Science and Engineering, University of Ha’il, P.O. Box 2440, Ha’il 81481, Saudi Arabia
*
Author to whom correspondence should be addressed.
Sustainability 2023, 15(15), 11998; https://doi.org/10.3390/su151511998
Submission received: 7 June 2023 / Revised: 31 July 2023 / Accepted: 2 August 2023 / Published: 4 August 2023
(This article belongs to the Section Economic and Business Aspects of Sustainability)

Abstract

:
User-generated online ratings have become a prominent tool for hotels to enhance overall customer satisfaction. Prior research on online ratings has mainly considered commercial destinations, whereas research on religious destinations is limited. This study uses the IPA technique and beta regression analysis to investigate the destination’s (commercial and religious) varying effects on the relationship between hotel service quality attributes and customer satisfaction. In total, data from 338 hotels representing 82,704 customer reviews in two Saudi Arabian cities (Alkhobar and Makkah) were collected from Booking.com and analyzed. Makkah was selected as a key religious heritage destination, whereas Alkhobar was chosen as a commercial destination as it hosts major sea resorts, recreational parks, and shopping destinations. The results indicate that commercial and religious destination tourists do not have similar perceptions of the selected eight hotel service quality attributes. While comfort, facilities, and value-for-money service quality attributes were considered important for commercial destination tourists, religious destination tourists viewed location, cleanliness, and breakfast as important. Since effective management of customer satisfaction is essential for hotels’ profitability and sustainability, therefore it is imperative to identify and prioritize service quality attributes related to each group of customers. This will enable the efficient application of limited resources.

1. Introduction

Service quality is one of the most significant factors in determining overall customer satisfaction (OCS) [1,2,3]. It is a multifaceted construct generally defined using physical, interaction, and corporate image quality dimensions [4]. Service quality is regarded as the customer’s impression of the service regardless of the dimension from which it is seen [5]. Its aspects vary from industry to industry, geographic location, and purpose [6] (commercial or religious). Consequently, customers’ or guests’ perceptions of service quality may vary not just across hotels with varying classification ratings and other attributes [7] but could also be based on the destination’s commercial or religious purpose. In the study, we considered a commercial destination for hotel customers as any destination other than for religious purposes.
Marketing efforts have changed due to the rise of e-commerce, particularly in the hotel and tourism sector [8], enabling consumers and businesses to take advantage of online rating platforms. Online ratings, often generated by customers expressing their perception of service delivery, have become a veritable guide to potential users of these services and have become an instrument for providers of such services to adjust and, more specifically, improve OCS [9,10]. Recognizing the persuasive nature of these online evaluations, which are user-generated descriptions of items or services [11], research has begun to examine the impact of online user-generated content (UGC) on other consumers’ purchasing decisions [12].
Online UGC is one of the most powerful ways for customers to share their ideas, opinions, and feelings about goods and services [13,14,15]. In the hospitality and tourism sector, online UGC influences an organization’s digital reputation [16], profitability [17], and growth [18]. Specifically, exposure to positive online reviews entices customers to book a hotel [19]. Online reviews from reputable sources (like Booking.com) are generally considered reliable and unbiased [20,21]. Customers view online UGC as more credible than traditional advertising information because most comments and reviews reflect personal experiences or opinions that support or oppose the product or service [22]. Furthermore, research demonstrates that the quality of the source linked with the author of a product review influences consumers’ impressions of items or services [23]. Therefore, online UGC has emerged as a prominent decision-making source for prospective customers [24].
Consumer-generated online product ratings (OPRs) are a significant electronic word-of-mouth (E-WOM) source [25]. OPRs are perceptions of the service quality and represent the delivery of services’ impact on hotel patronage [26,27]. Hotel patronage is also one of the most significant predictors of the performance of hospitality operations [3,28,29]. Therefore, it is vital not only to discover and anticipate critical aspects influencing online ratings but also to prioritize these hotel qualities according to their impact on customer satisfaction, particularly in relation to various destination sites (commercial or religious). Accordingly, it is necessary to investigate customers’ quality perception, which could guide constructs such as OCS [30], acknowledging that customers or guests may be completely satisfied by an attribute and highly dissatisfied by others at the same time. The online hotel ratings propagated via e-WOM enable such assessment of attributes that the tourism sector, especially the hotel industry, can leverage to improve the quality of attributes. This strategy also allows hospitality firms, particularly managers, to identify customer-perceived low-performing traits for priority assessment, treat them as exceptions, and spend more resources and attention on them, given their limited resources [31]. Additionally, this strategy enables hotels to focus on traits that promote their sustainability activities, as such actions may also result in improved online review ratings for the hotels [32].
Previous studies have used several dimensions of hotel service quality attributes to assess OCS in the tourism industry, particularly in the hotel industry using the consumer- generated OPRs [33,34,35,36,37]. However, previous studies have used consumer-generated OPRs mainly for commercial destinations to assess the quality or performance of hotels based on classification ratings or other characteristics [25,38,39,40,41,42,43,44,45,46,47,48,49]. Only a few studies have explored the impact of hotels’ online ratings on customer satisfaction in religious destinations [31,33,50,51,52,53]. The study of commercial destinations may have a limited generalizability to religious destinations [53]. This is because guests’ opinions of the service quality may differ across hotel destinations [7,54,55] (commercial or religious). Therefore, research called for more comparative studies of guest opinions, not only on types of hotels but also considering the type of destination [56,57]. However, to date, in the hotel and tourism literature, no studies have simultaneously examined the antecedents of tourists’ satisfaction based on commercial and religious destinations. This study attempts to close this gap by simultaneously focusing on commercial and religious destinations and prioritizing hotel attributes influencing customer satisfaction. Accordingly, this paper focuses on tourists’ perceptions through the consumer-generated OPRs of hotel attributes for different classes of tourists or customers based on their destinations (commercial or religious).
In addition to the well-researched pleasure seekers and leisure travelers visiting commercial destinations [47], religious travel is one of the niche markets that is increasing significantly with many people traveling abroad [58]. Religious destinations are characterized by a customer journey that centralizes spirituality above other considerations [59] that we might not find in commercial forms of tourism, such as health/wellness, sport, shopping, or even history and culture. Increasing numbers of individuals travel for religious reasons, having economic repercussions [60,61]. According to statistics from the United Nations World Tourism Organization (UNWTO), more than 300 million travelers visit locations of religious significance each year, and over 600 million national and international travels happen worldwide [62].
Saudi Arabia is the prime context to study religious and commercial tourist destinations because it hosts the key religious heritage site of Makkah and commercial cities like Alkhobar, which hosts major sea resorts, recreational parks, and shopping destinations [63]. The country has also embarked on an ambitious 2030 vision to rebrand Saudi Arabia as a world-class tourist destination [64,65]. These efforts are accompanied by massive improvements in streamlining the tourist journey from applying for tourist visas to visiting and then departing the country. For example, the country has developed a new streamlined digitized tourist visa scheme that is typically issued within less than 24 h for some nationalities [66]. It has also targeted residents and tourists in the neighboring GCC by making it easier for them and their dependents to receive tourist visas whenever desired [66]. These efforts aim to increase tourists’ inflow to the country, which will help to buttress Saudi Arabia’s brand as a tourist destination. In addition, the rich religious and commercial destinations in Saudi Arabia create an opportunity to assess tourists’ perceptions through consumer-generated OPRs of hotel attributes for different classes of tourists or customers based on type of destinations (commercial or religious).
The main objective of this paper is to analyze the destination’s (commercial and religious) varying effects on the relationship between service quality and customer satisfaction expressed through the consumer-generated OPRs collected from the Booking.com website. We aim to answer the following research question: Does the perception of hotel attributes differ among religious and commercial classes of customers? We chose the religious and commercial destinations of Makkah and Alkhobar, respectively, with attributes that are essential in the context of Saudi Arabia.
Consequently, the current paper seeks to contribute to existing tourism, particularly the hotel literature. First, it is one of the few empirical studies that compare the differences in preference for hotel attributes among tourists visiting religious and commercial destinations. Second, the study contributes by utilizing the online review ratings data acquired from Booking.com for religious (Makkah) and commercial (Alkhobar) locations in a single country (Saudi Arabia). This study’s findings may have ramifications for other nations’ religious and commercial destinations, notably Gulf Cooperation Council (GCC) countries, whose cultures are similar to Saudi Arabia. Finally, the study adds to the body of knowledge on consumer behavior by generating useful information for religious and commercial destinations through a technology platform (of online review ratings).

2. Literature Review and Hypotheses Development

2.1. Theoretical Background

In the literature on consumer behavior, several theories based on differing standards, expectations, and perceived quality have been proposed to explain customer satisfaction. These theories include the expectancy disconfirmation paradigm (EDP) [67], contrast theory [68], equity theory [69,70], and attribution theory [71]. These theories can enable hotel service providers to gain insights into the behavior of consumers to improve their service delivery. This is important because customer satisfaction directly impacts customers’ or guests’ opinion formation (positive or negative) of the service quality, as often reflected in customer-generated online ratings of hotels. In this section, we present pertinent theories that help to understand antecedents to OCS related to the hotel service sector.
The first theory is the expectancy disconfirmation paradigm (EDP). This theory is predicated on the idea that the degree of congruence between aspirations and the perceived reality of experiences determines customer satisfaction [67]. The model suggests that consumers make pre-purchase plans when they buy products and services. According to Kim et al. [72], these predictive expectations are created by manufacturers, service providers, company reports, or unspecified sources, and sometimes the consumer’s past experience with the anticipated performance. The customer sets a standard of measurement based on these expectations even before the consummation of the service or product. The level of expectation then serves as a benchmark for evaluating the quality of the service. Expectation and performance are the main features of this theory. Depending on whether service expectations and performance differ positively or negatively, a consumer is either satisfied or unsatisfied. Therefore, when service performance meets or exceeds the client’s initial expectations, there is positive confirmation, and the customer is satisfied. On the other hand, the customer is dissatisfied when performance falls below expectations of service quality. The implication of this theory for the hotel service industry is that most customers have a predetermined expectation of standard service quality and that these standards or expectations vary by destination. Therefore, commercial tourists’ expectations must be identified and differentiated from religious tourists and appropriately served.
The second is the contrast theory, which is related to the EDP regarding customers’ initial expectations. Contrast theory suggests that customers will react favorably or unfavorably to disconfirmation experiences depending on whether results differ from expectations [68]. However, according to contrast theory, consumers will exaggerate the difference when a product or service’s performance falls short of their expectations [72]. According to this theory, products that perform below expectations will be considered worse than they actually are [73,74]. For example, a negative disconfirmation is believed to result in a low product evaluation, whereas a positive disconfirmation is thought to lead to a high product appraisal [75]. The same implication as in the case of the EDP still holds for the contrast theory, but with greater intensity as the negative or positive impact is exaggerated. For consumer-generated OPRs, poor hotel ratings would exaggerate the customers’ perception of poor performance, while good hotel ratings would exaggerate the customers’ perception of good performance. The contrast theory also suggests that commercial and religious tourists with differing expectations should be identified and served appropriately; failing to do so may increase customer dissatisfaction.
The equity theory is another theory that explains customer satisfaction [69,70]. According to the equity theory, consumers are satisfied when they receive more value than they pay [76]. Multiple studies indicate that tourists will be satisfied with the service they receive if they perceive that the service quality exceeds the amount they paid [77,78,79]. In essence, perceived value has a direct impact on visitor satisfaction. In addition, equity theory asserts that people need consistency between what they expect and what they receive. Therefore, to give customers a satisfying experience, both sides of this equation (output/input ratio) must be consistent and fair [80].
Attribution theory is the last theory in this study. Attribution theory is more frequently employed to explain customer complaint/dissatisfaction models rather than customer satisfaction models [71]. Businesses must comprehend their consumers’ demands, wants, and pain areas to satisfy them. Only then can they ensure customers are satisfied with every interaction [35]. According to attribution theory, customers are logical information processors looking for explanations for why a purchase outcome, like dissatisfaction, occurred [81]. These reasons may include the product or service, the price, and even the person who sold it. Most often, these reasons for the dissatisfaction/complaining are always correlated (inter-correlated attributions). However, to the service provider (e.g., hotel), it is important to identify the cause of dissatisfaction, particularly those attributes that are within the control of hotel management, and to improve upon them.

2.2. Commercial and Religious Destinations

The destination can be described as a fusion of the consumer’s space and tourist attractions that offer a comprehensive experience that is subjectively assessed based on the consumer’s travel plans, cultural background, the reason for the visit, etc. [82,83,84]. A destination can be defined as a person’s mental representation of their knowledge, feelings, and general viewpoint on a certain location [85]. Additionally, Tasci and Gartner [86] view the destination image as a dynamic system of ideas, attitudes, and purposes that are directed at the location. According to Jauhari and Sanjeev [87], religious tourism is viewed as travel with a purpose rather than a luxury and is largely resilient to economic slumps.
Prior research indicated that a trip’s destination or purpose significantly impacted tourist behavior [88,89]. Numerous researchers concur that destination image significantly influences visitor behavior, including destination selection, decision-making, and satisfaction [90,91,92,93]. Moreover, the destination goes beyond the physical place [94]. According to Rashid [95] and Villamediana-Pedrosa et al. [96], people can travel to the same destination for vastly diverse reasons, including religious pilgrimage for some and tourism (adventure or cultural) or pilgrimage (cultural or nostalgic) for others [47].
Every destination has an intention, an expectation, and a purpose, which determines customer/tourist behavior and, as a result, the overall degree of consumer satisfaction. Businesses need to acknowledge the diverse desires of tourists and visitors [83]. Commercial destinations are known for pursuing leisure activities, seeking pleasure, and spending vacations [47]. Religious tourism is a type of special-interest tourism driven primarily or completely by religious motivations, particularly the desire of the traveler to leave his place of permanent residence to visit a place considered holy [97]. Frequently, the visitor picks a precise moment to communicate with the divine to fulfill religious obligations, such as the completion of a vow, a request for divine favor, or an expression of appreciation [98]. However, it is widely known that tourist motivation is multifaceted; visitors go for various reasons, even within a single trip [99,100,101,102]. People may go to religious sites or engage in religious activities without having a religious drive or for various other reasons [59]. On the other hand, people may participate in non-religious activities with quasi-religious fervor [103]. Therefore, marketers need to recognize the diverse desires of tourists and visitors in their policy implementation, particularly regarding the weighting of elements that determine customer satisfaction [95].
Businesses have always been keen on commercial tourism and pursuing strategies to entice commercial tourists [104,105]. Businesses have taken an interest in religious tourism as a growing phenomenon because of the local community dynamics it generates [59]. Researchers are interested in religious tourism to investigate the interests, drives, and spiritual or cultural impulses that religious locations seem to arouse in visitors [106,107]. Businesses are interested in religious tourism opportunities due to additional revenue, and creating job opportunities [61,98,103,108,109].
Prior research has often examined commercial destinations and determined the motivations, expectations, and typical factors influencing customer satisfaction during hotel stays [53]. Few studies have been conducted on the motivations of consumers to stay at hotels in religious places, particularly in Makkah [31,33,52,53]. Tourists’ preference for a destination can help to identify critical factors impacting online hotel ratings [13,14,110] regarding religious and commercial destinations. It can help identify and prioritize utility-providing qualities in the hotel services that meet customers’ different needs. In this study, it is the difference in customers’ preference for commercial or religious destinations. Therefore, the fundamental objective of measuring and explaining customer satisfaction is to determine how successfully hotels at a given destination recognize and respond to the demands of visitors [83], as well as to determine which aspects of the commercial and religious destination’s offerings require improvement.

2.3. Online Ratings and Customer Satisfaction

Appreciating and understanding customer behavior and satisfying customers’ needs are very important [111,112], especially in the service industry [113,114,115]. According to Chu and Choi [37], a company must first understand customers’ needs, wants, and pain points to satisfy them. Only then can it ensure that customers’ demands are met during every encounter.
The customer’s or guest’s expectations play a critical role in satisfaction resulting in opinion formation (positive or negative). Fen and Lian [116] consider customer satisfaction as an outcome of comparing the supplier’s perceived performance of the product or service in relation to the customer’s expectation. According to Albayrak and Caber [35], service quality is a relativistic and cognitive mismatch between experience-based standards and performance related to the benefits of the product/service. The gap between a tourist’s expectations and perceived value is tourist satisfaction [117]. When expectations are far higher than the product’s performance, and they are not met, it might backfire because little differences may be overlooked entirely, but major differences may lead to bad results [72]. Given these issues, improving service performance might be the best action [118].
In the current marketplace, hotels must give customer-pleasing, high-quality, cutting-edge services to improve service performance and satisfy customers. According to Kandampully [112], a hotel manager must measure visitor satisfaction and comprehend their behavior to meet guests’ expectations and identify their requirements, wants, and preferences. This notion is that to be successful and profitable and survive in today’s vibrant and fiercely competitive tourism market, hotels must deliver great services at a reasonable price and better than the competition [119]. In addition, hotels should adopt sustainable practices because they may affect customer satisfaction and online review ratings [120,121]. Hotels that effectively convey their sustainability practices to customers via their websites, booking platforms, and on-site materials obtain higher online review ratings [122,123]. Customers’ perceptions of a hotel’s commitment to sustainability impact their overall satisfaction with their stay [124,125]. Generally, hotels promoting and implementing sustainability practices obtain higher customer ratings and more positive feedback [32]. Therefore, hotels must handle customer satisfaction effectively to be profitable and sustainable.
To improve customer satisfaction and identify opportunities for service recovery, researchers and practitioners in the hotel sector emphasize analyzing online ratings data. This is because Internet-savvy customers are more likely than ever to post their honest opinions about service experiences online [126]. Online ratings are important sources of ideas for service enhancements and innovations. Understanding and recognizing the customer-generated online hotel ratings directly impacts customers’ or guests’ opinion creation (positive or negative) of the service quality and can improve service delivery. Online ratings serve as a source of marketing strategy to understand consumer behavior [127,128,129] and assist hotels in determining client contentment and displeasure [36,130,131]. Online ratings also help managers make better decisions to increase client satisfaction [54,115]. In addition, online ratings play a vital part in successful destination marketing since they impact the selection of a location, the consumption of goods and services, and the decision of customers to return [117,118].

2.4. Hotels’ Online Attributes and Customer Satisfaction

Previous studies have identified several hotel service attributes that influence customer satisfaction and dissatisfaction based on consumer-generated OPRs [53,132,133,134,135]. The current research identified hotel attributes (comfort, staff attitude, cleanliness, facilities, location, value for money, breakfast, and Wi-Fi) and their specific effects on OCS. Earlier studies have grouped these attributes in their analysis. Soliman et al. [136], Maddox [137], Li et al. [36], and Singh and Alhamad [33] adopted the Herzberg et al. [138] two-factor theory to inform two sets of factors: satisfiers and dissatisfiers. Singh and Alhamad [53] adopted Cadotte and Turgeon’s [139] four-factor theory to inform four sets of factors: satisfiers, dissatisfiers, criticals, and neutrals.
The customer’s comfort is considered a key attribute for choosing a hotel. Li et al. [36], using online review ratings covering 774 hotels of various classifications, revealed that customers’ comfort is an imperative factor for tourists to stay in hotels. Hua et al. [39] and Öğüta and Cezara [44], using customers’ data from Chinese budget hotels and online review data of Paris hotels from Booking.com, respectively, confirmed comfort as an essential factor for customers’ satisfaction that may result in repeat booking. According to Singh and Alhamad’s [53] analysis of Makkah hotels, comfort is a critical factor in determining customer satisfaction.
Staff attitude is another hotel attribute that influences customer satisfaction. The personal relationship with customers, attending to their needs, courtesy, a warm welcome, etc., will encourage customers to stay in a hotel and return. The studies of Kim et al. [41], which used online review ratings from TripAdvisor of 100 New York City hotels, and O’Connor et al. [140], which utilized comments from TripAdvisor, concluded that staff attitudes influence customer satisfaction. Similarly, Öğüta and Cezara [44], Becerra et al. [141], and Raguseo and Vitari [25] also confirmed the importance of hotel staff attitude in improving customer satisfaction. The Makkah hotel studies of Alhamad and Singh [31] and Singh and Alhamad [53] revealed staff attitude as a significant factor and satisfier, respectively.
Another attribute that previous studies have considered as an antecedent to hotel customers’ satisfaction is cleanliness. This factor sometimes extends beyond the physical surroundings to include environmental conditions such as climate, air quality, and feelings toward the destination [142,143]. Using TripAdvisor and CTrip.com data on hotels in China’s major cities, Au et al. [40] reported that cleanliness is a significant factor among other variables. The works of Kim et al. [41], Liu et al. [45], and Alhamad and Singh [31] also revealed similar results. According to Singh and Alhamad’s [33,53] studies of Makkah hotels, cleanliness is a satisfier in determining customer satisfaction.
Facilities in a hotel also influence customer satisfaction [25,142]. Li et al.’s [36] study on various hotel classifications (luxury and budget) also discovered that hotel facilities are imperative factors that influence customer satisfaction. Kim et al.’s [41] New York City hotel study revealed that hotel facilities influence customer satisfaction. Alhamad and Singh’s [31] study using Booking.com data from 172 hotels in Makkah city classified attributes of hotels into significant and trivial factors that impact online consumer ratings and opined that hotel facilities, among other variables, affect customer satisfaction. Singh and Alhamad’s [53] Makkah hotel study revealed hotel facilities as a critical factor in influencing customer satisfaction.
Previous studies identified the location of the hotel as a factor contributing to customer satisfaction [40,53]. For example, Hua et al. [39] and Au et al. [40], using consumer- generated OPRs from CTrip.com, confirmed that location is a key determinant of hotel customer satisfaction. Furthermore, in their respective studies, Barsky and Labagh [144] and Gu and Ryan [145] classified location as a satisfier, meaning it increases customer satisfaction. Finally, a recent study by Singh and Alhamad [53], using online consumer review data from Booking.com for hotel ratings for Makkah, concluded that the location is a satisfier and an important antecedent to customer satisfaction.
Furthermore, cost (the expenses considered by tourists while staying in a hotel), which most authors also consider as value for money, is another important factor [142,146]. This factor is linked to the equity theory [69,70]. Equity theory states that consumer satisfaction occurs when more value is received than is paid for. Several researchers have discovered that visitors will be satisfied with the services they receive if they consider that the services’ quality exceeds the cost [77,78,79,147]. According to Li et al. [36], high-end and low-end hotel guests must prioritize the value they receive relative to their expenditures. Raguseo and Vitari [25] and Phillips et al. [43], using online customer reviews of French and Swiss hotels, respectively, concluded that value for money is crucial for customers’ satisfaction. But separate studies conducted by Alhamad and Singh [31] and Singh and Alhamad [53] using Booking.com consumer-generated OPRs for hotels in Makkah confirmed value for money spent as a factor influencing customer satisfaction but considered it a trivial factor and neutral factor, respectively.
Finally, the breakfast and Wi-Fi factors influence consumer satisfaction [31,33,35,53,148,149]. Albayrak and Caber’s [35] research on multinational tour operators confirmed breakfast availability as an essential factor for customers’ satisfaction. Buhalis and Foerste [148], Neirotti et al. [15], and Singh and Alhamad [33] also considered the quality of breakfast as an important factor in customer satisfaction. In addition, providing free Wi-Fi service is considered an essential attribute of hotels. According to studies conducted in Europe by Bulchand-Gidumal et al. [149], Wi-Fi increased hotel ratings by up to 8%, demonstrating customers’ satisfaction. However, Alhamad and Singh [31] and Singh and Alhamad [53], using online customer review data for hotels in Makkah, reported breakfast and free Wi-Fi as trivial factors and breakfast as a neutral factor, respectively.

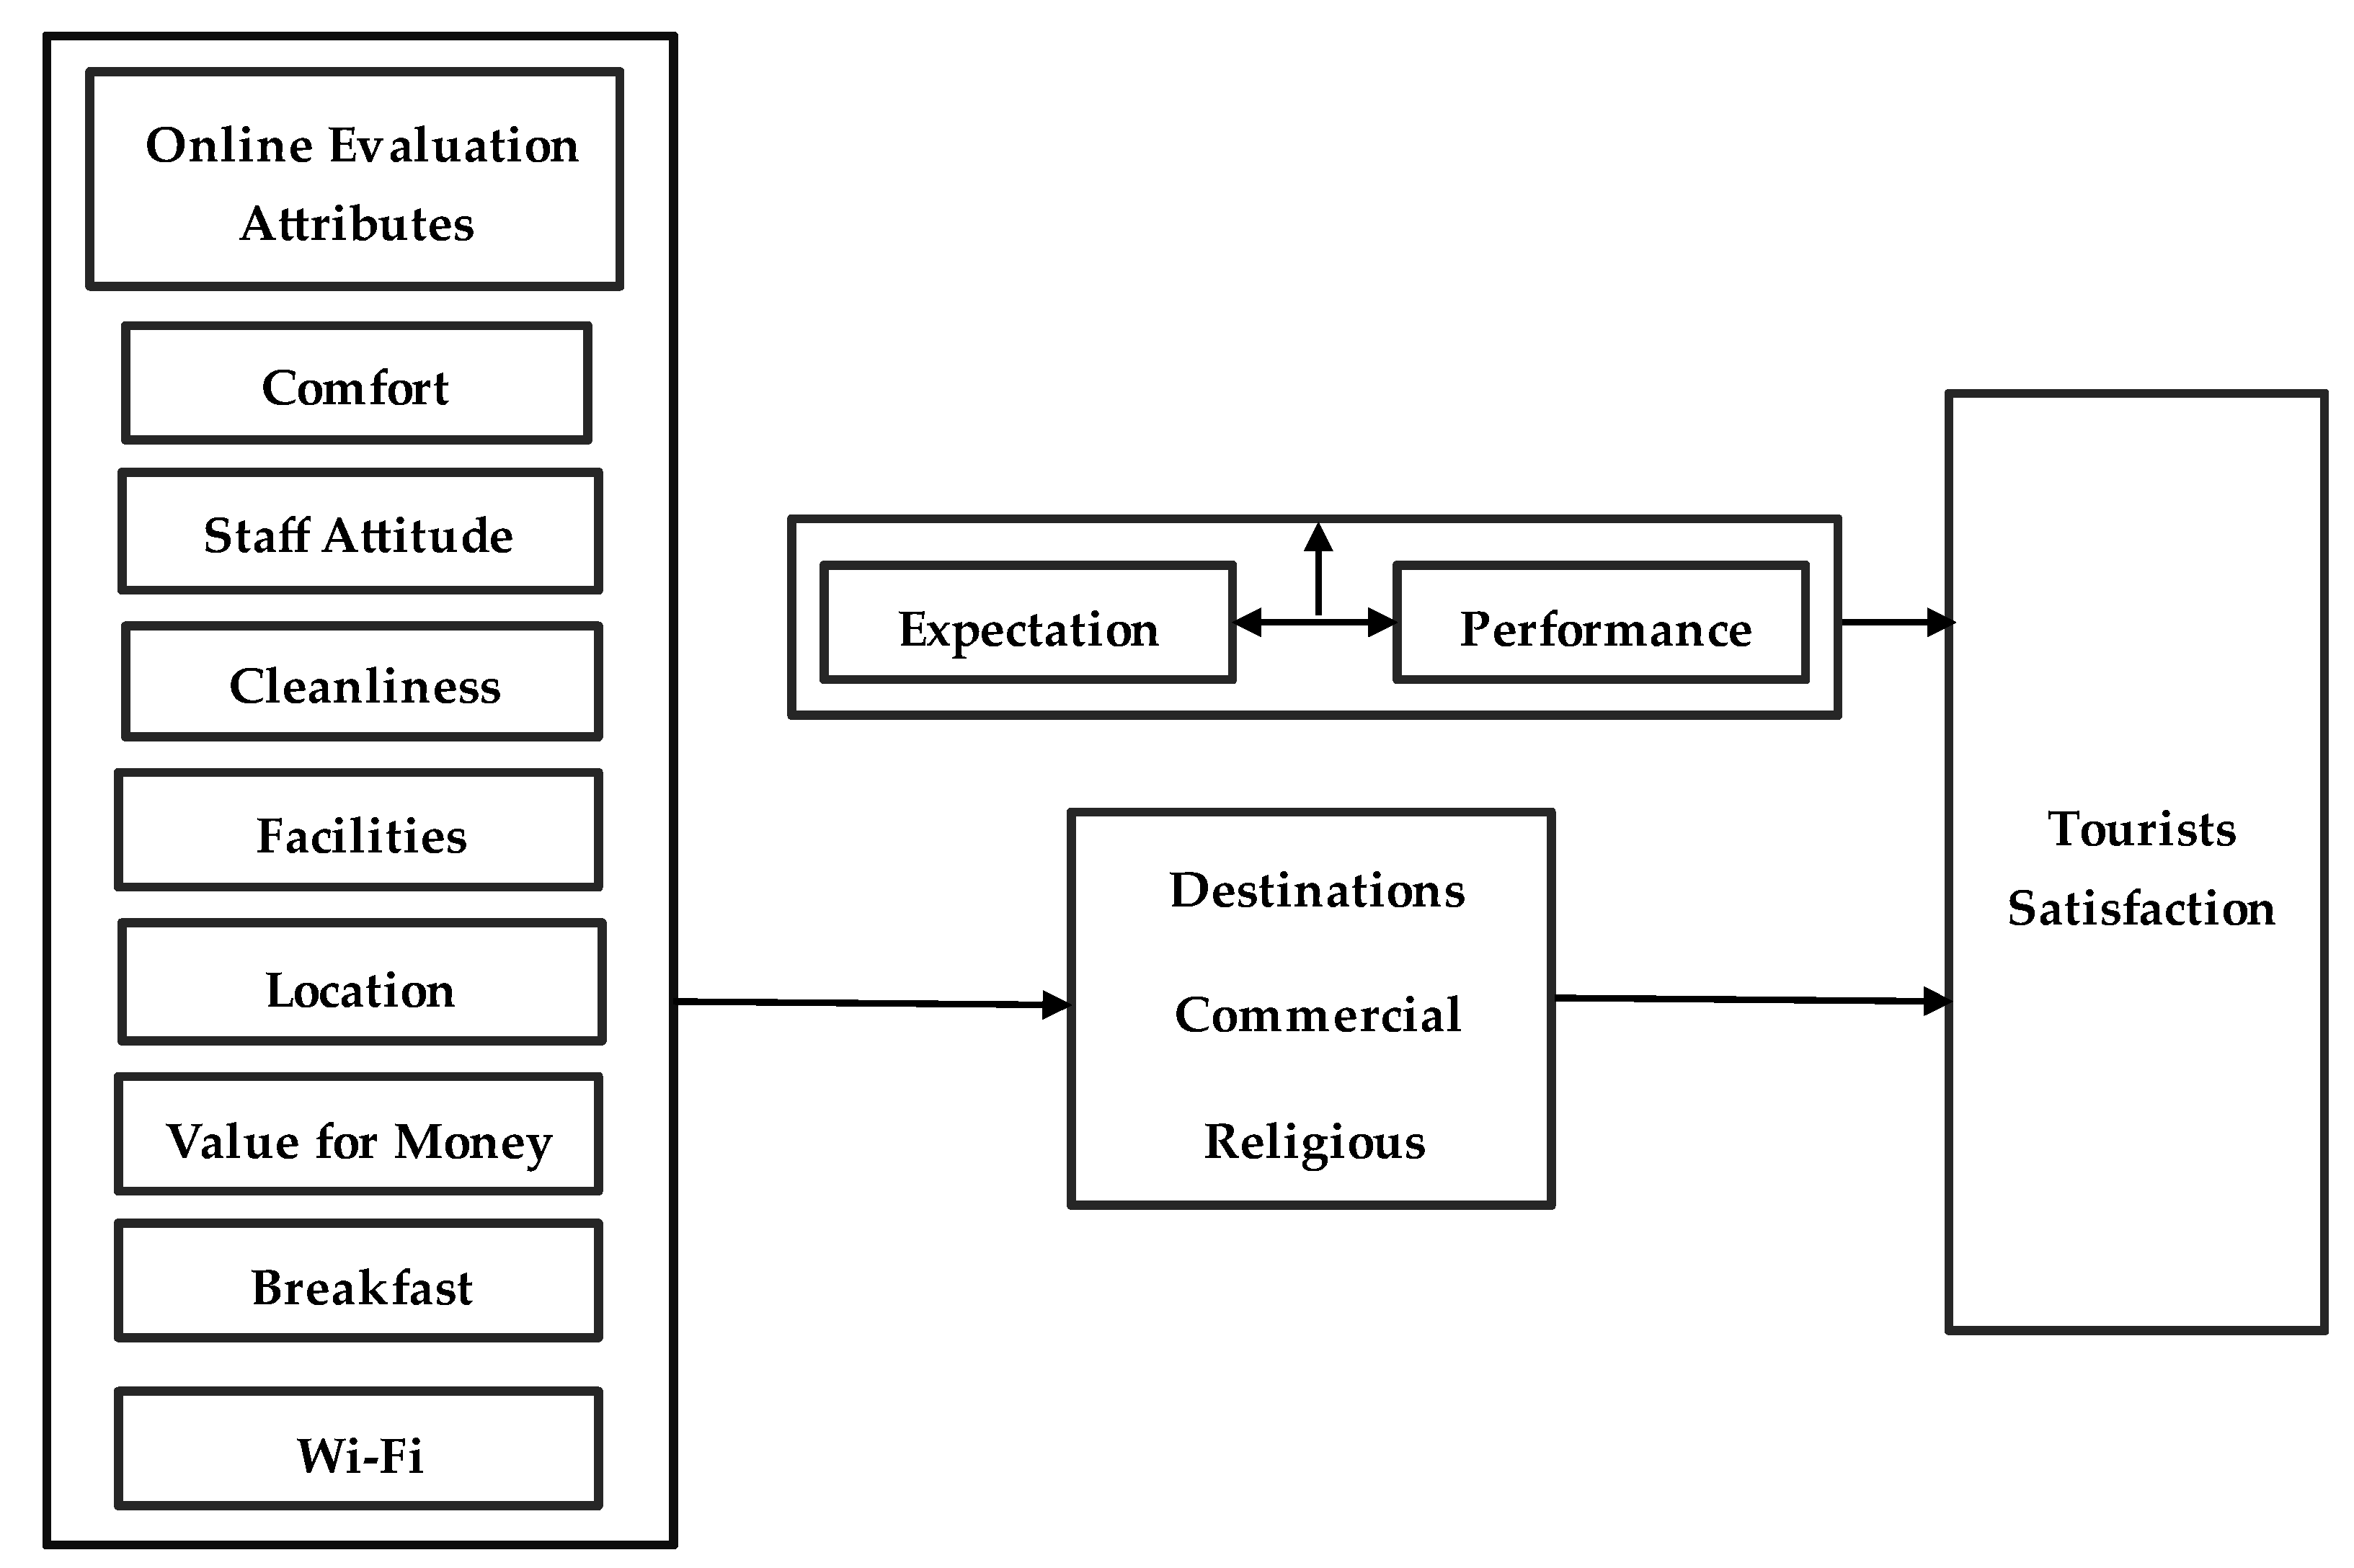
2.5. Hypotheses and Conceptual Model

Prior research revealed that comfort [36,39,44,53], staff attitude [25,31,41,44,53,140,141], cleanliness [31,33,40,41,45,53,142,143], facilities [25,31,36,41,53,142], location [39,40,53,144,145], value for money [25,31,36,43,53,142,146], breakfast [15,33,35,148], and Wi-Fi [31,53,149] influence hotel customers’ satisfaction. Therefore, we propose these eight hotel quality attributes identified in this study. These attributes are derived from consumer-generated OPRs that positively affect hotel guests’ satisfaction.
Thus, we hypothesize the following:
H1. 
Comfort positively impacts hotel guests’ satisfaction.
H2. 
Staff attitude positively impacts hotel guests’ satisfaction.
H3. 
Cleanliness positively impacts hotel guests’ satisfaction.
H4. 
Facilities positively impact hotel guests’ satisfaction.
H5. 
Location positively impacts hotel guests’ satisfaction.
H6. 
Value for money positively impacts hotel guests’ satisfaction.
H7. 
Breakfast positively impacts hotel guests’ satisfaction.
H8. 
Wi-Fi service positively impacts hotel guests’ satisfaction.
Figure 1 depicts the study’s conceptual model. The customers’ (commercial and religious tourists) satisfaction in the hotel industry is measured by the eight online evaluation attributes: comfort, staff attitude, cleanliness, facilities, location, value for money, breakfast, and Wi-Fi service. It is influenced by the expectations of customers (tourists) and service providers’ (hotels’) performance.

3. Methodology

3.1. Data Collection

We gathered data from Booking.com, as it is one of the most popular UGC review sites and is most often used online by tourists worldwide [129]. The aggregated numerical ratings data of online hotel ratings is available on the Booking.com platform on a scale of 1 to 10. We collected aggregated numerical ratings data of the study variables. We prepared a dataset consisting of 8 independent variables and one dependent variable. The independent variables represented the online evaluation attributes, and the dependent variable represented the customers’ satisfaction. Accordingly, hotels’ online numerical ratings data were collected from 364 hotels in Saudi Arabia. In line with the purpose of this study, the study sample included 177 hotels in Alkhobar, a city noted for its commercial tourism, and 187 hotels in Makkah, commonly associated with religious tourism [53]. Hotels with incomplete records were eliminated from the study. The final sample consisted of 171 hotels representing 41,368 corresponding customer numerical reviews for Alkhobar and 167 hotels representing 41,336 customer numerical reviews for Makkah. In total, data from 338 hotels in Alkhobar and Makkah, representing 82,704 customer numerical reviews, were selected.

3.2. Variables and Measurement

This study collected two data sets based on the two destinations: commercial (Alkhobar) and religious (Makkah). The independent variables data was in the form of aggregated numerical ratings based on eight hotel quality attributes (comfort, staff attitude, cleanliness, facilities, location, value for money, breakfast, and Wi-Fi). OCS is used as a proxy for the customers’ overall aggregated numerical ratings of the hotels [33,53] as the dependent variable.

3.3. Methods

This study used two independent methods for results and analysis. The first and main method is the Importance–Performance Analysis (IPA). The significance–performance space produced by this technique is often divided into four quadrants and displayed as a two-dimensional importance–performance grid in which the importance and performance values of various hotel features are plotted against one another [150]. These attributes displayed in the quadrants assist managers in identifying areas with effective performance and prioritizing areas that require improvement. The second technique is the application of beta regression analysis [49,151], which is used as a robustness check in this study and to test the research hypotheses.

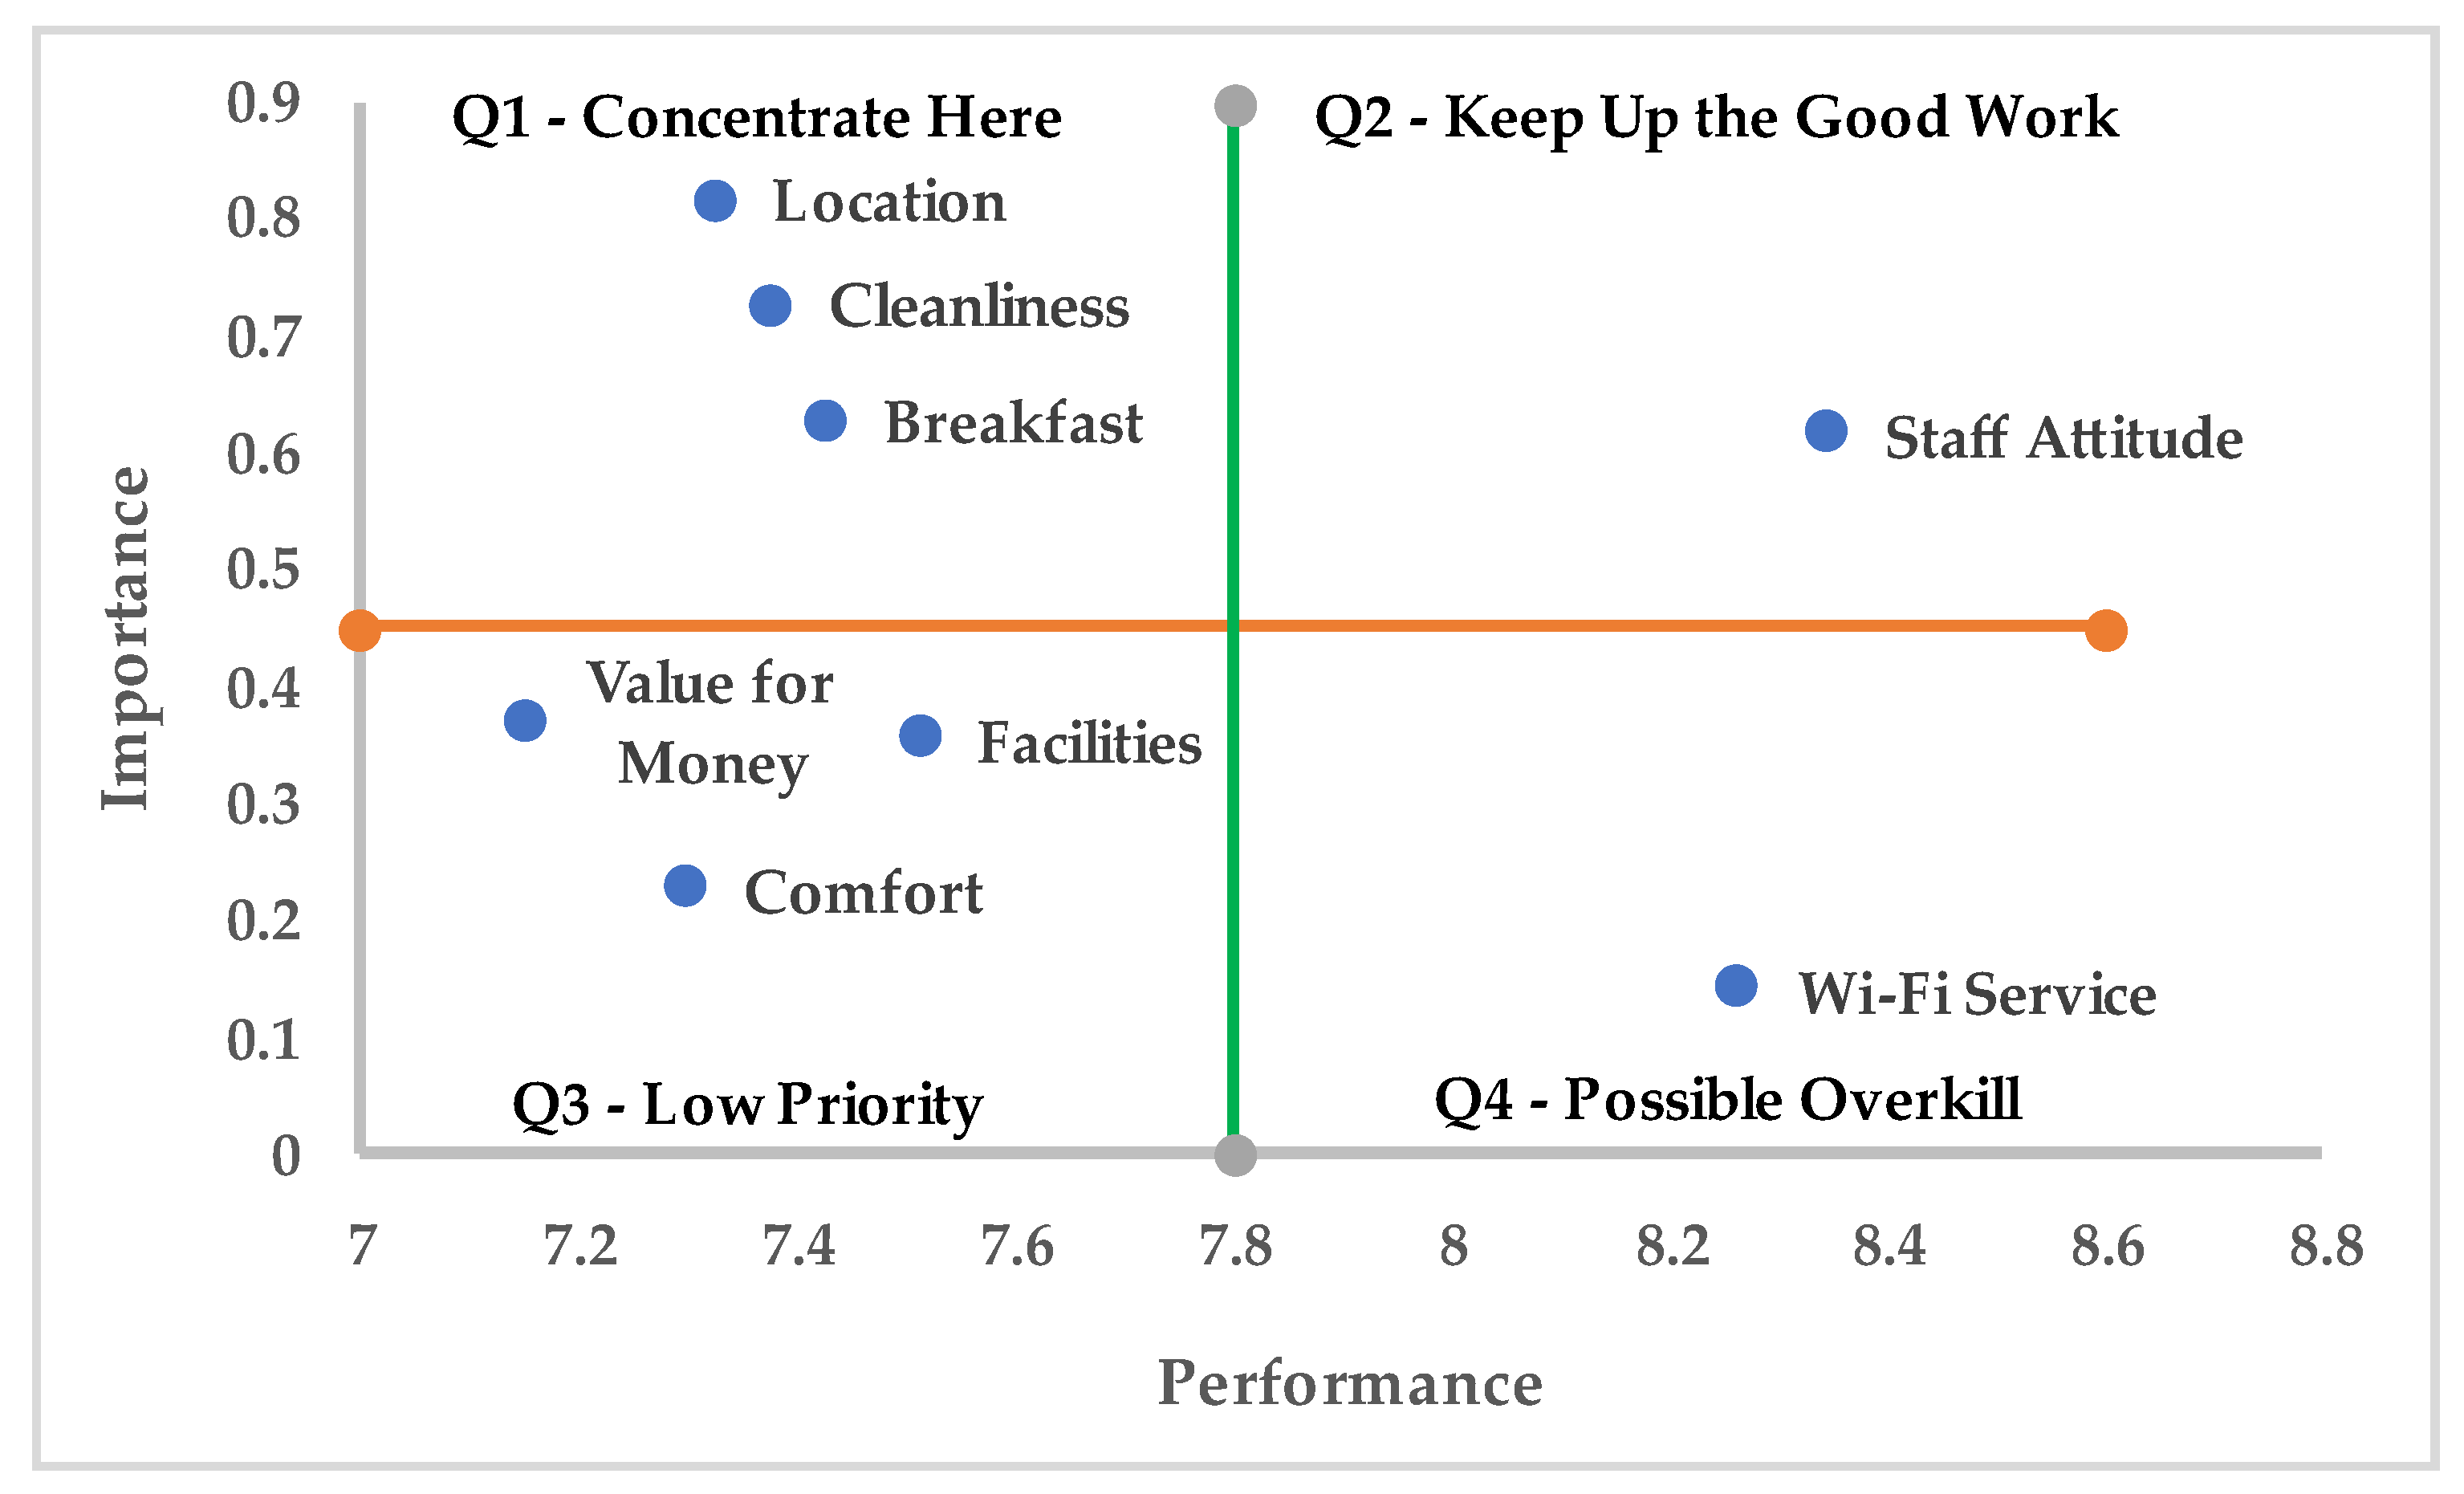
3.3.1. Importance–Performance Analysis (IPA)

Researchers have used a variety of ways to investigate customers’ perceptions of the quality of hotel attributes and their satisfaction with the overall experience. This is due to the importance of customer satisfaction to the profitability of the hospitality industry. This study adopts the IPA model to analyze the user-generated online hotel ratings data. When performance and importance values for various variables are plotted against one another using the IPA technique, a two-dimensional importance–performance grid is often divided into four quadrants. The service traits shown in these quadrants for service businesses assist managers in identifying areas of strong performance and prioritizing areas that require improvement [150].
In addition to the initial IPA technique proposed by Martilla and James [152], several authors [153,154,155,156,157,158,159,160,161] have suggested modified versions but each with some disadvantages. The methods differ as a result of the various theories that indicate how service performance and gaps should be measured as well as how the significance of services should be perceived [162,163,164,165,166].
The IPA model proposed by Martilla and James [152] is the most common model and has drawn the interest of various academics and practitioners in a variety of research settings: hotels [157], tourism [167,168], restaurants [22,169], destination management [170], and tour services [171]. Like its other variations, IPA has a strong foundation in service theories that concentrate on tools for assessing and analyzing service performance and gaps [166] and interpreting the level of importance of these services [172].

3.3.2. Implementation of IPA

Applying the IPA involves aggregating the ratings for each attribute in terms of performance and importance [173,174,175]. Several studies show that all attributes do not occupy the same proportion in explaining OCS with a particular service [176,177,178,179]. In this study, each attribute’s performance level (measure) is obtained from the mean of the perceptions of service attributes via the consumer-generated OPRs of hotels. For the importance values, we adopted the indirect measures in line with Albayrak and Caber [35] and Taylor [180]. Correlation coefficients of the service attributes with OCS were obtained by multivariate regression analysis [181,182]. In line with the focus of this study, the IPA model was then employed to compare the commercial and religious destination tourists’ perceptions of the derived factors, which are the perceived performance and importance of each hotel attribute.
Following previous studies [35,152,153,157,183,184,185,186], each attribute or factor (performance, importance) calculated is plotted into a two-dimensional graphical grid that displays the importance of attributes on the vertical axis from high (top) to low (bottom) and the performance of attributes on the horizontal axis from high (right) to low (left). Furthermore, the calculated mean values of the performance and importance separated the grid into four distinct quadrants (Figure 2). The position of the factors (the performance and importance of attribute) in the four identifiable quadrants separately for commercial and religious destinations enables the identification and prioritization of hotel attributes that influence OCS for their respective customers. The main goal is to provide direction for hotel owners or managers when making strategic decisions, such as directing resources primarily to enhance the standards of services significantly.
Figure 2 presents the four quadrants of the IPA grid. The attributes in quadrant 1, “concentrate here”, are highly valued by customers, but their performance is low. The attributes in quadrant 2, “keep up the good work”, are highly valued by customers, and the company excels in them as well. The attributes in quadrant 3, “low priority”, have low importance in customers’ minds and perform lowly, so the company does not need to address them. The attributes in quadrant 4, “possible overkill”, perform well but are lowly valued by customers; consequently, the company must proceed with caution when allocating resources [35,152,187].

3.3.3. Beta Regression Analysis

The second technique is beta regression analysis, which is designed specifically for modeling rate and proportion variables [49,151]. The standard error-induced inefficiency of estimators is eliminated via beta regression [188]. Regression coefficients that are standardized against one another are known as beta coefficients. They are comparable to the slope in a simple regression. In most cases, coefficients may not be directly compared because they depend partly on widely varying means and variances of the independent variables. To account for the differences in the independent variables’ range and variance, their values are converted into deviations. The deviations closely resemble a Z score. The objective is to express the values of each independent variable in the data set in terms of their distance from the mean or standard deviations [189].
Due to standardization, the magnitude of regression coefficients’ impact can be directly compared because they use the same scale or units [190]. A standardized beta coefficient measures the strength of the impact of each independent variable on the dependent variable. The impact is stronger at a higher level of the beta coefficient’s absolute value [191].
The multiple regression equation with the performance of hotel attributes as the independent variables and total customer satisfaction as the dependent variable is depicted below:
Y = β0 + β1 COM + β2 STA + β3 CLE + β4 FAC + β5 LOC + β6 VFM + β7 BRE + β8 WFS + ε
where
  • Y = Overall rating representing customer satisfaction;
  • COM = The numerical rating performance of the comfort attribute;
  • STA = The numerical rating performance of the staff attitude attribute;
  • CLE = The numerical rating performance of the cleanliness attribute;
  • FAC = The numerical rating performance of the facilities’ attribute;
  • LOC = The numerical rating performance of the location attribute;
  • VFM = The numerical rating performance of the value for money attribute;
  • BRE = The numerical rating performance of the breakfast attribute;
  • WFS = The numerical rating performance of the Wi-Fi service attribute;
  • ε = Error term.

4. Results and Discussion

This study used two independent methods for the study results and analysis: IPA and beta regression analyses. The IPA and beta regression analyses results are presented below.

4.1. IPA Results

We applied the standard statistical procedures to assess bias and multicollinearity in this study [192]. The variance inflation factor (VIF) was examined to check multicollinearity concerns. The Breusch-Pagan and Koenker tests were used to assess the heteroscedasticity. VIF values fluctuate from 1.528 to 3.002 (Table 1), which is lower than the threshold of 5 [193,194,195]. Also, the p-value is less than 0.05, which indicates that the variables are free from heteroscedasticity [192,196,197].
Following Albayrak and Caber [35] and Chu and Choi [37], performance and importance scores of the hotel attributes (standardized beta coefficient) were obtained prior to locating them into the IPA matrix. Additionally, the intersection of the X (performance) and Y (importance) axes was used to calculate the grand means of the performance and importance scores for each of the eight attributes. Table 2 and Table 3 show the regression analysis results for commercial and religious destinations. The results indicate that the eight hotel attributes explained 76.3% and 73.2% of the total variance (OCS) in commercial and religious destinations, respectively. All regression coefficients are significant at the 0.05 level for both commercial and religious destinations (Table 2 and Table 3).
Figure 3 and Figure 4 present the IPA analysis grids of commercial and religious destinations, respectively.

4.1.1. Discussion of IPA Results

As shown in Figure 3 and Figure 4, commercial and religious destination tourists do not have similar perceptions towards the selected eight hotel quality attributes. There is intention, expectation, and purpose for commercial and religious destinations, which influences customer/tourist behavior and their preference for hotel attributes. This supports the expectancy disconfirmation paradigm [67] and contrast theory [68,72], which suggest that commercial and religious destination customers may have different service quality expectations for hotels. This also lends support to attribution theory [71], as a standard approach to serving both commercial and religious tourists may backfire and result in customer dissatisfaction due to their differing needs at each destination. The following discussion provides meaningful insights about the IPA quadrants as they reflect customers’/tourists’ perceptions of the hotels’ attributes.

Quadrant 1

This quadrant captured four (comfort, facilities, value for money, and cleanliness) and three (location, cleanliness, and breakfast) of the eight quality attributes of hotel services for commercial and religious destination tourists, respectively. Tourists perceive these attributes as important for OCS, but their performance levels are relatively low. This indicates that improvement efforts should focus on these attributes by allocating more resources. There is a clear distinction between the perceived preferences of commercial and religious tourists; while the former prioritizes comfort, facilities, value for money, and cleanliness, the latter prioritizes location, cleanliness, and breakfast. This result supports the expectancy disconfirmation paradigm [67] and contrast theory [68,72], which indicate that commercial and religious destination clients could have distinct service quality expectations for hotels. In accordance with attribution theory [71], hotel managers should strive to meet the distinct needs of commercial and religious tourists to prevent customer dissatisfaction.
Commercial destination tourists may prioritize comfort and hotel facilities as they engage in leisure and pleasure-seeking activities (Figure 3). This result is consistent with the studies of Li et al. [36], Hua et al. [39], and Öğüta and Cezara [44], which regarded customer comfort as a crucial attribute. The facilities attribute result is also in line with Li et al. [36], Suanmali [142], Kim et al. [41], and Raguseo and Vitari [25] in influencing OCS. The findings also suggest that paying special attention to the value-for-money aspect is necessary since commercial destination travelers have shown signs of being more frugal, reducing their discretionary spending, and looking for ways to obtain more for less money [25,43,146]. According to studies by Chen and Chen [78], Song et al. [77], Hsu and Huang [79], Li et al. [36], Phillips et al. [43], and Lo and Yeung [147], visitors will feel satisfied with the service they receive if they believe its quality is higher than the price they paid. The equity theory [69,70], which states that consumer satisfaction occurs when they perceive more value is received than they spend, is also supported by this result. Lastly, hotels in commercial destinations should also focus on cleanliness aspects. This result is in accordance with Suanmali [142], Au et al. [40], Kim et al. [41], and Liu et al. [45].
Based on this study’s results, the factors (importance and performance) that influence the religious destination tourists’ satisfaction are different from those that influence the commercial destination tourists’ satisfaction, (Figure 4). For this reason, hotel managers should give these attributes higher importance when marketing to this group of travelers. Religious motives and needs, such as vow fulfillment, supplication for grace, and expressions of appreciation, might be the primary drivers of religious travel [198]. As a result, most visitors view it as purposeful travel rather than a luxury [87]. Their behavior and expectations reflect religious motives. For this class of tourists, location is the most important OCS-influencing attribute. Location means having easy access and movement to religious sites and places of religious significance with minimum inconveniences. This activity is seen as the central aim of the tour. This result aligns with Hua et al. [39] and Au et al.’s [40] studies. Specifically, this result reflects the findings of Singh and Alhamad’s [53] study on Makkah, Saudi Arabia. The results of cleanliness and breakfast attributes also show the importance of these attributes. Most religions often consider cleanliness next to godliness [143]. Breakfast, which may be the day’s first meal, is preferred early enough to have time for prayer, fasting, and other religious rites. This finding is also in accordance with Singh and Alhamad [53].

Quadrant 2

In this quadrant, the current study identified two attributes (staff attitude and breakfast) for commercial destinations and one attribute (staff attitude) for religious destinations (Figure 3 and Figure 4). In this quadrant, attributes are perceived to be important, and the providers of these services also have high levels of performance of these services. The commercial and religious destination tourists have the same level of perception regarding staff attitude. The staff attitude result in commercial and religious destinations is in accordance with O’Connor [140], Öğüta and Cezara [44], Becerra et al. [141], Kim et al. [41], Raguseo and Vitari [25], Alhamad and Singh [31], and Singh and Alhamad’s [53] studies. Commercial destinations should continue to provide a quality breakfast, as commercial tourists value it. This result is in accordance with the studies of Albayrak and Caber [35], Buhalis and Foerste [148], and Neirotti et al. [15]. Hotel managers should sustain the resources spent on providing these services and maintain a high performance level.

Quadrant 3

Figure 3 and Figure 4 further show attributes in the low-priority quadrant. This quadrant captured two (Wi-Fi and location) and three (value for money, facilities, and comfort) of the eight quality attributes of hotel services for commercial and religious destination tourists, respectively. Customers perceive hotel quality attributes in this quadrant as less important, and their performance is low. It is generally accepted that sufficient resources should not be allocated to these attributes. There is a clear distinction between commercial and religious tourists’ perceived preferences. This result buttresses the expectancy disconfirmation paradigm [67] and contrast theory [68,72], indicating that commercial and religious destination customers have different service quality preferences for hotel attributes. Commercial tourists consider Wi-Fi and location as a low priority in influencing OCS. The Wi-Fi result does not support the study of Bulchand-Gidumal et al. [149]. This is because customers may be less reliant on Wi-Fi due to the proliferation of mobile data plans available today. Further, the study results also suggest that commercial destination customers do not give the same priority to the location as religious destination customers. The study results also suggest that value for money is less important for religious destination customers than commercial destination customers. This result supports the Makkah hotel studies of Alhamad and Singh [31] and Singh and Alhamad [53].

Quadrant 4

Finally, Figure 4 (religious destination) identified Wi-Fi service as the only attribute for possible overkill. Religious destination customers are satisfied with the hotel’s Wi-Fi performance, though not much importance is attached to this high performance. This result does not support Bulchand-Gidumal et al.’s [149] study, as customers may be less reliant on Wi-Fi due to the increasing availability of mobile data plans. Therefore, managers may curtail resources expended on Wi-Fi service and divert them to other service areas, but care must be taken not to dilute the value of the current service. The commercial destination tourists in this study have no attribute as low importance with relatively high performance. According to Chu and Choi [37], tourists have minimum important service expectations, below which they cannot settle as far as the hotel’s performance is concerned. Therefore, it is the hotel management’s responsibility to determine optimum service while considering the customer as the center point of the organization, especially in a competitive market. In as much as all these hotel quality attributes influence customer satisfaction, it is necessary to identify and prioritize these attributes as they relate to each group of customers or tourists to enable the efficient application of limited resources to obtain optimum results.

4.2. Beta Regression Analysis Results

In this study, the beta regression analysis was used as a robustness check and to test the research hypotheses. Table 4 and Table 5 show the beta regression analysis results for commercial and religious destination customers, respectively.

Discussion of Beta Regression Analysis Results

Table 4 and Table 5 present the results of the beta regression to assess the predictive capability of the study’s hotel quality attributes on OCS and also show the relative influence of these attributes. The R-squared (R2) values are 0.724 and 0.701 for commercial and religious destinations, respectively. They indicate that the model fit is 72.4% for commercial destinations and 70.1% for religious destinations. All the attributes in the study model are significant and positive with OCS. In general, for each one-unit increase in the predictor variable (attribute), the outcome variable (OCS) will increase by the value of the beta coefficient. Therefore, all the study hypotheses (H1 to H8) are accepted. This indicates that comfort, staff attitude, cleanliness, facilities, location, value for money, breakfast, and Wi-Fi service positively impact hotel guests’ satisfaction.
Based on relative predictive power for the commercial destination attributes, comfort (β = 0.371), facilities (β = 0.322), value for money (β = 0.289), cleanliness (β = 0.251), staff attitude (β = 0.216), breakfast (β = 0.191), location (β = 0.136), and Wi-Fi service (β = 0.128) in this order have a positive and significant relationship with OCS (Table 4). Based on relative predictive power for the religious destination attributes, location (β = 0.339), cleanliness (β = 0.308), breakfast (β = 0.261), staff attitude (β = 0.241), value for money (β = 0.223), facilities (β = 0.201), comfort (β = 0.195), and Wi-Fi service (β = 0.163) in this order have a positive and significant relationship with OCS (Table 5).
There are indeed different hotel quality attributes that attract and appeal to different classes (commercial and religious) of tourists that meet or contribute to their satisfaction based on this approach. Therefore, in predicting critical hotel attributes that impact online hotel ratings for customers’ satisfaction, it is essential to identify and prioritize the significant differences among various groups of tourists. The results of the beta regression analysis, which also serves as a robustness check, are consistent with the results of the IPA method in identifying important hotel attributes and, therefore, may require more resources to improve performance to meet and improve OCS.

5. Conclusions and Implications

This study aimed to examine the varying effects of destination (commercial and religious) on the relationship between service quality and customer satisfaction as measured by OPRs generated by consumers. We collected hotels’ online ratings data from the Booking.com platform regarding 338 hotels in Alkhobar and Makkah, representing 82,704 customer reviews. Using the IPA technique, beta regression analysis methods, and customer satisfaction as the theoretical lens, this study analyzed the destination’s (commercial and religious) varying effects on the relationship between service quality and OCS. The study findings clearly distinguish between commercial and religious tourists’ perceived preference for hotel quality attributes, which influences OCS. The results of the current study indicate that hotels in commercial destinations should prioritize service quality attributes such as comfort, facilities, value for money, and cleanliness, while hotels in religious destinations should prioritize location, cleanliness, and breakfast. In addition, commercial destination hotel customers consider location and Wi-Fi service as low-priority attributes, whereas religious destination hotel customers consider value for money, facilities, and comfort as low-priority attributes. The destination effect is evident in service quality attributes such as comfort, facilities, and value for money, as commercial tourists place a high value on them, whereas religious tourists place a low value on them. In contrast, religious destination tourists place a high value on location, whereas commercial destination tourists place a low value on it. Due to the importance of staff attitude in influencing OCS for commercial and religious tourists, hotel managers should prioritize staff education and training. Commercial and religious tourists do not value Wi-Fi service, so hotel managers should proceed with caution when making additional investments in the technology.
This study provides important theoretical contributions to the online hotel ratings and customer satisfaction literature. First, we extend the online hotel review ratings and customer behavior literature to include the destination effect. There is intention, expectation, and purpose for every destination, which influences customer/tourist behavior and, consequently, the level of OCS. This study used several customer satisfaction theories: the expectancy disconfirmation paradigm [67], the contrast theory [68,72], the equity theory [69,70], and the attribution theory [71]. These theories explain the processes leading to different consumer groups’ satisfaction, such as commercial and religious destination customers. This study supports the expectancy disconfirmation paradigm and contrast theory by demonstrating that commercial and religious destination tourists have different hotel service quality expectations. This is apparent from the fact that commercial destination tourists valued comfort, facilities, and value-for-money service quality attributes, whereas religious destination travelers valued location, cleanliness, and breakfast. On the other hand, commercial tourists considered Wi-Fi and location as less important, whereas religious tourists viewed value for money, facilities, and comfort as less important. The study also supports attribution theory, as a standard approach to serving both commercial and religious tourists may result in customer dissatisfaction due to their differing needs at each destination. Therefore, researchers should consider the diverse preferences of commercial and religious travelers while developing appropriate consumer behavior theoretical propositions for online hotel reviews. In addition, the study supports the equity theory by demonstrating that value for money is a significant factor that influences OCS, especially that of commercial destination tourists. In contrast, the lower relevance of value for money among religious destination tourists suggests that this is not their primary motivation for visiting these locations. In the nutshell, the varying preferences of commercial and religious tourists extends the consumer behavior literature to the online hotel review ratings.
This study has important practical implications. Understanding customers’ behavior and the effect on their OCS is important, particularly for hotel service providers who can gain insight into such behavior of customers to improve their service delivery. The study distinguishes between the commercial and religious tourists’ perceived preference for hotel service quality attributes in influencing OCS. Therefore, hotel managers need to recognize the destination effect to meet the varied aspirations of commercial and religious tourists. Hotel management can prioritize comfort, facilities, and cost-effectiveness in commercial destinations as service quality attributes. In contrast, hotel managers in religious destinations can concentrate on location, cleanliness, and breakfast. Such a diverse marketing strategy can assist hotel management in cultivating the commercial and religious tourism sectors. Also, the knowledge of diverse marketing strategies can enable policymakers to determine the development vectors of religious and commercial organizations in the tourism sector. In addition, the development of diverse marketing strategies centered on distinct attributes enables hotels to concentrate on characteristics that promote their sustainability initiatives.
Using the IPA technique to compare commercial and religious destinations has significant practical consequences for hotel management. Hotel managers can develop marketing strategies based on importance and customers’ perceptions of performance by analyzing customer perceptions of quality using different attributes in each quadrant. The analysis of attributes in four quadrants enables hotel managers to distinguish between the distinct priorities of commercial and religious tourists. Accordingly, hotels will be better able to prioritize tasks and allocate appropriate resources for each service quality attribute to satisfy different customer groups (commercial or religious). Hotels can gain a competitive edge, boost client retention, draw in more business, and raise profitability by understanding how different customers (commercial or religious) perceive the quality of their services.

6. Limitations and Future Research

This research has some limitations that may be addressed in future studies. The first is using the IPA technique, which assumes a symmetric relationship between hotel attributes and OCS. Future studies in this area may consider using other methods, e.g., Asymmetric Impact-Performance Analysis (AIPA) or data mining. Second, the current data source only gave attributes’ evaluation ratings, but information about the customers (age, education, income status, demographic traits, etc.) was unavailable. These customer features may play a role in customer satisfaction; therefore, overgeneralization of the study results may be considered cautiously. Future research can employ questionnaires to collect such data about the customers, and it can also utilize qualitative methods such as interviews and focus group discussions to acquire deeper insights regarding relationships between customer satisfaction and hotel service quality attributes.
This study collected hotel online ratings data from Booking.com and analyzed the online numerical ratings data to present the research results. Future research can collect data from multiple sources such as Almosafer.com, Goibibo.com, TripAdvisor.com, etc., and analyze customer comments to enrich the study findings; in addition, more hotel quality attributes can be included in the research model. The current study focused on two cities in Saudi Arabia—Alkhobar (commercial) and Makkah (religious). However, the boundary between commercial and religious destinations may not be very clear in some cases. Tourists may visit religious destinations and participate in religious activities without religious motivation or for various other reasons. Future studies can consider a wider cross-country study of hotel quality attributes in commercial and religious destinations. The current study formulated general hypotheses due to the paucity of prior comparative literature on online hotel reviews in commercial and religious destinations. Future research can consider the present study results, formulate specific and comparative hypotheses, and test them in various commercial and religious destinations. This will help to generalize the current study results.

Author Contributions

Conceptualization, H.P.S., M.A. (Mohammad Alshallaqi) and M.A. (Mohammed Altamimi); methodology, H.P.S.; software, H.P.S. and M.A. (Mohammed Altamimi); validation, H.P.S., M.A. (Mohammad Alshallaqi) and M.A. (Mohammed Altamimi); formal analysis, H.P.S.; investigation, H.P.S. and M.A. (Mohammad Alshallaqi); resources, H.P.S., M.A. (Mohammad Alshallaqi) and M.A. (Mohammed Altamimi); data curation, H.P.S. and M.A. (Mohammed Altamimi); writing—original draft preparation, H.P.S.; writing—review and editing, H.P.S. and M.A. (Mohammad Alshallaqi); visualization, H.P.S., M.A. (Mohammad Alshallaqi) and M.A. (Mohammed Altamimi); supervision, H.P.S. and M.A. (Mohammad Alshallaqi); project administration, H.P.S. and M.A. (Mohammad Alshallaqi); funding acquisition, M.A. (Mohammad Alshallaqi) All authors have read and agreed to the published version of the manuscript.

Funding

This research has been funded by the Deanship of Scientific Research at the University of Ha’il, Saudi Arabia through project number BA-2205.

Institutional Review Board Statement

Not Applicable.

Informed Consent Statement

Not Applicable.

Data Availability Statement

The corresponding author can make the data available upon reasonable request.

Acknowledgments

This paper is a part of approved research project (Project No. BA-2205) titled “Predicting Critical Factors Impacting Hotel Online Ratings in Saudi Arabia: A Comparison of Religious and Commercial Destinations”. The authors would like to express their gratitude to the Deanship of Scientific Research at the University of Ha’il for supporting this research through project number BA-2205.

Conflicts of Interest

The authors declare no conflict of interest.

References

  1. Deng, W.J.; Yeh, M.L.; Sung, M.L. A Customer Satisfaction Index Model for International Tourist Hotels: Integrating Consumption Emotions into the American Customer Satisfaction Index. Int. J. Hosp. Manag. 2013, 35, 133–140. [Google Scholar] [CrossRef]
  2. Nunkoo, R.; Teeroovengadum, V.; Thomas, P.; Leonard, L. Integrating Service Quality as a Second-Order Factor in a Customer Satisfaction and Loyalty Model. Int. J. Contemp. Hosp. Manag. 2017, 29, 2978–3005. [Google Scholar] [CrossRef]
  3. Oh, H.; Kim, K. Customer Satisfaction, Service Quality, and Customer Value: Years 2000–2015. Int. J. Contemp. Hosp. Manag. 2017, 29, 2–29. [Google Scholar] [CrossRef]
  4. Zhao, Y.; Xu, X.; Wang, M. Predicting Overall Customer Satisfaction: Big Data Evidence from Hotel Online Textual Reviews. Int. J. Hosp. Manag. 2019, 76, 111–121. [Google Scholar] [CrossRef]
  5. Udo, G.J.; Bagchi, K.K.; Kirs, P.J. An Assessment of Customers’ e-Service Quality Perception, Satisfaction and Intention. Int. J. Inf. Manag. 2010, 30, 481–492. [Google Scholar] [CrossRef]
  6. Yee, R.W.Y.; Yeung, A.C.L.; Edwin Cheng, T.C. An Empirical Study of Employee Loyalty, Service Quality and Firm Performance in the Service Industry. Int. J. Prod. Econ. 2010, 124, 109–120. [Google Scholar] [CrossRef]
  7. Lai, I.K.W.; Hitchcock, M. Importance–Performance Analysis in Tourism: A Framework for Researchers. Tour. Manag. 2015, 48, 242–267. [Google Scholar] [CrossRef]
  8. Tang, G.; Zeng, H. Evaluation of Tourism E-Commerce User Satisfaction. J. Organ. End User Comput. 2021, 33, 25–41. [Google Scholar] [CrossRef]
  9. Hult, G.T.M.; Sharma, P.N.; Morgeson, F.V.; Zhang, Y. Antecedents and Consequences of Customer Satisfaction: Do They Differ Across Online and Offline Purchases? J. Retail. 2019, 95, 10–23. [Google Scholar] [CrossRef]
  10. Alalwan, A.A. Mobile Food Ordering Apps: An Empirical Study of the Factors Affecting Customer e-Satisfaction and Continued Intention to Reuse. Int. J. Inf. Manag. 2020, 50, 28–44. [Google Scholar] [CrossRef]
  11. Bruns, A. User-Generated Content. In The International Encyclopedia of Communication Theory and Philosophy; Wiley: Hoboken, NJ, USA, 2016; pp. 1–5. [Google Scholar]
  12. Nguyen, T.T.T.; Tong, S. The Impact of User-Generated Content on Intention to Select a Travel Destination. J. Mark. Anal. 2022, 1–15. [Google Scholar] [CrossRef]
  13. Browning, V.; So, K.K.F.; Sparks, B. The Influence of Online Reviews on Consumers’ Attributions of Service Quality and Control for Service Standards in Hotels. J. Travel Tour. Mark. 2013, 30, 23–40. [Google Scholar] [CrossRef] [Green Version]
  14. Mauri, A.G.; Minazzi, R. Web Reviews Influence on Expectations and Purchasing Intentions of Hotel Potential Customers. Int. J. Hosp. Manag. 2013, 34, 99–107. [Google Scholar] [CrossRef]
  15. Neirotti, P.; Raguseo, E.; Paolucci, E. Are Customers’ Reviews Creating Value in the Hospitality Industry? Exploring the Moderating Effects of Market Positioning. Int. J. Inf. Manag. 2016, 36, 1133–1143. [Google Scholar] [CrossRef] [Green Version]
  16. Jiang, J.; Gretzel, U.; Law, R. Do Negative Experiences Always Lead to Dissatisfaction?—Testing Attribution Theory in the Context of Online Travel Reviews. In Information and Communication Technologies in Tourism 2010; Springer: Vienna, Austria, 2010; pp. 297–308. [Google Scholar]
  17. Viglia, G.; Minazzi, R.; Buhalis, D. The Influence of E-Word-of-Mouth on Hotel Occupancy Rate. Int. J. Contemp. Hosp. Manag. 2016, 28, 2035–2051. [Google Scholar] [CrossRef] [Green Version]
  18. Xiang, Z.; Du, Q.; Ma, Y.; Fan, W. A Comparative Analysis of Major Online Review Platforms: Implications for Social Media Analytics in Hospitality and Tourism. Tour. Manag. 2017, 58, 51–65. [Google Scholar] [CrossRef]
  19. Ye, Q.; Law, R.; Gu, B.; Chen, W. The Influence of User-Generated Content on Traveler Behavior: An Empirical Investigation on the Effects of e-Word-of-Mouth to Hotel Online Bookings. Comput. Hum. Behav. 2011, 27, 634–639. [Google Scholar] [CrossRef]
  20. Wu, M.-Y.; Pearce, P.L. Appraising Netnography: Towards Insights about New Markets in the Digital Tourist Era. Curr. Issues Tour. 2014, 17, 463–474. [Google Scholar] [CrossRef]
  21. Yahoo Finance Fake Hotel Reviews? Never on Booking.Com, Says CEO. Available online: https://finance.yahoo.com/news/fake-hotel-reviews-never-booking-com-says-ceo-173948451.html (accessed on 2 February 2023).
  22. Liu, Y.; Jang, S.C. Perceptions of Chinese Restaurants in the U.S.: What Affects Customer Satisfaction and Behavioral Intentions? Int. J. Hosp. Manag. 2009, 28, 338–348. [Google Scholar] [CrossRef]
  23. Forman, C.; Ghose, A.; Wiesenfeld, B. Examining the Relationship Between Reviews and Sales: The Role of Reviewer Identity Disclosure in Electronic Markets. Inf. Syst. Res. 2008, 19, 291–313. [Google Scholar] [CrossRef] [Green Version]
  24. Filieri, R.; McLeay, F. E-WOM and Accommodation: An Analysis of the Factors That Influence Travelers’ Adoption of Information from Online Reviews. J. Travel Res. 2013, 53, 44–57. [Google Scholar] [CrossRef]
  25. Raguseo, E.; Vitari, C. The Effect of Brand on the Impact of E-WOM on Hotels’ Financial Performance. Int. J. Electron. Commer. 2017, 21, 249–269. [Google Scholar] [CrossRef]
  26. Karabas, I.; Kareklas, I.; Weber, T.J.; Muehling, D.D. The Impact of Review Valence and Awareness of Deceptive Practices on Consumers’ Responses to Online Product Ratings and Reviews. J. Mark. Commun. 2021, 27, 685–715. [Google Scholar] [CrossRef]
  27. Peng, L.; Cui, G.; Chung, Y.; Li, C. A Multi-Facet Item Response Theory Approach to Improve Customer Satisfaction Using Online Product Ratings. J. Acad. Mark. Sci. 2019, 47, 960–976. [Google Scholar] [CrossRef]
  28. Whaley, J.; Lee, J.; Kim, Y.-K. Do Tipping Motivations Predict Loyalty to the Server in a Restaurant? Int. Hosp. Rev. 2019, 33, 91–105. [Google Scholar] [CrossRef]
  29. Papadopoulou, N.M.; Ribeiro, M.A.; Prayag, G. Psychological Determinants of Tourist Satisfaction and Destination Loyalty: The Influence of Perceived Overcrowding and Overtourism. J. Travel Res. 2023, 62, 644–662. [Google Scholar] [CrossRef]
  30. Markovic, S.; Jankovic, S.R. Exploring the Relationship between Service Quality and Customer Satisfaction in Creation Hotel Industry. Tour. Hosp. Manag. 2013, 19, 149–164. [Google Scholar] [CrossRef]
  31. Alhamad, I.A.; Singh, H.P. Decoding Significant and Trivial Factors Influencing Online Hotel Ratings: The Case of Saudi Arabia’s Makkah City. Int. Trans. J. Eng. Manag. Appl. Sci. Technol. 2021, 12, 1–11. [Google Scholar] [CrossRef]
  32. Brazytė, K.; Weber, F.; Schaffner, D. Sustainability Management of Hotels: How Do Customers Respond in Online Reviews? J. Qual. Assur. Hosp. Tour. 2017, 18, 282–307. [Google Scholar] [CrossRef]
  33. Singh, H.P.; Alhamad, I.A. Deciphering Key Factors Impacting Online Hotel Ratings through the Lens of Two-Factor Theory: A Case of Hotels in the Makkah City of Saudi Arabia. Int. Trans. J. Eng. Manag. Appl. Sci. Technol. 2021, 12, 1–12. [Google Scholar] [CrossRef]
  34. Poon, W.; Lock-Teng Low, K. Are Travellers Satisfied with Malaysian Hotels? Int. J. Contemp. Hosp. Manag. 2005, 17, 217–227. [Google Scholar] [CrossRef]
  35. Albayrak, T.; Caber, M. Prioritisation of the Hotel Attributes According to Their Influence on Satisfaction: A Comparison of Two Techniques. Tour. Manag. 2015, 46, 43–50. [Google Scholar] [CrossRef]
  36. Li, H.; Ye, Q.; Law, R. Determinants of Customer Satisfaction in the Hotel Industry: An Application of Online Review Analysis. Asia Pac. J. Tour. Res. 2013, 18, 784–802. [Google Scholar] [CrossRef]
  37. Chu, R.K.S.; Choi, T. An Importance-Performance Analysis of Hotel Selection Factors in the Hong Kong Hotel Industry: A Comparison of Business and Leisure Travellers. Tour. Manag. 2000, 21, 363–377. [Google Scholar] [CrossRef]
  38. Shanka, T.; Taylor, R. An Investigation into the Perceived Importance of Service and Facility Attributes to Hotel Satisfaction. J. Qual. Assur. Hosp. Tour. 2004, 4, 119–134. [Google Scholar] [CrossRef]
  39. Hua, W.; Chan, A.; Mao, Z. Critical Success Factors and Customer Expectation in Budget Hotel Segment—A Case Study of China. J. Qual. Assur. Hosp. Tour. 2009, 10, 59–74. [Google Scholar] [CrossRef]
  40. Au, N.; Buhalis, D.; Law, R. Online Complaining Behavior in Mainland China Hotels: The Perception of Chinese and Non-Chinese Customers. Int. J. Hosp. Tour. Adm. 2014, 15, 248–274. [Google Scholar] [CrossRef]
  41. Kim, B.; Kim, S.; Heo, C.Y. Analysis of Satisfiers and Dissatisfiers in Online Hotel Reviews on Social Media. Int. J. Contemp. Hosp. Manag. 2016, 28, 1915–1936. [Google Scholar] [CrossRef] [Green Version]
  42. O’Connor, P. User-Generated Content and Travel: A Case Study on Tripadvisor.Com. In Information and Communication Technologies in Tourism 2008; O’Connor, P., Höpken, W., Gretzel, U., Eds.; Springer: Vienna, Austria, 2008; pp. 47–58. [Google Scholar]
  43. Phillips, P.; Barnes, S.; Zigan, K.; Schegg, R. Understanding the Impact of Online Reviews on Hotel Performance. J. Travel Res. 2016, 56, 235–249. [Google Scholar] [CrossRef] [Green Version]
  44. Öğüta, H.; Cezara, A. The Factors Affecting Writing Reviews in Hotel Websites. Procedia-Soc. Behav. Sci. 2012, 58, 980–986. [Google Scholar] [CrossRef] [Green Version]
  45. Liu, Y.; Teichert, T.; Rossi, M.; Li, H.; Hu, F. Big Data for Big Insights: Investigating Language-Specific Drivers of Hotel Satisfaction with 412,784 User-Generated Reviews. Tour. Manag. 2017, 59, 554–563. [Google Scholar] [CrossRef]
  46. Chang, Y.-C.; Ku, C.-H.; Chen, C.-H. Social Media Analytics: Extracting and Visualizing Hilton Hotel Ratings and Reviews from TripAdvisor. Int. J. Inf. Manag. 2019, 48, 263–279. [Google Scholar] [CrossRef]
  47. Torabi, M.; Bélanger, C.H. Influence of Online Reviews on Student Satisfaction Seen through a Service Quality Model. J. Theor. Appl. Electron. Commer. Res. 2021, 16, 3063–3077. [Google Scholar] [CrossRef]
  48. Abedin, E.; Mendoza, A.; Karunasekera, S. Exploring the Moderating Role of Readers’ Perspective in Evaluations of Online Consumer Reviews. J. Theor. Appl. Electron. Commer. Res. 2021, 16, 3406–3424. [Google Scholar] [CrossRef]
  49. Tang, L.; Wang, X.; Kim, E. Predicting Conversion Rates in Online Hotel Bookings with Customer Reviews. J. Theor. Appl. Electron. Commer. Res. 2022, 17, 1264–1278. [Google Scholar] [CrossRef]
  50. Martin-Fuentes, E. Are Guests of the Same Opinion as the Hotel Star-Rate Classification System? J. Hosp. Tour. Manag. 2016, 29, 126–134. [Google Scholar] [CrossRef] [Green Version]
  51. Li, X.; Hitt, L.M. Price Effects in Online Product Reviews: An Analytical Model and Empirical Analysis. MIS Q. 2010, 34, 809. [Google Scholar] [CrossRef]
  52. Alhamad, I.A.; Singh, H.P. Predicting Key Factors Impacting Online Hotel Ratings Using Data Mining Approach: A Case Study of the Makkah City of Saudi Arabia. Int. Trans. J. Eng. Manag. Appl. Sci. Technol. 2021, 12, 1–12. [Google Scholar] [CrossRef]
  53. Singh, H.P.; Alhamad, I.A. A Novel Categorization of Key Predictive Factors Impacting Hotels’ Online Ratings: A Case of Makkah. Sustainability 2022, 14, 16588. [Google Scholar] [CrossRef]
  54. Sann, R.; Lai, P.-C.; Liaw, S.-Y.; Chen, C.-T. Predicting Online Complaining Behavior in the Hospitality Industry: Application of Big Data Analytics to Online Reviews. Sustainability 2022, 14, 1800. [Google Scholar] [CrossRef]
  55. Prayag, G.; Hassibi, S.; Nunkoo, R. A Systematic Review of Consumer Satisfaction Studies in Hospitality Journals: Conceptual Development, Research Approaches and Future Prospects. J. Hosp. Mark. Manag. 2019, 28, 51–80. [Google Scholar] [CrossRef]
  56. Rhee, H.T.; Yang, S.-B. How Does Hotel Attribute Importance Vary among Different Travelers? An Exploratory Case Study Based on a Conjoint Analysis. Electron. Mark. 2015, 25, 211–226. [Google Scholar] [CrossRef]
  57. Rauch, D.A.; Collins, M.D.; Nale, R.D.; Barr, P.B. Measuring Service Quality in Mid-Scale Hotels. Int. J. Contemp. Hosp. Manag. 2015, 27, 87–106. [Google Scholar] [CrossRef]
  58. Tohirovich, T.K.; Mamarasulovna, T.Z. The Issue of Studying Religious Tourism in Uzbekistan. Int. J. Integr. Educ. 2020, 3, 43–47. [Google Scholar] [CrossRef]
  59. Kim, B.; Kim, S.; King, B. Religious Tourism Studies: Evolution, Progress, and Future Prospects. Tour. Recreat. Res. 2020, 45, 185–203. [Google Scholar] [CrossRef]
  60. Terzidou, M.; Scarles, C.; Saunders, M.N.K. The Complexities of Religious Tourism Motivations: Sacred Places, Vows and Visions. Ann. Tour. Res. 2018, 70, 54–65. [Google Scholar] [CrossRef]
  61. Durán-Sánchez, A.; Álvarez-García, J.; del Río-Rama, M.; Oliveira, C. Religious Tourism and Pilgrimage: Bibliometric Overview. Religions 2018, 9, 249. [Google Scholar] [CrossRef] [Green Version]
  62. Tsironis, C.N. Pilgrimage and Religious Tourism in Society, in the Wake of the COVID-19 Pandemic: A Paradigmatic Focus on ‘St. Paul’s Route’ in the Central Macedonia Region, Greece. Religions 2022, 13, 887. [Google Scholar] [CrossRef]
  63. Marcopolis How Al-Khobar Became the Industrial, Commercial, Tourism and Recreational Hub of the Eastern Province. Available online: https://marcopolis.net/how-al-khobar-became-the-industrial-commercial-tourism-and-recreational-hub-of-the-eastern-province.htm (accessed on 3 March 2023).
  64. Saudi Gazette Full Text of Saudi Arabia’s Vision 2030|Al Arabiya English. Available online: https://english.alarabiya.net/en/perspective/features/2016/04/26/Full-text-of-Saudi-Arabia-s-Vision-2030.html (accessed on 7 July 2020).
  65. Singh, H.P.; Singh, A.; Alam, F.; Agrawal, V. Impact of Sustainable Development Goals on Economic Growth in Saudi Arabia: Role of Education and Training. Sustainability 2022, 14, 14119. [Google Scholar] [CrossRef]
  66. Saudi eVisa Welcome to the Saudi EVisa Portal. Available online: https://visa.visitsaudi.com/ (accessed on 7 April 2023).
  67. Yüksel, A.; Yüksel, F. The Expectancy-Disconfirmation Paradigm: A Critique. J. Hosp. Tour. Res. 2001, 25, 107–131. [Google Scholar] [CrossRef]
  68. Cardozo, R.N. An Experimental Study of Customer Effort, Expectation, and Satisfaction. J. Mark. Res. 1965, 2, 244–249. [Google Scholar] [CrossRef]
  69. Oliver, R.L.; Swan, J.E. Consumer Perceptions of Interpersonal Equity and Satisfaction in Transactions: A Field Survey Approach. J. Mark. 1989, 53, 21–35. [Google Scholar] [CrossRef]
  70. Oliver, R.L.; Swan, J.E. Equity and Disconfirmation Perceptions as Influences on Merchant and Product Satisfaction. J. Consum. Res. 1989, 16, 372–383. [Google Scholar] [CrossRef]
  71. Weiner, B. An Attributional Theory of Achievement Motivation and Emotion. Psychol. Rev. 1985, 92, 548–573. [Google Scholar] [CrossRef]
  72. Kim, J.W.; Magnusen, M.; Kim, Y.K. A Critical Review of Theoretical and Methodological Issues in Consumer Satisfaction Research and Recommendations for Future Sport Marketing Scholarship. J. Sport Manag. 2014, 28, 338–355. [Google Scholar] [CrossRef]
  73. Zehrer, A.; Crotts, J.C.; Magnini, V.P. The Perceived Usefulness of Blog Postings: An Extension of the Expectancy-Disconfirmation Paradigm. Tour. Manag. 2011, 32, 106–113. [Google Scholar] [CrossRef]
  74. Grimmelikhuijsen, S.; Porumbescu, G.A. Reconsidering the Expectancy Disconfirmation Model. Three Experimental Replications. Public Manag. Rev. 2017, 19, 1272–1292. [Google Scholar] [CrossRef] [Green Version]
  75. Zhang, J.; Chen, W.; Petrovsky, N.; Walker, R.M. The Expectancy-Disconfirmation Model and Citizen Satisfaction with Public Services: A Meta-analysis and an Agenda for Best Practice. Public Adm. Rev. 2022, 82, 147–159. [Google Scholar] [CrossRef]
  76. Ha, Y.W.; Park, M.C. Antecedents of Customer Satisfaction and Customer Loyalty for Emerging Devices in the Initial Market of Korea: An Equity Framework. Psychol. Mark. 2013, 30, 676–689. [Google Scholar] [CrossRef]
  77. Song, H.; van der Veen, R.; Li, G.; Chen, J.L. The Hong Kong Tourist Satisfaction Index. Ann. Tour. Res. 2012, 39, 459–479. [Google Scholar] [CrossRef] [Green Version]
  78. Chen, C.-F.; Chen, F.-S. Experience Quality, Perceived Value, Satisfaction and Behavioral Intentions for Heritage Tourists. Tour. Manag. 2010, 31, 29–35. [Google Scholar] [CrossRef]
  79. Hsu, C.H.C.; Huang, S. An Extension of the Theory of Planned Behavior Model for Tourists. J. Hosp. Tour. Res. 2012, 36, 390–417. [Google Scholar] [CrossRef]
  80. Torres, A.; Tribó, J.A. Customer Satisfaction and Brand Equity. J. Bus. Res. 2011, 64, 1089–1096. [Google Scholar] [CrossRef] [Green Version]
  81. Fu, X.; Liu, X.; Hua, C.; Li, Z.; Du, Q. Understanding Tour Guides’ Service Failure: Integrating a Two-Tier Triadic Business Model with Attribution Theory. J. Hosp. Tour. Manag. 2021, 47, 506–516. [Google Scholar] [CrossRef]
  82. Marasco, A.; Buonincontri, P.; van Niekerk, M.; Orlowski, M.; Okumus, F. Exploring the Role of Next-Generation Virtual Technologies in Destination Marketing. J. Destin. Mark. Manag. 2018, 9, 138–148. [Google Scholar] [CrossRef]
  83. Aliman, N.K.; Hashim, S.M.; Wahid, S.D.M.; Harudin, S. Tourists’ Satisfaction with a Destination: An Investigation on Visitors to Langkawi Island. Int. J. Mark. Stud. 2016, 8, 173. [Google Scholar] [CrossRef]
  84. Pike, S.; Page, S.J. Destination Marketing Organizations and Destination Marketing: A Narrative Analysis of the Literature. Tour. Manag. 2014, 41, 202–227. [Google Scholar] [CrossRef] [Green Version]
  85. Chi, C.G.-Q.; Qu, H. Examining the Structural Relationships of Destination Image, Tourist Satisfaction and Destination Loyalty: An Integrated Approach. Tour. Manag. 2008, 29, 624–636. [Google Scholar] [CrossRef]
  86. Tasci, A.D.A.; Gartner, W.C. Destination Image and Its Functional Relationships. J. Travel Res. 2007, 45, 413–425. [Google Scholar] [CrossRef]
  87. Jauhari, V.; Sanjeev, G.M. Managing Customer Experience for Spiritual and Cultural Tourism: An Overview. Worldw. Hosp. Tour. Themes 2010, 2, 467–476. [Google Scholar] [CrossRef]
  88. Chen, C.-F.; Tsai, D. How Destination Image and Evaluative Factors Affect Behavioral Intentions? Tour. Manag. 2007, 28, 1115–1122. [Google Scholar] [CrossRef]
  89. Wachyuni, S.S.; Kusumaningrum, D.A. The Effect of COVID-19 Pandemic: How Are the Future Tourist Behavior? J. Educ. Soc. Behav. Sci. 2020, 33, 67–76. [Google Scholar] [CrossRef]
  90. Alcocer, N.H.; Ruiz, V.R.L. The Role of Destination Image in Tourist Satisfaction: The Case of a Heritage Site. Econ. Res. Istraž. 2020, 33, 2444–2461. [Google Scholar] [CrossRef] [Green Version]
  91. Afshardoost, M.; Eshaghi, M.S. Destination Image and Tourist Behavioural Intentions: A Meta-Analysis. Tour. Manag. 2020, 81, 104154. [Google Scholar] [CrossRef]
  92. Zhang, H.; Fu, X.; Cai, L.A.; Lu, L. Destination Image and Tourist Loyalty: A Meta-Analysis. Tour. Manag. 2014, 40, 213–223. [Google Scholar] [CrossRef]
  93. Chen, Y.; Zhang, H.; Qiu, L. A Review on Tourist Satisfaction of Tourism Destinations. In LISS 2012: Proceedings of 2nd International Conference on Logistics, Informatics and Service Science; Zhang, Z., Zhang, R., Zhang, J., Eds.; Springer: Berlin/Heidelberg, Germany; Beijing, China, 2013; pp. 593–604. [Google Scholar]
  94. Chiu, W.; Zeng, S.; Cheng, P.S.-T. The Influence of Destination Image and Tourist Satisfaction on Tourist Loyalty: A Case Study of Chinese Tourists in Korea. Int. J. Cult. Tour. Hosp. Res. 2016, 10, 223–234. [Google Scholar] [CrossRef]
  95. Rashid, A.G. Religious Tourism—A Review of the Literature. J. Hosp. Tour. Insights 2018, 1, 150–167. [Google Scholar] [CrossRef]
  96. Villamediana-Pedrosa, J.D.; Vila-López, N.; Küster-Boluda, I. Predictors of Tourist Engagement: Travel Motives and Tourism Destination Profiles. J. Destin. Mark. Manag. 2020, 16, 100412. [Google Scholar] [CrossRef]
  97. Chantziantoniou, A.; Dionysopoulou, P. The Religious Tourism in Greece: Case Study of Saint John Russian in N. Evia. J. Tour. Herit. Serv. Mark. 2017, 3, 15–24. [Google Scholar] [CrossRef]
  98. Raj, R.; Griffin, K.; Blackwell, R. Motivations for Religious Tourism, Pilgrimage, Festivals and Events. In Religious Tourism and Pilgrimage Management: An International Perspective; Raj, R., Griffin, K., Eds.; CABI: Wallingford, UK, 2015; ISBN 9781780645230. [Google Scholar]
  99. Liro, J. Visitors’ Motivations and Behaviours at Pilgrimage Centres: Push and Pull Perspectives. J. Herit. Tour. 2021, 16, 79–99. [Google Scholar] [CrossRef]
  100. Sthapit, E.; Piramanayayagam, S.; Björk, P. Tourists’ Motivations, Emotions, and Memorable Local Food Experiences. J. Gastron. Tour. 2020, 5, 17–32. [Google Scholar] [CrossRef]
  101. Pomfret, G. Conceptualising Family Adventure Tourist Motives, Experiences and Benefits. J. Outdoor Recreat. Tour. 2019, 28, 1–8. [Google Scholar] [CrossRef]
  102. Correia, A.; Kozak, M.; Ferradeira, J. From Tourist Motivations to Tourist Satisfaction. Int. J. Cult. Tour. Hosp. Res. 2013, 7, 411–424. [Google Scholar] [CrossRef]
  103. Iliev, D. The Evolution of Religious Tourism: Concept, Segmentation and Development of New Identities. J. Hosp. Tour. Manag. 2020, 45, 131–140. [Google Scholar] [CrossRef]
  104. Walters, G.; Huck, L.; Robinson, R.N.S.; Stettler, J. Commercial Hospitality in Tourism: A Global Comparison of What Culturally Matters. Int. J. Hosp. Manag. 2021, 95, 102939. [Google Scholar] [CrossRef]
  105. Manhas, P.S.; Manrai, L.A.; Manrai, A.K. Role of Tourist Destination Development in Building Its Brand Image: A Conceptual Model. J. Econ. Financ. Adm. Sci. 2016, 21, 25–29. [Google Scholar] [CrossRef] [Green Version]
  106. Abbate, C.S.; Di Nuovo, S. Motivation and Personality Traits for Choosing Religious Tourism. A Research on the Case of Medjugorje. Curr. Issues Tour. 2013, 16, 501–506. [Google Scholar] [CrossRef] [Green Version]
  107. Kádár, B.; Gede, M. Tourism Flows in Large-Scale Destination Systems. Ann. Tour. Res. 2021, 87, 103113. [Google Scholar] [CrossRef]
  108. Mittal, R.; Sinha, P. Framework for a Resilient Religious Tourism Supply Chain for Mitigating Post-Pandemic Risk. Int. Hosp. Rev. 2022, 36, 322–339. [Google Scholar] [CrossRef]
  109. Romanelli, M.; Gazzola, P.; Grechi, D.; Pollice, F. Towards a Sustainability-oriented Religious Tourism. Syst. Res. Behav. Sci. 2021, 38, 386–396. [Google Scholar] [CrossRef]
  110. Phillips, P.; Antonio, N.; de Almeida, A.; Nunes, L. The Influence of Geographic and Psychic Distance on Online Hotel Ratings. J. Travel Res. 2020, 59, 722–741. [Google Scholar] [CrossRef] [Green Version]
  111. Teare, R. Services Management: The New Paradigm in Hospitality. Int. J. Contemp. Hosp. Manag. 2005, 17, 106. [Google Scholar] [CrossRef] [Green Version]
  112. Kandampully, J. Services Management: The New Paradigm in Hospitality; Prentice Hall: Hoboken, NJ, USA, 2003. [Google Scholar]
  113. Dotson, J.P.; Allenby, G.M. Investigating the Strategic Influence of Customer and Employee Satisfaction on Firm Financial Performance. Mark. Sci. 2010, 29, 895–908. [Google Scholar] [CrossRef]
  114. Babin, B.J.; Griffin, M. The Nature of Satisfaction: An Updated Examination and Analysis. J. Bus. Res. 1998, 41, 127–136. [Google Scholar] [CrossRef]
  115. Barsky, J.D. Customer Satisfaction in the Hotel Industry. Hosp. Res. J. 1992, 16, 51–73. [Google Scholar] [CrossRef]
  116. Fen, Y.S.; Lian, K.M. Service Quality and Customer Satisfaction: Antecedents of Customer’s Re-Patronage Intentions. Sunway Acad. J. 2007, 4, 59–73. [Google Scholar]
  117. Kozak, M.; Rimmington, M. Tourist Satisfaction with Mallorca, Spain, as an Off-Season Holiday Destination. J. Travel Res. 2000, 38, 260–269. [Google Scholar] [CrossRef]
  118. Yuksel, A. Tourist Satisfaction and Complaining Behavior: Measurement and Management Issues in the Tourism and Hospitality Industry; Nova Kroshka Books: New York, NY, USA, 2008. [Google Scholar]
  119. Kotler, P.; Bowen, J.T.; Baloglu, S. Marketing for Hospitality and Tourism, 8th ed.; Pearson Education: Upper Saddle River, NJ, USA, 2021. [Google Scholar]
  120. Abdou, A.H.; Shehata, H.S.; Mahmoud, H.M.E.; Albakhit, A.I.; Almakhayitah, M.Y. The Effect of Environmentally Sustainable Practices on Customer Citizenship Behavior in Eco-Friendly Hotels: Does the Green Perceived Value Matter? Sustainability 2022, 14, 7167. [Google Scholar] [CrossRef]
  121. Mariani, M.; Borghi, M. Environmental Discourse in Hotel Online Reviews: A Big Data Analysis. J. Sustain. Tour. 2021, 29, 829–848. [Google Scholar] [CrossRef]
  122. Wang, J.; Wang, S.; Xue, H.; Wang, Y.; Li, J. Green Image and Consumers’ Word-of-Mouth Intention in the Green Hotel Industry: The Moderating Effect of Millennials. J. Clean. Prod. 2018, 181, 426–436. [Google Scholar] [CrossRef]
  123. Ríos-Martín, M.Á.; Folgado-Fernández, J.A.; Palos-Sánchez, P.R.; Castejón-Jiménez, P. The Impact of the Environmental Quality of Online Feedback and Satisfaction When Exploring the Critical Factors for Luxury Hotels. Sustainability 2019, 12, 299. [Google Scholar] [CrossRef] [Green Version]
  124. Tran, H.; Hwang, Y.; Yu, C.; Yoo, S. The Effect of Destination Social Responsibility on Tourists’ Satisfaction: The Mediating Role of Emotions. Sustainability 2018, 10, 3044. [Google Scholar] [CrossRef] [Green Version]
  125. Ding, C.; Guo, Q.; Rehman, A.; Zeeshan, M. Impact of Environment on Hotel Customer Satisfaction in Southeast Asia: A Study of Online Booking Site Reviews. Front. Environ. Sci. 2022, 10, 978070. [Google Scholar] [CrossRef]
  126. Xiang, Z.; Gretzel, U. Role of Social Media in Online Travel Information Search. Tour. Manag. 2010, 31, 179–188. [Google Scholar] [CrossRef]
  127. Chan, N.L.; Guillet, B.D. Investigation of Social Media Marketing: How Does the Hotel Industry in Hong Kong Perform in Marketing on Social Media Websites? J. Travel Tour. Mark. 2011, 28, 345–368. [Google Scholar] [CrossRef]
  128. Leung, D.; Law, R.; van Hoof, H.; Buhalis, D. Social Media in Tourism and Hospitality: A Literature Review. J. Travel Tour. Mark. 2013, 30, 3–22. [Google Scholar] [CrossRef]
  129. Verma, R.; Stock, D.; McCarthy, L. Customer Preferences for Online, Social Media, and Mobile Innovations in the Hospitality Industry. Cornell Hosp. Q. 2012, 53, 183–186. [Google Scholar] [CrossRef] [Green Version]
  130. Berezina, K.; Bilgihan, A.; Cobanoglu, C.; Okumus, F. Understanding Satisfied and Dissatisfied Hotel Customers: Text Mining of Online Hotel Reviews. J. Hosp. Mark. Manag. 2016, 25, 1–24. [Google Scholar] [CrossRef]
  131. Levy, S.E.; Duan, W.; Boo, S. An Analysis of One-Star Online Reviews and Responses in the Washington, D.C., Lodging Market. Cornell Hosp. Q. 2013, 54, 49–63. [Google Scholar] [CrossRef]
  132. Gavilan, D.; Avello, M.; Martinez-Navarro, G. The Influence of Online Ratings and Reviews on Hotel Booking Consideration. Tour. Manag. 2018, 66, 53–61. [Google Scholar] [CrossRef]
  133. Gao, B.; Li, X.; Liu, S.; Fang, D. How Power Distance Affects Online Hotel Ratings: The Positive Moderating Roles of Hotel Chain and Reviewers’ Travel Experience. Tour. Manag. 2018, 65, 176–186. [Google Scholar] [CrossRef]
  134. Stringam, B.B.; Gerdes, J. An Analysis of Word-of-Mouse Ratings and Guest Comments of Online Hotel Distribution Sites. J. Hosp. Mark. Manag. 2010, 19, 773–796. [Google Scholar] [CrossRef]
  135. Qu, H.; Ryan, B.; Chu, R. The Importance of Hotel Attributes in Contributing to Travelers’ Satisfaction in the Hong Kong Hotel Industry. J. Qual. Assur. Hosp. Tour. 2000, 1, 65–83. [Google Scholar] [CrossRef]
  136. Soliman, H.M. Motivation-Hygiene Theory of Job Attitudes: An Empirical Investigation and an Attempt to Reconcile Both the One- and the Two-Factor Theories of Job Attitudes. J. Appl. Psychol. 1970, 54, 452–461. [Google Scholar] [CrossRef]
  137. Maddox, R.N. Two-Factor Theory and Consumer Satisfaction: Replication and Extension. J. Consum. Res. 1981, 8, 97. [Google Scholar] [CrossRef]
  138. Herzberg, F.; Mausner, B.; Snyderman, B.B. The Motivation to Work; Routledge: London, UK, 1959. [Google Scholar]
  139. Cadotte, E.R.; Turgeon, N. Dissatisfiers and Satisfiers: Suggestions from Consumer Complaints and Compliments. J. Consum. Satisf. Dissatisf. Complain. Behav. 1988, 1, 74–79. [Google Scholar]
  140. O’Connor, P. Managing a Hotel’s Image on TripAdvisor. J. Hosp. Mark. Manag. 2010, 19, 754–772. [Google Scholar] [CrossRef]
  141. Becerra, M.; Santaló, J.; Silva, R. Being Better vs. Being Different: Differentiation, Competition, and Pricing Strategies in the Spanish Hotel Industry. Tour. Manag. 2013, 34, 71–79. [Google Scholar] [CrossRef]
  142. Suanmali, S. Factors Affecting Tourist Satisfaction: An Empirical Study in the Northern Part of Thailand. In Proceedings of the SHS Web of Conferences, 4th International Conference on Tourism Research (4ICTR), Kola Kinabalu, Malaysia, 9–11 December 2014; Othuman Mydin, M.A., Marzuki, A., Eds.; EDP Sciences: Les Ulis, France, 2014; Volume 12, pp. 1–9. [Google Scholar]
  143. Awan, M.I.; Shamim, A.; Ahn, J. Implementing ‘Cleanliness Is Half of Faith’ in Re-Designing Tourists, Experiences and Salvaging the Hotel Industry in Malaysia during COVID-19 Pandemic. J. Islam. Mark. 2021, 12, 543–557. [Google Scholar] [CrossRef]
  144. Barsky, J.D.; Labagh, R. A Strategy for Customer Satisfaction. Cornell Hotel Restaur. Adm. Q. 1992, 33, 32–40. [Google Scholar] [CrossRef]
  145. Gu, H.; Ryan, C. Place Attachment, Identity and Community Impacts of Tourism—The Case of a Beijing Hutong. Tour. Manag. 2008, 29, 637–647. [Google Scholar] [CrossRef]
  146. Seo, H.; Song, T.H. The Differential Motivation and Context Effects of Cause-Related Marketing in the Hotel Industry: The Moderating Role of Consumption Value. Int. J. Hosp. Manag. 2021, 95, 102721. [Google Scholar] [CrossRef]
  147. Lo, A.; Yeung, M.A. Brand Prestige and Affordable Luxury: The Role of Hotel Guest Experiences. J. Vacat. Mark. 2020, 26, 247–267. [Google Scholar] [CrossRef]
  148. Buhalis, D.; Foerste, M. SoCoMo Marketing for Travel and Tourism: Empowering Co-Creation of Value. J. Destin. Mark. Manag. 2015, 4, 151–161. [Google Scholar] [CrossRef]
  149. Bulchand-Gidumal, J.; Melián-González, S.; González López-Valcárcel, B. Improving Hotel Ratings by Offering Free Wi-Fi. J. Hosp. Tour. Technol. 2011, 2, 235–245. [Google Scholar] [CrossRef]
  150. Shieh, J.-I.; Wu, H.-H. Applying Importance-Performance Analysis to Compare the Changes of a Convenient Store. Qual. Quant. 2009, 43, 391–400. [Google Scholar] [CrossRef]
  151. Cribari-Neto, F.; Zeileis, A. Beta Regression in R. J. Stat. Softw. 2010, 34, 1–24. [Google Scholar] [CrossRef] [Green Version]
  152. Martilla, J.A.; James, J.C. Importance-Performance Analysis. J. Mark. 1977, 41, 77. [Google Scholar] [CrossRef]
  153. Yavas, U.; Shemwell, D.J. Modified Importance-performance Analysis: An Application to Hospitals. Int. J. Health Care Qual. Assur. 2001, 14, 104–110. [Google Scholar] [CrossRef]
  154. Tarrant, M.A.; Smith, E.K. The Use of a Modified Importance-Performance Framework to Examine Visitor Satisfaction with Attributes of Outdoor Recreation Settings. Manag. Leis. 2002, 7, 69–82. [Google Scholar] [CrossRef]
  155. Lee, Y.; Yen, T.; Tsai, C. Modify IPA for Quality Improvement: Taguchi’s Signal-to-noise Ratio Approach. TQM J. 2008, 20, 488–501. [Google Scholar] [CrossRef]
  156. Lee, Y.-C.; Yen, T.-M.; Tsai, C.-H. Using Importance-Performance Analysis and Decision Making Trial and Evaluation Laboratory to Enhance Order-Winner Criteria—A Study of Computer Industry. Inf. Technol. J. 2008, 7, 396–408. [Google Scholar] [CrossRef] [Green Version]
  157. Deng, W.-J.; Kuo, Y.-F.; Chen, W.-C. Revised Importance–Performance Analysis: Three-Factor Theory and Benchmarking. Serv. Ind. J. 2008, 28, 37–51. [Google Scholar] [CrossRef]
  158. Lin, S.-P.; Chan, Y.-H.; Tsai, M.-C. A Transformation Function Corresponding to IPA and Gap Analysis. Total Qual. Manag. Bus. Excell. 2009, 20, 829–846. [Google Scholar] [CrossRef]
  159. Hu, H.-Y.; Lee, Y.-C.; Yen, T.-M.; Tsai, C.-H. Using BPNN and DEMATEL to Modify Importance–Performance Analysis Model—A Study of the Computer Industry. Expert Syst. Appl. 2009, 36, 9969–9979. [Google Scholar] [CrossRef]
  160. Ho, L.-H.; Feng, S.-Y.; Yen, T.-M. Using Modified IPA to Improve Service Quality of Standard Hotel in Taiwan. J. Serv. Sci. Manag. 2014, 7, 222–234. [Google Scholar] [CrossRef] [Green Version]
  161. Dwyer, L.; Armenski, T.; Cvelbar, L.K.; Dragićević, V.; Mihalic, T. Modified Importance-Performance Analysis for Evaluating Tourism Businesses Strategies: Comparison of Slovenia and Serbia. Int. J. Tour. Res. 2016, 18, 327–340. [Google Scholar] [CrossRef]
  162. Chen, J.-K. A New Approach for Diagonal Line Model of Importance-Performance Analysis: A Case Study of Tourist Satisfaction in China. SAGE Open 2021, 11, 215824402198927. [Google Scholar] [CrossRef]
  163. Ormanović, S.; Ćirić, A.; Talović, M.; Alić, H.; Jelešković, E.; Čaušević, D. Importance-Performance Analysis: Different Approaches. Acta Kinesiol. 2017, 11, 56–66. [Google Scholar]
  164. Wyród-Wróbel, J.; Biesok, G. Decision Making on Various Approaches to Importance-Performance Analysis. Eur. J. Bus. Sci. Technol. 2017, 3, 123–132. [Google Scholar] [CrossRef] [Green Version]
  165. Albayrak, T. Importance Performance Competitor Analysis (IPCA): A Study of Hospitality Companies. Int. J. Hosp. Manag. 2015, 48, 135–142. [Google Scholar] [CrossRef]
  166. Parasuraman, A.; Zeithaml, V.A.; Berry, L.L. SERVQUAL: A Multi-Item Scale of Measuring Consumer Perceptions of Service Quality. J. Retail. 1988, 64, 12–41. [Google Scholar]
  167. Lai, L.S.L.; To, W.M. Importance-performance Analysis for Public Management Decision Making. Manag. Decis. 2010, 48, 277–295. [Google Scholar] [CrossRef]
  168. Taplin, R.H. Competitive Importance-Performance Analysis of an Australian Wildlife Park. Tour. Manag. 2012, 33, 29–37. [Google Scholar] [CrossRef]
  169. Ma, E.; Qu, H.; Njite, D.U.S. Customer Perceptions Toward Chinese Restaurant Service Quality: An Importance and Performance Approach. J. Foodserv. Bus. Res. 2011, 14, 290–308. [Google Scholar] [CrossRef]
  170. Pritchard, M.P.; Havitz, M.E. Destination Appraisal. Ann. Tour. Res. 2006, 33, 25–46. [Google Scholar] [CrossRef]
  171. Zhang, H.Q.; Chow, I. Application of Importance-Performance Model in Tour Guides’ Performance: Evidence from Mainland Chinese Outbound Visitors in Hong Kong. Tour. Manag. 2004, 25, 81–91. [Google Scholar] [CrossRef]
  172. Rosen, L.D.; Karwan, K.R.; Scribner, L.L. Service Quality Measurement and the Disconfirmation Model: Taking Care in Interpretation. Total Qual. Manag. Bus. Excell. 2003, 14, 3–14. [Google Scholar] [CrossRef]
  173. Abalo, J.; Varela, J.; Manzano, V. Importance Values for Importance–Performance Analysis: A Formula for Spreading out Values Derived from Preference Rankings. J. Bus. Res. 2007, 60, 115–121. [Google Scholar] [CrossRef]
  174. Bacon, D.R. A Comparison of Approaches to Importance-Performance Analysis. Int. J. Mark. Res. 2003, 45, 1–15. [Google Scholar] [CrossRef]
  175. Bruyere, B.L.; Rodriguez, D.A.; Vaske, J.J. Enhancing Importance-Performance Analysis through Segmentation. J. Travel Tour. Mark. 2002, 12, 81–95. [Google Scholar] [CrossRef]
  176. Back, K.-J. Impact-Range Performance Analysis and Asymmetry Analysis for Improving Quality of Korean Food Attributes. Int. J. Hosp. Manag. 2012, 31, 535–543. [Google Scholar] [CrossRef]
  177. Sampson, S.E.; Showalter, M.J. The Performance-Importance Response Function: Observations and Implications. Serv. Ind. J. 1999, 19, 1–25. [Google Scholar] [CrossRef]
  178. Matzler, K.; Sauerwein, E.; Heischmidt, K. Importance-Performance Analysis Revisited: The Role of the Factor Structure of Customer Satisfaction. Serv. Ind. J. 2003, 23, 112–129. [Google Scholar] [CrossRef]
  179. Edwards, W.; Newman, J. Multiattribute Evaluation; SAGE Publications, Inc.: Thousand Oaks, CA, USA, 1982; ISBN 9780803900950. [Google Scholar]
  180. Taylor, S.A. Assessing Regression-Based Importance Weights for Quality Perceptions and Satisfaction Judgements in the Presence of Higher Order and/Orinteraction Effects. J. Retail. 1997, 73, 135–159. [Google Scholar] [CrossRef]
  181. Chen, K.-S.; Chen, H.-T. Applying Importance–Performance Analysis with Simple Regression Model and Priority Indices to Assess Hotels’ Service Performance. J. Test. Eval. 2014, 42, 20130124. [Google Scholar] [CrossRef]
  182. Ho, L.-H.; Feng, S.-Y.; Lee, Y.-C.; Yen, T.-M. Using Modified IPA to Evaluate Supplier’s Performance: Multiple Regression Analysis and DEMATEL Approach. Expert Syst. Appl. 2012, 39, 7102–7109. [Google Scholar] [CrossRef]
  183. Albayrak, T.; Caber, M.; Rosario González-Rodríguez, M.; Aksu, A. Analysis of Destination Competitiveness by IPA and IPCA Methods: The Case of Costa Brava, Spain against Antalya, Turkey. Tour. Manag. Perspect. 2018, 28, 53–61. [Google Scholar] [CrossRef]
  184. Yin, J.; Cao, X.; Huang, X.; Cao, X. Applying the IPA–Kano Model to Examine Environmental Correlates of Residential Satisfaction: A Case Study of Xi’an. Habitat Int. 2016, 53, 461–472. [Google Scholar] [CrossRef] [Green Version]
  185. Ramanathan, R.; Ramanathan, U. A New Rational IPA and Application to Cruise Tourism. Ann. Tour. Res. 2016, 61, 264–267. [Google Scholar] [CrossRef] [Green Version]
  186. Hu, H.-Y.; Chiu, S.-I.; Cheng, C.-C.; Yen, T.-M. Applying the IPA and DEMATEL Models to Improve the Order-Winner Criteria: A Case Study of Taiwan’s Network Communication Equipment Manufacturing Industry. Expert Syst. Appl. 2011, 38, 9674–9683. [Google Scholar] [CrossRef]
  187. Choi, T.Y.; Chu, R. Levels of Satisfaction among Asian and Western Travellers. Int. J. Qual. Reliab. Manag. 2000, 17, 116–132. [Google Scholar] [CrossRef]
  188. Cezar, A.; Ögüt, H. Analyzing Conversion Rates in Online Hotel Booking: The Role of Customer Reviews, Recommendations and Rank Order in Search Listings. Int. J. Contemp. Hosp. Manag. 2016, 28, 286–304. [Google Scholar] [CrossRef]
  189. Peng, X.; Li, G.; Liu, Z. Zero-Inflated Beta Regression for Differential Abundance Analysis with Metagenomics Data. J. Comput. Biol. 2016, 23, 102–110. [Google Scholar] [CrossRef]
  190. Liu, F.; Kong, Y. Zoib: An R Package for Bayesian Inference for Beta Regression and Zero/One Inflated Beta Regression. R J. 2015, 7, 34. [Google Scholar] [CrossRef] [Green Version]
  191. Figueroa-Zúñiga, J.I.; Arellano-Valle, R.B.; Ferrari, S.L.P. Mixed Beta Regression: A Bayesian Perspective. Comput. Stat. Data Anal. 2013, 61, 137–147. [Google Scholar] [CrossRef] [Green Version]
  192. Gujarati, D.N.; Porter, D.C. Basic Econometrics, 5th ed.; McGraw-Hill Irwin: New York, NY, USA, 2009. [Google Scholar]
  193. Hair, J.F.; Hult, G.T.M.; Ringle, C.M.; Sarstedt, M. A Primer on Partial Least Squares Structural Equation Modeling (PLS-SEM); SAGE Publications: Thousand Oaks, CA, USA, 2016. [Google Scholar]
  194. Hair, J.F.; Ringle, C.M.; Sarstedt, M. PLS-SEM: Indeed a Silver Bullet. J. Mark. Theory Pract. 2011, 19, 139–152. [Google Scholar] [CrossRef]
  195. O’brien, R.M. A Caution Regarding Rules of Thumb for Variance Inflation Factors. Qual. Quant. 2007, 41, 673–690. [Google Scholar] [CrossRef]
  196. Halunga, A.G.; Orme, C.D.; Yamagata, T. A Heteroskedasticity Robust Breusch–Pagan Test for Contemporaneous Correlation in Dynamic Panel Data Models. J. Econ. 2017, 198, 209–230. [Google Scholar] [CrossRef] [Green Version]
  197. Singh, H.P.; Alhulail, H.N. Information Technology Governance and Corporate Boards’ Relationship with Companies’ Performance and Earnings Management: A Longitudinal Approach. Sustainability 2023, 15, 6492. [Google Scholar] [CrossRef]
  198. Rountree, K.; Swatos, W.H.; Tomasi, L. From Medieval Pilgrimage to Religious Tourism: The Social and Cultural Economics of Piety. Sociol. Relig. 2005, 66, 211. [Google Scholar] [CrossRef]
Figure 1. Conceptual Model.
Sustainability 15 11998 g001
Figure 2. Importance–Performance Analysis Grid.
Sustainability 15 11998 g002
Figure 3. Commercial Destination Importance–Performance Analysis Grid.
Sustainability 15 11998 g003
Figure 4. Religious Destination Importance–Performance Analysis Grid.
Sustainability 15 11998 g004
Table 1. Heteroscedasticity and Multicollinearity Tests Results.
AttributesCommercial DestinationReligious Destination
HeteroscedasticityVIFHeteroscedasticityVIF
Comfort (COM)0.0272.5560.0313.002
Staff Attitude (STA)0.0041.8720.0122.017
Cleanliness (CLE)0.0301.6650.0261.945
Facilities (FAC)0.0342.0830.0372.223
Location (LOC)0.0112.1750.0192.684
Value for Money (VFM)0.0221.6890.0252.441
Breakfast (BRE)0.0031.5280.0111.539
Wi-Fi Service (WFS)0.0372.9740.0221.770
Table 2. Commercial Destination Results of Regression Analysis.
AttributesMeans (Performance)SDBβ (Importance)
Comfort (COM)7.6391.2730.8040.792
Staff Attitude (STA)8.2641.0620.5730.561
Cleanliness (CLE)7.8830.8980.5880.571
Facilities (FAC)7.8851.3360.7730.765
Location (LOC)7.7931.1140.1970.185
Value for Money (VFM)7.7310.8570.6750.668
Breakfast (BRE)8.6151.0110.5180.531
Wi-Fi Service (WFS)7.7421.1260.1020.091
Grand Mean7.944 0.521
R2 = 0.763 (p < 0.05). All regression coefficients are significant at 0.05 level.
Table 3. Religious Destination Results of Regression Analysis.
AttributesMeans (Performance)SDBβ (Importance)
Comfort (COM)7.2970.9850.2390.229
Staff Attitude (STA)8.3421.0440.6310.619
Cleanliness (CLE)7.3741.1830.7350.729
Facilities (FAC)7.5110.8520.3730.357
Location (LOC)7.3231.0270.8350.818
Value for Money (VFM)7.1511.1190.3770.371
Breakfast (BRE)7.4240.9860.6410.631
Wi-Fi Service (WFS)8.2621.1250.1520.143
Grand Mean7.586 0.487
R2 = 0.732 (p < 0.05). All regression coefficients are significant at 0.05 level.
Table 4. Beta Regression Result for Commercial Destination.
Un-Standardized CoefficientStandardized CoefficientTSig.
BStd. Errorβ
Constant7.3511.169 6.2880.000
Comfort (COM)0.3780.0790.3714.7850.002
Staff Attitude (STA)0.2290.0640.2163.5780.009
Cleanliness (CLE)0.2610.0780.2513.3460.012
Facilities (FAC)0.3360.0870.3223.8620.006
Location (LOC)0.1520.0540.1362.8150.026
Value for Money (VFM)0.2970.0760.2893.9080.006
Breakfast (BRE)0.2020.0510.1913.9610.005
Wi-Fi Service (WFS)0.1410.0540.1282.6110.035
R2 = 0.724 (p < 0.05).
Table 5. Beta Regression Result for Religious Destination.
Un-Standardized CoefficientStandardized CoefficientTSig.
BStd. Errorβ
Constant5.7480.916 6.2750.000
Comfort (COM)0.2040.0690.1952.9570.021
Staff Attitude (STA)0.2580.0810.2413.1850.015
Cleanliness (CLE)0.3190.0770.3084.1430.004
Facilities (FAC)0.2130.0780.2012.7310.029
Location (LOC)0.3470.0680.3395.1030.001
Value for Money (VFM)0.2380.0860.2232.7670.028
Breakfast (BRE)0.2790.0760.2613.6710.008
Wi-Fi Service (WFS)0.1750.0660.1632.6520.033
R2 = 0.701 (p < 0.05).
Disclaimer/Publisher’s Note: The statements, opinions and data contained in all publications are solely those of the individual author(s) and contributor(s) and not of MDPI and/or the editor(s). MDPI and/or the editor(s) disclaim responsibility for any injury to people or property resulting from any ideas, methods, instructions or products referred to in the content.

