
Tire Wear Monitoring Approach for Hotspot Identification in Road Deposited Sediments from a Metropolitan City in Germany

Abstract
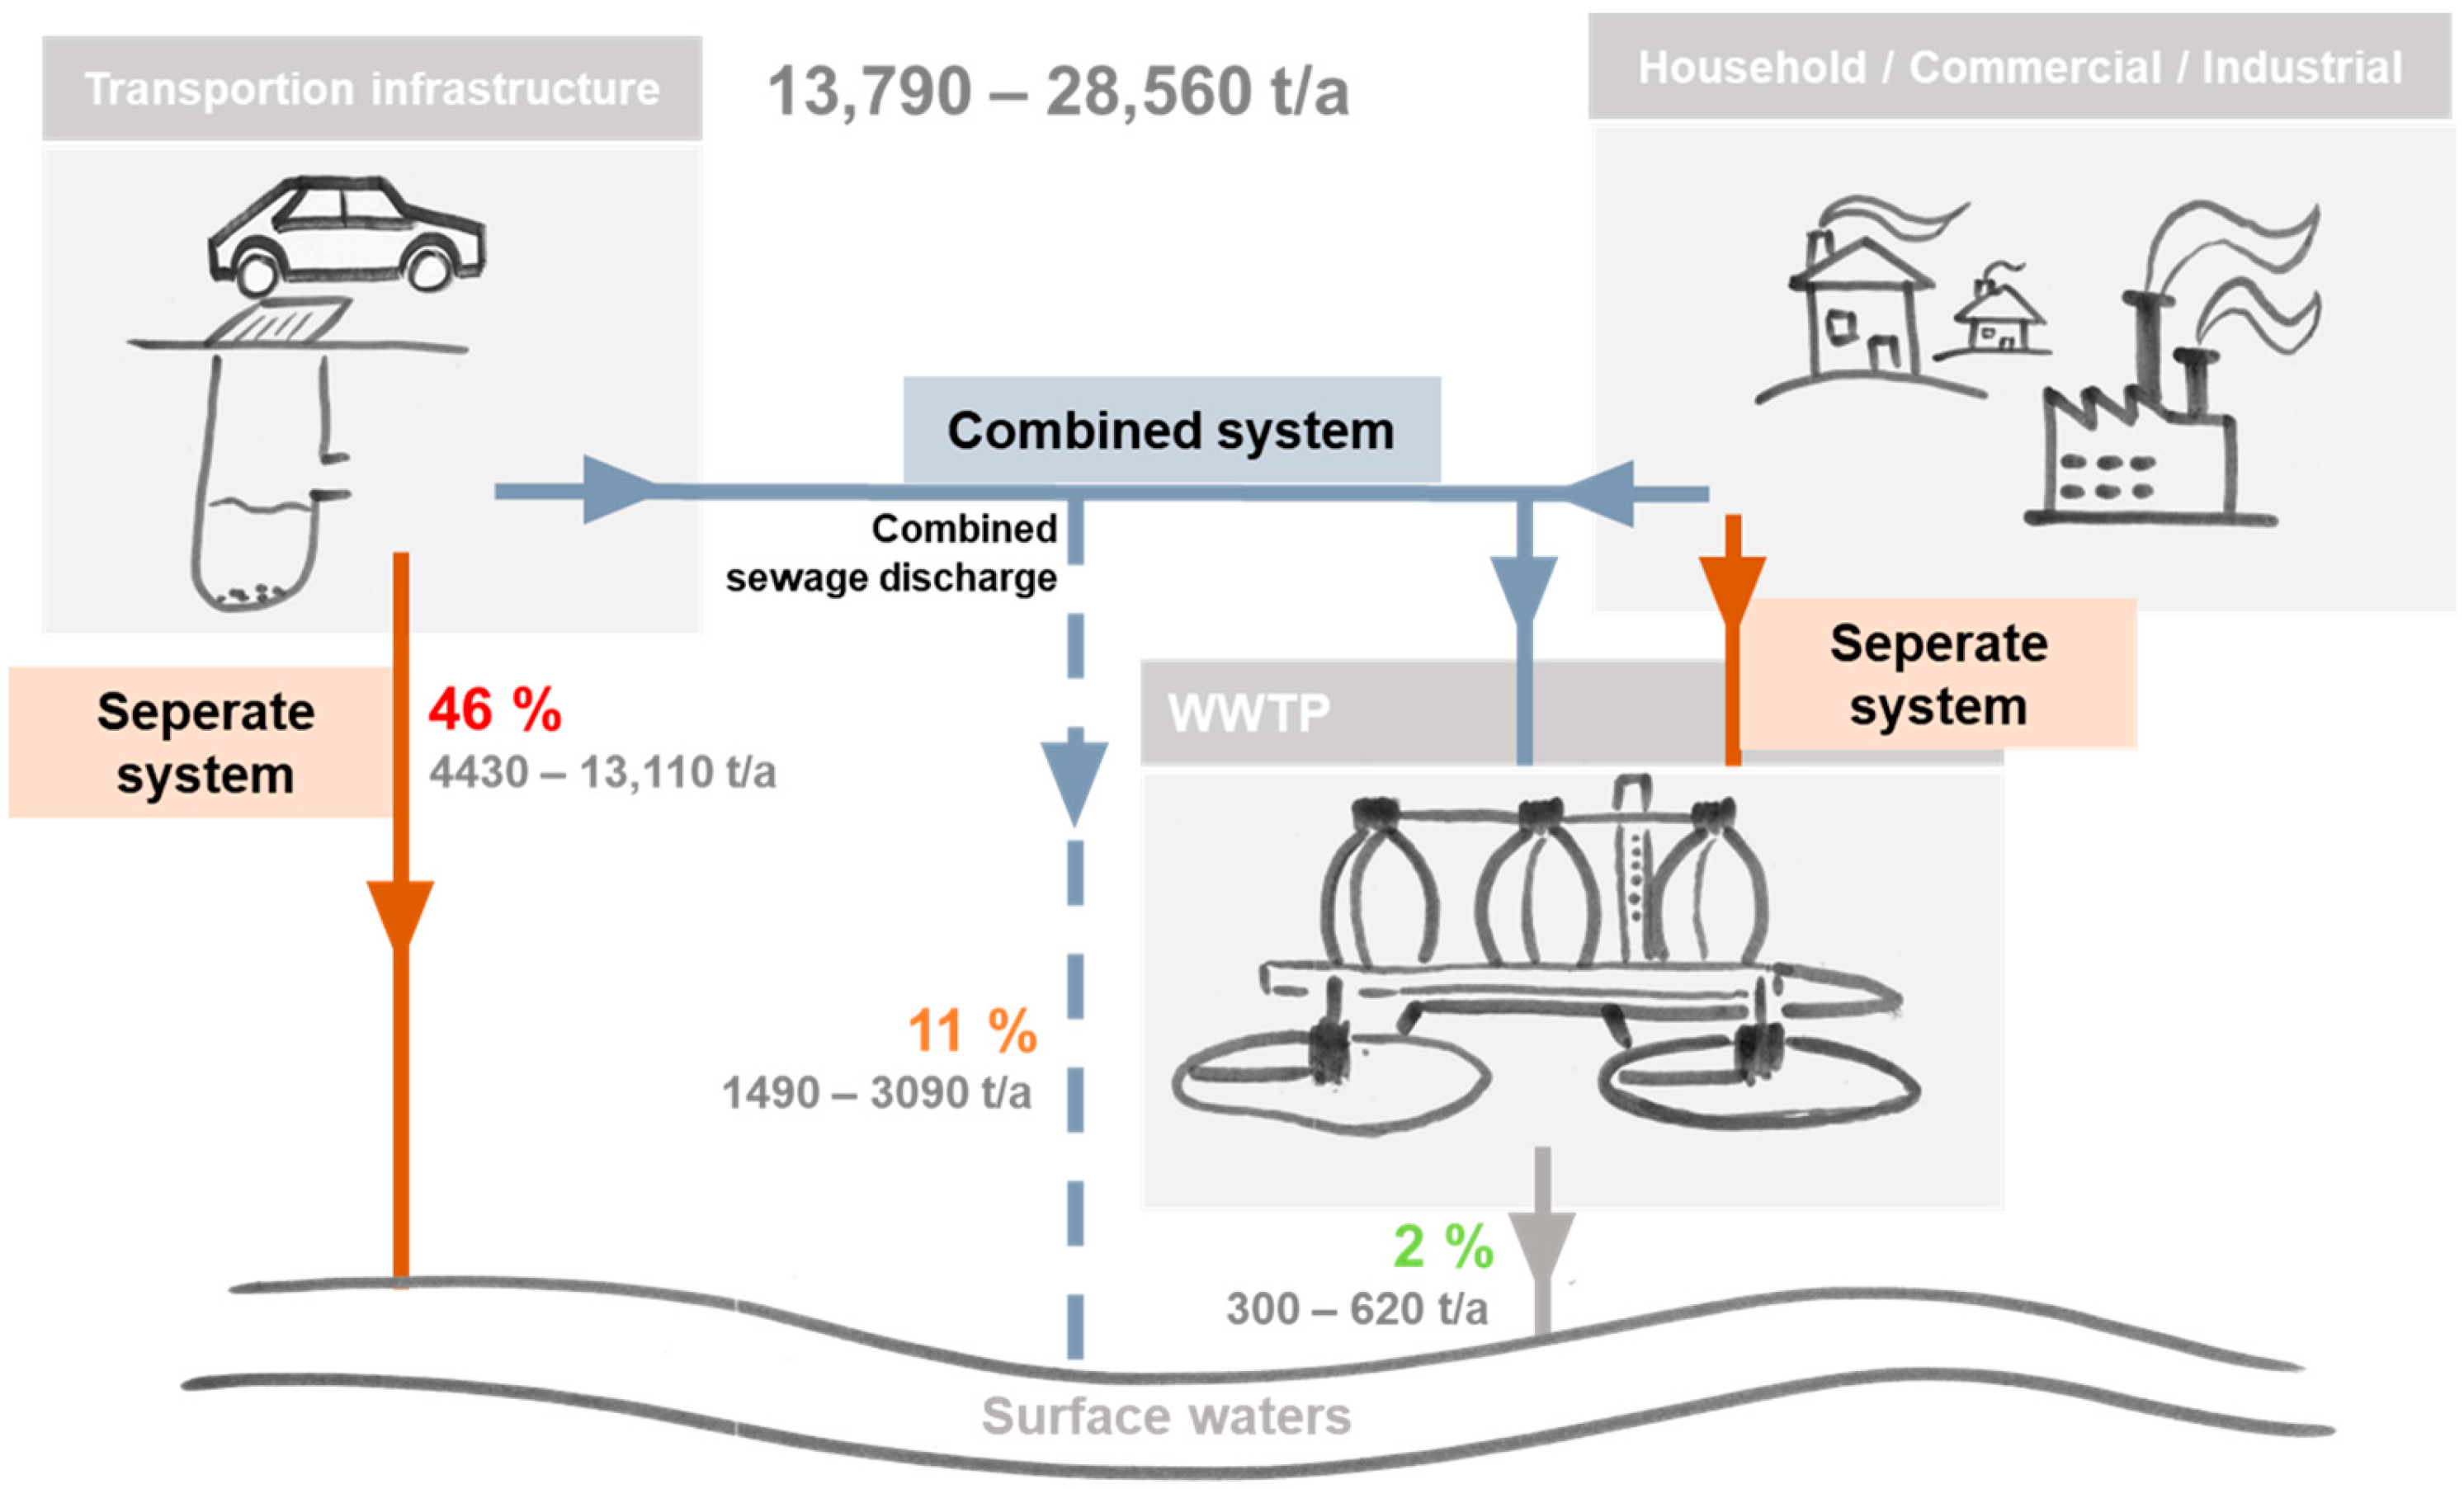
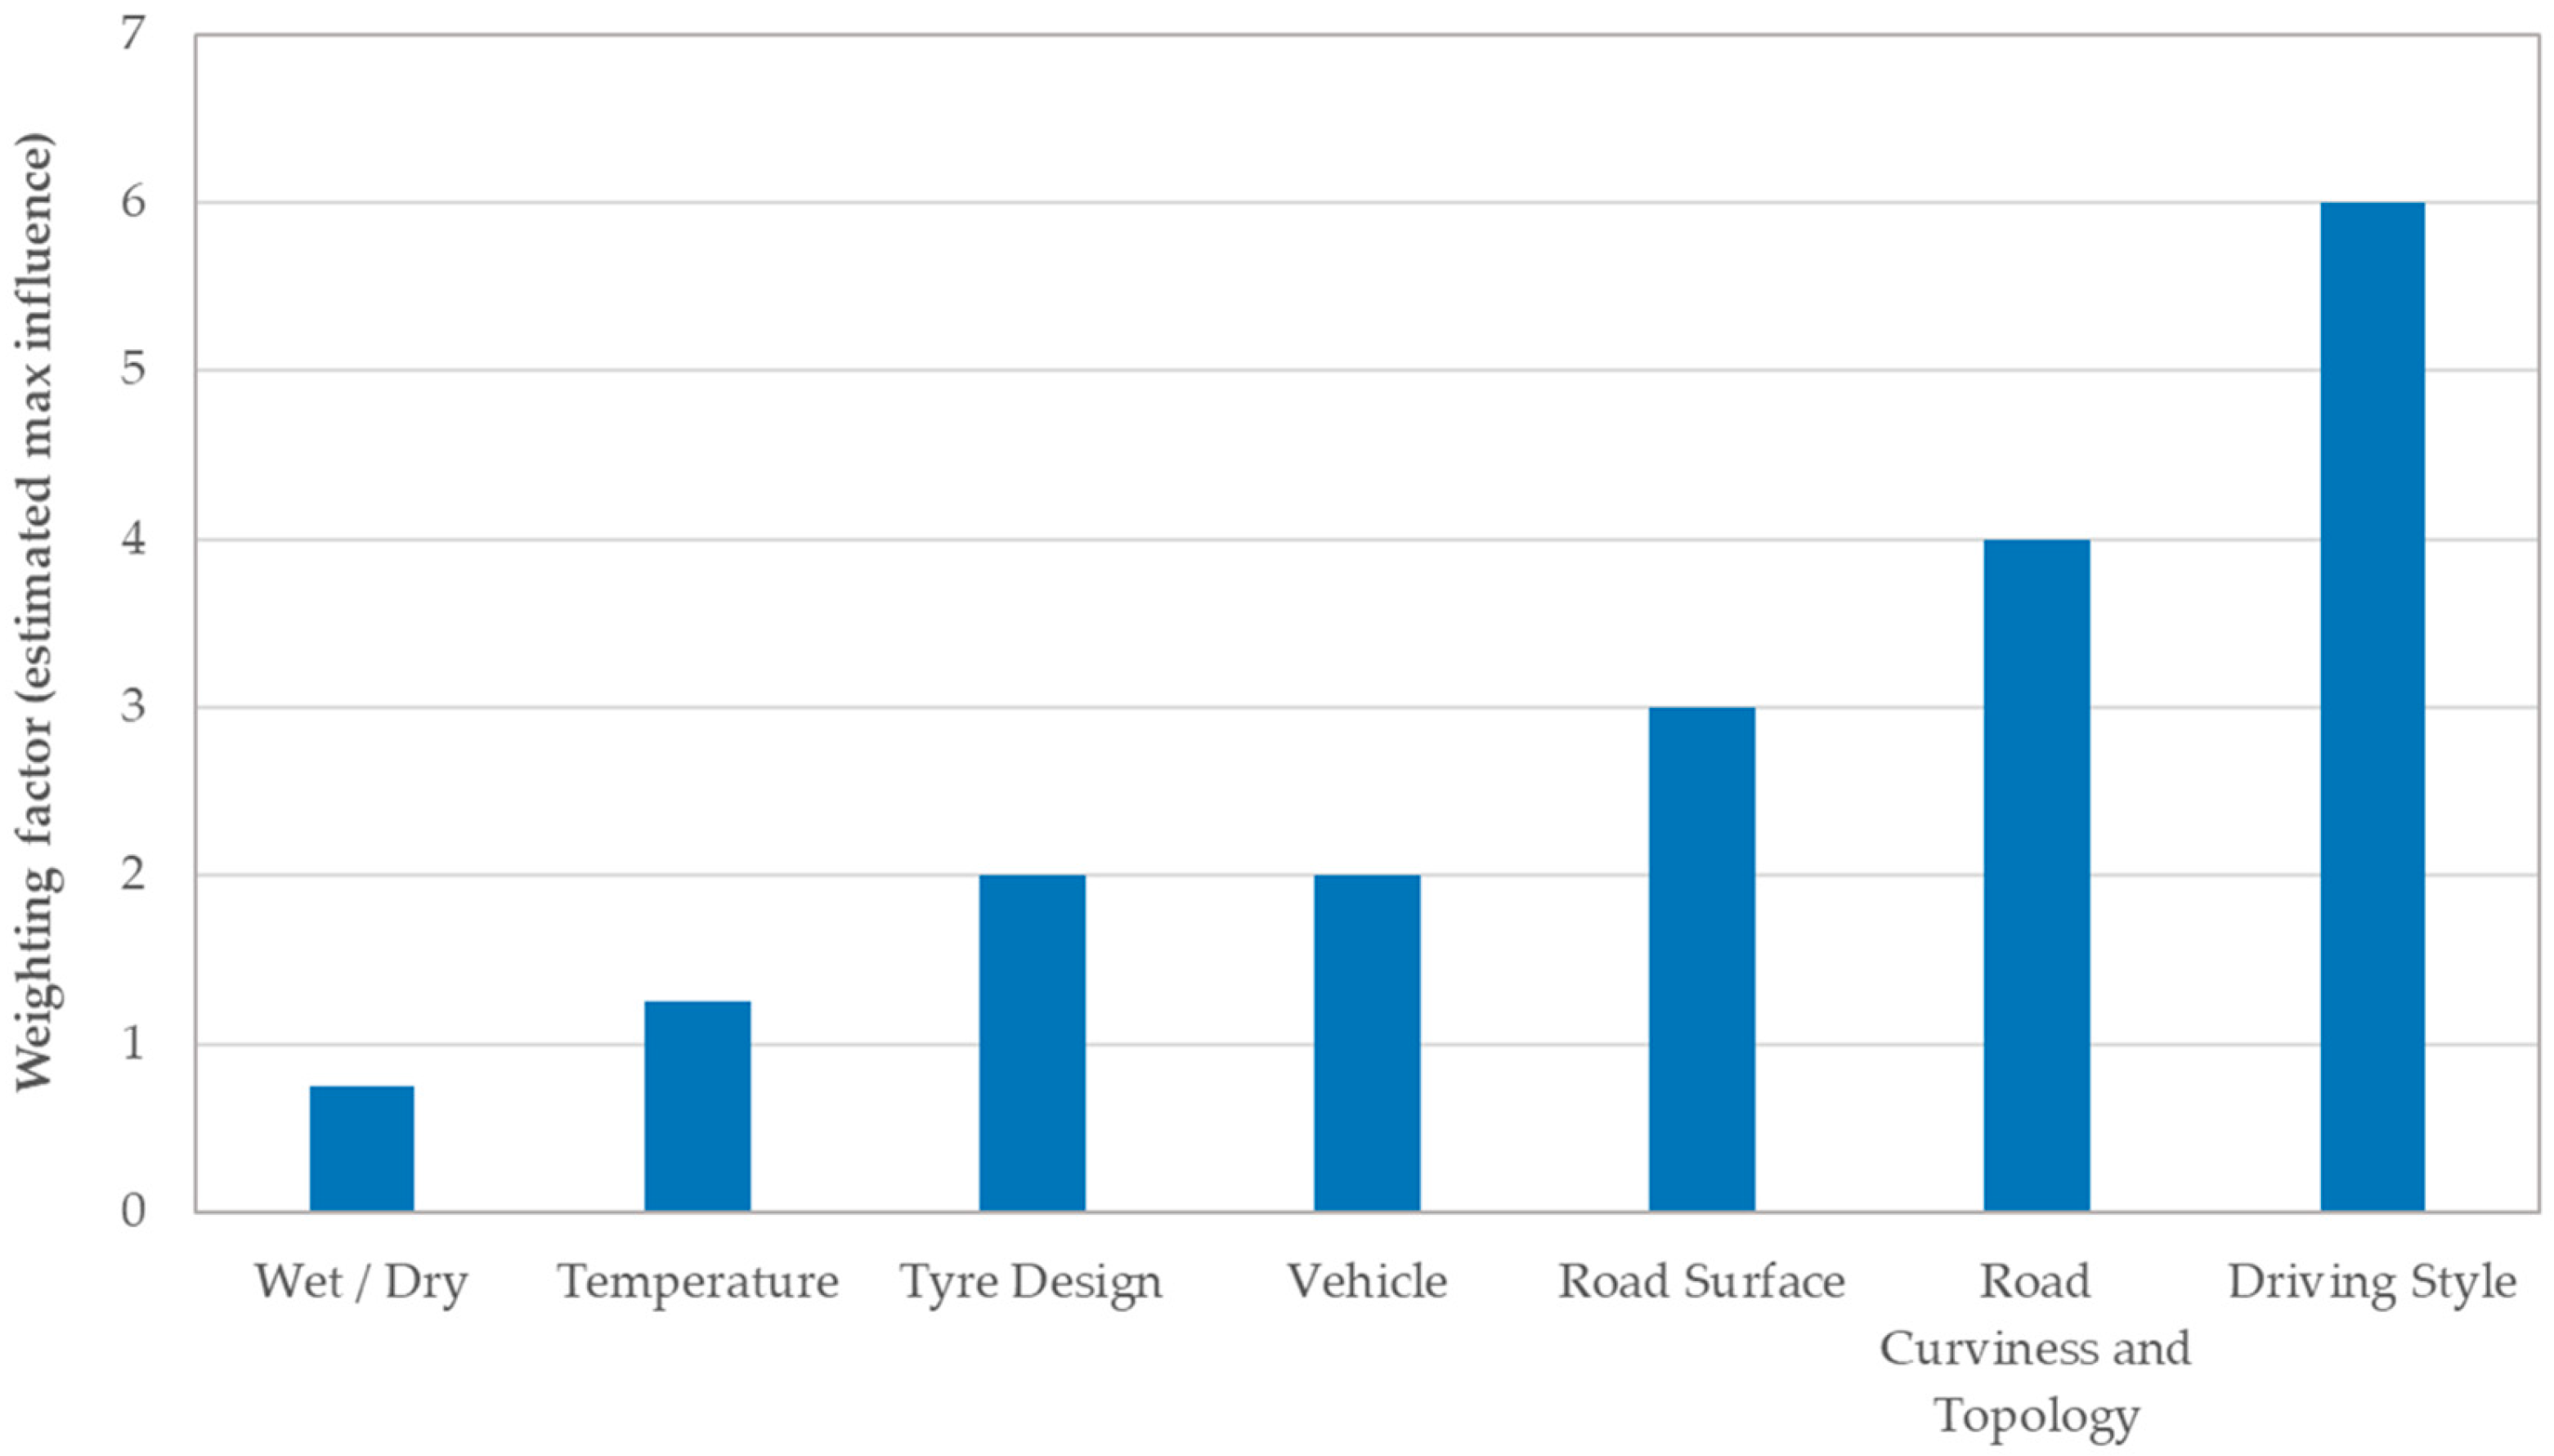
:1. Introduction
- Input of treated wastewater from wastewater treatment plants.
- Combined sewer overflows.
- Discharge of storm water from separate sewer systems.
2. Materials and Methods
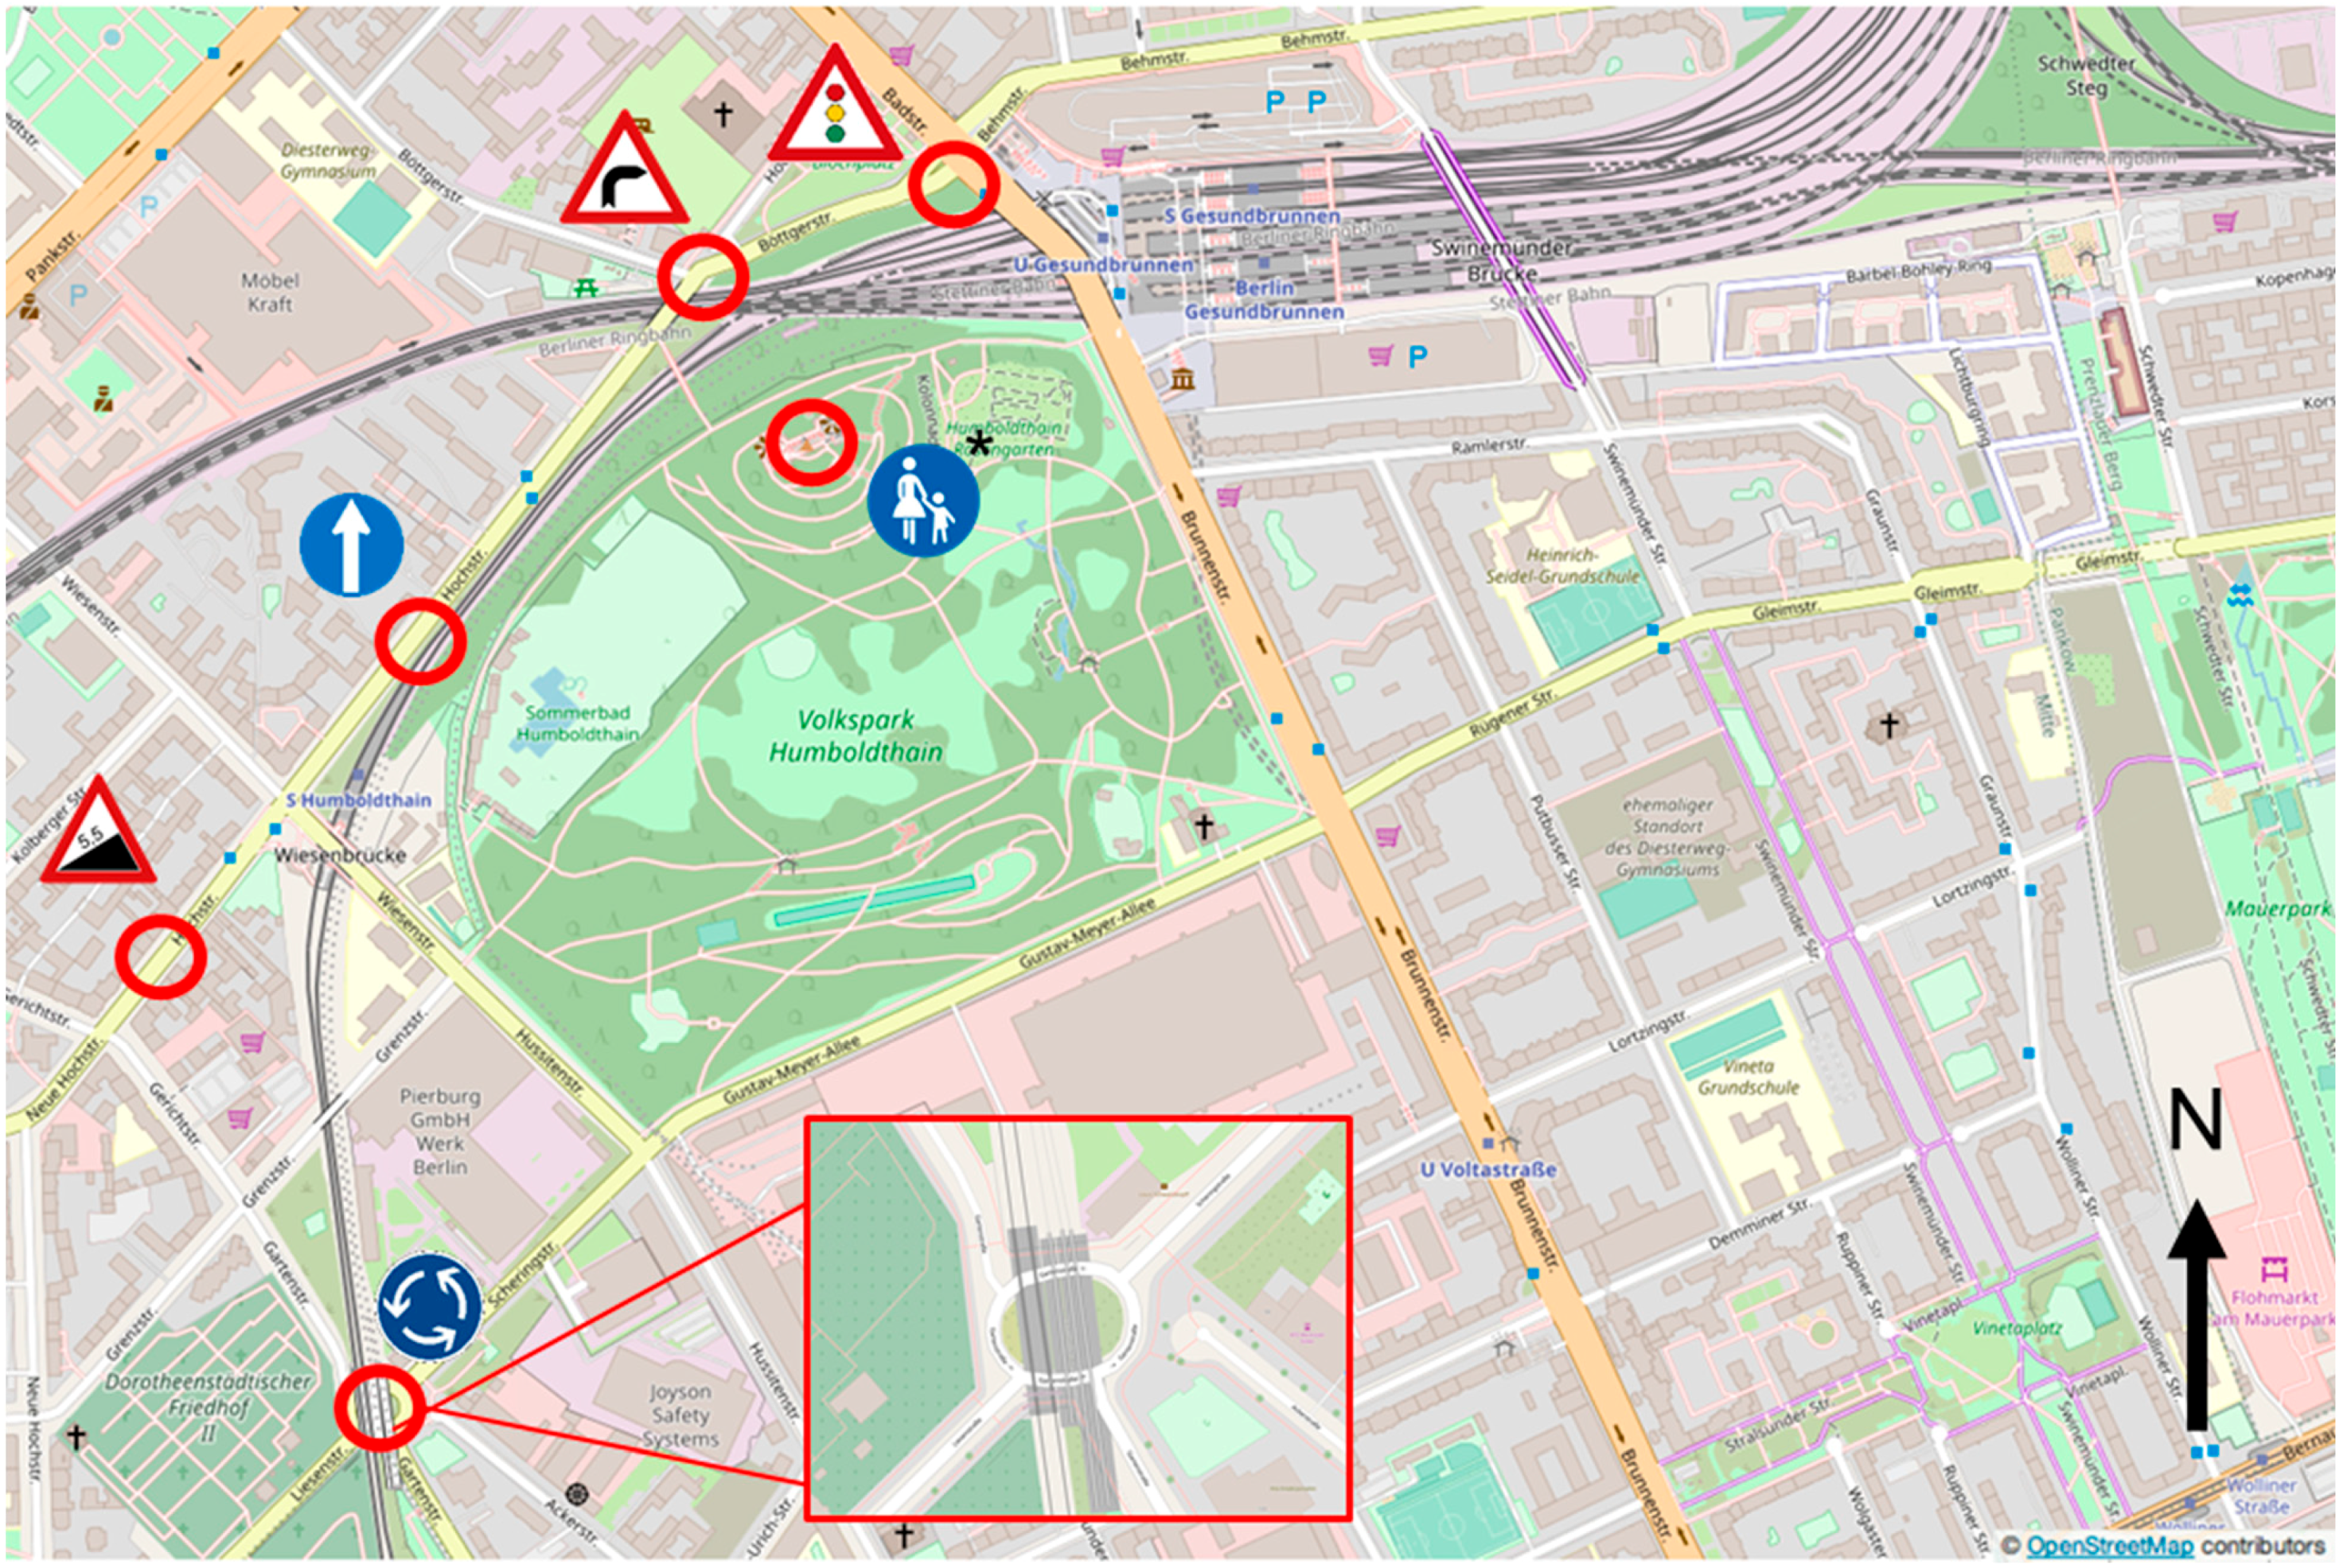
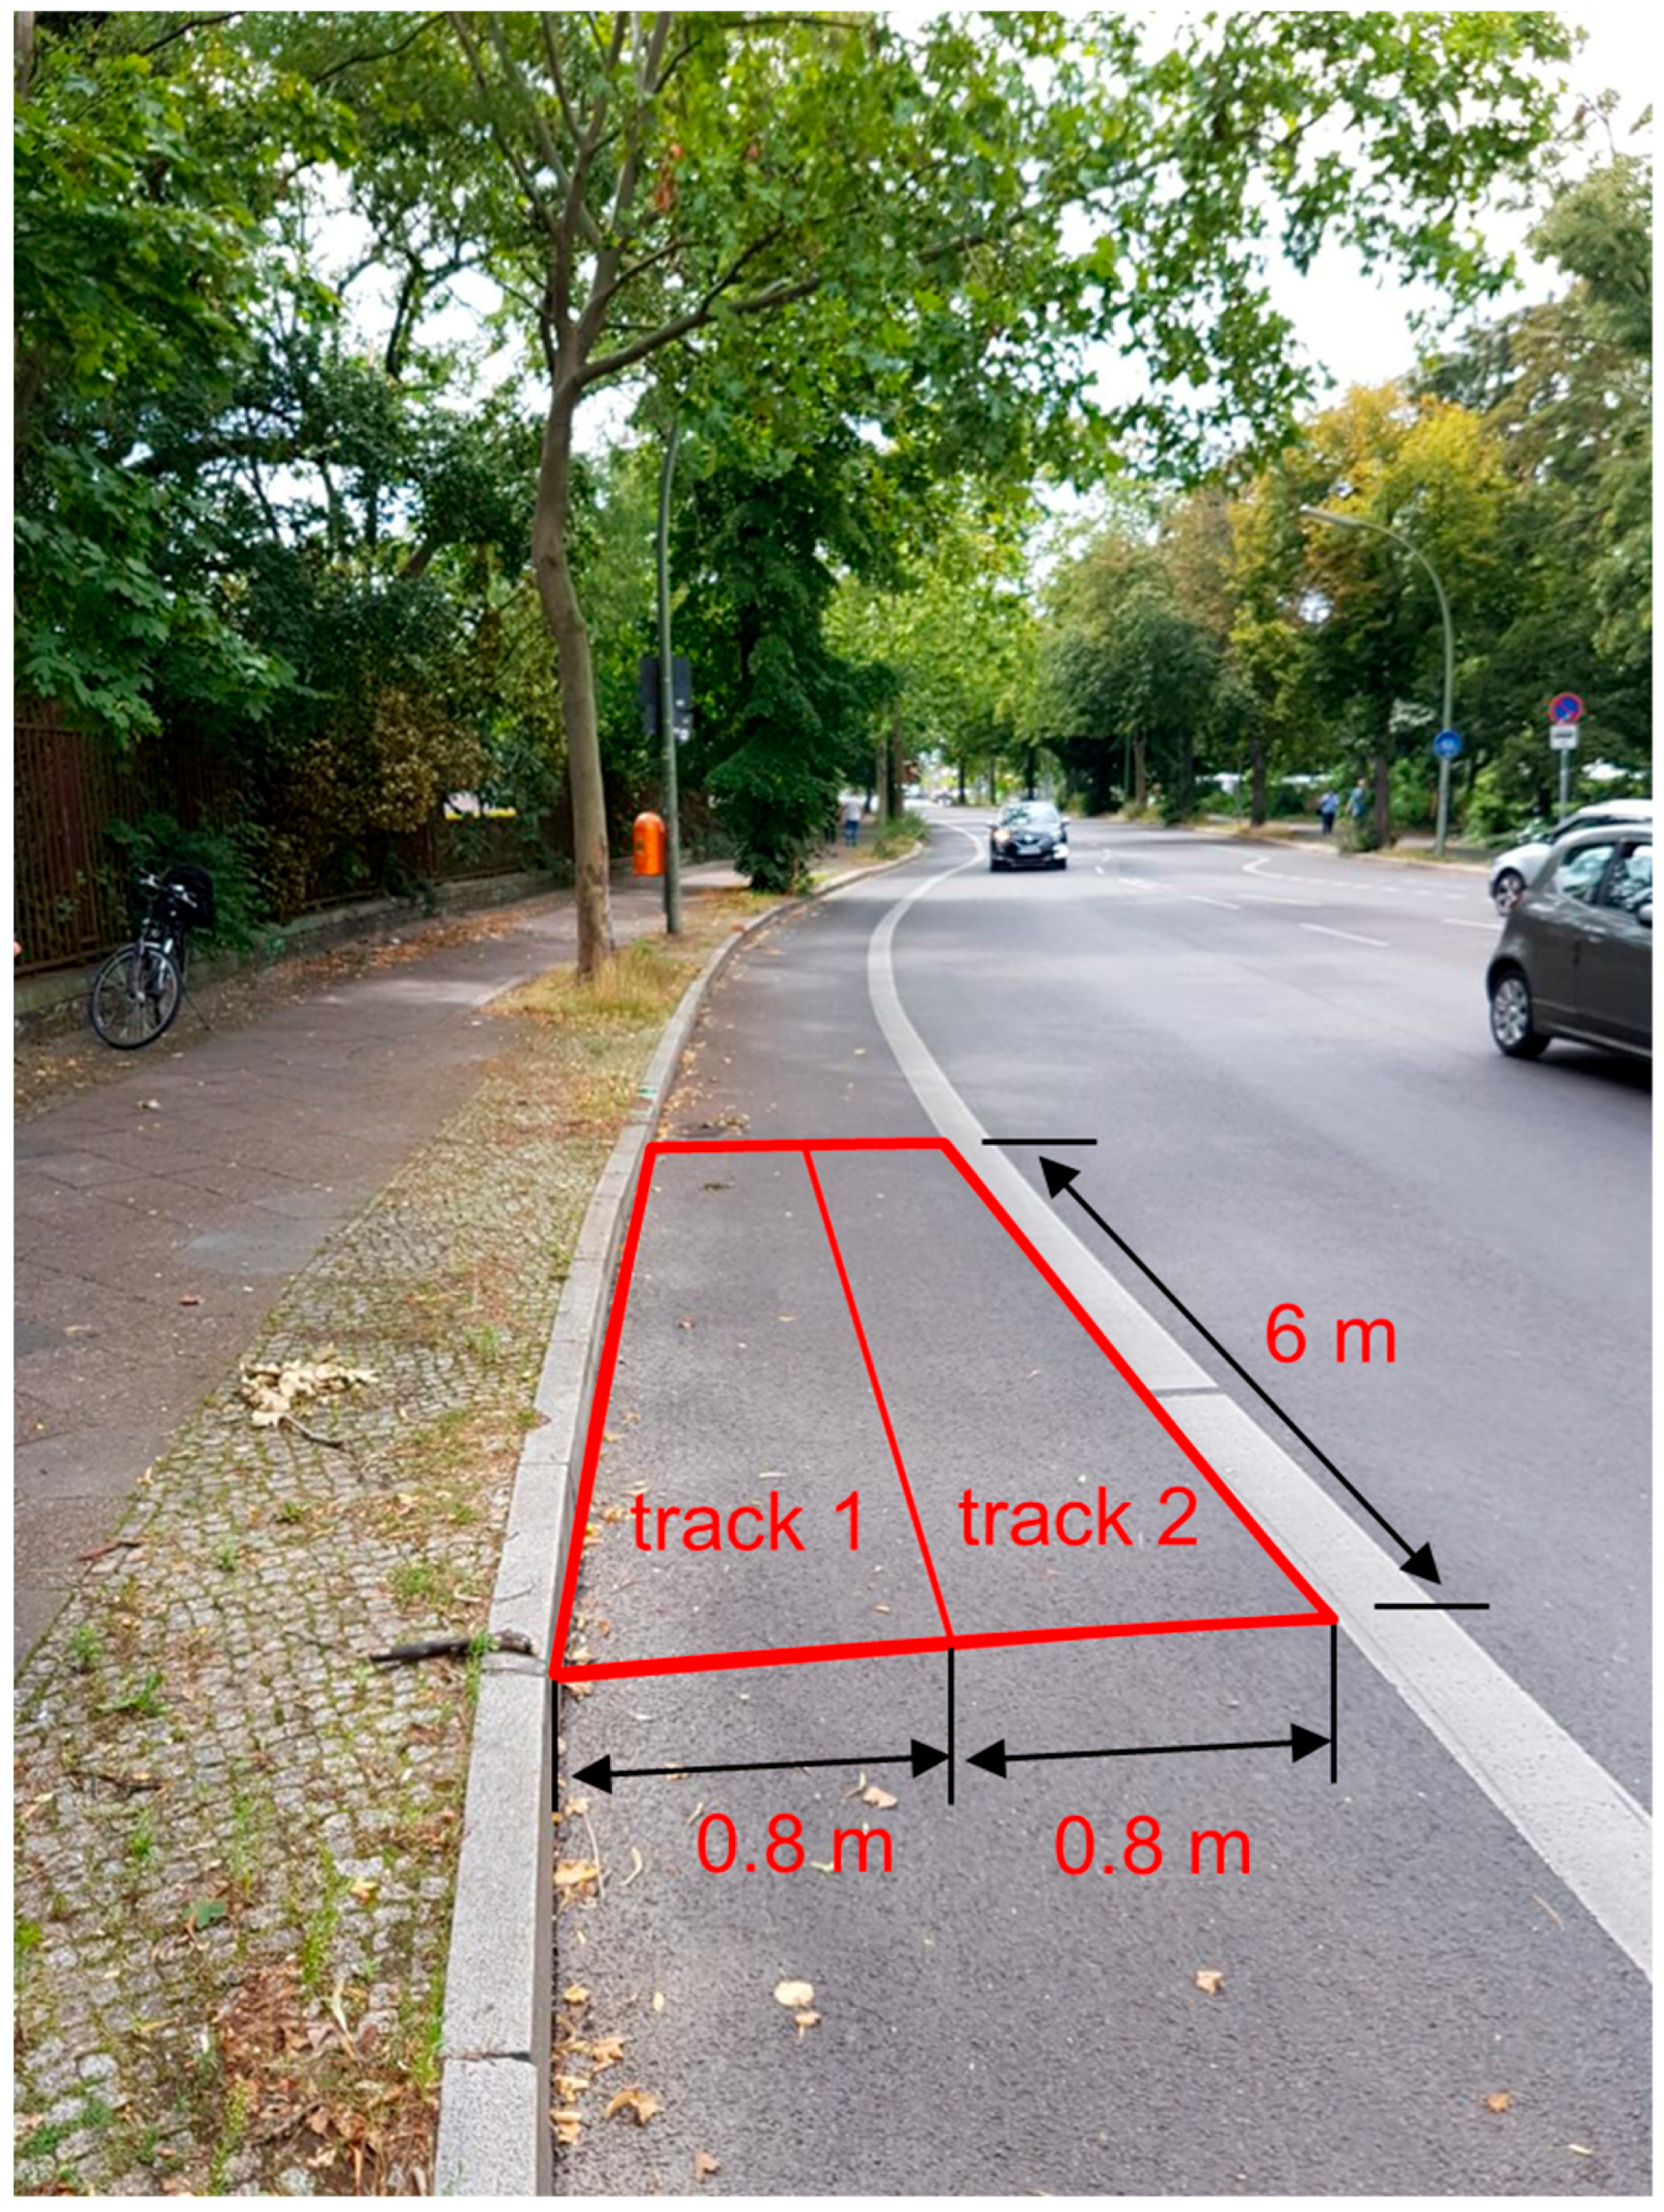
2.1. Road-Deposited Sediment Sampling by Sweeping
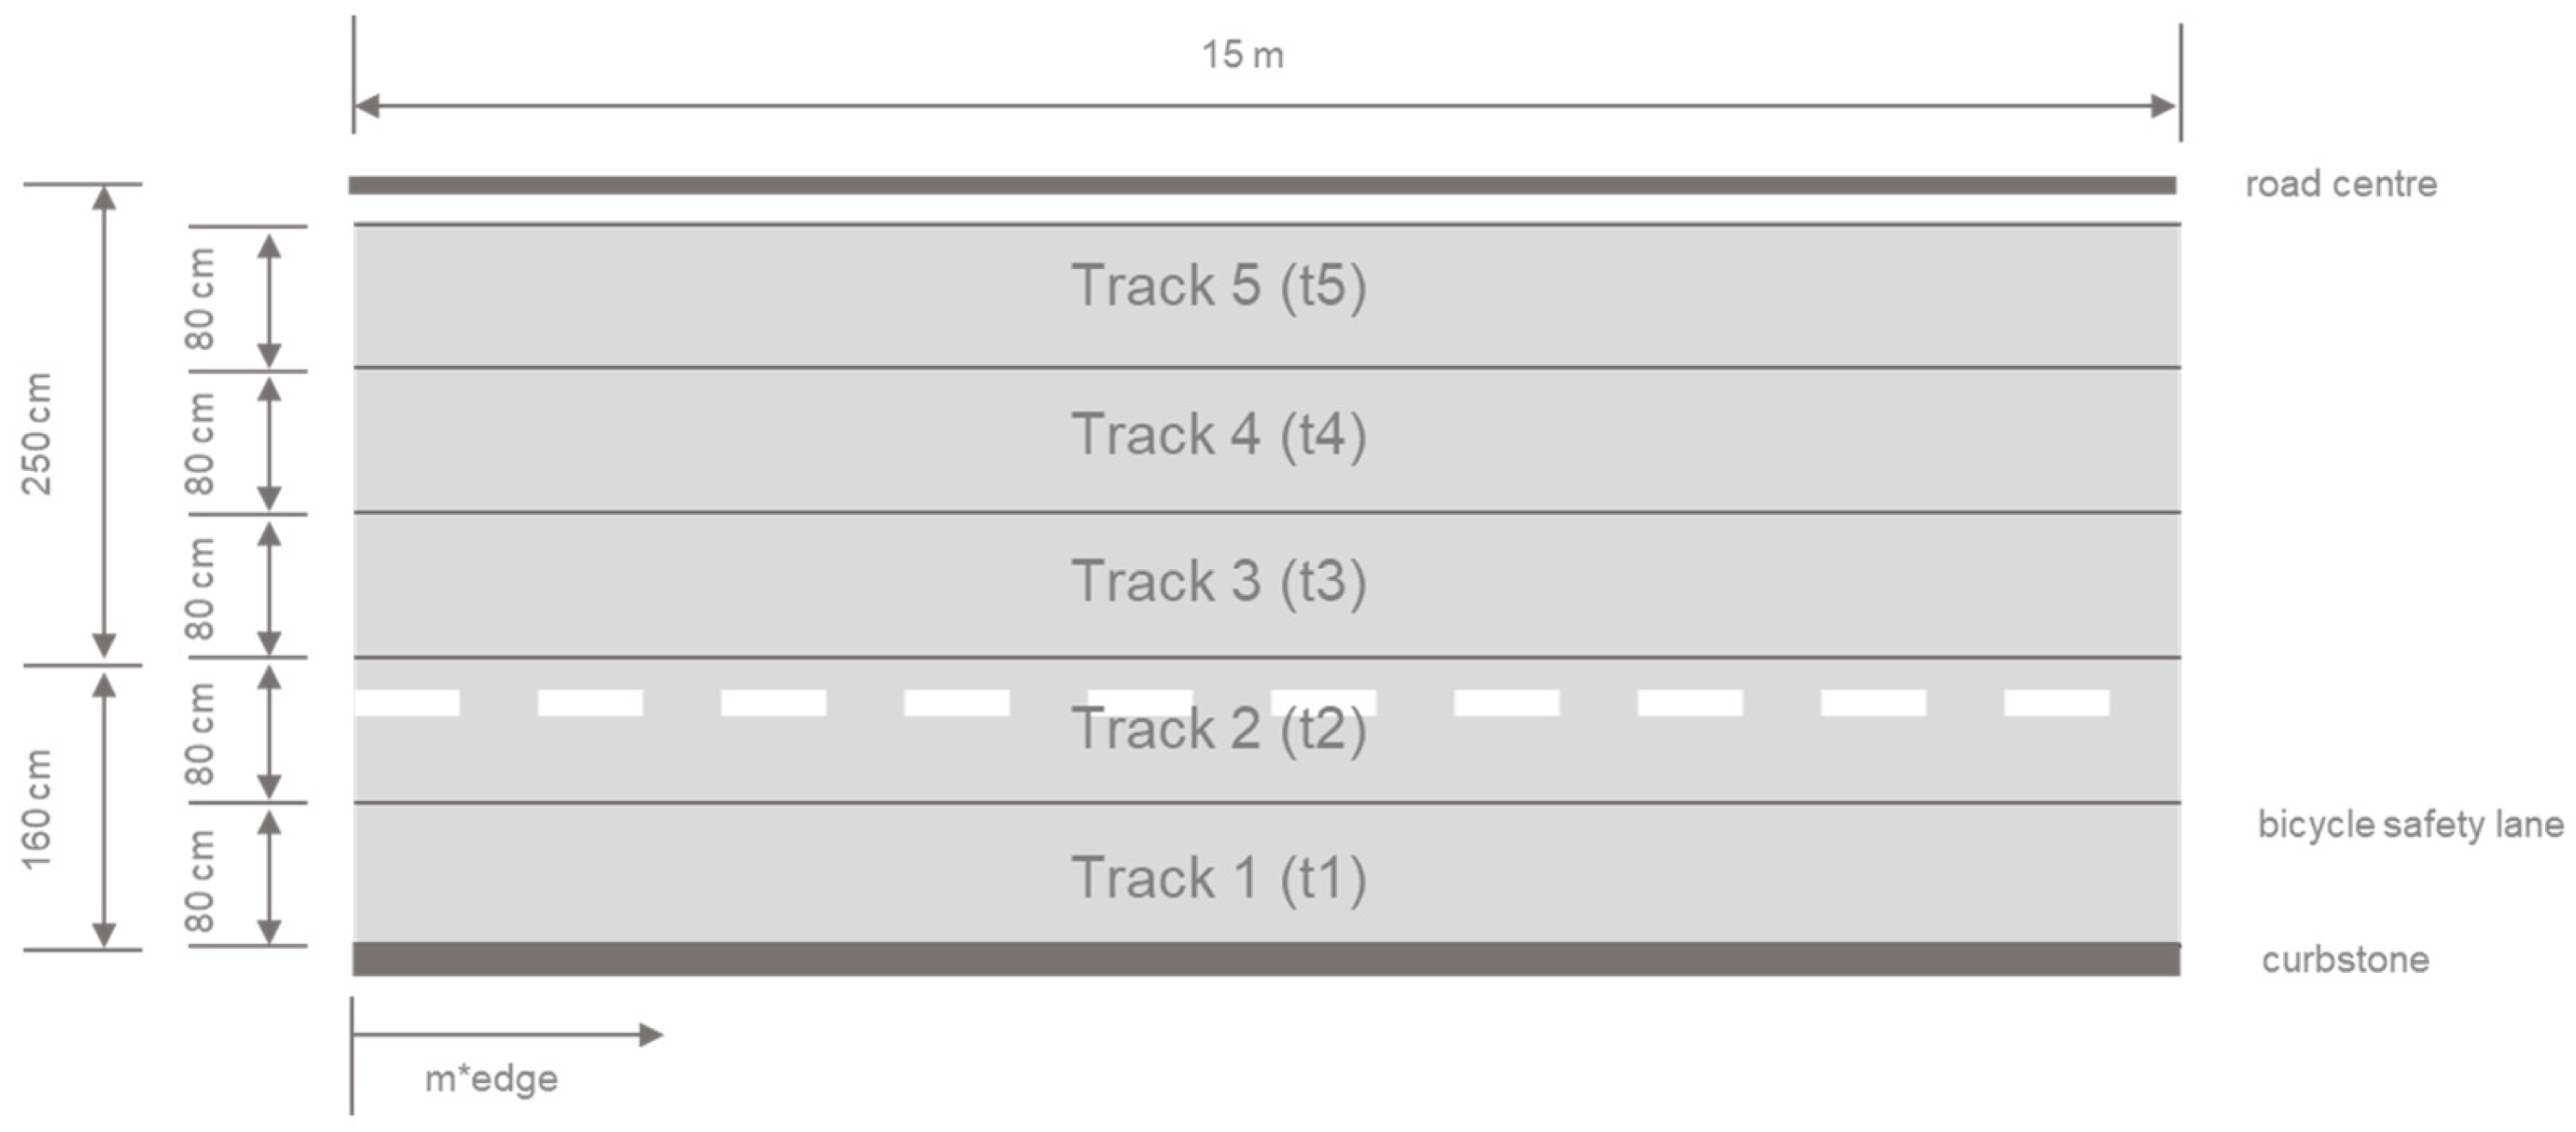
2.2. Investigation of the Particles Distribution across the Road
2.3. 24 h Sampling
Traffic Counting
2.4. Analysitcs and Evaluation
3. Results and Discussion
3.1. Investigation of the Particles Distribution across the Road
3.2. 24 h Sampling RDS
3.3. 24 h Sampling SBR
3.4. Traffic Counting
4. Conclusions
Supplementary Materials
Author Contributions
Funding
Institutional Review Board Statement
Informed Consent Statement
Data Availability Statement
Acknowledgments
Conflicts of Interest
References
- Alonso Raposo, M.; Ciuffo, B.; Alves Dias, P.; Ardente, F.; Aurambout, J.; Baldini, G.; Baranzelli, C.; Blagoeva, D.; Bobba, S.; Braun, R.; et al. The Future of Road Transport: Implications of Automated, Connected, Low-Carbon and Shared Mobility; Publications Office of the European Union: Luxembourg, 2019; ISBN 978-92-76-14318-5. [Google Scholar] [CrossRef]
- Kreider, M.L.; Panko, J.M.; McAtee, B.L.; Sweet, L.I.; Finley, B.L. Physical and chemical characterization of tire-related particles: Comparison of particles generated using different methodologies. Sci. Total Environ. 2010, 408, 652–659. [Google Scholar] [CrossRef] [PubMed]
- Son, C.E.; Choi, S.-S. Preparation and Characterization of Model Tire–Road Wear Particles. Polymers 2022, 14, 1512. [Google Scholar] [CrossRef] [PubMed]
- ETRMA 2020—The European Tyre Industry Fatcs and Figures “Did You Know That?”. 2020. Available online: https://www.etrma.org/wp-content/uploads/2019/12/Figures-leaflet-updated-front-2019-larger-NEW-LABEL.pdf (accessed on 4 June 2023).
- Eisentraut, P.; Dümichen, E.; Ruhl, A.S.; Jekel, M.; Albrecht, M.; Gehde, M.; Braun, U. Two Birds with One Stone—Fast and Simultaneous Analysis of Microplastics: Microparticles Derived from Thermoplastics and Tire Wear. Environ. Sci. Technol. Lett. 2018, 5, 608–613. [Google Scholar] [CrossRef]
- Sommer, F.; Dietze, V.; Baum, A.; Sauer, J.; Gilge, S.; Maschowski, C.; Gieré, R. Tire Abrasion as a Major Source of Microplastics in the Environment. Aerosol Air Qual. Res. 2018, 18, 2014–2028. [Google Scholar] [CrossRef]
- Ciullo, P.A.; Hewitt, N. Compounding Materials. Rubber Formul. 1999, 4–49. [Google Scholar]
- Tian, Z.; Zhao, H.; Peter, K.T.; Gonzalez, M.; Wetzel, J.; Wu, C.; Hu, X.; Prat, J.; Mudrock, E.; Hettinger, R. A ubiquitous tire rubber-derived chemical induces acute mortality in coho salmon. Science 2021, 371, 185–189. [Google Scholar] [CrossRef] [PubMed]
- Seiwert, B.; Nihemaiti, M.; Troussier, M.; Weyrauch, S.; Reemtsma, T. Abiotic oxidative transformation of 6-PPD and 6-PPD quinone from tires and occurrence of their products in snow from urban roads and in municipal wastewater. Water Res. 2022, 212, 118122. [Google Scholar] [CrossRef] [PubMed]
- Cao, G.; Wang, W.; Zhang, J.; Wu, P.; Zhao, X.; Yang, Z.; Hu, D.; Cai, Z. New Evidence of Rubber-Derived Quinones in Water, Air, and Soil. Environ. Sci. Technol. 2022, 56, 4142–4150. [Google Scholar] [CrossRef] [PubMed]
- Statista: Kunststoffindustrie. Statista. 2019. Available online: https://de.statista.com/statistik/studie/id/7275/dokument/kunststoffindustrie-statista-dossier/ (accessed on 7 August 2020).
- Hohmann, M. Statistiken zu Kautschuk. Statista. 2019. Available online: https://de.statista.com/statistik/studie/id/7288/dokument/kautschuk-statista-dossier/ (accessed on 7 August 2020).
- Ahlswede, A. Statistiken zum Reifenmarkt. Statista. 2019. Available online: https://de.statista.com/themen/2668/reifenmarkt/ (accessed on 7 August 2020).
- Statista. Weltweite Automobilindustrie. Statista. 2019. Available online: https://de.statista.com/statistik/studie/id/31199/dokument/weltweite-automobilindustrie-statista-dossier/ (accessed on 7 August 2020).
- Deltares and TNO 2016 Emissieschattingen Diffuse bronnen Emissieregistratie—Bandenslijtage Wegverkeer. Available online: https://docplayer.nl/28992900-Emissieschattingen-diffuse-bronnen-emissieregistratie-remslijtage-versie-mei-2016.html (accessed on 4 June 2023).
- Kraftfahrtbundesamt: Verkehr in Kilometern—Inländerfahrleistung. Entwicklungen der Fahrleistungen nach Fahrzeugarten Seit 2015. KBA. 2019. Available online: www.kba.de/DE/Statistik/Kraftverkehr/VerkehrKilometer/vk_inlaenderfahrleistung/vk_inlaenderfahrleistung_inhalt.htm (accessed on 7 August 2020).
- Baensch-Baltruschat, B.; Kocher, B.; Kochleus, C.; Stock, F.; Reifferscheid, G. Tyre and road wear particles—A calculation of generation, transport and release to water and soil with special regard to German roads. Sci. Total Environ. 2021, 752, 141939. [Google Scholar] [CrossRef] [PubMed]
- Statistisches Bundesamt: Bevölkerungsstand—Bevölkerung nach Bundesländern. Destatis. 2019. Available online: https://www.destatis.de/DE/Themen/Gesellschaft-Umwelt/Bevoelkerung/Bevoelkerungsstand/Tabellen/bevoelkerung-nichtdeutsch-laender.html (accessed on 24 August 2020).
- Jung, U.; Choi, S.-S. Classification and Characterization of Tire-Road Wear Particles in Road Dust by Density. Polymers 2022, 14, 1005. [Google Scholar] [CrossRef] [PubMed]
- Wagner, S.; Hüffer, T.; Klöckner, P.; Wehrhahn, M.; Hofmann, T.; Reemtsma, T. Tire wear particles in the aquatic environment—A review on generation, analysis, occurrence, fate and effects. Water Res. 2018, 139, 83–100. [Google Scholar] [CrossRef] [PubMed]
- Hann, S.; Sherrington, C.; Jamieson, O.; Hickman, M.; Bapasola, A. Investigating Options for Reducing Releases in the Aquatic Environment of Microplastics Emitted by Products; Eunomia Research & Consulting Ltd.: Bristol, UK, 2018. [Google Scholar]
- Baensch-Baltruschat, B.; Kocher, B.; Stock, F.; Reifferscheid, G. Tyre and road wear particles (TRWP)—A review of generation, properties, emissions, human health risk, ecotoxicity, and fate in the environment. Sci. Total Environ. 2020, 733, 137823. [Google Scholar] [CrossRef] [PubMed]
- Ten Broeke, H.; Hulskotte, J.; Denier van der Gon, H.A.C. Road Traffic Tire Wear. Emission Estimates for Diffuse Sources, Netherlands Emission Inventory; TNO Built Environment and Geosciences: Utrecht, The Netherlands, 2008. [Google Scholar]
- Scheid, C.; Abusafia, A.; Steinmetz, H. Mikroplastik in kommunalen entwässerungssystemen—Aufkommen und relevanzen. In Proceedings of the Repräsentative Untersuchungsstrategien für ein Integratives Systemverständnis von Spezifischen Einträgen von Kunststoffen in die Umwelt (RUSEKU) DWA Seminar—Mikroplastik im Abwasser—Einordnung und Handlungsempfehlungen, Hannover, Germany, 20 October 2022. [Google Scholar]
- Scheer, H.; Fuhrmann, T.; Emscher Wassertechnik GmbH. REPLAWA: Reduktion des Eintrags von Plastik über das Abwasser in die aquatische Umwelt; Final Report; Bundesministerium für Bildung und Forschung: Berlin, Germany, 2022. [Google Scholar]
- Unice, K.M.; Weeber, M.P.; Abramson, M.M.; Reid, R.C.D.; van Gils, J.A.G.; Markus, A.A.; Vethaak, A.D.; Panko, J.M. Characterizing export of land-based microplastics to the estuary—Part I: Application of integrated geospatial microplastic transport models to assess tire and road wear particles in the Seine watershed. Sci. Total Environ. 2019, 646, S1639–S1649. [Google Scholar] [CrossRef] [PubMed]
- Mengistu, D.; Heistad, A.; Coutris, C. Tire wear particles concentrations in gully pot sediments. Sci. Total Environ. 2021, 769, 144785. [Google Scholar] [CrossRef] [PubMed]
- Kwak, J.-H.; Kim, H.; Lee, J.; Lee, S. Characterization of non-exhaust coarse and fine particles from on-road driving and laboratory measurements. Sci. Total Environ. 2013, 458–460, 273–282. [Google Scholar] [CrossRef] [PubMed]
- Mennekes, D.; Nowack, B. Tire wear particle emissions: Measurement data where are you? Sci. Total Environ. 2022, 830, 154655. [Google Scholar] [CrossRef] [PubMed]
- Cettour-Janet, D. European Tyre and Rim Technical Organisation—ETRTO: Tyre Abrasion How to develop a Method for quantitative assessment. 2021. Available online: https://www.tyreandroadwear.com/wp-content/uploads/2021/12/20210614-ETRTO-Abrasion-Test-for-TireTech2021.pdf (accessed on 7 June 2023).
- TyrewearMapping 2021, final report: “Reifenabrieb—Ein unterschätztes Umweltproblem?” Digitales Planungs- und Entscheidungsinstrument zur Verteilung, Ausbreitung und Quantifizierung von Reifenabrieb in Deutschland. Available online: https://www.umsicht.fraunhofer.de/content/dam/umsicht/de/dokumente/kompetenz/prozesse/tyrewearmapping-schlussbericht.pdf (accessed on 7 June 2023).
- Venghaus, D.; Frank Schmerwitz, F.; Reiber, J.; Sommer, H.; Lindow, F.; Herper, D.; Pohrt, R.; Barjenbruch, M. Reifenabrieb in der Umwelt—RAU; Final Report; Plastik in der Umwelt: Berlin, Germany, 2021. [Google Scholar]
- © OpenStreetMap. Open Database License opendatacommons.org. Available online: https://www.openstreetmap.org/copyright/en (accessed on 4 June 2023).
- Pitt, R.; Amy, G. Toxic Materials Analysis of Street Surface Constituents; U.S. Environmental Protection Agency: Washington, DC, USA, 1973. [Google Scholar]
- Grottker, M. Runoff quality from a street with medium traffic loading. Sci. Total Environ. 1987, 59, 457–466. [Google Scholar] [CrossRef]
- ISO/TS 21396:2017. Rubber—Determination of Mass Concentration of Tire and Road Wear Particles (TRWP) in Soil and Sediments —Pyrolysis-GC/MS Method. ISO: Geneva, Switzerland, 2017.
- DIN 66165-1:2016-08; Particle Size Analysis—Sieving analysis—Part 1: Fundamentals Procedure. 2016. Available online: https://www.beuth.de/en/standard/din-66165-1/255316600 (accessed on 4 June 2023).
- DIN 66165-2:2016-08; Particle Size Analysis—Sieving analysis—Part 2: Procedure. 2016. Available online: https://www.beuth.de/en/standard/din-66165-2/255334374 (accessed on 4 June 2023).
- Sieker, F.; Grottker, M. Beschaffenheit von Straßenoberflächenwasser bei Mittler Verkehrsbelastung; Forschung Straßenbau und Straßenverkehrstechnik; Bundesminister für Verkehr, Abt.Straßenbau: Berlin, Germany, 1988; Volume 530. [Google Scholar]
- Schmitt, T.G.; Welker, A.; Dierschke, M.; Uhl, M.; Maus, C.; Remmler, F. Entwicklung von Prüfverfahren für Anlagen zur dezentralen Niederschlagswasserbehandlung im Trennverfahren. In Final Report to the German Federal Foundation for the Environment; Deutsche Vereinigung für Wasserwirtschaft, Abwasser und Abfall: Hennef, Germany, 2010. [Google Scholar]
- Gelhardt, L.; Huber, M.; Welker, A. Development of a Laboratory Method for the Comparison of Settling Processes of RoadDeposited Sediments with Artificial Test Material. Water Air Soil Pollut. 2017, 228, 467. [Google Scholar] [CrossRef]
- Bäumer, M.; Hautzinger, H.; Pfeiffer, M.; Stock, W.; Lenz, B.; Kuhnimhof, T.; Köhler, K. Fahrleistungserhebung 2014—Inländerfahrleistung. In Berichte der Bundesanstalt für Straßenwesen (BASt); Verkehrstechnik V 290. IVT Research GmbH (Mannheim); Institut für Verkehrsforschung DLR: Berlin, Germany; Bergisch-Gladbach, Germany, 2017. [Google Scholar]


| Sampling Location | Road Width [m] | Curb Height [m] | Walkway Width [m] | Slope in Driving Direction | Overlay by Tree | Boundary to Tree Slice | |
|---|---|---|---|---|---|---|---|
 | Straight | 10.5 | 0.12 | 7.7 | 0.9% | 10% | Yes |
 | Traffic lights | 8.8 | 0.13 | 3.9 | 1.0% | 70% | Yes |
 | Curve (r = 65 m) | 11.3 | 0.04 | 3.8 | 0.8% | 0% | No |
 | Slope | 11.4 | 0.03 | 7.7 | 3.2% | 50% | Yes |
 | Roundabout | 8.4 | 0.13 | 6.4 | 2.2% | 0% | No |
| Sampling Location | Vehicle Type | Num. [vehicle/day] | SD [vehicle/day] | Share | Ø-Speed [km/h] | SD [km/h] | |
|---|---|---|---|---|---|---|---|
 | Straight | Bicycle | 886 | 113 | 13% | 15 | 4 |
| LDV | 5932 | 320 | 84% | 40 | 6 | ||
| HDV | 246 | 41 | 3% | 40 | 6 | ||
 | Traffic lights | Bicycle | 1086 | 52 | 14% | 16 | 4 |
| LDV | 6262 | 221 | 82% | 40 | 6 | ||
| HDV | 272 | 35 | 4% | 40 | 6 | ||
 | Curve | Bicycle | 1012 | 52 | 15% | 15 | 3 |
| LDV | 5510 | 139 | 81% | 24 | 3 | ||
| HDV | 275 | 41 | 4% | 24 | 3 | ||
 | Slope | Bicycle | 987 | 53 | 14% | 13 | 4 |
| LDV | 5836 | 110 | 83% | 41 | 6 | ||
| HDV | 212 | 9 | 3% | 41 | 6 | ||
 | Roundabout | Bicycle | 1216 | 45 | 15% | 16 | 2 |
| LDV | 6308 | 211 | 78% | 25 | 5 | ||
| HDV | 596 | 5 | 7% | 25 | 5 | ||
Disclaimer/Publisher’s Note: The statements, opinions and data contained in all publications are solely those of the individual author(s) and contributor(s) and not of MDPI and/or the editor(s). MDPI and/or the editor(s) disclaim responsibility for any injury to people or property resulting from any ideas, methods, instructions or products referred to in the content. |
© 2023 by the authors. Licensee MDPI, Basel, Switzerland. This article is an open access article distributed under the terms and conditions of the Creative Commons Attribution (CC BY) license (https://creativecommons.org/licenses/by/4.0/).
Share and Cite
Venghaus, D.; Neupert, J.W.; Barjenbruch, M. Tire Wear Monitoring Approach for Hotspot Identification in Road Deposited Sediments from a Metropolitan City in Germany. Sustainability 2023, 15, 12029. https://doi.org/10.3390/su151512029
Venghaus D, Neupert JW, Barjenbruch M. Tire Wear Monitoring Approach for Hotspot Identification in Road Deposited Sediments from a Metropolitan City in Germany. Sustainability. 2023; 15(15):12029. https://doi.org/10.3390/su151512029
Chicago/Turabian StyleVenghaus, Daniel, Johannes Wolfgang Neupert, and Matthias Barjenbruch. 2023. "Tire Wear Monitoring Approach for Hotspot Identification in Road Deposited Sediments from a Metropolitan City in Germany" Sustainability 15, no. 15: 12029. https://doi.org/10.3390/su151512029