Abstract
An important source of microplastics (MPs) in the Baltic Sea waters is plastic waste, which is fragmented in the natural environment. The pilot research on the identification of microplastics in the surface waters of the Port of Gdynia is presented. In this paper, microplastics of particle sizes 0.3–5 mm in harbour seawaters were investigated. Microplastics were collected from five harbour basins using an unmanned mobile research unit, HydroDron-1. Sampling of microplastics on the surface port water was conducted over four seasons. The collected plastic particles were separated by chemical oxidation and flotation in the NaCl solution (density 1.2 g/cm3). Polymer identification was carried out by visual and microscopic observations, as well as using the Total Reflection Fourier Transform Infrared spectroscopy. Based on tows conducted in five basins of the Port of Gdynia, in total, the concentration of microplastics identified ranged from 0.082 mg/m3 to 0.524 mg/m3, depending on the investigated basin. Four groups of microplastic shapes (fragments, films, fibres and spheres) were detected in all the investigated harbour basins. Fragments and fibres were prevalent when categorised by particle shape, whereas when categorised by colour, transparent, white and black particles were dominant. The predominant type of the identified polymers was polyolefins (PE, PP, PS) and their derivatives.
1. Introduction
The Baltic Sea is a semi-closed shallow area of 374,000 km2 and is connected to the North Sea via two narrow straits, which means that the water exchange in the Baltic Sea is limited. This results in a steady increase in pollution in the Baltic Sea, as only 2–3% of pollutants can flow out through the North Sea [1]. The necessary water exchange time in the central Baltic is 25–30 years [2]. To understand the impact of anthropogenic pressures on the Baltic Sea, a reliable assessment of the presence of hazardous substances in the environment is necessary. There is a fundamental difference between the problems occurring in coastal areas, including harbour basins, and in the open sea. Several factors significantly influence the levels of contaminants in the Baltic Sea. The condition of the waters of the Baltic Sea is affected by human activities, and the sources of pollution are industrial and municipal wastes discharged directly into the sea or via rivers [3]. Due to the increasing production of synthetic polymers from year to year and their low susceptibility to biodegradation, plastic contamination has become a major environmental problem [4].
Currently, there is growing ecological awareness that plastics are a large group of marine litter. They are one of the most common types of marine waste, accounting for 60 to 80% of all the waste, and it is estimated to account for 90% of all the floating particles [5,6].
Small plastic particles are called microplastics (MPs) and are currently considered a significant component of pollution by plastic in the natural environment [7]. Various definitions of microplastics can be found in the literature, where both the upper and lower dimension limits of microplastics have been defined. Mini-microplastics are defined as plastic debris from 1 μm to 1 mm, and nanoplastics have dimensions smaller than 1 μm [8,9,10]. Some researchers define microplastics as barely perceptible particles which are sieved with a mesh size of 500 μm but are stopped by a 67 μm sieve [11]. Imohof and co-authors defined MPs as plastic particles smaller than 1 mm [12]. Currently, microplastic, as a new persistent environmental pollutant, is defined by most researchers as small plastic particles with the longest dimension being less than 5 mm [13,14].
The source of microplastics in the environment is dual in nature. Primary microplastics are defined as plastics that are included in cosmetic preparations, cleaning agents and household items, produced in millimetre or sub-millimetre sizes [15]. A change in the integrity of the plastic structure and its disintegration in the environment as a result of different kinds of degradation, such as biological, physical and chemical, leads to the formation of secondary microplastics [10,16]. Secondary microplastic is also generated during the exploitation of products such as tires, textiles or paints, with these processes occurring before plastics are released into the environment [17,18].
Microplastic pollution in marine waters comes from both terrestrial and marine sources. Microplastics might be transported by rivers, wind and surface runoff to marine ecosystems [19,20]. Sewage from wastewater treatment plants plays an important role in supplying MP, especially of primary origin, to the marine environment [10]. Shipping, fishing and other human activities in the Baltic Sea are also known as potential sources of plastic pollution. Physical fragmentation and weathering gradually break down plastic waste into smaller and smaller fragments that can remain in marine habitats for long periods [21]. Most plastics are resistant to environmental degradation. It must therefore be assumed that the number of MPs will increase [22].
The distribution of MPs depends on their physicochemical properties (e.g., composition, density and particle size) as well as on many other factors, such as water depth, surface force and bottom currents, seabed topography, wave action and source diversity. For example, in Belgian coastal waters, the concentration of microplastics in harbours was up to 50 times higher than those recorded in other similar research areas [23]. The reason may be low water flow, as microplastics accumulate where there are weak currents [24]. Plastics can easily float on the surface of seawater. Plastics with higher density are susceptible to suspension in the water column or can sink to the seabed [25]. The contamination of seas with microplastics is rapidly increasing, and particles are now found not only in the surface waters and animals but also in deep-sea sediments or the arctic ice and water [26,27,28,29,30]. Microplastics pose a serious threat to the natural environment, as well as to living resources. They are of concern because they can be ingested by various marine organisms and possibly transferred along the food web. The potential toxicity of microplastics is primarily due to the additives and monomers they include. Some studies conducted worldwide have aimed at determining the accumulation of microplastics in aquatic and terrestrial organisms [31,32].
Despite a large number of studies on MPs, there is no standard methodology for determining the number, distribution and assessment of their impact on the human body. As a result, the present knowledge base gives a non-uniform understanding of the extent of the microplastic range, fate and spatial distribution in the marine environment.
Recent studies on the presence of MPs in the marine environment have mainly focused on waters and sediments in the open sea, while relatively little information is available on MP contamination in the port area. Nevertheless, a significant plastic content in coastal sediments (especially plastic pellets and fibres) was detected near ports [33,34]. Due to the nature of their activities, seaports are a source of environmental pollution, especially water bodies and bottom sediments. Pollutants enter the aquatic environment via loading, dredging, ship traffic and run-off, sewage discharges and dust, etc. Maintenance dredging is a necessary activity to ensure the proper operation of ports and safe navigation. However, it results in a rise and mixture of bottom sediments contaminated by chemicals, including microplastics, with the water column [35]. Although it is not possible to state the exact figures concerning the introduction of plastics into the environment by migration from ports, it can be assumed that the amount will vary depending on such factors as the dynamics of work in the area of port waters and sediments, the intensity of shipping and the degree of industrialisation of the coast.
Each port is distinguished by specific natural and anthropogenic factors responsible for the level of water pollution and its specific pollution spectrum [36].
There is a large discrepancy between the amounts of microplastics expected to be found in the sea according to the calculations and the amounts actually detected. Our knowledge of the actual concentrations in the sea in the Polish coastal waters is still limited. The current study aims at making a valuable contribution to the existing limited knowledge by investigating whether microplastics are present in the waters of the Port of Gdynia. The main objectives of the study are to (i) verify the presence of MPs (0.3–5 mm in size) in the surface harbour waters; (ii) characterise in basic terms MPs separated from the waters (colour, form, average size, polymer type); (iii) assess whether there is any correlation between the site of the collection (sea- or land-influenced basins) and the type and quantity of MPs. These three challenges will be discussed further.
2. Materials and Methods
2.1. Study Area
The Port of Gdynia is located on the western coast of the Gulf of Gdansk and is considered to be one of the major international seaports. It has an area of 7.55 km2, and the length of the quayside is 17.7 km [37]. The external breakwater of the Port of Gdynia prevents water in the port from mixing with currents or high waves. The location of the docks in the port provides easy access for ships from the sea [38]. The port is involved in large-scale industrial and commercial activities, and its main sources of pollution come from the operation of the port and the city [37]. The different origins of pollutants mean that their concentration does not change at the same rate at the same time.
Distribution of chemicals in different parts of the port depends on whether a particular area is subject to the influence of the sea or it is strictly connected with the land and the anthropogenic influence. In previous studies, it has been stated that two zones responsible for the distribution of pollutants can be distinguished in the Port of Gdynia: the zone with a sea influence of significant water exchange (Basins: I–IV); and the internal basins with a greater impact of anthropogenic pollutants (Basins: V–VIII) [38,39]. Our investigations were conducted in selected port basins located in two different areas responsible for the pollutant distribution: the sea-influenced and the land-influenced zones.
2.2. Sampling of MPs on the Surface of Port Waters
Microplastics were collected from five harbour basins in the Port of Gdynia. The exact location of the selected basins (No. I, III, IV, V, VI) of the port is presented in Figure 1.
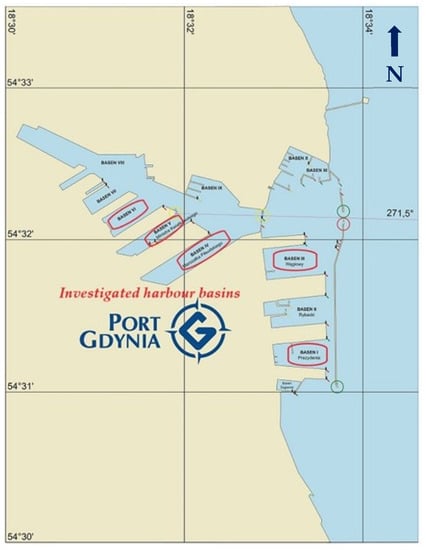
Figure 1.
Location of the five harbour basins in the Port of Gdynia (No. I, III, IV, V, VI). Map provided by the Port of Gdynia Authorities.
Due to their small size, the harbour basins are an area of limited manoeuvrability. Therefore, the equipment used for the collection of microplastics in oceanic, marine and inland waters (e.g., Neuston nets, Manta nets, AVANI trawl, Neuston DiSalvo nets) cannot be used in their area. Nets may have a rectangular or circular opening of different dimensions and a length typically of 1.5–8 m, although Bongo nets can be as long as 15 m [40,41,42,43]. Moreover, vessels should be small and manoeuvrable to allow the collection of samples from different zones of the pool waters.
To collect plastic particles floating on the surface seawater, a plankton net (mesh size 300 μm, HydroBios) with an inlet diameter of 25 cm and a length of 50 cm was used. The mesh size of the net determines the lower dimension limit of microplastics collected. For microplastic sampling in large tanks, especially from surface seawater or port canals, mesh sizes, such as 200, 330 and 350 μm, are recommended. In recent years, mesh sizes have been used as a standard sampling gear for microplastic surveys. As a result, the assessment of microplastics smaller than the mesh size is not present in scientific studies. However, when the mesh size of the net is too small (e.g., 10 μm), it is difficult to use because it easily clogs, mainly in port environments, where particles can be concentrated [41].
The plankton net was attached to the mobile unmanned research unit, HydroDron-1. HydroDron-1 and its equipment are presented in Figure 2. This unit is a mobile surface platform suitable for survey missions in restricted waters. Missions were carried out in the field of bathymetric, sonar, hydrological, oceanographic and other measurements, such as the collection of microplastics from the surface waters. The platform has the ability to carry out work in autonomous mode or in remote-control mode, which is particularly useful in difficult navigational situations or in areas that are inaccessible for larger manned vessels.
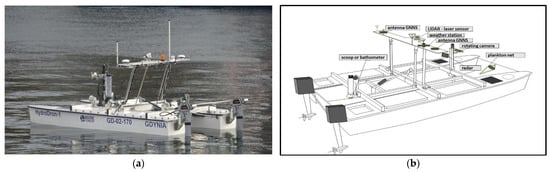
Figure 2.
Mobile unmanned research unit HydroDron-1: (a) illustration; (b) scheme of construction and equipment, based on [44].
HydroDron-1 travelled in the central part of selected port basins shown in Figure 1. The plankton net was pulled at a 2 m distance (behind the vessel) from the stern of HydroDron-1 at a speed of approximately 2 knots. The net inlet was submerged below the water surface, and samples were taken horizontally. During the investigations conducted in the seasons of sampling of microplastics by HydroDron-1, the Beaufort wind force scale was 1–2, and the sea state scale was 0–1 (sea state calm or completely calm). It is known that weather conditions, such as wind, wave and the season, have an influence on the degree of vertical mixing of the seawater surface layer and the amount of affected microplastics which is collected. When the wave height is under 0.5 m and the Beaufort wind force scale is under 3, the collection of plastic particles can be conducted [40].
Table 1 shows the length of the route taken by the unmanned platform which towed the plankton net in the selected basins in the four seasons of the year.

Table 1.
Route length of HydroDron-1 in selected basins in each season.
During the entire research period, the boat with the plankton net sailed a total of 92 km, and 4509 m3 of water from the Port of Gdynia basins was analysed for the presence of microplastics. The volume of water filtered via the plankton net was calculated by multiplying the transect distance by the area of the submerged hole (0.049 m2) of the net. The volumes of individual samples ranged from 89 m3 to 471 m3. The volume of the filtered water in each port basin varied due to the distance travelled by HydroDron-1, which depended on the period when the port basin was available for study.
During the sample collection, nets were transported in stainless steel sealable containers to the research vessel to avoid contamination. Samples were handled by personnel wearing cotton clothing and latex gloves. After the collection, the nets were enclosed and stored again in sealable containers prior to analysis. To minimise contamination from the laboratory, the samples were covered wherever possible, glassware was used in place of plastic where it was possible, and all the reusable equipment was cleaned thoroughly with ethanol and rinsed with distilled water prior to use.
One blank sample was taken. The blank sample was collected in the field without being exposed to port water. It was taken to measure the atmospheric deposition at the port basins. The field control consisted of an empty, pre-rinsed collecting jar opened during the sample transfer. The blank sample allowed the researchers to see how clean their sampling and the analysis process were. It was also used to account for the procedural contamination from the sampling or any processing performed on the sample before the analysis.
2.3. Separation of MPs Particles Collected from the Port Waters
The methodology for separating microplastics from the port waters and their analysis was based on the procedures recommended for quantifying synthetic particles in waters [45,46,47]. The separation of microplastics collected from the surface seawater consisted of several main steps: drying; extraction; wet peroxide oxidation; density separation; filtration; and visual sorting.
After collecting the solid materials on the surface seawater of the investigated harbour basins, the contents of the net were washed through stainless steel screens (Retsch, mesh size 5 and 0.3 mm). Shells, plants, and living organisms larger than 5 mm were flushed and removed.
First, the collected solid material was dried to determine the solids mass in the sample. After drying, the organic matter was digested. Different types of sample digestion (oxidative, acidic, alkaline and enzymatic) can be carried out to separate microplastics from biological matter [41,48]. In this study, digestion was carried out using 30% hydrogen peroxide in the presence of a Fe(II) catalyst (0.05 M solution) to digest labile organic matter. It was repeated until no natural organic material was visible. The plastic debris remained unaltered. In the next step, sodium chloride NaCl was added to the mixture to increase the density of the aqueous solution (density of about 1.2 g/cm3). Sodium chloride solutions are most commonly used to make the solution thicker and separate plastics by flotation [41,45,49].
The resulting mixture was transferred to a glass density separator to isolate the plastic debris through flotation. The plastic particles with a lower specific gravity than the solvent floated on the surface. All floating plastic debris was collected in a density separator and separated using a vacuum filtration system (WaterVac 100-MB, Rocker Scientific, Taiwan) with a 0.3 mm nylon filter. A gridded nylon filter with clearly defined grid lines facilitated microplastic quantification. Other types of filters, e.g., polycarbonate, polyamide glass fibre, mixed cellulose ester and Anodisc, can also be used at this stage of microplastic separation [41]. The density separator was rinsed several times with distilled water to transfer all solids to the filtration set. In the final phase of the filtration procedure, filters were rinsed with distilled water to avoid the formation of salt crystals on the dry filters. The filters with solids were moved to glass Petri dishes and covered with aluminium foil. They were allowed to dry at room temperature. Dried filters were weighed to determine the microplastic mass [10]. Simultaneously, density separation of the microplastics collected in the blank sample was also conducted.
2.4. Identification of Collected MPs
Different methods are used to determine the type of microplastic. For example, some studies mainly use visual microplastic identification methods to differentiate synthetic polymers from organic particles [50] or image analysis of stained particles [51]. More recently, the Fourier transform infrared (FTIR) spectroscopy [52] or the Raman spectroscopy have been used in research [53].
The plastic particles collected in five investigated harbour basins were identified using microscopic and spectroscopy methods.
- The macro- and microscopic observations—the plastic particles were observed at a macro and micro scale. Macroscopic observations of the collected plastics were analysed using a FujiFilm S2500 HD camera, whereas microscopic observations of plastics were analysed with a metallographic microscope ALPHAPHOT-2YS2-H Nikon (Polish Optical Companies, Warsaw, Poland), linked to a photo camera Delta Optical DLT-Cam PRO 6.3MP USB 3.0. (Delta Optical, Gdansk, Poland). The micrographs were collected under reflected light.
- Chemical identification—the Attenuated Total Reflectance–Fourier Transform Infrared spectroscopy (ATR-FTIR) and OMNIC software were used to identify the collected plastic particles. FTIR spectra were recorded with an attenuated total reflection (ATR Smart Orbit Accessory, ThermoFisher Scientific, Madison, WI, USA) mode on a Nicolet 380 FTIR spectrometer (Thermo Scientific, Madison, WI, USA) with a diamond cell. The particles were manually fixed to the diamond crystal and scanned with a resolution of 4 cm−1 and an IR range of 4000 to 600 cm−1, and 32 scans were taken for each measurement. Due to size limitations, when using the ATR-FTIR, only particles above 500 μm could be analysed [54]. The acquired spectra were automatically compared to the reference spectra in 20 spectral libraries, with more than 11,300 spectra that consisted of both synthetic and natural materials and compounds. According to the plastic particle identification procedure, if the compatibility polymer type was higher than 60%, the match was considered as credible, but if it was lower, the compatibility was critically evaluated [55,56,57].
3. Results and Discussion
Compared to marine or inland waters, the surface waters of port basins are characterised by relatively low colonisation by plant and animal organisms. However, flotation particles from port handling operations can occur in these waters. In this study, samples collected using a plankton net were characterised by the relatively low organic matter content and plant particles were dominating.
It is assumed that the most suitable means for removing plant material is the Fenton reaction, using a mixture of hydrogen peroxide with an iron catalyst. Potassium hydroxide digestion should be used for significant amounts of animal tissue [58].
In most solid particles collected in this study, wet peroxide oxidation successfully decomposed the organic matter—only samples collected in port basin No. IV (located near the Baltic Grain Terminal) were characterised by a significant content of seeds with hard shells. These particles, containing a significant amount of fibre, turned out to be not susceptible to digestion processes. Therefore, they were manually removed, after the filtration step, using tweezers. Due to the presence of atypical contaminants in the tested samples, probably connected with the handling of cargoes, it will be necessary to develop a more effective method than the Fenton reaction for the digestion of the matter collected, including microplastics.
Table 2 presents the concentration of plastic particles collected by the plankton net (mesh size 300 μm) and filtered water volume for each investigated basin during the different seasons.
Table 2.
Seasonal microplastic abundances in the port basins.
Based on tows conducted in the five basins of the Port of Gdynia, in total, a microplastic concentration of 0.28 mg/m3 was identified in Basin No. I, 0.082 mg/m3 in Basin No. III, 0.524 mg/m3 in Basin No. IV, 0.44 mg/m3 in Basin No. V and 0.41 mg/m3 in Basin No. VI. Lower concentration of MPs in Basin No. I and III can be connected with the location of these harbour basins (sea-influenced zone, Figure 1). No microplastics between 0.3 and 5 mm were found in the blank sample.
It is known that urbanised water bodies, with large amounts of anthropological activities such as ports, are more polluted and can be a source of microplastic migration to the marine environment. A significant increase in microplastics in the port waters is influenced by factors related to human activities on land, including rivers that have an outlet in the vicinity of seaports [39,59]. Studies on the surface waters of the industrial port of Malmö also showed a significant influence of anthropological factors on their contamination with microplastics. It was assumed that most of the plastic particles came from the stormwater discharged into the port waters [60]. In view of the above, in the conducted studies, it was expected that the waters of the land-influenced basins of the Port of Gdynia, which are more exposed to anthropogenic factors than the sea-influenced basins, would contain higher amounts of MPs. Such a distribution of pollutants was obtained during the study on the concentration of organic compounds in these basins [39]. However, the results of our study showed no such relationship. For example, in Basin No. IV, which is open to water exchange with the waters of the Gulf of Gdansk, similar values of microplastic concentrations were obtained as in Basin No. VI, which is land-influenced in nature. The least polluted with plastic particles was Basin No. III, although its hydrographic conditions are similar to those in Basin No. I. There was also no clear relationship between the presence of MPs in the port waters and the season. Such a relationship was observed in the Port of Gdynia with regard to the distribution of organic pollutants concentrations. A decrease in the amounts of these pollutants occurred in summer and was associated with an increase in microbial activity and biodegradation processes [38,39]. Plastic particles undergo very slow environmental degradation [61]; therefore, the seasons do not affect their occurrence in port waters. Taking into account the results obtained and presented in Table 2, it can be assumed, hypothetically, that the presence of MPs in the basins of the Port of Gdynia is more influenced by the intensity of transshipment in the port basins than by the anthropological factors from the land.
Although many studies have been conducted on microplastics found in sediments and water in the marine environment, the available information in terms of the sources, detection, and amount of microplastics in ports is limited. Studies on microplastics in ports showed a varied range between the concentrations in sediments and surface waters. For example, monitoring of meso- and microplastics in the Port of Durban indicates that there is a higher amount of microplastics in sediments than in waters [54].
A comparison of the results obtained in the Port of Gdynia and the results of the previous studies in other ports is difficult due to differences in sampling methods, analytical procedures, and especially in reporting units. The global comparison of our study (Table 2) suggested a lower abundance of MPs in the surface waters of the Port of Gdynia compared to MP concentrations in other locations, such as the Port of Durban (South Africa) [54], Suva Harbour (Fiji) [62], Göteborg Harbour (Sweden) [60], Turku Harbour (Finland) [63], the Port of Melbourne Australia [64], and the Swedish west coast industrial Harbour of Stenungsund (Sweden) [65]. Given that the Port of Durban and Suva Harbour are connected to ocean waters, their microplastic pollution may be higher. Thus, the location of the Port of Gdynia can be seen as an advantage. The closed nature of the Baltic prevents the inflow of migrating microplastic particles from the oceans.
Taking into consideration different sources of information, it was found that the current monitoring of waters in port areas is not sufficient. A quantitative comparison of MPs found in marine waters is problematic due to different analysis procedures and measurement units [41,66,67]. Different mesh sizes and filter pores used for filtering the solutions also cause uncertainties in the comparison process. That is why one of the most significant problems in microplastic pollution assessment in the marine environment is a lack of standardised procedures for sample collection, preparation and microplastic identification. The elaboration of those standardised procedures is vital for microplastic concentration assessment and data comparison between different studies [41,67].
Our results suggested that the 300 μm nets commonly used for microplastic sampling underestimate microplastic abundance, particularly for nets smaller than 0.3 mm. Whenever possible, sampling should aim at collecting the fullest range possible of microplastics present. However, it is equally important that sampling maintains a balance in efficiency, accuracy and detail. Some researchers carefully determined differences in detailed microplastic distributions of surface fresh and seawaters collected using smaller mesh size nets [56,57,68].
In our study, mesh selectivity was probably a major factor in low concentration because microplastic particles smaller than the mesh size (300 μm) were not collected. In many ports (such as Port Durban, Port Suva, Port Gothenburg, Port of Melbourne and Stenungsund Industrial Port), nets with a mesh size of 20–200 μm were used to extract microplastics from surface waters [54,60,62,64]. Only at the Port of Turku was a plankton net with a mesh size of 300 μm used for analyses [63].
The density of plastic particles is a key factor in their vertical distribution in the water. Microplastics with a density higher than 1.025 g/cm3 are susceptible to sinking [14,69]. In this study, plastic particles were isolated by density separation in sodium chloride (density 1.2 g/cm3). Table 3 presents selected common polymers which may have density ranges similar to those on surface seawaters.
Table 3.
Densities of selected microplastics commonly used for density separation, own elaboration based on [8,54].
As Table 3 shows, only a few plastics have a specific gravity lower than seawater. Furthermore, plastics in products are mixed with fillers and other additives that can change their specific gravity. Heavier varieties of plastics, such as polyamides, polyesters, etc., tend to sink or settle in bottom sediments. Therefore, the assessment of the presence of MPs in the basins of the Port of Gdynia should also include the bottom zone, which will be the next stage of the research.
Techniques for identifying microplastics can be divided into analytical and visual techniques. Visual identification enables the identification and classification of microplastics with the naked eye or using a microscope. In the case of analytical techniques, various types of laboratory equipment are used, which are common in analytical chemistry. Visual and analytical techniques make it possible to identify the nature and type of polymer. In this study, the identification of the collected plastic particles was carried out using both visual and analytical techniques.
3.1. Macro- and Microscopic Observations of MPs
According to the microplastic analytical procedure, particles separated from the surface port waters were first visually categorised by colour and shape.
Colour is used as one of the determinants to identify the source of plastic particles. Different coloured plastics are used in many applications, such as packaging and clothing materials or ropes. On the one hand, the colour identification of plastic particles can be difficult because microplastics lose their original colour. The cause of the colour change is the conditions in the aquatic environment to which the plastics have been exposed (e.g., biofilm development, weathering). On the other hand, colour identification by people is very subjective and can be hampered by visual defects [9,40,69]. Black, white, transparent, red, blue, green, multicolour and others are the most common colours of plastic particles. Multicolour means that microplastic particles have two different colours, usually one on one side and the other on the other (e.g., rope or filaments might contain more than one colour). Purple, grey, yellow, pink or brown are defined as other colours [9].
The microplastics obtained in the Port of Gdynia were often colourless, in the form of transparent films. Colours such as black, white, yellow, blue and green were also detected. The difference between transparent and white is opacity. Transparent is translucent, while white is opaque. The predominant colours were black, white and transparent.
In terms of shape, the classification of microplastics included four groups: fragments, films, fibres and spheres [69]. It is known that non-spherical microplastics’ toxicity (i.e., fragments and fibres) is higher than that of spherical microplastics [70]. Microplastic fragments are defined as irregularly shaped hard particles that appear to have been broken down from a larger piece of litter; films as thin, flat, flexible plastic particles with smooth or angular edges; fibres as thin elongated particles with one dimension much larger; and spheres as spherical plastic [8].
Macrographs of small pieces of synthetic plastics (the order of size from 0.3 to 5 mm) collected in the port waters are presented in Figure 3.
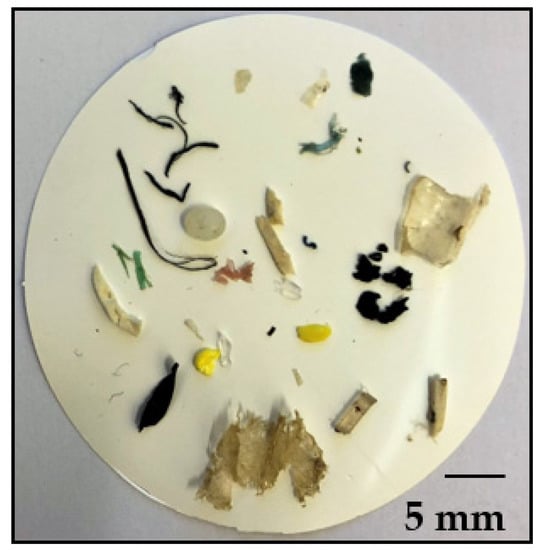
Figure 3.
Macrograph of all MP types collected in five basins of the Port of Gdynia.
Figure 3 illustrates four categories of microplastics commonly identified in visual identification: films; fragments; fibres; spheres. The detection of spheres, films, fibre, and fragments may represent anthropogenic sources of plastic waste from cargo loss, sewage, commercial activities, and the surrounding human settlements. All the above plastic particles were found in the investigated basins of the Port of Gdynia. Fragments and fibres were the prevalent, categorised particle shape. Fibres and fragments were also the predominant type of microplastics in Suva Harbour [62].
Transparent films were often found in the Port of Gdynia. A spherical shape was seen only once.
A high fibre concentration and a significant amount of black carbon particles, as seen in the Baltic Sea waters, have also been observed in the Helsinki area archipelago. The particles of black carbon found in this region are probably a result of intense traffic and the combustion of fossil fuels. The anthropogenic oil-based particles have a specific shiny blue-black appearance, which distinguishes them from other dark particles [71]. In order to properly assess this criterion, other techniques should be used in addition to visual identification.
Figure 4 presents the structure of the surface categorised by size and shape. The microscopic observations confirm macroscopic observations. The micrographs below illustrate the different types of microplastics that can be found in the investigated harbour basins.
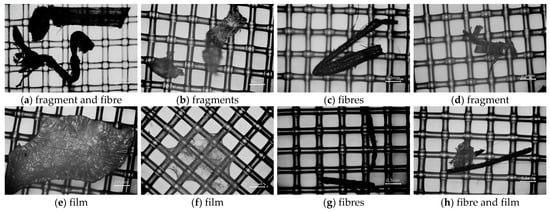
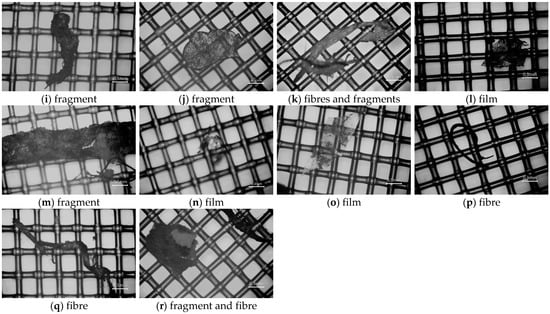
Figure 4.
Sampling micrographs of different MPs collected in port waters: Basin No. I (a–d); Basin No. III (e–h); Basin No. V (i–l); Basin No. VI (m–p); Basin No. IV (q) and collected in different seasons: winter (a,e,i,m,q); spring (b,f,j,n); summer (c,g,k,o,r); autumn (d,h,l,p).
3.2. Spectroscopic Identification of MPs
A total number of 40 particles above 500 μm in size was collected from the port water samples for polymer identification. Thanks to the applied analytical technique ATR-FTIR, it was possible to obtain a spectrum associated with each particle analysed. To determine what polymer the particles were made of, each spectrum was compared to the reference (to more than 11,300 spectra collected in the library). This technique allowed for unambiguous determination of whether particles are made of plastic. The results of the identification of selected plastic samples that have a match higher than 60% are presented in Table 4.
Table 4.
Identification of MPs collected in different harbour basins. The symbol (*) means not identified polymer because of matching below 60%.
Analysing the results presented in Table 4, we can state that regardless of the season, the predominant identified plastic particles presented in the surface port waters were polyolefins and their derivatives. In our study, the most commonly identified types of polymers were PE and PP. The identification of these two polymers is relatively consistent with the polymer usually seen in the marine environment, with the most commonly detected polymers in the surface waters being PS, PE, and PP [72,73]. The main prevalent polymers found in the surface waters from the Port of Durban contained PE, PET, PS and PE, PP from Suva Harbour [54,62].
It is important to know as many details as possible about the polymer composition because depending on its density, surface chemistry, degree of crystallinity and the presence of chemical additives and plasticisers, it can affect the ecosystem in different ways.
The obtained results are in good agreement with those in other microplastic reports of surface seawaters and they show a gradient distribution of plastic particles in the water tone. The low-density polymers can easily stay on the surface, and their presence decreases with depth. In contrast, high-density polymers dominate in the bottom areas and sediments [74,75]. Nevertheless, important factors influencing the presence of low-density plastics in marine bottom sediments are biofouling, aggregation with organic matter, and subsequent sedimentation [4].
4. Conclusions
In order to control the influence of human activities on the marine environment, the input from industry, shipping and rivers should be monitored directly. The condition of the Baltic Sea needs to be assessed so that all the measures can be taken as soon as possible to significantly reduce the harmful impact of microplastics. It is necessary to focus on monitoring both the waters of the Port of Gdynia and other ports, taking into account the significant amount of plastic that ends up in the natural environment. Relatively little data are collected in terms of recognising the contamination of port basins at present. There is also a lack of information as to what extent port waters, the pollution status of which can be relatively easily and regularly monitored, are a contamination indicator of the surrounding coastal waters.
This study provided preliminary data on the presence of microplastics in the surface waters of the Port of Gdynia area. The results of the surveys indicated relatively low pollution of the surface waters of the Port of Gdynia with microplastics of 0.3–5 mm in size. Regardless of the season, the predominant plastic particles present in the port waters were transparent, white and black polyolefins and their derivatives. The most common shapes of the collected plastics were fragments and fibres. No correlation was found between the location of the harbour basins and the number of microplastics in the water.
This is essential in times of growing interest in the state of the natural environment, particularly if the seawater ecosystems are to be monitored, preserved and managed in a sustainable manner for the benefit of contemporary societies as well as future generations.
Author Contributions
Conceptualization, A.D., K.K. and M.P.; methodology, A.D., K.K. and M.P.; investigation, A.D., K.K. and M.P.; writing—original draft, A.D., K.K. and M.P.; writing—review and editing, A.D., K.K. and M.P. All authors have read and agreed to the published version of the manuscript.
Funding
The article presents results developed in the scope of the project “Marine port surveillance and observation system using mobile unmanned research units” (grant no. NOR/POLNOR/MPSS/0037/2019-00), as well as supported by research project “Monitoring and analysis of the impact of selected substances and materials in terms of environmental protection”, supported by the Gdynia Maritime University (project grant no. WZNJ/2023/PZ/10).
Institutional Review Board Statement
Not applicable.
Informed Consent Statement
Not applicable.
Data Availability Statement
Data sharing is not applicable.
Conflicts of Interest
The authors declare no conflict of interest.
References
- Lang, S.C.; Mayer, P.; Hurtsthouse, A.; Kötke, D.; Hand, I.; Schulz-Bull, D.; Witt, G. Assessing PCB pollution in the Baltic Sea—An equilibrium partitioning based study. Chemosphere 2018, 191, 886–894. [Google Scholar] [CrossRef] [PubMed]
- Gallasi, S.; Bettinetti, R.; Neri, M.C.; Jeonnot, R.; Dagnac, T.; Bristeau, S.; Sakkas, V.; Albanis, T.; Boti, V.; Valsamaki, T.; et al. A multispecies approach for monitoring persistent toxic substances in the Gulf of Gdańsk (Baltic Sea). Ecotoxicol. Environ. Saf. 2008, 68, 39–48. [Google Scholar] [CrossRef] [PubMed]
- Buszewski, B.; Buszewska, T.; Chmarzyński, A.; Kowalkowski, T.; Kowalska, J.; Kosobucki, P.; Zbytniewski, R.; Namieśnik, J.; Kot-Wasik, A.; Pacyna, J.; et al. The present condition of the Vistula river catchment area and its impact on the Baltic Sea coastal zone. Reg. Environ. Chang. 2005, 5, 97–110. [Google Scholar] [CrossRef]
- Graca, B.; Szewc, K.; Zakrzewska, D.; Dołega, A.; Szczerbowska-Boruchowska, M. Surface and fate of microplastics in the marine and beach sediments of the Southern Baltic Sea—A preliminary study. Environ. Sci. Pollut. Res. 2017, 24, 7650–7661. [Google Scholar] [CrossRef] [PubMed]
- Setälä, O.; Fleming-Lehtinen, V.; Lehtiniemi, M. Ingestion and transfer of microplastics in the planktonic food web. Environ. Pollut. 2014, 185, 77–83. [Google Scholar] [CrossRef] [PubMed]
- de Lucia, G.A.; Caliani, I.; Marra, S.; Camedda, A.; Coppa, S.; Alcaro, L.; Campani, T.; Giannetti, M.; Coppola, D.; Cicero, A.M.; et al. Amount and distribution of neustonic micro-plastic off the western Sardinian coast (Central-Western Mediterranean Sea). Mar. Environ. Res. 2014, 100, 10–16. [Google Scholar] [CrossRef]
- Beer, S.; Garm, A.; Huwer, B.; Dierking, J.; Nielsen, T.G. No increase in marine microplastic concentration over the last three decades—A case study from Baltic Sea. Sci. Total Environ. 2018, 621, 1272–1279. [Google Scholar] [CrossRef]
- Crawford, C.B.; Quinn, B. Microplastic Pollutants; Elsevier: Amsterdam, The Netherlands, 2016. [Google Scholar]
- Frias, J.P.G.L.; Nash, R. Microplastics: Finding a consensus on the definition. Mar. Pollut. Bull. 2019, 138, 145–147. [Google Scholar] [CrossRef]
- Krasowska, K.; Dereszewska, A.; Popek, M. Preliminary Approach to Ecological Risk Assessment of Microplastics in Selected Coastal Regions of Baltic Sea. In Safety and Reliability of Systems and Processes, Summer Safety and Reliability Seminar; Kołowrocki, K., Bogalecka, M., Dabrowska, E., Magryta-Mut, B., Eds.; Gdynia Maritime University: Gdynia, Poland, 2022; pp. 133–142. [Google Scholar] [CrossRef]
- Gregory, D.A.; Andrady, A.L. Plastic in the Marine Environment; Andrady, A.L., Ed.; Wiley & Sons: Hoboken, NJ, USA; pp. 379–401. [CrossRef]
- Imhof, H.K.; Ivleva, N.P.; Schmid, J.; Niessner, R.; Laforsch, C. Contamination of beach sediments of subalpine lake with microplastics debris. Curr. Biol. 2013, 23, 867–868. [Google Scholar] [CrossRef]
- Yu, Y.; Zhou, D.; Li, Z.; Zhu, C. Advancement and challenges of microplastic pollution in the aquatic environment: A review. Water Air. Soil Pollut. 2018, 229, 140. [Google Scholar] [CrossRef]
- Ogunola, S.O.; Palanisami, T. Microplastics in the marine environment: Current status, assessment methodologies, impacts and solutions. J. Pollut. Eff. Cont. 2016, 4, 2. [Google Scholar] [CrossRef]
- da Costa, J.P.; Duarte, A.C.; Rocha-Santos, T.A.P. Microplastics—Occurrence, Fate and Behaviour in the Environment. In Comprehensive Analytical Chemistry; Elsevier: Amsterdam, The Netherlands, 2017; Volume 75, pp. 1–24. [Google Scholar] [CrossRef]
- Efimova, I.; Bagaeva, M.; Bagaev, A.; Kileso, A.; Chubarenko, I.P. Secondary microplastics generation in the sea swash zone with coarse bottom sediments: Laboratory experiments. Front. Mar. Sci. 2018, 5, 313. [Google Scholar] [CrossRef]
- Browne, M.A.; Crump, P.J.; Niven, S.J.; Teuten, E.; Tonkin, A.; Galloway, T.; Thompson, R. Accumulation of microplastic on shorelines woldwide: Sources and sinks. Environ. Sci. Technol. 2011, 45, 9175–9179. [Google Scholar] [CrossRef] [PubMed]
- GESAMP. Sources, Fate and Effects of Microplastics in the Marine Environment: A Global Assessment; Joint Group of Experts on the Scientific Aspects of Marine Environmental Protection: London, UK, 2015. [Google Scholar]
- Li, J.; Liu, H.; Paul Chen, J. Microplastics in freshwater systems: A review on occurrence, environmental effects, and methods for microplastics detection. Water Res. 2018, 137, 362–374. [Google Scholar] [CrossRef]
- Wrighta, S.L.; Ulkea, J.; Fonta, A.; Chanc, K.L.A.; Kellya, F.J. Atmospheric microplastic deposition in an urban environment and an evaluation of transport. Environ. Int. 2020, 136, 105411. [Google Scholar] [CrossRef]
- Lentonen, K.; Sundelin, B.; Lang, T.; Strand, J. Development of tools for integrated monitoring and assessment of hazardous substances and their effects in the Baltic Sea. Ambio 2014, 43, 69–81. [Google Scholar] [CrossRef]
- Rogowska, W.; Skorbiłowicz, E.; Skorbiłowicz, M.; Trybułowski, L. Microplastic in costal sediments of Ełckie Lake (Poland). Stud. Quat. 2012, 28, 109–116. [Google Scholar] [CrossRef]
- Claessens, M.; De Meester, S.; Van Landuyt, L.; De Clerck, K.; Janssen, C.R. Occurrence and distribution of microplastics in marine sediments along the Belgian coast. Mar. Pollut Bull. 2011, 62, 2199–2204. [Google Scholar] [CrossRef]
- Vianello, A.; Boldrin, A.; Guerriero, P.; Moschino, V.; Rella, R.; Sturaro, A.; Da Ros, L. Microplastic particles in sediments of Lagoon of Venice, Italy: First observations on occurrence, spatial patterns and identification. Estuar. Coast. Shelf Sci. 2013, 130, 54–61. [Google Scholar] [CrossRef]
- Andrady, A.M. Microplastic in the environment. Mar. Pollut. Bull. 2011, 62, 1596–1605. [Google Scholar] [CrossRef]
- Eriksen, M.; Maximenko, N.; Thiel, M.; Cummins, A.; Lattin, G.; Wilson, S.; Hafner, J.; Zellers, A.; Rifman, S. Plastic pollution in the South Pacific subtropical gyre. Mar. Pollut. Bull. 2013, 68, 71–76. [Google Scholar] [CrossRef] [PubMed]
- Chubarenko, I.; Stepanowa, N. Microplastic in sea coastal zone: Lessons learned from the Baltic amber. Environ. Pollut. 2017, 224, 243–254. [Google Scholar] [CrossRef] [PubMed]
- Eerkes-Medrano, D.; Thompson, R.C.; Aldridge, D.C. Microplastics in freshwater systems: A review of the emerging threats, identification of knowledge gaps and prioritisation of research needs. Water Res. 2015, 75, 63–82. [Google Scholar] [CrossRef] [PubMed]
- Wang, J.; Tan, Z.; Peng, J.; Qiu, Q.; Li, M. The behaviours of microplastics in the marine environment. Marin. Environ. Res. 2016, 113, 7–17. [Google Scholar] [CrossRef] [PubMed]
- Zobkov, M.; Esiukova, E. Microplastics in Baltic bottom sediments: Quantification procedures and first results. Mar. Pollut. Bull. 2017, 114, 724–732. [Google Scholar] [CrossRef]
- Tympa, L.-E.; Katsara, K.; Moschou, P.N.; Kenanakis, G.; Papadakis, V.M. Do Microplastics Enter Our Food Chain via Root Vegetables? A Raman Based Spectroscopic Study on Raphanus sativus. Materials 2021, 14, 2329. [Google Scholar] [CrossRef]
- Atamanalp, M.; Köktürk, M.; Uçar, A.; Duyar, H.A.; Özdemir, S.; Parlak, V.; Esenbuğa, N.; Alak, G. Microplastics in Tissues (Brain, Gill, Muscle and Gastrointestinal) of Mullus barbatus and Alosa immaculate. Arch. Environ. Contam. Toxicol. 2021, 81, 460–469. [Google Scholar] [CrossRef]
- UNEP. Marine Plastic Debris and Microplastics. Global Lessons and Research to Inspire Action and Guide Policy Change. 2016. Available online: https://ec.europa.eu/environment/marine/good-environmental-status/descriptor-10/pdf/Marine_plastic_debris_and_microplastic_technical_report_advance_copy.pdf (accessed on 12 December 2022).
- Browne, M.A.; Galloway, T.S.; Thompson, R.C. Spatial patterns of plastic debris along Estuarine shorelines. Environ. Sci. Technol. 2010, 44, 3404–3409. [Google Scholar] [CrossRef]
- Guerra-Garcia, J.M.; Garcia-Gomez, J.C. Assessing pollution levels in sediments of a harbour with two opposing entrances. Environmental implications. J. Environ. Manag. 2005, 77, 1–11. [Google Scholar] [CrossRef]
- Stakeniene, R.; Galkus, A.; Joksas, K. Pollution of Klaipeda Port Waters. Pol. J. Environ. Stud. 2011, 20, 445–459. [Google Scholar]
- Filipkowska, A.; Kowalewska, G.; Pavoni, B.; Łączyński, L. Organotin compounds in surface sediments from seaports on the Gulf of Gdańsk (southern Baltic coast). Environ. Monit. Assess. 2011, 182, 455–466. [Google Scholar] [CrossRef] [PubMed]
- Radke, B.; Wasik, A.; Jewell, L.; Pączek, U.; Gałuszka, A.; Namieśnik, J. The seasonal changes of organotin compounds in water and sediments samples collected from the area of Port of Gdynia. Sci. Total Environ. 2012, 441, 57–66. [Google Scholar] [CrossRef] [PubMed]
- Radke, B.; Piketh, S.; Wasik, A.; Namieśnik, J.; Dembska, G.; Bolałek, J. Aspects of pollution in Gdansk and Gdynia harbours at the coastal zone of the South Baltic Sea. TransNav 2013, 7, 11–19. [Google Scholar] [CrossRef]
- GESAMP. Guidelines for the Monitoring & Assessment of Plastic Litter in the Ocean; Report and Studies No. 99; Joint Group of Experts on the Scientific Aspects of Marine Environmental Protection: London, UK, 2019. [Google Scholar]
- Cutroneo, L.; Reboa, A.; Besio, G.; Borgogno, F.; Canesi, L.; Canuto, S.; Dara, M.; Enrile, F.; Forioso, I.; Greco, G.; et al. Microplastics in seawater: Sampling strategies, laboratory methodologies, and identification techniques applied to port environment. Environ. Sci. Pollut. Res. 2020, 27, 8938–8952. [Google Scholar] [CrossRef]
- Eriksen, M.; Liboiron, M.; Kiessling, T.; Charron, L.; Alling, A.; Lebreton, L.; Richards, H.; Roth, B.; Ory, N.C.; Hidalgo-Ruz, V.; et al. Microplastic sampling with the AVANI trawl compared to two neuston trawls in the Bay of Bengal and South Pacific. Mar. Pollut. Bull. 2018, 232, 430–439. [Google Scholar] [CrossRef] [PubMed]
- Green, D.S.; Kregting, L.; Boots, B.; Blockley, D.J.; Brickle, P.; da Costa, M.; Crowley, Q. A comparison of sampling methods for seawater microplastics and a first report of the microplastic litter in coastal waters of Ascension and Falkland Islands. Mar. Pollut. Bull. 2018, 137, 695–701. [Google Scholar] [CrossRef]
- Marine Technology Ltd. Available online: https://marinetechnology.pl/ (accessed on 22 November 2022).
- Prata, J.C.; da Costa, J.P.; Duarte, A.C.; Rocha-Santos, T. Methods for sampling and detection of microplastics in water and sediment: A critical review. Trends Analyt. Chem. 2019, 110, 150–159. [Google Scholar] [CrossRef]
- MSFD. Technical Subgroup on Marine Litter, Guidance on Monitoring of Marine Litter in European Seas. A Guidance Document within the Common Implementation Strategy for the Marine Strategy Framework Directive; European Commission: Brussels, Belgium, 2013. [Google Scholar]
- Masura, J.; Baker, J.; Foster, G.; Arthur, C. Laboratory Methods for the Analysis of Microplastics in the Marine Environment: Recommendations for Quantifying Synthetic Particles in Waters and Sediments; NOAA Marine Debris Division: Silver Spring, MD, USA, 2015; Volume 48. [Google Scholar] [CrossRef]
- Miller, M.E.; Kroon, F.J.; Motti, C.A. Recovering microplastics from marine samples: A review of current practices. Mar. Pollut. Bull. 2017, 123, 6–18. [Google Scholar] [CrossRef]
- Galgani, F.; Hanke, G.; Werner, S.; Oosterbaan, L.; Nilsson, P.; Fleet, D.; Kinsey, S.; Thompson, R.; Palatinus, A.; Van Franeker, J.A.; et al. Guidance on Monitoring of Marine Litter in European Seas; Report EUR 26113 EN; Joint Research Centre, Institute for Environment and Sustainability: Brussels, Belgium, 2013. [Google Scholar]
- Setälä, O.; Magnusson, K.; Lehtiniemi, M.; Nor´en, F. Distribution and abundance of surface water microliter in the Baltic Sea: A comparison of two sampling methods. Mar. Pollut. Bull. 2016, 110, 177–183. [Google Scholar] [CrossRef]
- Tamminga, M.; Hengstmann, E.; Fischer, E.K. Microplastic analysis in the South Funen archipelago, Baltic Sea, implementing manta trawling and bulk sampling. Mar. Pollut. Bull. 2018, 128, 601–608. [Google Scholar] [CrossRef]
- Gewert, B.; Ogonowski, M.; Bart, A.; Mac Leod, M. Abundance and composition of near surface microplastics and plastic debris in the Stockholm Archipelago, Baltic Sea. Mar. Pollut. Bull. 2017, 120, 292–302. [Google Scholar] [CrossRef] [PubMed]
- Sekudewicz, I.; Dąbrowska, A.M.; Syczewski, M.D. Microplastic pollution in surface water and sediments in the urban section of the Vistula River (Poland). Sci. Total Environ. 2021, 762, 143111. [Google Scholar] [CrossRef] [PubMed]
- Preston-Whyte, F.; Silburn, B.; Meakins, B.; Bakir, A.; Pillay, K.; Worship, M.; Paruk, S.; Mdazuka, Y.; Mooi, G.; Harmer, R.; et al. Meso- and microplastics monitoring in harbour environments: A case study for the Port of Durban, South Africa. Mar. Pollut. Bull. 2021, 163, 111948. [Google Scholar] [CrossRef] [PubMed]
- Aigars, J.; Barone, M.; Suhareva, N.; Putna-Nimane, I.; Dimante-Deimantovica, I. Occurrence and spatial distribution of microplastics in the surface waters of the Baltic Sea and the Gulf of Riga. Mar. Pollut. Bull. 2021, 172, 112860. [Google Scholar] [CrossRef] [PubMed]
- Lindeque, P.K.; Cole, M.; Coppock, R.L.; Lewis, C.N.; Miller, R.Z.; Watts, A.J.R.; Wilson-McNeal, A.; Wright, S.L.; Galloway, T.S. Are we underestimating microplastic abundance in the marine environment? A comparison of microplastic capture with nets of different mesh-size. Environ. Pollut. 2020, 265, 114721. [Google Scholar] [CrossRef]
- Jeong, H.; Kusano, T.; Addai-Arhin, S.; Nugraha, W.C.; Novirsa, R.; Phan Dinh, Q.; Shirosaki, T.; Fujita, E.; Kameda, Y.; Cho, H.S.; et al. Differences in microplastic distributions on the surface freshwater collected using 100- and 355-μm meshes. EMCR 2022, 2, 22–34. [Google Scholar] [CrossRef]
- Szymańska, M.; Obolewski, K. Microplastics as contaminants in freshwater environments: A multidisciplinary review. Ecohydrol. Hydrobiol. 2020, 20, 333–345. [Google Scholar] [CrossRef]
- Scherer, C.; Weber, A.; Stock, F.; Vurusic, S.; Egerci, H.; Kochleus, C.; Arendt, N.; Foeldi, C.; Dierkes, G.; Wagner, M.; et al. Comparative assessment of microplastics in water and sediment of a large European river. Sci. Total Environ. 2020, 738, 139866. [Google Scholar] [CrossRef]
- Magnusson, K.; Eliasson, K.; Fråne, A.; Haikonen, K.; Hultén, J.; Olshammar, M.; Stadmark, J.; Voisin, A. Swedish Sources and Pathways for Microplastics to the Marine Environment. A Review of Existing Data; Report c 183; Swedish Environmental Protection Agency: Stockholm, Sweden, 2016. [Google Scholar]
- Krasowska, K.; Heimowska, A. Degradability of Polylactide in Natural Aqueous Environments. Water 2023, 15, 198. [Google Scholar] [CrossRef]
- Ferreira, M.; Thompson, J.; Paris, A.; Rohindra, D.; Rico, C. Presence of microplastics in water, sediments and fish species in an urban coastal environment of Fiji, a Pacific small island developing state. Mar. Pollut. Bull. 2020, 150, 110991. [Google Scholar] [CrossRef]
- Magnusson, K. Microlitter and Other Microscopic Anthropogenic Particles in the Sea Area Off Rauma and Turku, Finland; Swedish Environmental Institute: Stockholm, Sweden, 2014; pp. 1–17. [Google Scholar]
- Su, L.; Sharp, S.M.; Pettigrove, V.J.; Craig, N.J.; Nan, N.; Du, F.; Shi, H. Superimposed microplastic pollution in a coastal metropolis. Water Res. 2020, 168, 115140. [Google Scholar] [CrossRef] [PubMed]
- Noren, F. Small Plastic Particles in Coastal Swedish Waters; KIMO: Billdal, Sweden, 2007; pp. 1–11. [Google Scholar]
- Hidalgo-Ruz, V.; Gutow, L.; Thompson, R.C.; Thiel, M. Microplastics in the marine environment: A review of the methods used for identification and quantification. Environ. Sci. Technol. 2012, 46, 3060–3075. [Google Scholar] [CrossRef] [PubMed]
- Isobe, A.; Buenaventura, N.T.; Chastain, S.; Chavanich, S.; Cózar, A.; DeLorenzo, M.; Hagmann, P.; Hinata, H.; Kozlovskii, N.; Lusher, A.L.; et al. An interlaboratory comparison exercise for the determination of microplastics in standard sample bottle. Mar. Pollut. Bull. 2019, 146, 831–837. [Google Scholar] [CrossRef] [PubMed]
- Tokai, T.; Uchida, K.; Kuroda, M.; Isobe, A. Mesh selectivity of neuston nets for microplastics. Pollut. Bull. 2021, 165, 112111. [Google Scholar] [CrossRef] [PubMed]
- Xu, P.; Peng, G.; Su, L.; Gao, Y.; Gao, L.; Li, D. Microplastic risk assessment in surface waters: A case study in the Changjiang Estuary. China. Mar. Pollut. Bull. 2018, 133, 647–654. [Google Scholar] [CrossRef] [PubMed]
- Jung, J.W.; Park, J.W.; Eo, S.; Choi, J.; Song, Y.K.; Cho, Y.; Hong, S.H.; Shim, W.J. Ecological risk assessment of microplastics in coastal, shelf, and deep sea waters with a consideration of environmentally relevant size and shape. Environ. Pollut. 2021, 270, 116217. [Google Scholar] [CrossRef]
- Talvitie, J.; Heinonen, M.; Pääkkönen, J.P.; Vahtera, E.; Mikola, A.; Outi, S.; Vahala, R. Do wastewater treatment plants act as a potential point source of microplastics? Preliminary study in the coastal Gulf of Finland, Baltic Sea. Water Sci. Technol. 2015, 72, 1495–1504. [Google Scholar] [CrossRef]
- Koelmans, A.A.; Mohamed Nor, N.H.; Hermsen, E.; Kooi, M.; Mintenig, S.M.; De France, J. Microplastics in Freshwaters and Drinking Water: Critical Review and Assessment of Data Quality. Water Res. 2019, 155, 410–422. [Google Scholar] [CrossRef]
- Lenaker, P.L.; Baldwin, A.K.; Corsi, S.R.; Mason, S.A.; Reneau, P.C.; Scott, J.W. Vertical distribution of microplastics in the water column and surficial sediment from the Milwaukee River Basin to Lake Michigan. Environ. Sci. Technol. 2019, 53, 12227–12237. [Google Scholar] [CrossRef]
- Piehl, S.; Hauk, R.; Robbe, E.; Richter, B.; Kachholz, F.; Schilling, J.; Lenz, R.; Fischer, D.; Fischer, F.; Labrenz, M.; et al. Combined approaches to predict micro-plastic emissions within an urbanized estuary (Warnow, Southwestern Baltic Sea). Front. Environ. Sci. 2021, 9, 616765. [Google Scholar] [CrossRef]
- Ruijter, V.N.; Redondo-Hasselerharm, P.E.; Gouin, T.; Koelmans, A.A. Quality criteria for microplastic effect studies in the context of risk assessment: A critical review. Environ. Sci. Technol. 2020, 54, 11692–11705. [Google Scholar] [CrossRef] [PubMed]


Disclaimer/Publisher’s Note: The statements, opinions and data contained in all publications are solely those of the individual author(s) and contributor(s) and not of MDPI and/or the editor(s). MDPI and/or the editor(s) disclaim responsibility for any injury to people or property resulting from any ideas, methods, instructions or products referred to in the content. |
© 2023 by the authors. Licensee MDPI, Basel, Switzerland. This article is an open access article distributed under the terms and conditions of the Creative Commons Attribution (CC BY) license (https://creativecommons.org/licenses/by/4.0/).