Article

Optimization of Cascade Small Hydropower Station Operation in the Jianhe River Basin Using a One-Dimensional Hydrodynamic Model

1
College of Civil Engineering and Architecture, Guangxi University, Nanning 530004, China
2
Key Laboratory of Disaster Prevention and Structural Safety of the Ministry of Education, College of Civil Engineering and Architecture, Guangxi University, Nanning 530004, China
3
Guangxi Water Conservancy Research Institute, Nanning 530023, China
*
Author to whom correspondence should be addressed.
Sustainability 2023, 15(16), 12138; https://doi.org/10.3390/su151612138
Submission received: 29 June 2023 / Revised: 28 July 2023 / Accepted: 3 August 2023 / Published: 8 August 2023

Abstract

:
Hydropower development brings benefits in terms of power generation and flood control, but it also has inevitable ecological impacts. These impacts must be considered and addressed in order to ensure sustainable development and minimize harm to the environment. This study utilized the MIKE 11 HD modeling system to construct a hydrological and hydrodynamic model of the Jianhe River basin. The model incorporates the flow demand of ecologically sensitive targets for scheduling purposes and was calibrated and validated using hydrological data from 2014 to 2022. The hydrodynamic model was then applied to analyze the evolution characteristics of the water level in the main stream of the Jianhe River, identify key areas and periods for hydropower station operation, and calculate the minimum ecological water requirement using verification and estimation methods. Based on these findings, an ecological dispatching scheme for the cascade hydropower stations in the Jianhe River basin was developed. The results demonstrate satisfactory performance of the constructed NAM model for rainfall runoff and the 1D hydrodynamic MIKE 11 HD model for the Jianhe River basin. The deterministic coefficients exceed 0.8, and the relative errors in the total water volume are below 5.5%. The critical time and space interval for hydropower station operation in the main stream of the Jianhe River is identified as December to February of the following year, with the highest risk of flow interruption occurring in January, primarily concentrated between the Duoluo II and Huahai hydropower stations. If the appropriate dispatching scheme is not implemented in the areas prone to flow interruption during critical periods, it will have a negative impact on the ecological environment. These findings provide a scientific basis and decision support for developing multi-objective ecological flow guarantee schemes for rivers.

1. Introduction

Hydroelectric power generation is recognized for its reduced pollution and higher energy efficiency compared to traditional power generation methods, making it an important strategy for addressing environmental pollution and energy shortages [1,2,3]. Small-scale terraced hydropower stations offer a potential solution for power shortages in densely populated areas lacking power infrastructure while promoting river management, ecological construction, environmental protection, and water resource regulation [4,5,6]. However, uncontrolled development of small hydropower stations has resulted in reduced river runoff and significant damage to water ecosystems [7,8,9].
Construction of a hydropower station alters the natural hydrological rhythm of the river, leading to changes in the river’s hydrological regime, water environment, sediment, and other habitat factors. These changes have an impact on the survival and development of organisms in the river ecosystem, particularly fish [10]. Cascade hydropower development directly affects rivers by disrupting their longitudinal connectivity, cutting off migration channels for migratory fish, fragmenting fish habitats, and ultimately reducing the diversity of aquatic species [11]. Additionally, there is an unavoidable risk of injury and death for fish as they pass through turbines [12].
Thus, it is crucial to balance economic development with environmental water needs by regulating and controlling runoff processes during hydropower plant operations to improve the ecological environment of rivers and their surroundings [13,14,15].
Insufficient discharge of ecological flow stands as the primary cause of ecological deterioration in the dewatering section of hydropower stations [16,17,18]. Ensuring ecological flow during the operation of terraced hydropower plants can effectively mitigate the ecological harm caused by water project construction and support sustainable management [19,20]. Current research on the minimum ecological flow primarily focuses on calculation methods [4,21,22]. For example, Liu et al. [23] employed a modified Tennant method to calculate the ecological flow of the Hengxi hydropower station in Shaoguan City, Guangdong Province, during abundant, flat, and dry water years, by conducting ecological scheduling studies. Zhang et al. [24] employed a modified Tennant method to calculate the ecological flow of the Hengxi hydropower station in Shaoguan City, Guangdong Province, during abundant, flat, and dry water years, conducting ecological scheduling studies. In river channels, ecological water demand is typically measured using indicators such as the minimum ecological flow of the control sections (monthly or daily extreme flow), the ecological water demand of specific ecological protection objects (such as river valley forests and fish spawning grounds), and the minimum ecological water demand of the control sections (annual water volume) and water demand (monthly flow process). Satisfaction of the ecological water demand and implementation of cascade power generation are conflicting objectives. Increasing the former will unavoidably result in a decrease in the latter [25]. To achieve a balance between the ecological and economic benefits of hydropower stations, it is necessary to determine the spatial and temporal patterns of hydrological changes in the watersheds hosting hydropower stations, identify key areas for station scheduling, and combine this with the concept of minimum ecological water demand to allow for reasonable scheduling of each hydropower station’s power generation capacity. Nevertheless, research in this area remains limited.
Furthermore, current research on ecological flow predominantly concentrates on large basin plains, with fewer studies on ecological flow in small and medium-sized rivers, particularly in dewatering river sections of small hydropower stations [26]. The Jianhe River is a small and medium-sized river located in a mountainous area, spanning 99.34 km and containing numerous significant drops. Currently, there are mainly 16 operational hydropower stations in the Jianhe River basin. The high density of hydropower station development has disrupted river connectivity, resulted in the loss of ecological functions, depleted fish stocks, and caused a sharp decline in aquatic biodiversity in disconnected sections of the river.
This study aimed to develop a hydrological and hydrodynamic model in order to comprehend the characteristics of water level evolution in small and medium-sized rivers with hydropower stations during various periods. It also aimed to identify the crucial areas and research periods for hydropower stations and provide guidance for implementing water ecological protection measures in rivers. In light of these considerations, this study focuses on the research of 16 small cascade hydropower stations in the Jianhe River basin. The first part of the study involved constructing a one-dimensional hydrodynamic model using the MIKE 11HD software. The model was calibrated and verified using data from the study area. In the second part, the constructed model was used to determine the water level evolution characteristics of the main stream of the Jianhe River. Additionally, key operation areas and research periods of the hydropower stations were identified. The final part involved calculating the minimum ecological water requirement of the key research area and proposing an ecological dispatching scheme for the cascade hydropower stations in the Jianhe River basin. The aim of this study was to provide scientific reference for the operation and dispatching of the reservoir.

2. Materials and Methods

2.1. Basic Basin Profile

The Jianhe River is part of the Xijiang River system within the Pearl River basin. According to the Statistical Yearbook of Baise City, it spans 99.64 km in Debao County and has a watershed area of 2166 km2, with an average watershed elevation of 483 m. The annual average flow is 37.8 m3/s, with the maximum flow of 884 m3/s and the minimum flow of 2.15 m3/s. The Jianhe River Basin is situated in a tropical monsoon area influenced by monsoons and a warm Pacific current, resulting in a mild climate with abundant rainfall, numerous rainy days, high intensity and concurrent rain and heat during certain seasons. Flooding in this basin primarily occurs due to the convergence of storm runoff, constrained by the basin’s characteristics and storm events. The Jianhe River basin experiences heavy rainfall annually, primarily between May and September. The slopes on either side of the river contribute to the accumulation of floods, which exhibit characteristics of mountain floods. These floods are characterized by their ferocious force, sudden surges, and rapid declines, and are highly seasonal in nature. Over the years, the development of small-scale hydropower has been an effective approach to alleviating the increasing demand for water resources and improving their utilization efficiency. The distribution of hydropower stations in the basin is illustrated in Figure 1.

2.2. Hydrodynamic Model Construction

2.2.1. Rainfall Runoff Model

The construction of a rainfall runoff model for the Jianhe basin began with establishing a digital elevation model (DEM) of the basin to define its scope and subdivide it [27]. Subsequently, considering the characteristics of hydrometeorological data collection and runoff confluence, we utilized the MIKE 11 NAM model, a conceptual model for rainfall and runoff simulation, to simulate rainfall runoff in each sub-basin [28]. The model parameters were calibrated and verified using historical measured flow data from hydrological stations.
(1)
NAM Model Introduction
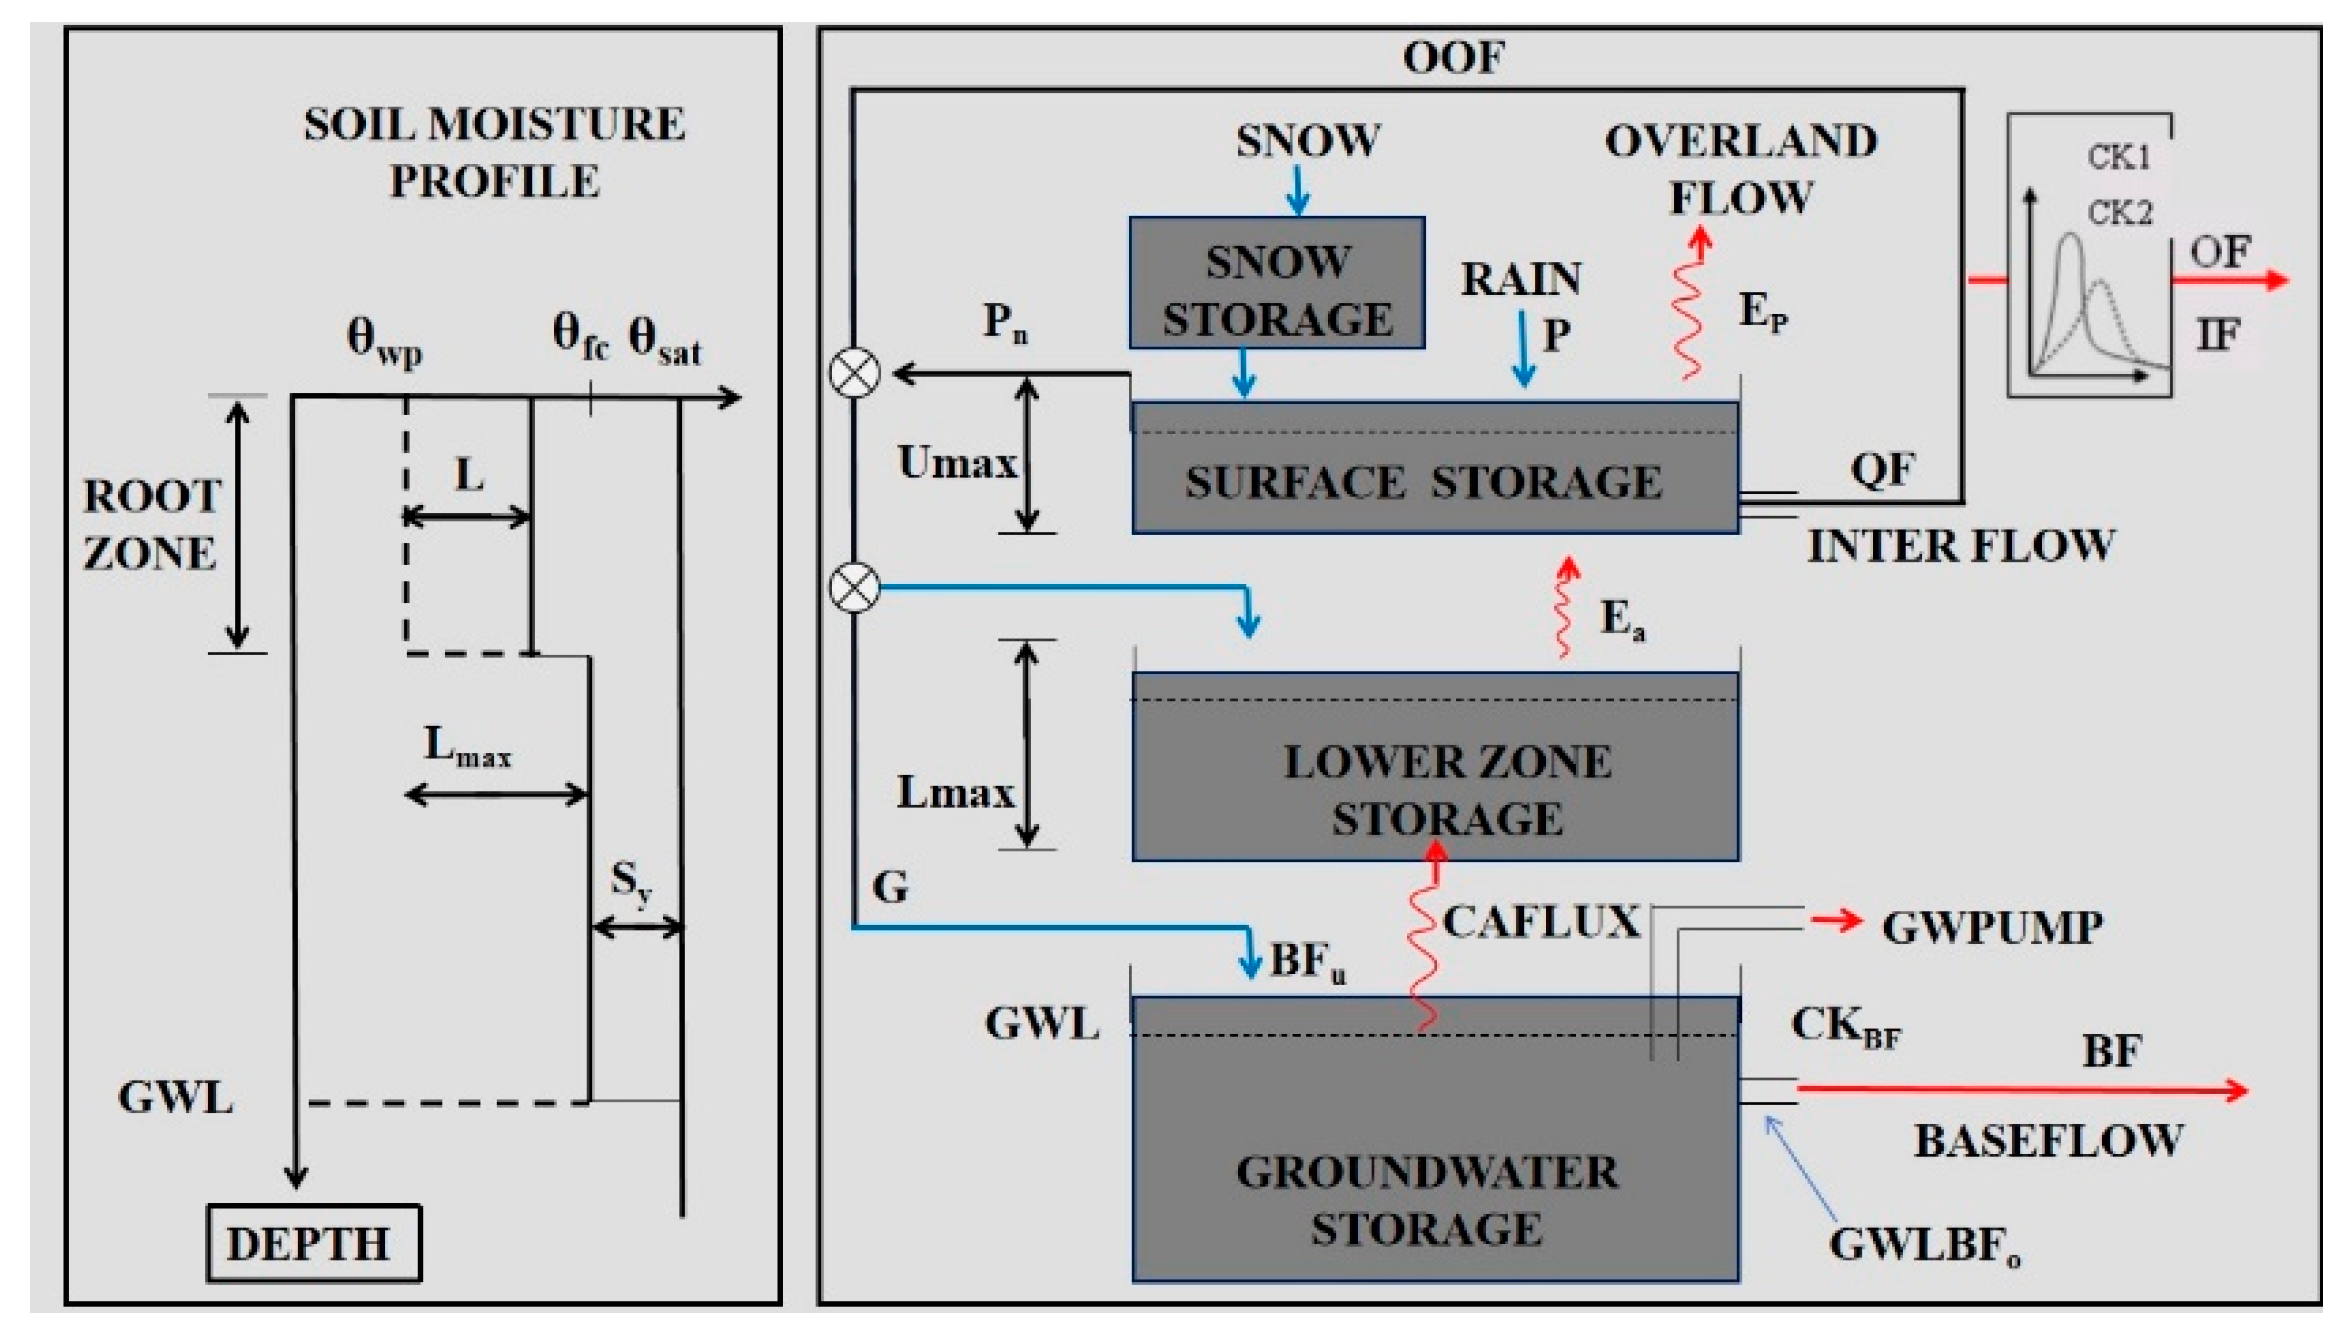
The NAM hydrological model is a generalized concept model that simulates the flow of rainfall in a basin by dividing the soil moisture content into four parts: snow storage, surface storage, lower zone storage, and ground water storage. This is a deterministic, lumped conceptual rainfall runoff model that was originally developed by the Technical University of Denmark. It allows for continuous calculation of hydrological processes in a basin. The NAM model can function as a standalone rainfall runoff module in the MIKE11 River Simulation System (RR) or be coupled with other modules to calculate the lateral flow of one or more river networks. Therefore, under the same simulation framework, the NAM model can be utilized for a river basin that comprises a major river and a complicated network of rivers and channels. The model structure is shown in Figure 2.
(2)
Simulation Range
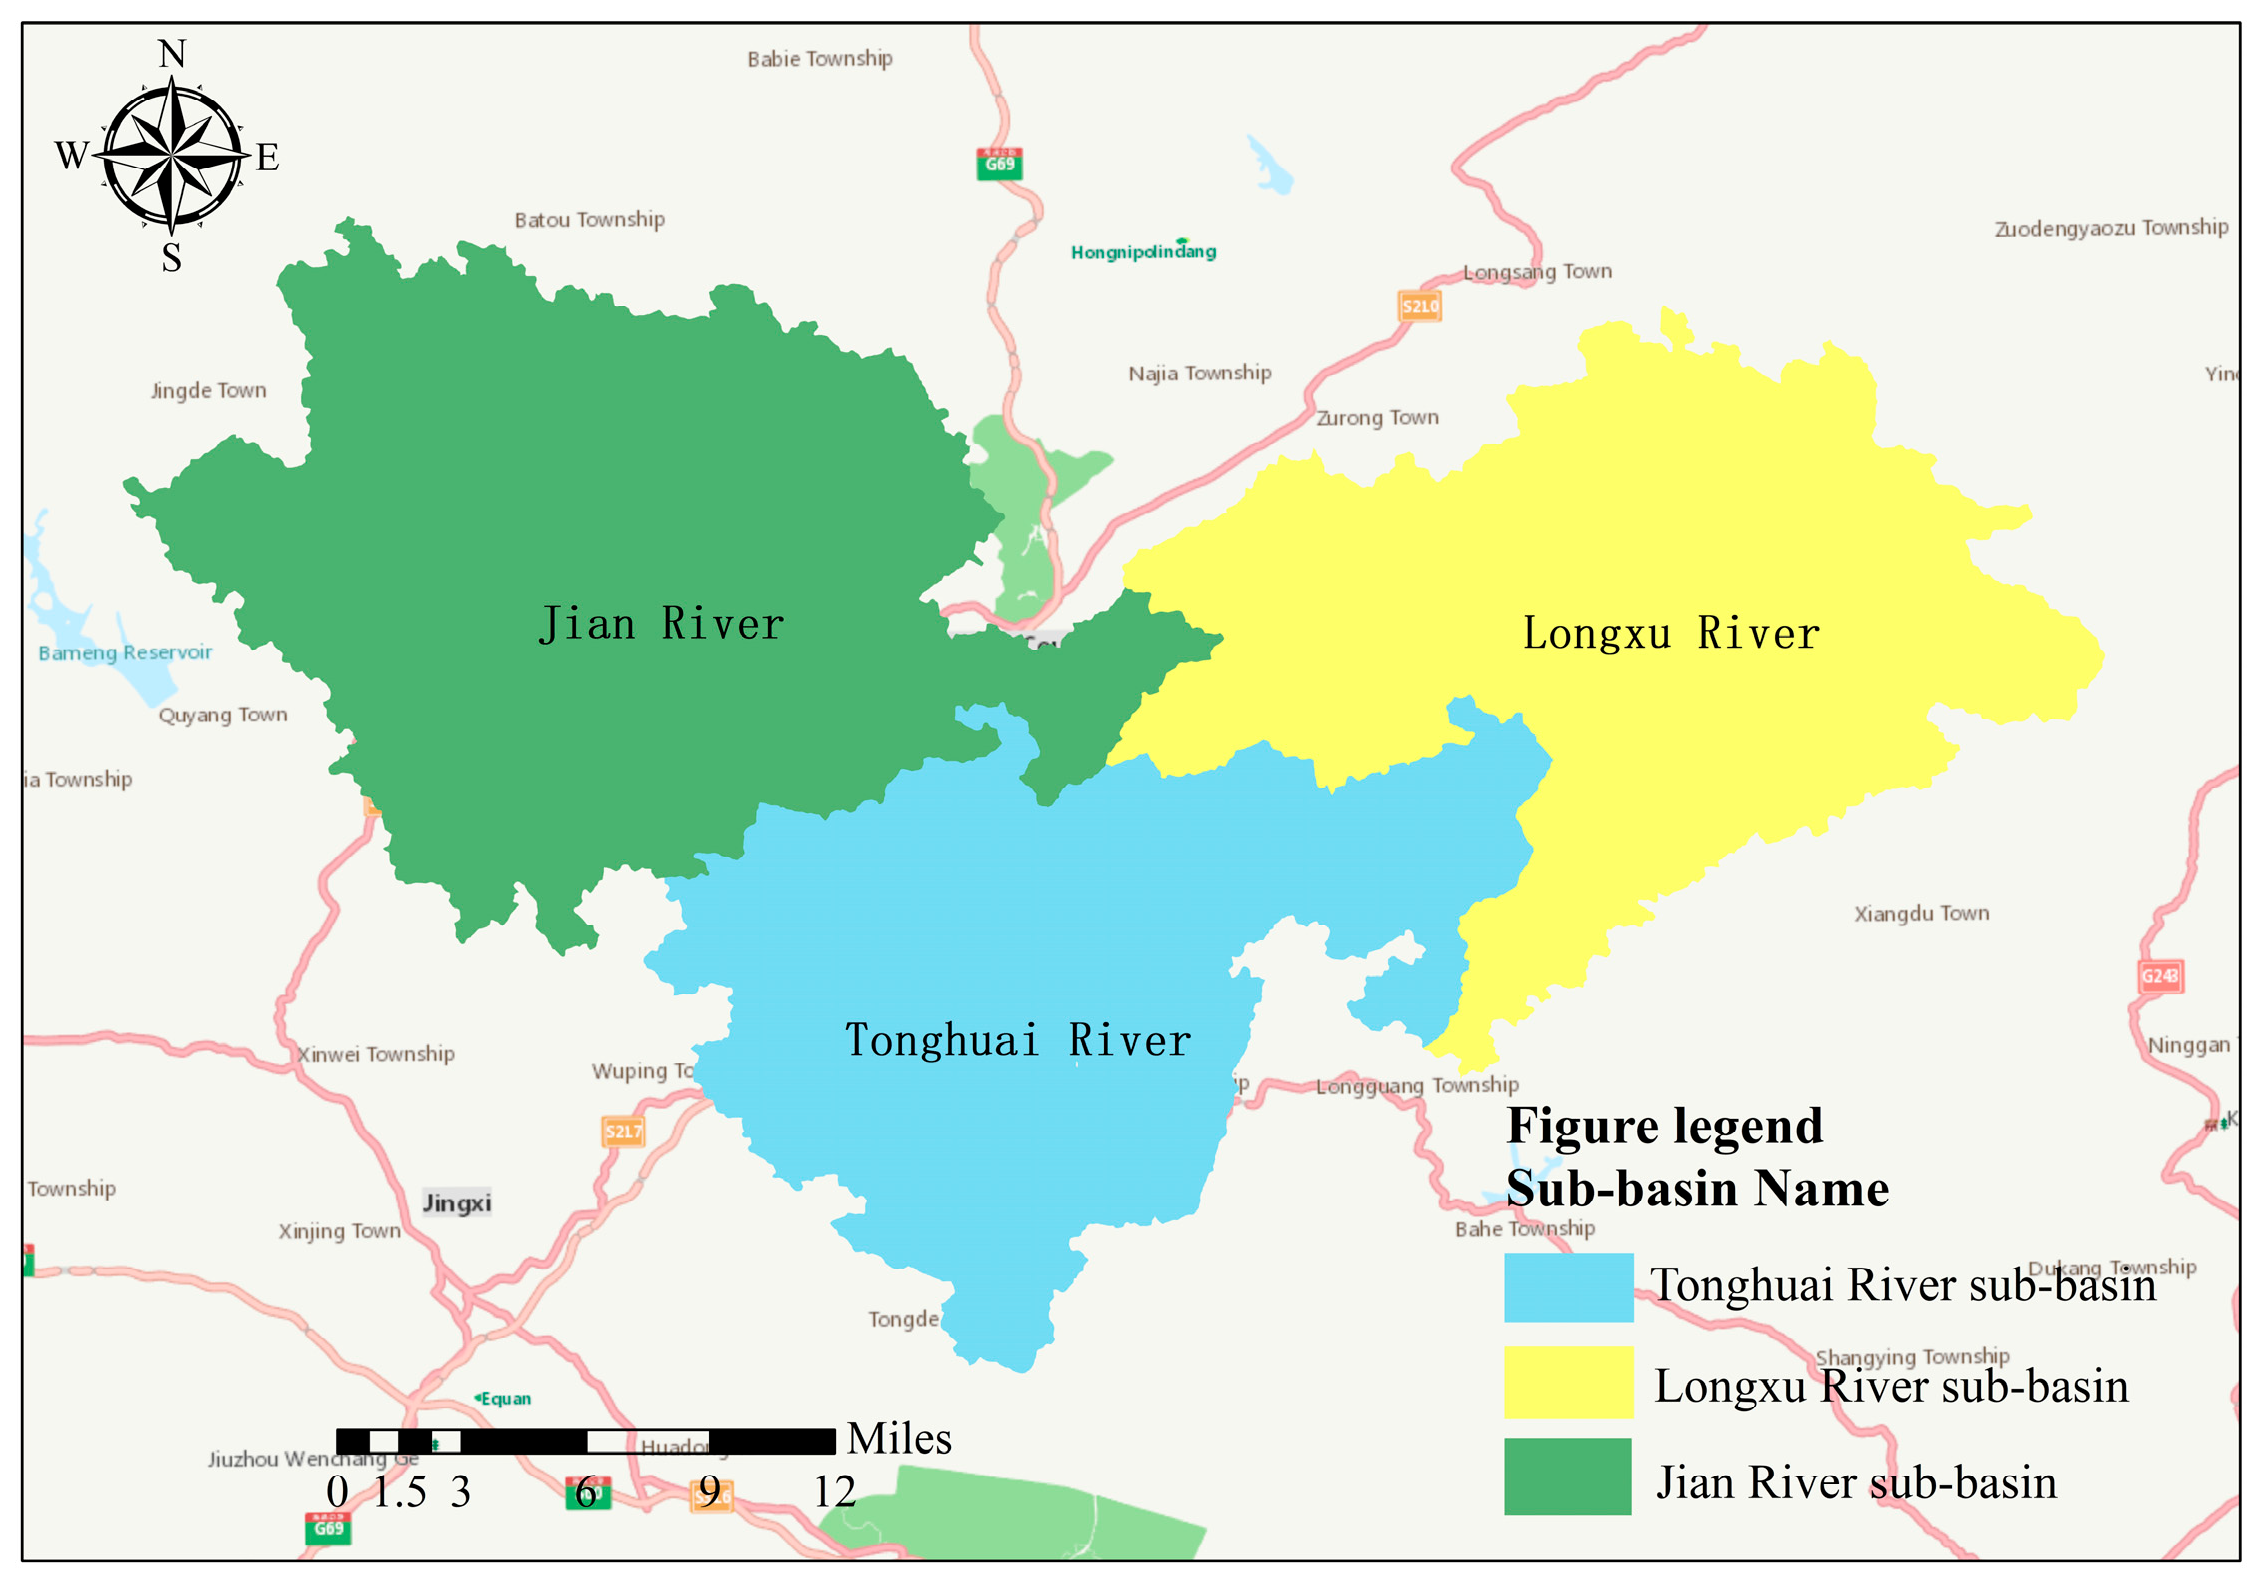
A 30 m × 30 m resolution digital topographic map was obtained from the United States Geological Survey (USGS) and processed using GIS spatial data to generate a watershed DEM. The scope of the Jianhe basin was determined based on this DEM, and the basin was divided into three subbasins: two subbasins at the source and one subbasin in the interval. The total area of the basin is 1598 km2 (Figure 3). In many cases, subbasins are named based on the name of the downstream hydrological control station or the water basin exit. Additionally, the subbasin of a water-free station is often named after the trunk river in the basin. Table 1 presents the sub-watershed names, model codes, and areas.
(3)
Input Condition
Inputs to the NAM model include rainfall, evaporation, and temperature (considered for snowmelt). As a lumped model, the NAM model treats each subbasin as a simulation unit, with parameters and variables within the unit adopting the mean value. Consequently, the meteorological data used represent the average values within each unit. The average rainfall within each unit is calculated by weighting the rainfall from each rainfall station based on the area weight coefficient. While the model parameters have physical concepts, they cannot be directly measured. Therefore, calibration of the model parameters is achieved using historical measured flow data from hydrographic stations.

2.2.2. One-Dimensional Hydrodynamic Model

MIKE 11 HD, known for flood forecasting, combined operation of reservoirs and hydropower stations, and estuarine storm surge research, was employed in this study [29]. It provides stable calculations, high accuracy, and reliability, making it suitable for complex hydraulic systems and scheduling involving numerous hydraulic structures. The MIKE 11 HD model consists primarily of the following components.
(1)
River Network
The river model generalization encompasses the handling of river cross-sections, tributary inflows, initial conditions, and roughness selection. The calculation of a river network begins with the generalization of three types of river components: river segments, cross-sections, and nodes. Nodes are defined as the points where rivers intersect with each other or the two endpoints of each river. River sections refer to the segments between two nodes, and each river section must be generalized to at least two cross-sections.
Through site visits and investigations, this study conducted a generalization of the river network in the study area, as depicted in Figure 4, with specific information provided in Table 2.
(2)
Reservoir
The study focuses on the Bameng Reservoir located in the upper reaches of the Jian River. As historical scheduling information was not available, hydrological modeling was performed only for the upper reaches of the reservoir without river hydrodynamic calculations. The river below the reservoir was used for river hydrodynamic calculations downstream of the reservoir with the help of reservoir discharge records.
(3)
Boundary Condition
During model calibration and validation, upstream boundary inflow conditions are determined by measuring flows at hydrological stations. If no measurements are available, the NAM model is used to simulate the results. The downstream boundary is determined by the measured water level or water level flow curve at the hydrological stations. The upstream boundary inflow conditions of the hydrodynamic model are derived from the results of the NAM model. The MIKE 11 HD model can be coupled with the NAM model, allowing for data and information transfer without manual intervention. The upper reaches of the Jianhe River are bounded by the Dehe River, while the lower reaches are bounded by the Youjiang River. The other tributaries within the basin are considered closed basins, indicating closed boundaries.

2.3. Minimum Ecological Flowmeter Method

Various methods are employed to calculate the ecological water demand in downstream river sections, including the 7Q10 method, hydrological series method, Tennant method, R2Cross method, in-channel flow augmentation method, minimum monthly mean flow method, and empirical estimation method [30,31]. Based on investigations of water use downstream of the cascade hydropower stations in the Jianhe River basin and the collection of hydrological data, this study adopted the empirical estimation method to calculate the minimum ecological water requirement of the cascade hydropower stations. The study formulated an optimal scheduling strategy considering the reduced river reach’s ecological water demand based on the Code for Calculation of the Ecological Environmental Water Demand of Rivers and Lakes (SL/Z 712-2014) and the annual ecological discharge process.

3. Results and Discussion

3.1. Model Calibration and Validation

3.1.1. Rainfall Runoff Model Calibration and Verification

(1)
Model Calibration
The NAM model for rainfall runoff in the Jianhe River basin determined its parameters through a combination of methods. Direct rate determination was used for the source subbasins with control stations at the outlet based on historical hydrometeorological data. For the subbasins without control stations or information from hydrological stations, parameters were transplanted from similar areas. Interval subbasins were determined through joint rate determination, coupled with the river network hydrodynamic model. The NAM rainfall runoff model utilizes an automatic rate function to ensure a balanced water flow at regular intervals. It also minimizes the square root of the error in the flow process line and can focus on both peak and dry period flows. The modeling process involves a combination of both automatic and manual methods.
The Ronghua watershed was selected for model validation, covering the period from 2020 to 2021. The calibration results of the NAM model, as shown in Figure 5, demonstrate a satisfactory fit between the simulated and measured flood values, peak occurrence times, flow process lines, and total water balance. The coefficient of certainty exceeds 0.85, and the relative error in total water volume is less than 5%.
(2)
Model Verification
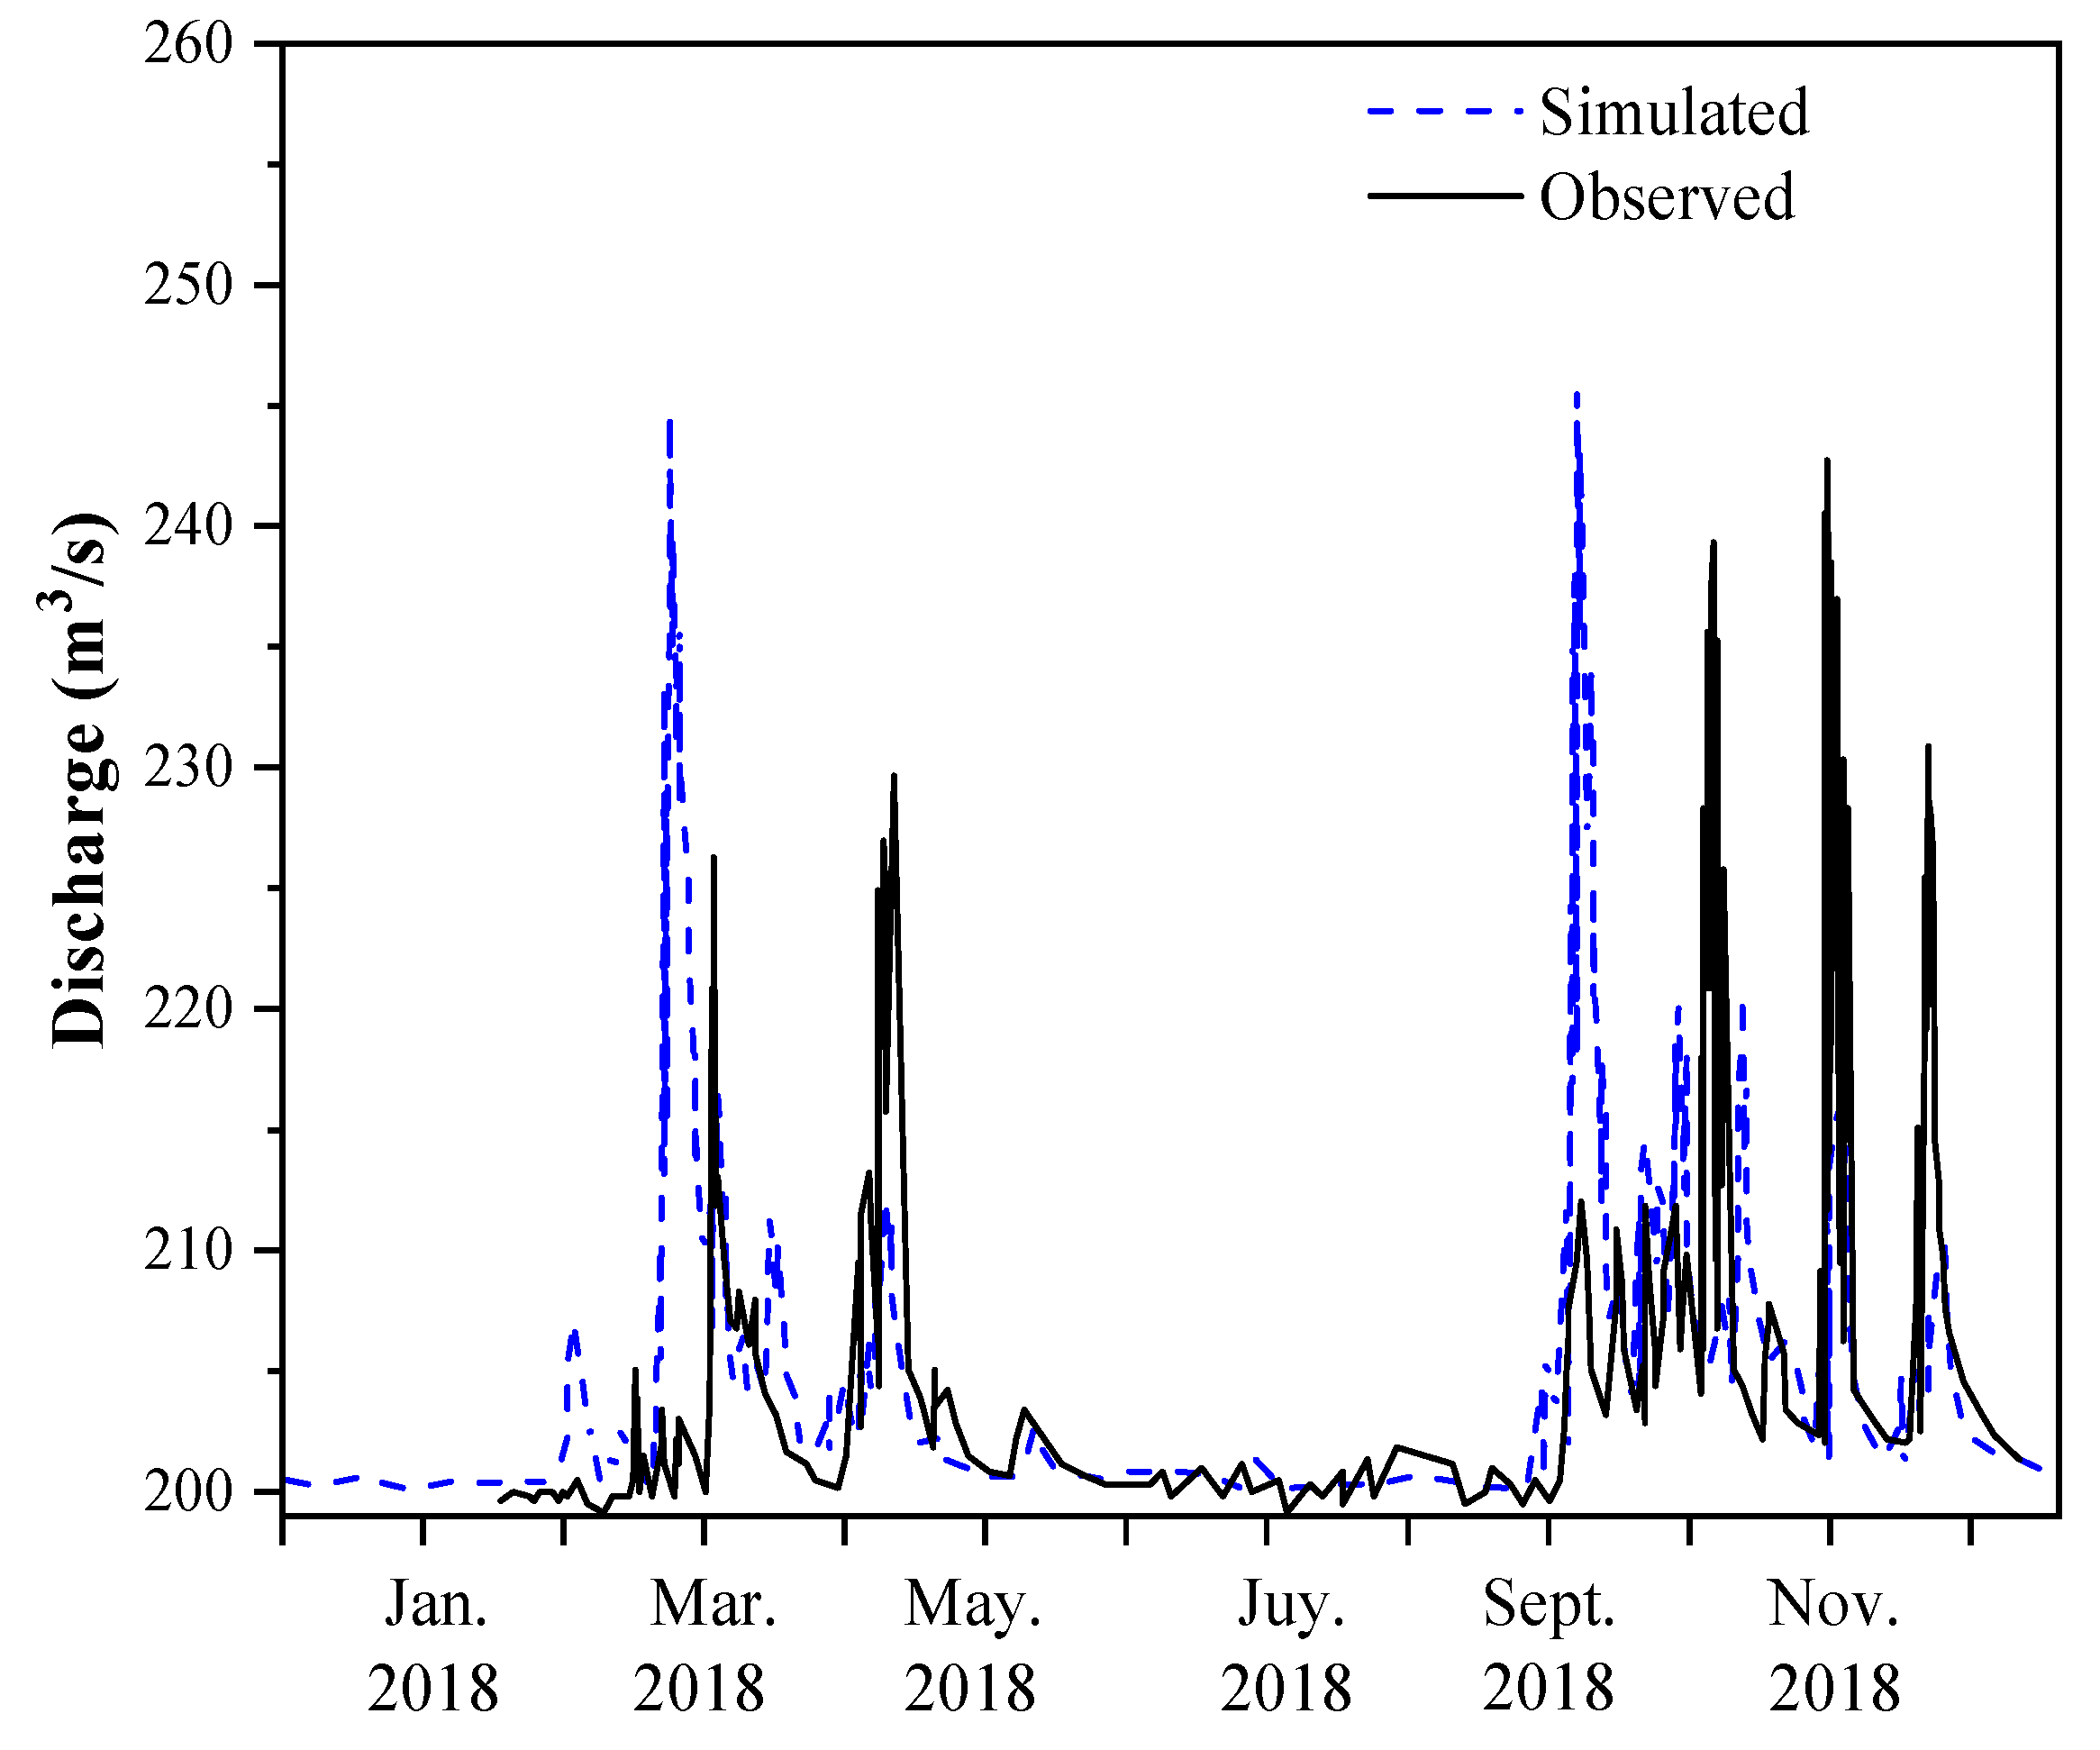
Model verification was conducted for the NAM model using data from 2018 as the validation period. The results of the model validation, as presented in Figure 6, were not as satisfactory. This may be attributed to the limited number of rainfall measurement stations within the Jianhe River basin (52 stations), with only nine stations providing long-term data of poor continuity. Additionally, there is only one evaporation station, resulting in insufficient coverage of evaporation information. These factors contribute to errors in the calculation of average evaporation in the subbasins, thereby affecting the accuracy of the model simulation.

3.1.2. One-Dimensional Hydrodynamic Model Calibration and Validation

The calibration of the hydrodynamic model involved two aspects: parameter calibration of the coupled interval hydrological model and determination of the bed roughness coefficient [32]. The calibration process includes adjusting the hydrological model parameters to ensure consistency between the calculated flow values at the downstream rate stations and the measured flow values. The roughness coefficients were fine-tuned manually or automatically based on the previous calibration results to achieve a close match between the model results and the measured values. In this study, a combination of automatic and manual calibration was employed. Initially, preset model parameters were established, and automatic calibration was performed using a multicore computer. Subsequently, manual fine-tuning calibration was conducted [33,34].
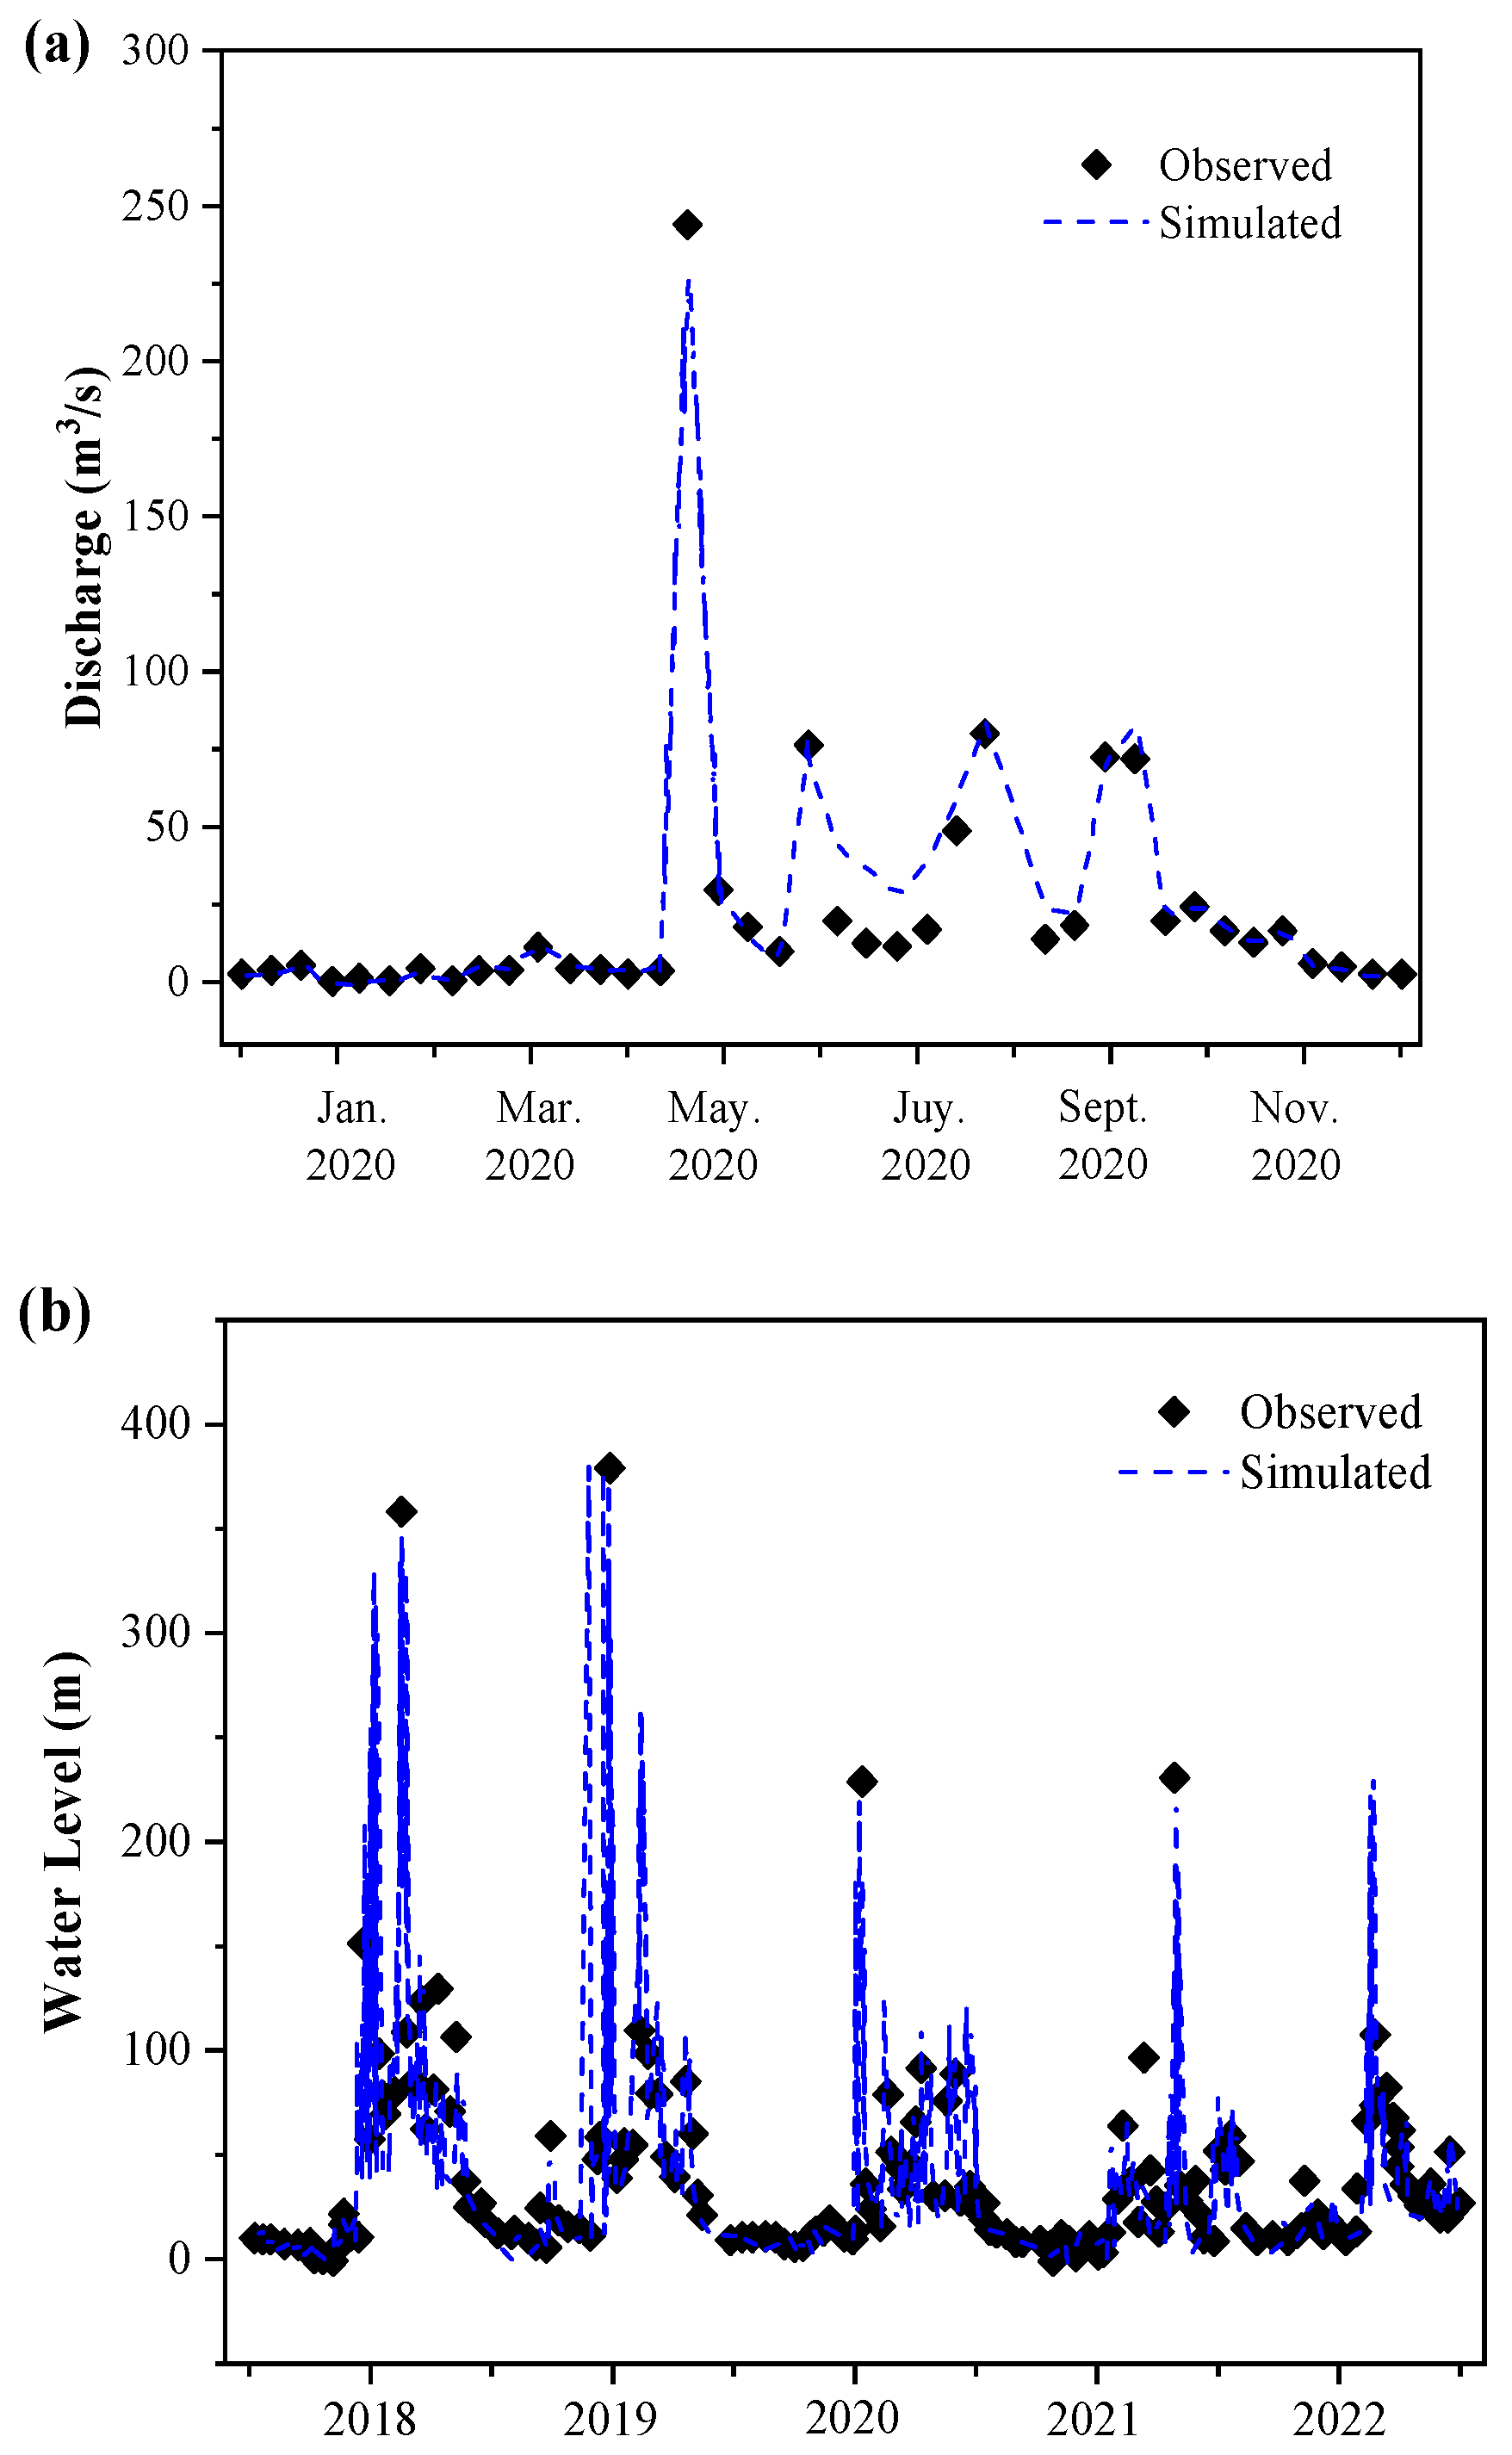
Based on the spatial location of the rate stations, historical measured data, and rainfall records, the hydrological model was divided into nine zones for calibration. The average surface rainfall for each corresponding catchment was calculated using the Tyson polygon method, employing all available stations with historical rainfall records [35]. The NAM model can adaptively adjust the weighting coefficients for the corresponding catchment for stations with no data during the rating period and then calculate the surface average rainfall for that catchment using the new weighting coefficients for each station. The calibration results shown in Figure 7a indicate a good fit between the simulated watershed export data for the typical year 2020 and the measured flow process in terms of the peak flood values, peak times, and flow process lines. The simulated water level change process from 2018 to 2022 aligns well with the measured water level process. Overall, the deterministic coefficients for flow and water level exceed 0.82, and the relative errors in total water volume are below 5.5%.

3.2. Characteristics of Water Level Evolution and Analysis of the Key Areas of Hydropower Station Operation

3.2.1. Analysis of Water Level Evolution Characteristics

In order to better understand water level changes of the main stream of a river during the water supply period (December to May of the following year), identify key areas for scheduling multistage hydropower plants, and support the multi-objective ecological optimization of hydropower plant scheduling, it is necessary to conduct hydrodynamic modeling and analysis for the entire length of the stream. Figure 8 illustrates the three stages of water level characteristics during the water supply period: A, B, and C. Section A stretches from the entrance of the Jianhe in Debao County to the Duoluo II power station, covering a distance of 47.94 km with an elevation difference of 205.00 m and the average slope of 4.30‰. The section includes the Sanhe power station, the Jiawang power station, the Gulong power station, the Dongqi power station, the Nalong power station, the Longquan power station, and the Nawen power station. Additionally, the Linqiao River and the Ma Yai River, two major tributaries, converge into this section, resulting in a generally smooth water flow. Section B stretches from the Duoluo II power station to the Huahai power station, spanning 17.43 km with an elevation difference of 216.10 m and an average gradient of 12.40‰. Along the section, there are four power stations, namely the Duoluo II, Duoluo III, Duoluo IV, and Naliang power stations, arranged from upstream to downstream. There are no major tributaries flowing into the area during this period, and the evolution of water flow and levels is complex and variable. Without appropriate scheduling measures for the power stations in this area, Section B is prone to disruptions and drying up. The final section, Section C, experiences a smoother water flow and extends from the Huahai power station to the Ronghua power station, covering 12.33 km with an elevation difference of 80.30 m and an average slope of 6.50‰. Consequently, Section B is identified as the critical area for hydropower plant scheduling on the main stream of the Jianhe River.

3.2.2. Analysis of the Key Areas of Hydropower Plant Scheduling

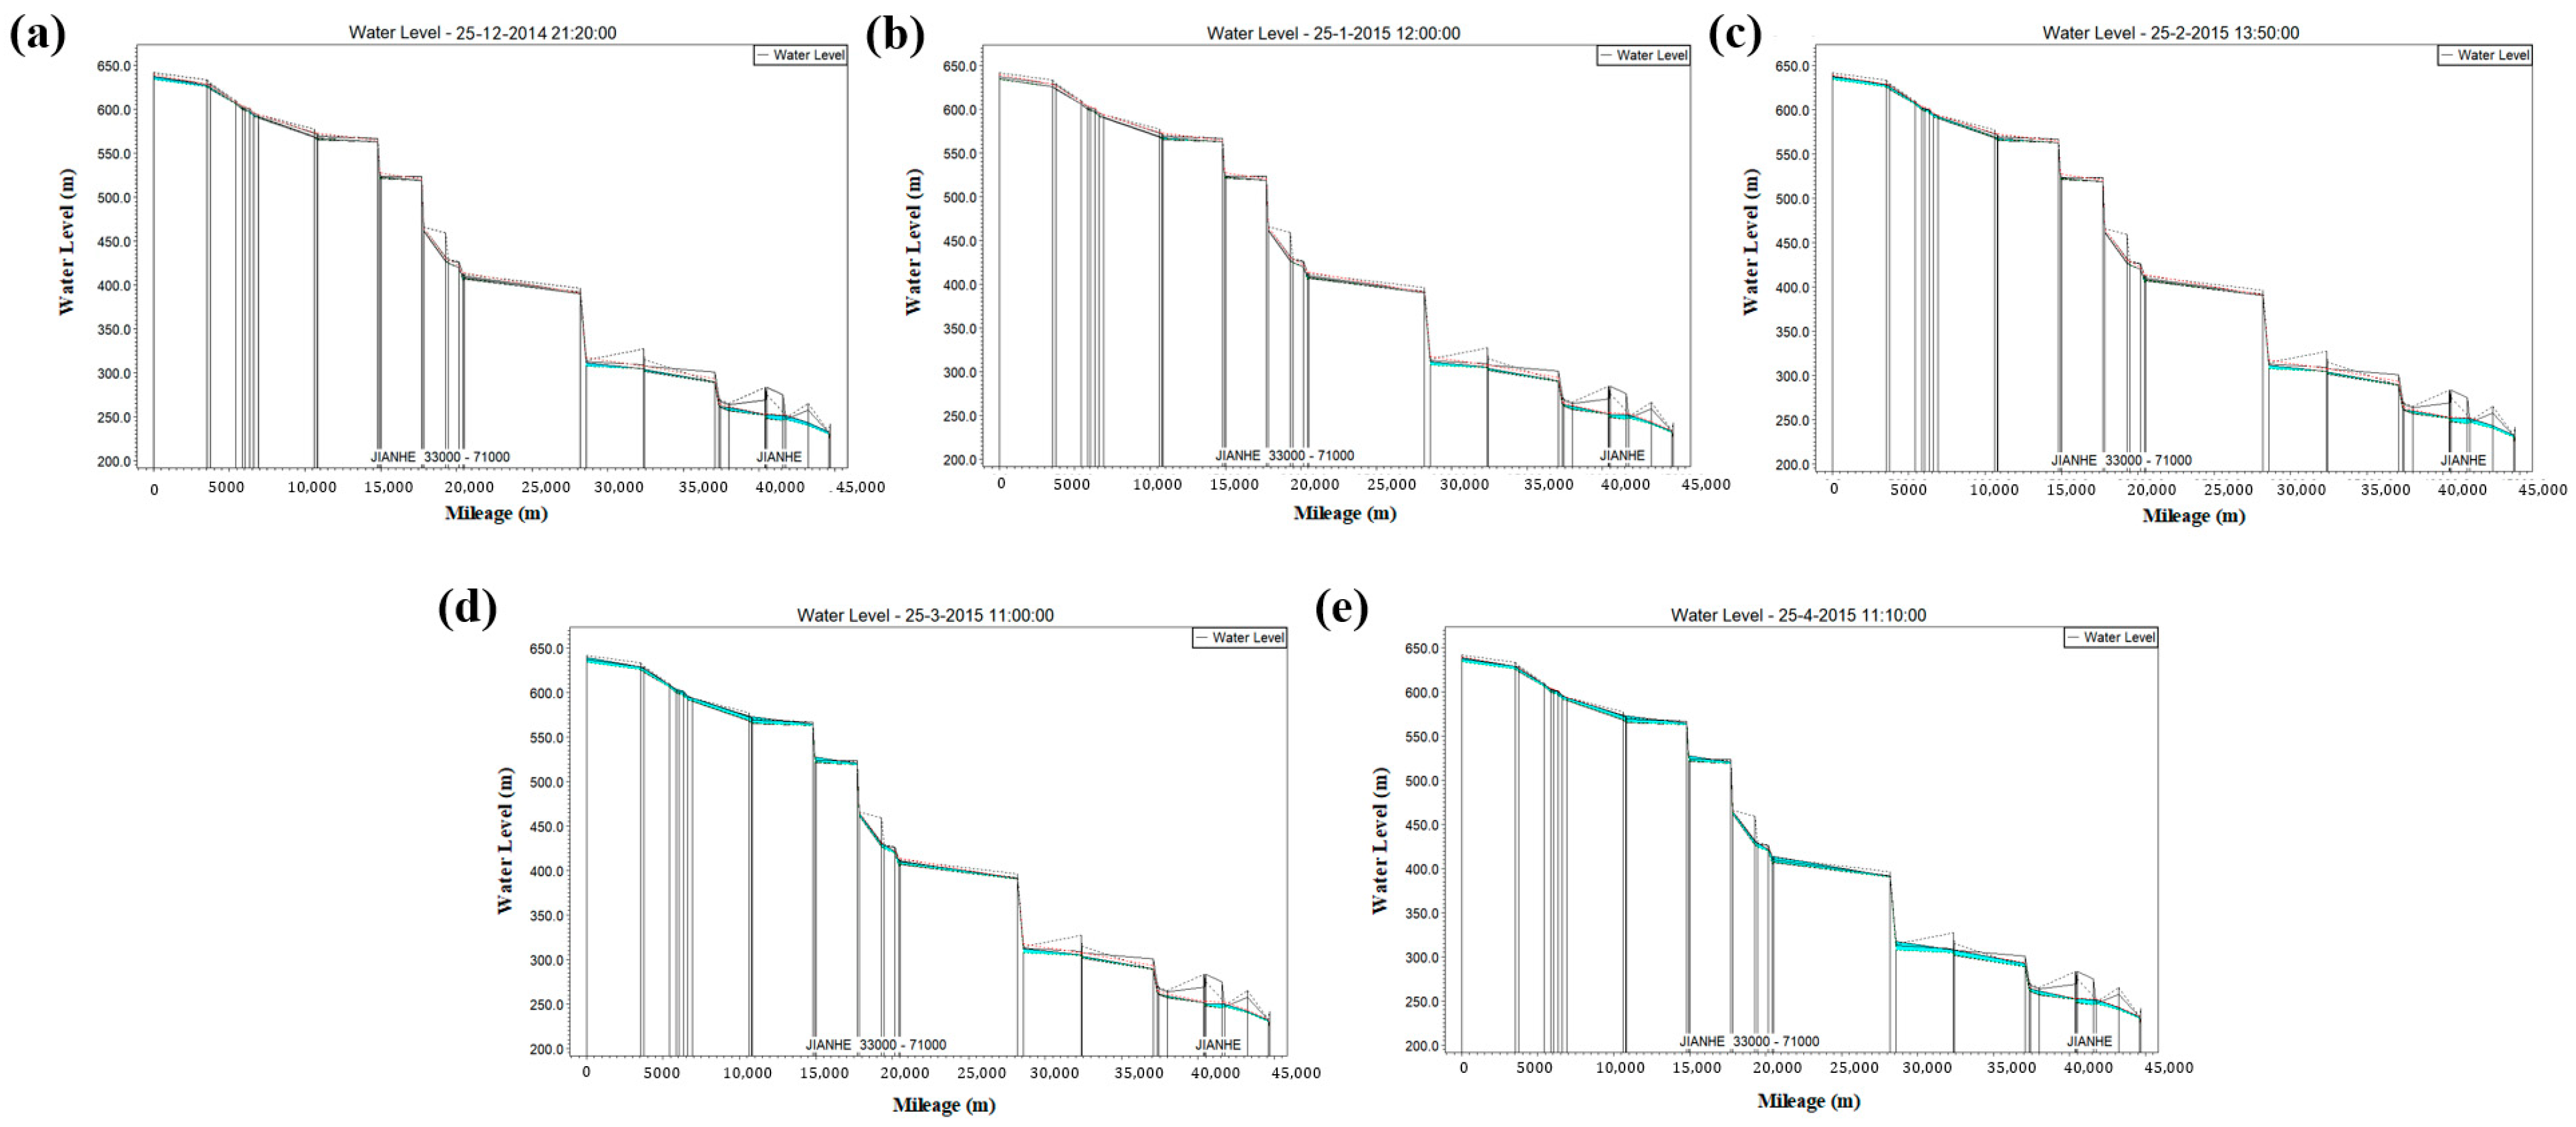
Based on the analysis conducted, it can be inferred that the crucial stretch for dispatching hydropower stations along the mainstream of the Jian River is Section B. This section spans from the Duoluo II power station to the Huahai power station. To further analyze the temporal and spatial evolution characteristics of water flow levels during the water supply period, a detailed model analysis was conducted for Section B. The results, depicted in Figure 9, indicate that the average water depth of the main stream of the Jianhe River was 25.30 m, 29.80 m, and 9.88 m in December 2014, January 2015, and February 2015, respectively. In March 2015, the average water depth dropped to 2.50 m, followed by an increase of over 0.5 m from April 2015 onwards. Therefore, the key period for hydropower station operation in the Jianhe River basin is from December to February of the following year, with the highest risk of cutoff occurring in January, primarily concentrated between the Duoluo II power station and the Huahai power station.

3.3. Ecological Operation of Small-River Cascade Hydropower Stations

In river channels, ecological water demand is typically measured using such indicators as the minimum ecological flow of the control sections (monthly or daily extreme flow), the ecological water demand of specific ecological protection objects (such as river valley forests and fish spawning grounds), and the minimum ecological water demand of the control sections (annual water volume) and water demand (monthly flow process). To calculate the minimum ecological discharge, each power station in the key area was selected as the control section and its ecological discharge was determined based on 45 years of the measured runoff data and the daily discharge data from the Ronghua hydropower station (1976–2020).
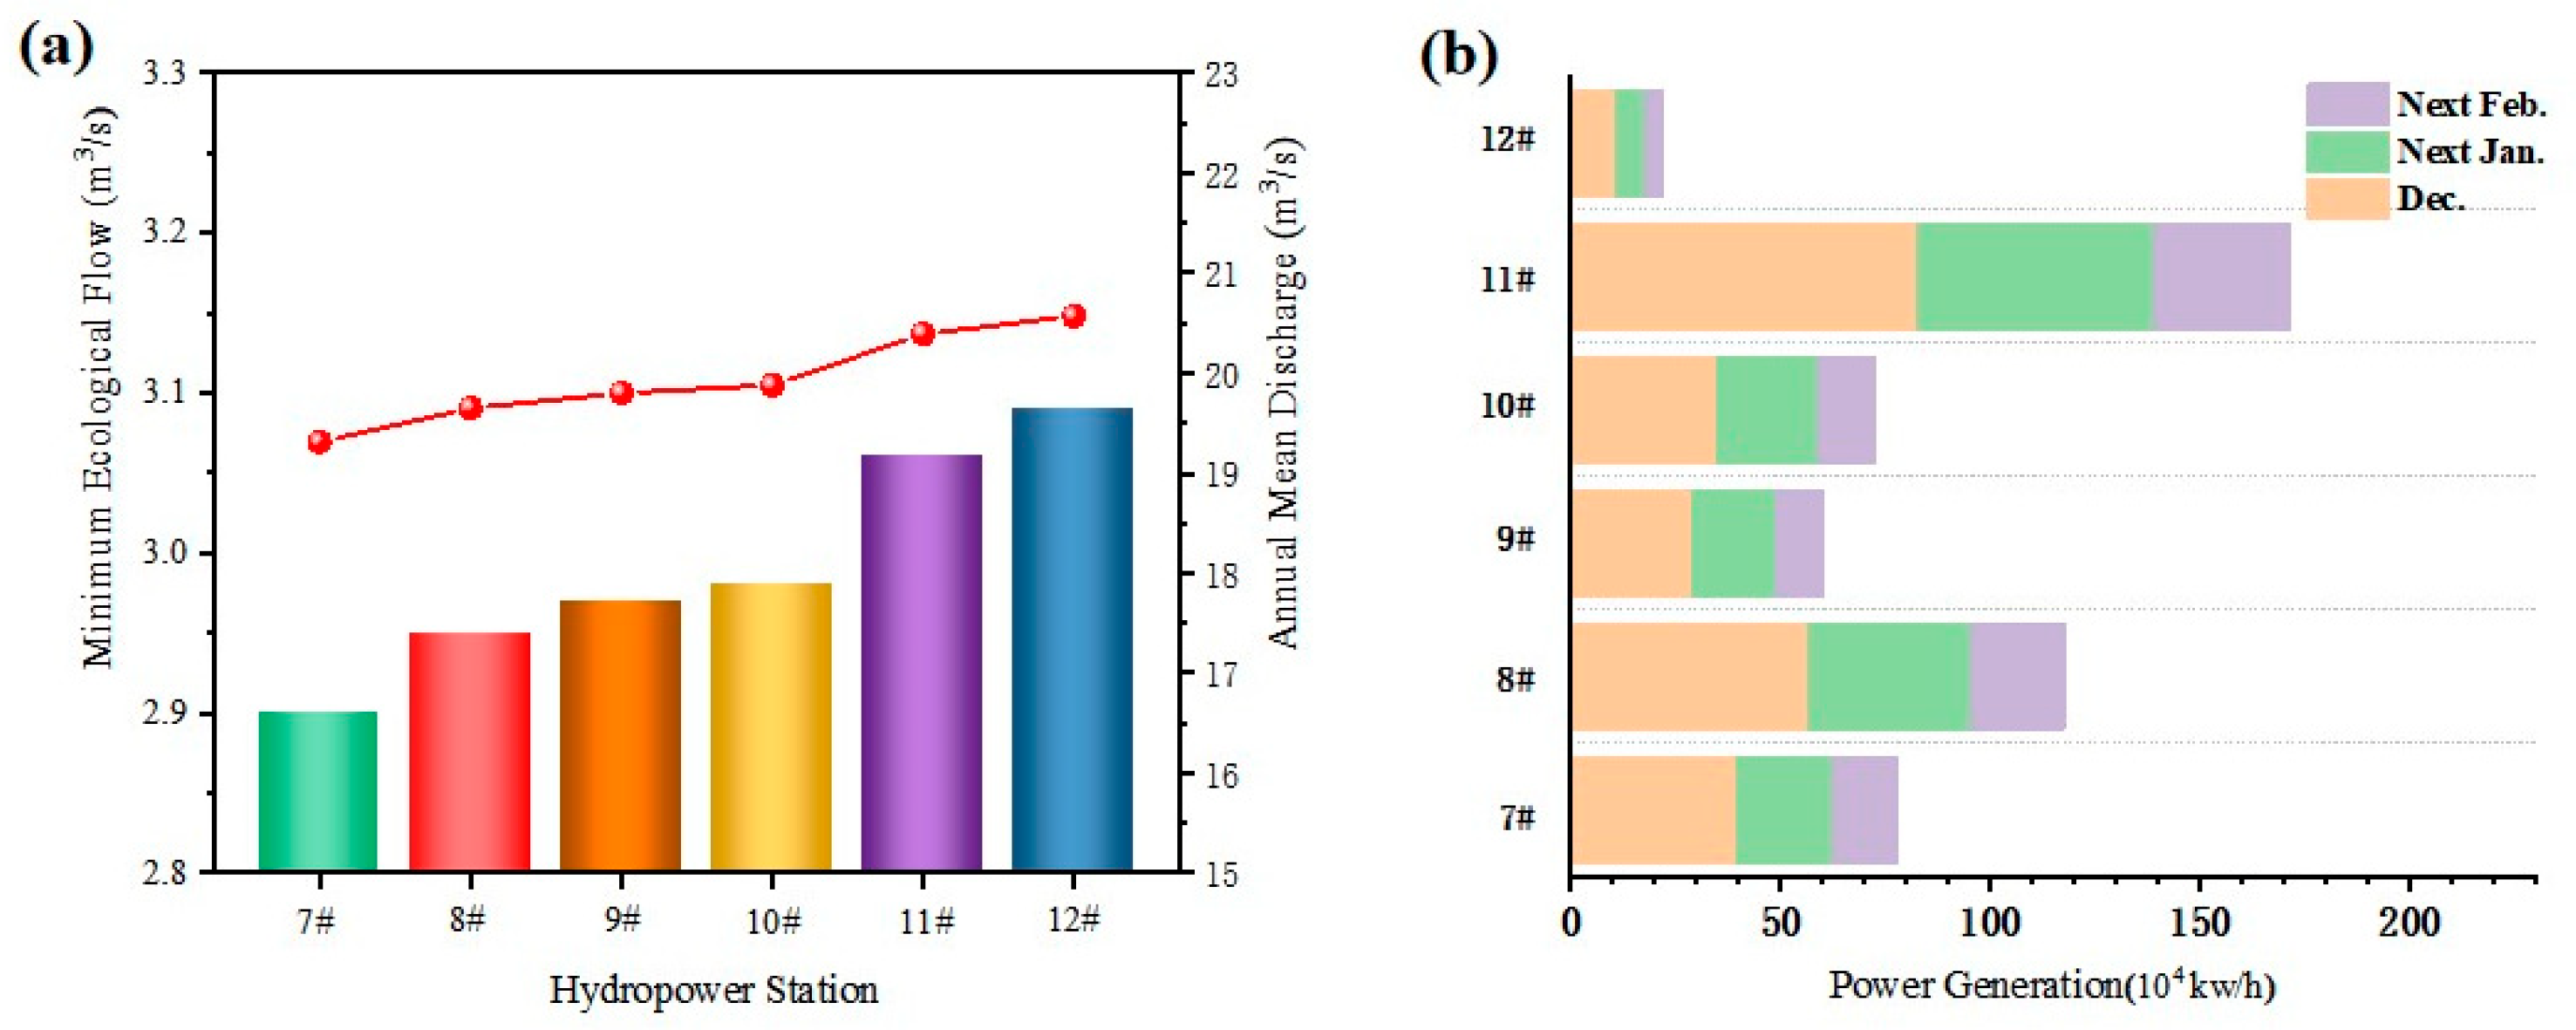
In this study, the minimum ecological discharge for each hydropower station was determined to be 15% of the annual average discharge following the Code for Calculation of the Ecological Environmental Water Demand of Rivers and Lakes (SL/Z 712-2014). This determination was based on the actual dispatching demand, ecological status, and collected data. The calculation results of the minimum ecological flow in the key areas are presented in Figure 10.
Based on the identified key areas for hydropower station operation and the calculated minimum ecological flow, the optimal operation scheme for the cascade hydropower stations in the Jianhe River basin was developed using the hydropower station power generation formula. The power generation of the cascade hydropower stations in the key area of the Jianhe during the dry season, before adjustment, was 9,474,900 kW/h. After ensuring the minimum ecological flow, power generation was reduced to 490.43 million kW/h, resulting in an adjusted power generation of 50.8% of the original.
Although adjustment of the power generation flow at hydropower stations may impart economic benefits, it is crucial to address the negative ecological and environmental impacts caused by the lack of sufficient ecological flow in the design of cascade small hydropower stations in the Jianhe River basin. The optimization of hydropower station operation should aim at regulating the discharge flow to meet the ecological water demand in the downstream river section as much as possible. Additionally, implementing a relatively uniform daily discharge process can reduce the head loss of power generation at all levels of hydropower stations, increase the total power generation capacity, and generate a higher revenue. By adjusting reservoir operation and scheduling, cascade water conservancy and hydropower projects can maximize economic benefits while minimizing the related negative ecological and environmental impacts.

4. Conclusions

In this study, a comprehensive assessment of the economic and ecological values of the 16 small hydropower stations in the Jianhe River basin was conducted. A hydrodynamic model including a NAM model and a 1D hydrodynamic MIKE 11 HD model was employed to accurately identify critical areas for hydropower plant scheduling. The concept of the minimum ecological flow was applied to determine the optimal power generation capacity of hydropower plants in these critical areas.
The NAM model and the 1D hydrodynamic MIKE 11 HD model demonstrated satisfactory performance in simulating rainfall runoff in the Jianhe River basin. The NAM model successfully captured the peak flood values, peak occurrence times, flow process lines, and total water balance, exhibiting a good fit with the measured flow data. The deterministic coefficients for both flow and water level calculated by the MIKE 11 HD model exceeded 0.82, and the relative errors in total water volume were below 5.5%. In addition, the analysis using the hydrodynamic model revealed that the critical area for hydropower plant scheduling in the Jianhe River basin is the stretch between the Duoluo II power station and the Huahai power station. This area lacks major tributaries, leading to complex and variable water flow conditions that are prone to disruptions and drying up without proper scheduling measures. The period from December to February, with the highest risk of disruptions occurring in January, poses the greatest challenge for maintaining the flow in this area. By implementing the concept of the minimum ecological flow in the scheduling process, it is possible to improve the ecological flow guarantee rate in the Jianhe River basin while ensuring the economic benefits of hydropower stations in the key areas. This approach successfully balances ecological and economic considerations, allowing for sustainable operation and management of the hydropower plants.
To prevent the construction of a hydropower station from causing significant damage to the ecological environment of the river, it is crucial to establish a joint water transfer management organization in the river basin. This organization should establish a scientific and reasonable joint operation system and conduct scientific operations in areas with a high risk of flow interruption during critical periods. Additionally, when it comes to model parameter calibration, relying solely on computer automatic calibration methods has limitations. It is important to leverage human knowledge and experience and combine it with computer automatic optimization algorithms.

Author Contributions

Writing—review and editing, Validation, Funding acquisition, R.L.; Conceptualization, Supervision, Methodology, X.H.; Writing—original draft preparation, Data curation, K.X.; Investigation, L.C.; Formal analysis, J.L. All authors have read and agreed to the published version of the manuscript.

Funding

This study was supported by the National Natural Science Foundation of China (Nos. 52079033 and 52279060).

Institutional Review Board Statement

Not applicable.

Informed Consent Statement

Not applicable.

Data Availability Statement

Not applicable.

Conflicts of Interest

The authors declare no conflict of interest.

References

  1. Qu, J.; Ding, X.; Sang, J.; Fenech, A.; Zhang, X. A comprehensive ecological flow calculation for a small hydropower development river: A case study. Hydrol. Process. 2022, 36, e14772. [Google Scholar] [CrossRef]
  2. Rahman, A.; Farrok, O.; Haque, M.M. Environmental impact of renewable energy source based electrical power plants: Solar, wind, hydroelectric, biomass, geothermal, tidal, ocean, and osmotic. Renew. Sustain. Energy Rev. 2022, 161, 112279. [Google Scholar] [CrossRef]
  3. Levasseur, A.; Mercier-Blais, S.; Prairie, Y.; Tremblay, A.; Turpin, C. Improving the accuracy of electricity carbon footprint: Estimation of hydroelectric reservoir greenhouse gas emissions. Renew. Sustain. Energy Rev. 2021, 136, 110433. [Google Scholar] [CrossRef]
  4. Yu, Z.; Zhang, J.; Zhao, J.; Peng, W.; Fu, Y.; Wang, Q.; Zhang, Y. A new method for calculating the downstream ecological flow of diversion-type small hydropower stations. Ecol. Indic. 2021, 125, 107530. [Google Scholar] [CrossRef]
  5. Yan, M.; Huang, W.; Zhang, T.; Ma, G.; Zhao, L. Study on dynamic flow lag time between cascade hydropower stations based on CNN-LSTM coupling model. Water Resour. Hydropower Eng. 2023, 54, 154–164. [Google Scholar]
  6. Zhang, W.; Sun, C. State-of-the-art Review of Hydro-Wind-Photovoltaic Hybrid Energy Systems. China Rural Water Hydropower 2022, 4, 285–293. [Google Scholar]
  7. Oxley, R.L.; Mays, L.W.; Murray, A. Optimization model for the sustainable water resource management of river basins. Water Resour. Manag. 2016, 30, 3247–3264. [Google Scholar] [CrossRef]
  8. Xiong, M.; Shao, K.; Dong, W.; Chen, H.; Zeng, C.; Que, Y.; Chen, F.; Zhu, B. Study on Fish Community Structure of the Main River Below Batang Hydropower Station and the Tributary Bachu River in the Upper Reaches of Jinsha River. Resour Environ. Yangtze Basin 2022, 31, 2481–2488. [Google Scholar]
  9. Lange, K.; Meier, P.; Trautwein, C.; Schmid, M.; Robinson, C.T.; Weber, C.; Brodersen, J. Basin-scale effects of small hydropower on biodiversity dynamics. Front. Ecol. Environ. 2018, 16, 397–404. [Google Scholar] [CrossRef]
  10. Knott, J.; Mueller, M.; Pander, J.; Geist, J. Bigger than expected: Species-and size-specific passage of fish through hydropower screens. Ecol. Eng. 2023, 188, 106883. [Google Scholar] [CrossRef]
  11. Mueller, M.; Knott, J.; Pander, J.; Geist, J. Experimental comparison of fish mortality and injuries at innovative and conventional small hydropower plants. J. Appl. Ecol. 2022, 59, 2360–2372. [Google Scholar] [CrossRef]
  12. Mohammadi, M.; Mohammadi, A.R.; Mohammadi, M.R. Optimizing Hydro Power Turbines in Order to Secure the Passage of Fishes in Khuzestan province. J. Appl. Comput. Mech. 2014, 1, 95–102. [Google Scholar]
  13. Ren, P.; Zhou, J.; Mo, L.; Zhang, Y. Comprehensive study on cascade hydropower stations in the lower reaches of Yalong river for power generation and ecology. Energy Sustain. Dev. 2023, 73, 236–246. [Google Scholar] [CrossRef]
  14. Li, Y.; Lin, J.; Qin, X.; Liu, Y.; Ren, Y.; Zhang, X. Join tecological operation optimal strategy of control and re-regulation reservoirs:A case study of Three Gorges-Gezhouba cascade reservoirs. J. Lake Sci. 2022, 34, 630–642. [Google Scholar]
  15. Winemiller, K.O.; McIntyre, P.B.; Castello, L.; Fluet-Chouinard, E.; Giarrizzo, T.; Nam, S.; Baird, I.G.; Darwall, W.; Lujan, N.K.; Harrison, I. Balancing hydropower and biodiversity in the Amazon, Congo, and Mekong. Science 2016, 351, 128–129. [Google Scholar] [CrossRef] [Green Version]
  16. Bai, T.; Xu, Y.; Sun, X.; Wei, J.; Pan, X. Study on Multi-objective Ecological Scheduling of Guanting Reservoir. Water Resour. Prot. 2022, 39, 101–108+124. [Google Scholar]
  17. Li, Y.; Lin, J. Calculation of minimum ecological flow in dewatering section of small hydropower stations: Taking Panxi cascade hydropower stations as an example. South-to-North Water Transf. Water Sci. Technol. 2022, 20, 536–543. [Google Scholar]
  18. Zhang, H.; Chang, J.; Gao, C.; Wu, H.; Wang, Y.; Lei, K.; Long, R.; Zhang, L. Management. Cascade hydropower plants operation considering comprehensive ecological water demands. Energy Conv. Manag. 2019, 180, 119–133. [Google Scholar] [CrossRef]
  19. Jiang, Z.; Liu, P.; Ji, C.; Zhang, H.; Chen, Y. Ecological flow considered multi-objective storage energy operation chart optimization of large-scale mixed reservoirs. J. Hydrol. 2019, 577, 123949. [Google Scholar] [CrossRef]
  20. Wang, M.; Zhang, J.; Guo, H.; Zhou, D.; Sun, B. Research on ecological flow discharge measures during construction period of hydropower projects. J. Xi’an Univ. Technol. 2021, 37, 53–56. [Google Scholar]
  21. Song, Z.; Cheng, Y.; Li, L.; Wang, W. Calculation of Ecological Flow of Diversion Hydropower Station in the Main Stream of Heihe River. Yellow River 2021, 43, 112–115. [Google Scholar]
  22. Wang, D.; Zou, J.; Liu, L.; Li, L.; Lai, J. Study on Ecological Regulation of Yunlong Reservoir Basin Based on Improved RVA Method. J. China Hydrol. 2023, 43, 41–46. [Google Scholar]
  23. Liu, S.; Chen, J.; Guan, S. Ecological Flow Calculation and Ecological Operation of Hengxi Hydropower Station Based on Improved Tennant Method. Sci. Technol. Eng. 2020, 20, 1628–1632. [Google Scholar]
  24. Zhang, W.; Sun, D.; Cao, X.; Yang, J.; Zhou, M.; Zhao, W. Ecological base flow determination and early warning scheme of the Datong River. J. Water Resour. Water Eng. 2023, 34, 100–109. [Google Scholar]
  25. Fan, S.; Yang, M.; Wang, P. Determining method of installed capacity based on river ecological flow. Yangtze River 2023, 54, 165–170. [Google Scholar]
  26. Chai, Z.; Yao, S. Several hotspots and progress of river ecology research. Yangtze River 2021, 52, 68–74. [Google Scholar]
  27. Pyo, J.; Kwon, Y.S.; Min, J.H.; Nam, G.; Song, Y.S.; Ahn, J.M.; Park, S.; Lee, J.; Cho, K.H.; Park, Y. Effect of hyperspectral image-based initial conditions on improving short-term algal simulation of hydrodynamic and water quality models. J. Environ. Manag. 2021, 294, 112988. [Google Scholar] [CrossRef]
  28. Doulgeris, C.; Georgiou, P.; Papadimos, D.; Papamichail, D. Ecosystem approach to water resources management using the MIKE 11 modeling system in the Strymonas River and Lake Kerkini. J. Environ. Manag. 2012, 94, 132–143. [Google Scholar] [CrossRef]
  29. Liang, Z.; Huang, H.; Cheng, L.; Hu, Y.; Yang, J.; Tang, T. Safety assessment for dams of the cascade reservoirs system of Lancang River in extreme situations. Stoch. Environ. Res. Risk Assess. 2017, 31, 2459–2469. [Google Scholar] [CrossRef]
  30. Karimi, S.; Salarijazi, M.; Ghorbani, K.; Heydari, M. Comparative assessment of environmental flow using hydrological methods of low flow indexes, Smakhtin, Tennant and flow duration curve. Acta Geophys. 2021, 69, 285–293. [Google Scholar] [CrossRef]
  31. Li, X.; Yin, J.; Qiu, X. Effects of Seasonal Runoff Change on Eco-environmental Water Demand of Qingshui River Channel. Bull. Soil Water Conserv. 2022, 42, 23–28+35. [Google Scholar]
  32. Jiang, C.; Zhou, Q.; Shen, Y.; Liu, G.; Zhang, D. Review on hydrological and hydrodynamic coupling models for flood forecasting in mountains watershed. J. Hydraul. Eng. 2021, 52, 1137–1150. [Google Scholar]
  33. Zhang, Y.; Zeng, K.; Wang, J.; Cai, J. Calculating Ecological Instream Flow Demand in Data-scarce Plain River:A Case Study of Tongshun River in Wuhan Reach. J. Yangtze River Sci. Res. Inst. 2020, 37, 35–40. [Google Scholar]
  34. Guo, Y.; Wu, X.; Qie, Z.; Ran, Y. Parameter Calibration of MIKE SHE Model Based on BP Neural Network. J. Yangtze River Sci. Res. Inst. 2019, 36, 26–30. [Google Scholar]
  35. Teshome, F.T.; Bayabil, H.K.; Thakural, L.; Welidehanna, F.G. Verification of the MIKE11-NAM model for simulating streamflow. J. Environ. Prot. 2020, 11, 152–167. [Google Scholar] [CrossRef] [Green Version]
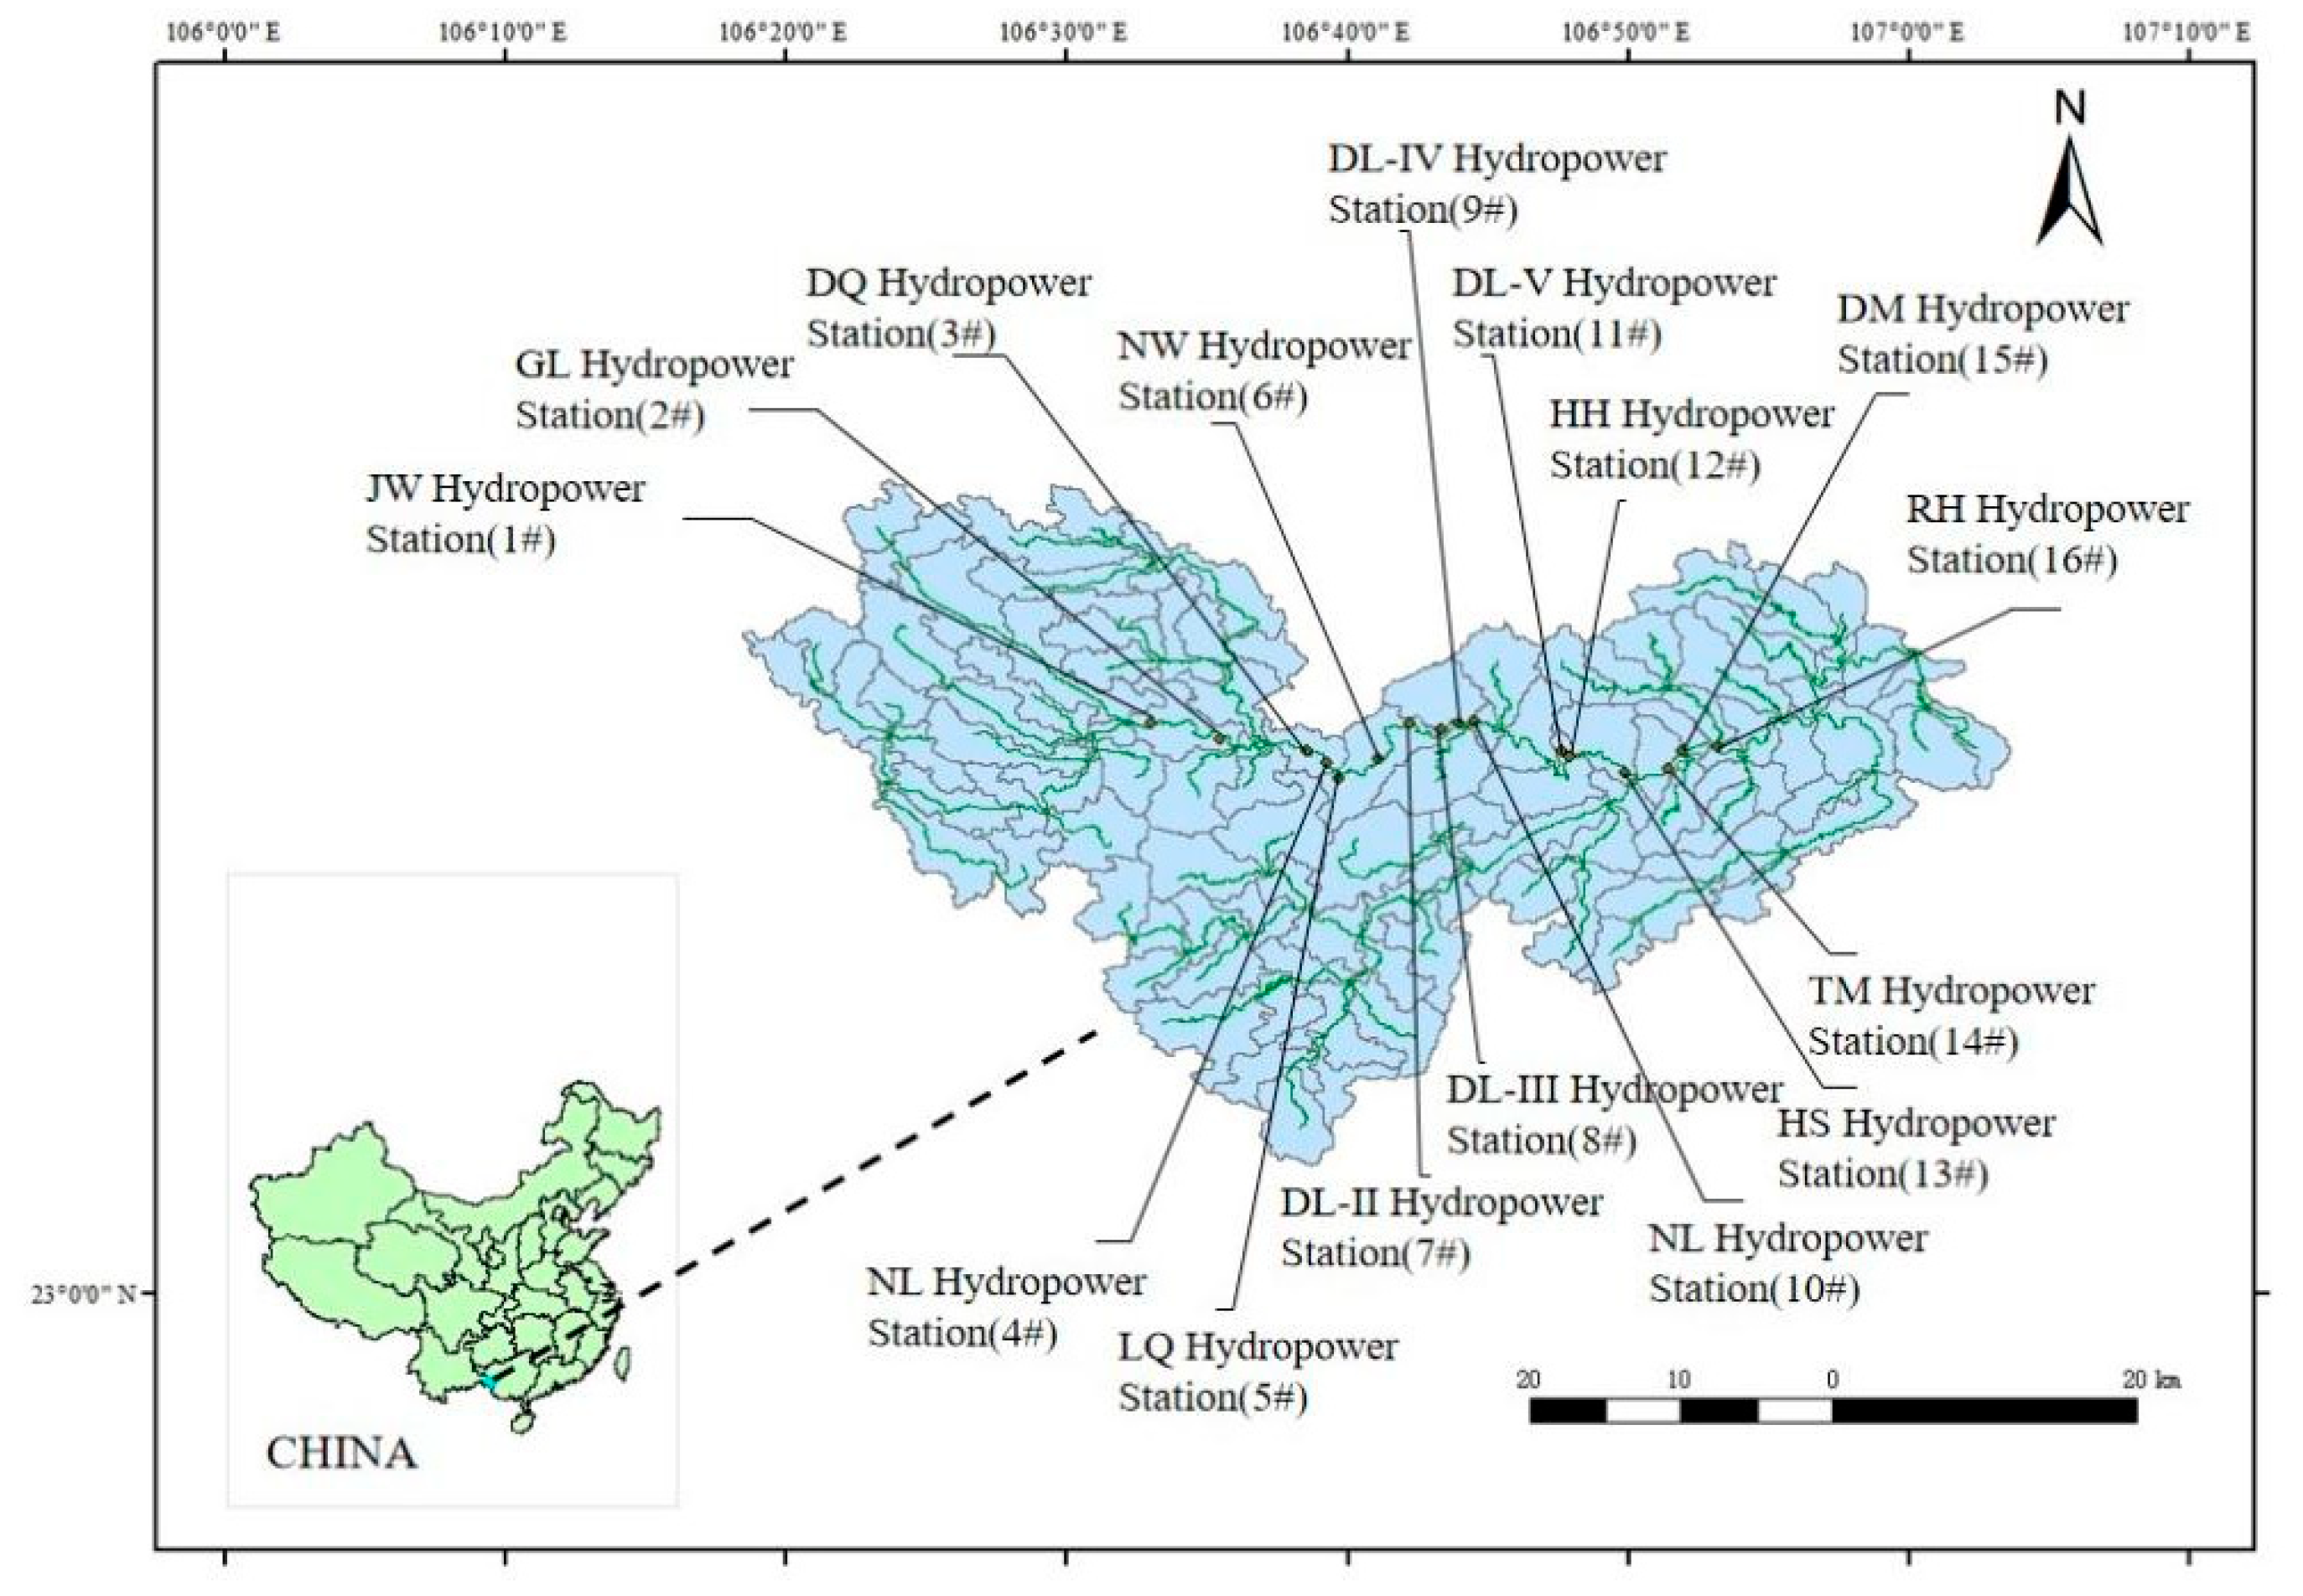
Figure 1. Distribution of the Jianhe cascade hydropower stations.
Sustainability 15 12138 g001
Figure 2. MIKE NAM model structure.
Sustainability 15 12138 g002
Figure 3. Jianhe River basin simulation range.
Sustainability 15 12138 g003
Figure 4. Generalization of the hydrodynamic model river network in the Jianhe basin (The blue lines represent the main river distribution of the Jianhe basin).
Sustainability 15 12138 g004
Figure 5. NAM model calibration results of (a) discharge and (b) accumulated water.
Sustainability 15 12138 g005
Figure 6. NAM model validation results.
Sustainability 15 12138 g006
Figure 7. Comparison of the model calculated values and the measured values at the Ronghua Station: (a) discharge and (b) water level.
Sustainability 15 12138 g007
Figure 8. Analysis of water level evolution characteristics (1#–16# refer to names of the hydropower stations).
Sustainability 15 12138 g008
Figure 9. Analysis of water level evolution characteristics in the key intervals of the river basin: (a) 25 December 2014, (b) 25 January 2015, (c) 25 February 2015, (d) 25 March 2015, and (e) 25 April 2015.
Sustainability 15 12138 g009
Figure 10. (a) Calculation of the minimum ecological flows for hydropower plants in the key areas of the Jianhe River basin and (b) power generation in the key areas for different periods. (In Figure 10a, the line chart represents the annual mean discharge, and the bar chart represents the minimum ecological flow).
Sustainability 15 12138 g010
Table 1. Basin information.
Subbasin NameModel CodeArea (km2)
JianheJH614
TonghuaiheTHH463
LongxuheLXH521
Table 2. Hydrodynamic model lists of river basins and channels.
Delimit Watershed NamesArea (km2)RiverInitial Mileage (m)Termination Mileage (m)
LINQIAOHE_BASIN171.23LINQIAOHE021,663
LINQIAOHE_BASIN30.00JIANHE21,91031,630
LINQIAOHE_CE_BASIN17.69LINQIAOHE19,05220,013
MAYIHE_BASIN65.40MAYIHE09000
MAYIHE_BASIN44.26MAYIHE23,03332,577
MAYIHE_2_BASIN23.34MAYIHE905623,011
JIANHE_MID02_BASIN11.41JIANHE31,63038,419
JIANHE_MID_BASIN275.81JIANHE38,41977,700
TONGHUAIHE_DOWN_BASIN145.97TONGHUAIHE16,03539,787
TONGHUAIHE_UP_BASIN272.10TONGHUAIHE016,054
JIANHE_UP_BASIN208.26JIANHE022,013
Disclaimer/Publisher’s Note: The statements, opinions and data contained in all publications are solely those of the individual author(s) and contributor(s) and not of MDPI and/or the editor(s). MDPI and/or the editor(s) disclaim responsibility for any injury to people or property resulting from any ideas, methods, instructions or products referred to in the content.