Abstract
Studying the carbon emissions resulting from digital transformation can provide a reference for the realization of the goals of carbon peaking and carbon neutrality in the era of the digital economy. This study calculated the value added to the digital economy and carbon emissions for 97 industry divisions from 1997 to 2018. Using the input–output model, we estimated the carbon emissions induced by the digital transformation of different industries, and used the structural decomposition analysis (SDA) to identify their driving factors. The results show that the carbon emissions induced by the digital economy in agriculture, forestry, animal husbandry, and fishery decreased in 2010, those from mining increased year by year, and those from scientific research and technical services showed a decreasing trend from 2011 to 2015. The induced rate of digital economy carbon emissions for production and supply of electricity, heat, gas, and water has persistently remained high. At present, digital economy labor productivity has not shown a promoting effect on carbon emission reduction. China should strengthen the construction of a digital platform for ecological and environmental governance and build a green and low-carbon industrial chain and supply chain to promote the realization of the goals of carbon peaking and carbon neutrality.
1. Introduction
In September 2020, the Chinese government announced a major strategic goal to strive for peak carbon emissions by 2030 and achieve carbon neutrality by 2060 [1,2]. China’s 14th Five-Year Plan proposes to support localities and key industries and enterprises with the conditions to achieve a peak in carbon emissions [3,4]. The development gap caused by different levels of technology [5], industrial structures [6], and resource endowments [7] have led to different degrees of progress in emission reduction efforts in various industries. In order to achieve the goals of carbon peaking and carbon neutrality on schedule, it is crucial to understand the results of carbon reduction efforts across different industries.
Currently, a new round of Industrial Revolution, represented by the digital economy, is sweeping across the globe at an unprecedented pace, with a very wide radiation range and depth of impact [8,9]. The Digital Carbon Neutrality White Paper points out that digital technology promotes the transformation of key industries towards digitization and greenization, empowers carbon emission reduction, and accelerates the digitalization of various sectors through information and communication technology. The potential for carbon emission reduction in the digital economy is enormous [10,11]. Therefore, it is particularly important to explore the effects of digital transformation on carbon emissions across industries in China, under the background of the goals of carbon peaking and carbon neutrality.
However, existing studies on the relationship between digital transformation and carbon emissions lack relevant research covering all industries of China’s national economy, and there have been few studies analyzing the relationship between digital transformation and carbon emissions using input–output models (IOMs) and even fewer studies carried out from a supply-side perspective. Therefore, this study measured the value added to the digital economy and carbon emission volume of 97 industries classified by the (GB/T 4754-2017) [12] from 1997 to 2018. Secondly, we used the Ghosh input–output model [13] to analyze the impact of industry digital transformation on carbon emissions. Third, we used structural decomposition analysis (SDA) to decompose the carbon emissions of each industry into digital economy labor productivity, employment number, production technology level, and carbon emission intensity in order to identify the main driving factors of carbon emissions in different industries. Fourth, based on the results of the input–output model and the decomposition analysis, this study provides reasonable policy recommendations for carbon emissions reduction in Chinese industries.
This paper is expected to contribute in terms of the following three aspects. First, this study analyzed the relationship between digital transformation and carbon emissions from the supply-side using the input–output model. Replacing the value-added matrix of the four rows (employee compensation, net production tax, fixed capital consumption, and operating surplus) in the input–output table with the value-added matrix of two rows (value added to the digital economy and value added to the nondigital economy), this study used the input–output model to research the carbon emissions induced by value added to the digital economy. Second, this study covered all industries of the Chinese national economy and classified them into 97 industries according to the latest GB/T 4754-2017, released by the National Bureau of Statistics. Previous studies mainly concentrated on specific industries or sectors, but the digital economy has penetrated all industries to varying degrees [14,15], so this study adopted a more comprehensive perspective to research the relationship between digital transformation and carbon emissions. Third, we constructed two indicators, digital economy labor productivity (DP) and induced rate of digital economy carbon emissions, to explore the underlying causes of carbon emissions induced by the digital economy, and to show the carbon emissions induced by the digital economy per unit, respectively. Fourth, we provided value added to the digital economy and input–output tables of 97 industries from 1997–2018.
The rest of this paper is organized as follows. Section 2 presents the literature review. Section 3 describes the methods and data used in this study. Section 4 presents our results on the measurement of value added to the digital economy, induced effects of carbon emissions for digital transformation, and decomposition analysis of carbon emissions. Section 5 provides our conclusions and policy implications.
2. Literature Review
Research on industry carbon emissions often focuses on a specific industry, and input–output analysis (IOA) is a suitable research method for carbon emissions calculation. However, there is limited research on carbon emissions and their effects across all industries, with most focusing on a specific industry, such as the power industry [16,17], industrial sector [18], heating and power industry [19], steel industry [20], and transportation industry [21]. Currently, three main methods exist for calculating CO2 emissions, including life cycle assessment (LCA) [22,23], intergovernmental Panel on Climate Change (IPCC), and input–output analysis (IOA) [24,25,26,27,28]. LCA and IPCC have high data requirements, and the accuracy of the results is difficult to guarantee. In comparison, IOA is more operable, and it can calculate direct and indirect emissions for each industry.
There is relatively few analyses that uses input–output models to study the relationship between digital transformation and carbon emissions, particularly from a supply-side perspective. Existing studies on the factors affecting carbon emissions often use econometric models [29,30,31,32], which cover population [33,34], economics [35], industry [36], space [37], residential consumption [38], and energy consumption [39]. However, research on the relationship between digital transformation and carbon emissions using an input–output model is relatively scarce [40,41,42,43], particularly from a supply-side perspective [44,45,46,47].
Regarding the impact of digital transformation on carbon emissions, there are three viewpoints currently extant in research. The first holds that digital transformation is helpful in reducing carbon emissions. Scholars claim that digital transformation can promote carbon reduction through means such as improving productivity [48], changing management and sales approaches [49], promoting industrial transformation [50], and accelerating human capital accumulation [51]. Gelenbe and Caseau [52] found that digital transformation can reduce energy consumption in industries such as transportation, construction, online learning, and healthcare. The second viewpoint is that digital transformation will exacerbate carbon emissions [53,54]. First, the widespread use of digital products directly increases carbon emissions [55]. Second, digital transformation increases energy consumption through accelerating product updates [56] and transportation, and increasing distribution demands [57]. The third viewpoint is that the relationship between digital transformation and carbon emissions follows a U-shaped pattern [58,59,60]. On the one hand, digital transformation will continuously increase CO2 emissions because of factors such as digital device production [61], increases in energy consumption [62], and electronic waste recycling [63]. On the other hand, digital transformation can decrease carbon emissions by developing more intelligent cities [64], transportation systems [65], smart grids [66], and energy-efficient devices [67]. The opposing effects produce a U-shaped relationship between digital transformation and carbon emissions.
SDA is a decomposition method used for researching the driving factors of carbon emissions through input–output analysis. The commonly used carbon emission decomposition methods include structural decomposition analysis (SDA) and index decomposition analysis (IDA). In general, the advantage of IDA lies in the flexibility of selecting indicators, making it widely used in constructing comprehensive economic energy efficiency indices [68,69]. The uniqueness of SDA lies in its usability for different IO models, like the traditional Leontief I-O model, the semi-closed I-O model [70], the Ghosh I-O model [71,72], and various multiregional I-O models. In recent years, the SDA decomposition method has been widely applied to decomposing the driving factors of carbon emissions in different countries, such as Italy [73], China [74], Belt and Road Initiative countries [75], G20 countries [76], the UK [77], South Korea [78], and the EU [79]. For the driving factors of carbon emissions, most studies have analyzed the impact of structure and technology changes on energy use from the demand side. Yuan and Zhao [80] decomposed emission changes into emission intensity, technology, and demand effects. Wei et al. [81] decomposed emission changes into technology, sectoral links, economic structure, and economic scale. Xu et al. [82] believed that emission changes were caused by import and export effects, energy structure and intensity effects, technology effects, transfer effects, and investment effects. Yu et al. [83] decomposed carbon emissions from the perspectives of input structure, energy intensity, structural effects, and final demand effects.
In summary, in terms of research scope, few researchers have studied the relationship between digital transformation and carbon emissions in all industries in China. In terms of research methods, input–output models are used less frequently than econometric models, even though input–output models have been proven to be a more suitable research method. In terms of research perspectives, there are few studies that have explored the relationship between digital transformation and carbon emissions from the supply-side perspective, as opposed to the demand side. This article used the Ghosh input–output model to study the induced effects of digital transformation on carbon emissions from 97 industries from 1997 to 2018.
3. Materials and Methods
3.1. Ghosh Model
The Ghosh model [13] was developed as a supplement to the Leontief model. Its basic form is:
In Equation (1), is the row vector of value added, is the total output, and is a suitable unitary vector. is the direct output coefficient, representing the distribution of outputs of the original sectors. is the Ghosh inverse matrix, and it presents the total output of downstream departments caused by 1 unit of initial input entering the production system.
This paper built an environment of the extended Ghosh model by combining the carbon emission satellite account indicator Q with the Ghosh model. Let denote the carbon emission intensity vector for each industry sector then can be defined as:
Carbon emission intensity for each department represents the carbon emissions generated by the production of one unit of output in each industry sector. The element . Therefore, by applying to the entire economic system, the carbon emissions of each industry sector can be expressed as:
The equation above shows that the carbon emissions of each industry sector can be linked to its income through the Ghosh model. Here, Gq denotes the emission effect of the inputs of each sector and refers to the direct and indirect carbon emissions generated by the initial input of each sector through the entire economic system. It can be represented in matrix form as:
represents the diagonalized matrix of the initial inputs, while represents the carbon emission intensity, and its elements represent the amount of carbon emissions per unit output produced by each sector.
Taking sector as an example, in terms of the results, the row direction represents the carbon emissions generated by sector ’s initial inputs. Each column of the first row represents the carbon emissions generated in all the sectors connected to sector initial inputs, generated after running through the entire economic system. In terms of column direction, each row of the first column represents the carbon emissions generated by sector , initiated by all sectors’ initial inputs.
This study mainly examined the carbon emissions generated by digital value added from various industry sectors. Thus, we chose the sum of each industry sector’s rows to represent the carbon emissions generated by their digital value added.
Therefore, the carbon emissions generated by the digital value added of sector can be represented as:
In order to study the socioeconomic driving factors of changes in the amount of carbon emissions, the in Equation (5) was decomposed into the following two influencing factors: digital economy labor productivity (D) and employment number (E). The SDA model was used to decompose the changes in carbon emissions Q into the sum of various factors, namely:
Among them, and represent the contribution of digital economy labor productivity, employment number, production technology level, and carbon emission intensity to the change incarbon emissions when other variables remained unchanged.
3.2. Input–Output Tables for 97 Industries
The 97 industries input–output table is a modification of the 42 industries input–output table [84], compiled by the Chinese Industrial Ecology Laboratory (IELab). The refinement of the industry classification standards from 42 to 97 industries enabled the development of the 97 industries input–output table. Harmonized matrix methods were used for industry adjustments in the intermediate-use matrix (T), final-use matrix (Y), and initial-input matrix (V) in the input–output table. In this paper, the employment structures of the 97 industries were selected as the proxies for matrices T, Y, and V. The assumption underlying the selection of the employment structures of the 97 industries as proxies for matrices T, Y, and V was that the employment structure was consistent with the industry division classification structure of T, Y, and V within the industry section. This assumption was reasonable for two reasons. First, in the absence of data for industry division, employment was the closest available indicator in proximity to the intermediate-use, final-use, and initial-input measures. Second, this assumption did not change the industry section structure of the T, Y, and V matrices. The use of the employment structure for industry classification as based on the original data of different industry sections as the control total, which avoided the change of the original industry section structure.
3.3. Measurement of Industry Value Added to the Digital Economy
According to the practice of the China Academy of Information and Communications Technology (CAICT), this paper divided the national economy into the basic industries of the digital economy and the convergent industries of the digital economy. Combining the selection of the digital economy’s basic industries by BEA [85], this paper specified six industries for the basic industries of the digital economy by the GB/T 4754-2017 standard: computer, communication, and other electronic equipment manufacturing industries (39) (the numbers represent the industry division codes in Table A1 of Appendix A); telecommunications, broadcasting, television, and satellite transmission services (63); internet and related services (64); software and information technology services industry (65); and radio, television, film, and video production industry (87). The convergent industries of the digital economy were the industries other than the basic industries.
According to whether each industry belonged to the basic industries of the digital economy or the convergent industries of the digital economy, this paper divided the acquisition methods of the digital economy’s value added into two types. The value added of the nondigital economy in that industry was the total value added of the industry minus the value added of the digital economy in that industry. The first method of acquiring the value added to the digital economy of the industry is to use the scale of the national digital economy’s basic part as the control total. According to the industry’s digital economy scale distribution structure under the BEA framework, the value added to the digital economy is allocated. The scale of the national digital economy’s basic part can be directly or indirectly obtained from the relevant data released by the CAICT. The accounting of the industry’s digital economy scale under the BEA framework refers to the accounting framework of the BEA. The second method of acquiring the value added to the digital economy of the industry is to use the scale of the national convergent part of the digital economy as the control total. Based on the distribution structure of information and communications technology (ICT) capital services, the value added to the digital economy of the industry is allocated. The scale data of the national convergent part of the digital economy can be directly or indirectly obtained from the relevant data released by the CAICT. The ICT capital service value added of the industry is calculated by multiplying the industry value added by the proportion of the ICT capital service to the total capital service. The value of industry value added is provided by the 97 industries input–output table. According to Wang an Wang [86], the proportion of ICT capital services in the total capital services was calculated.
3.4. Measurement of Industry Carbon Emissions
The industry carbon emissions data in this paper were from the Carbon Emission Accounts and Datasets (CEADs) in China [87,88,89], which provides carbon emissions data categorized by industry in the National Industry Classification (GB/T 4754-2011) [90] standard, with 47 industries. To unify the data of industry value added to the digital economy, this paper adjusted the industry carbon emission data to the 97 industry classifications in the National Industry Classification (GB/T 4754-2017) standard.
3.5. Indicator Construction
3.5.1. Digital Economy Labor Productivity
This paper constructed the digital economy labor productivity (DP) to measure the amount of value added to the digital economy (DV) produced by each employed labor (L). The higher the DP, the more DV each employed labor produces and vice versa. The expression of DP is shown as Equation (7):
3.5.2. Induced Rate of Digital Economy Carbon Emissions
This paper built the induced rate of digital economy carbon emissions (IR), which refers to the carbon emissions (CE) induced by one unit of DV in the Ghosh model. The IR represents the carbon emissions induced by one unit of DV in downstream production processes. The higher the IR, the greater the carbon emissions induced by the input of the digital economy, and the weaker the carbon reduction ability of the digital economy.
The expression of IR is shown as Equation (8):
4. Results
4.1. Value Added to the Digital Economy in Different Industries
4.1.1. National Value Added to the Digital Economy
In this chapter, the scale of the digital economy from 1997 to 2018, and its proportion of GDP, were calculated using data from the CAICT on the proportion of the digital economy to GDP and the GDP data released by the National Bureau of Statistics (Table 1). The proportions of the digital economy’s basic and integrated parts to the total scale of the digital economy were also calculated.

Table 1.
The scale and structure of China’s digital economy from 1997 to 2018 (1997 = 100) (1997 = 100 indicates that the price index was based on 1997).
From 1997 to 2018, China’s overall digital economy scale, basic part scale, and integrated part scale showed a rapidly increasing trend, with the integrated part’s annual growth rate being higher than the basic part. From 1997 to 2018, China’s digital economy scale increased rapidly from CNY 51.4 billion to CNY 16,983.3 billion, with an average annual growth rate of 31.8%, and its proportion to GDP increased from 0.6% to 34.8%. In 21 years, the basic part of the digital economy increased from CNY 25.3 billion to CNY 3481.6 billion, at an average annual growth rate of 26.4%; the integrated part of the digital economy increased from CNY 26.1 billion to CNY 13,501.8 billion, at an average annual growth rate of 34.7%. The proportion of the basic part to the total scale of the digital economy showed an upward trend from 49.2% in 1997 to 50.9% in 2005, then decreased to 20.5% in 2018. The proportion of the integrated part to the total scale of the digital economy showed the opposite trend.
4.1.2. Digital Economy Scale in Different Industries
This chapter distributed the basic and integrated digital economy components of each year based on the scale distribution structure of the digital economy in various industries under the BEA (Barefoot et al., 2018) accounting framework and the value-added distribution structure of each industry’s ICT capital services. This resulted in a digital economy scale for 20 industries from 1997 to 2018 (Because of space limitations, this paper combined the data of 97 industry divisions into 20 industry sections, and only shows the data of 20 industry sections) (Figure 1).
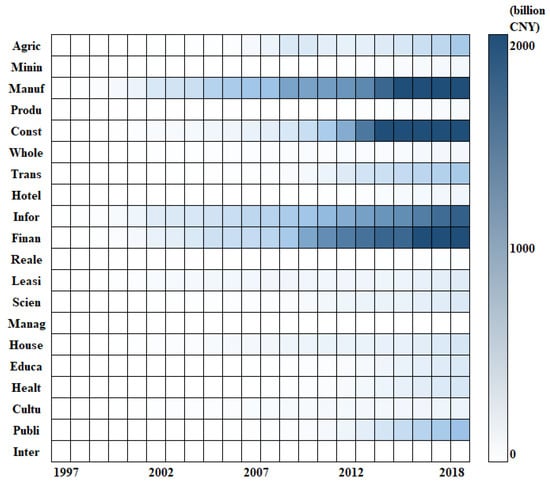
Figure 1.
China’s industry value added to the digital economy from 1997 to 2018 (The full names of the 20 industry sections and 97 industry divisions are shown in Table A1 of Appendix A) (1997 = 100).
Looking at the absolute value of the digital economy scale, manufacturing (Manuf) (limiting the space for images, we used the abbreviation instead of the full name of each industry; the abbreviation is the first three or four letters of the full name. Abbreviations and full names are presented in Table A1 of Appendix A) has remained at a high level, reaching CNY 3168.2 billion in 2018, accounting for 18.7% of the total digital economy scale that year. Other industries with large digital economy scales included construction (Const) and financial intermediation (Finan), both of which had a scale of over CNY 2000 billion in 2018. Excluding international organizations (Inter), the industry with the smallest digital economy scale was management of water conservancy, environment, and public facilities (Manag), with a digital economy scale of CNY 2.2 billion in 2018, accounting for 0.01% of the total digital economy scale that year.
Looking at digital economy scale growth rates, the digital economy scale growth rate of each industry was rapid, with the annual growth rate between 20% and 60% from 1997 to 2018. The national digital economy scale’s average annual growth rate was 31.8%, with 14 of the 20 industries having an average annual growth rate above this level. The industry with the fastest digital economy scale growth rate was the real estate industry (RealE), with an average annual growth rate of 55.6%. Other industries experiencing rapid growth in digital economy scale included international organization (Inter); public management, social security, and social organization (Publi); and health and social services (Healt), all with average annual growth rates above 50%. Industries with relatively slower annual growth rates included leasing and business services (Leasi) and culture, sports, and entertainment (Cultu), with annual growth rates below 25%.
4.2. Carbon Emissions Induced by the Digital Economy
With the help of the carbon emission extended Ghosh input–output model, this paper calculated the carbon emissions induced by the digital economy in various industries (referred to as DCE) from 1997 to 2018 (Figure 2) (because of space limitations, we placed the carbon emissions induced by the digital economy of 97 industries in the Supplementary Materials). Financial (Finan) and manufacturing (Manuf) have consistently maintained high levels of DCE. In 2018, the DCE in the financial (Finan) and manufacturing (Manuf) industries accounted for 32.9% and 20.7% of all industries’ digital carbon emissions, respectively. Transport, storage, and post (Trans) was also relatively high, with DCE exceeding 300 million tons of CO2 in 2018, accounting for 11.8% of all industries. From 1990 to 2018, the DCE in all industries maintained high-speed growth, with an average annual growth rate of 40.2%. Among them, the real estate industry (RealE) had the fastest average annual growth rate, reaching 64.5%.
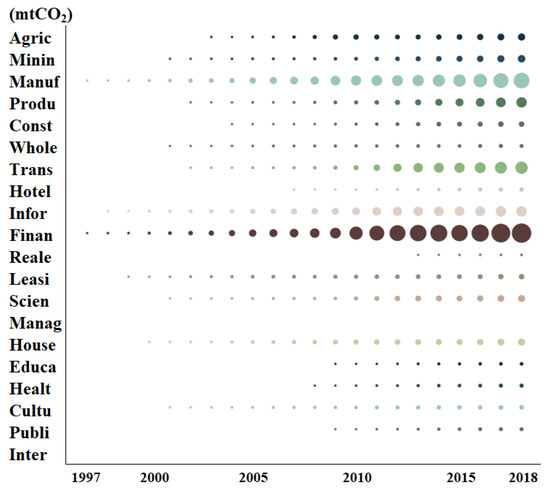
Figure 2.
Carbon emissions induced by the digital economy of 20 industries in China from 1997 to 2018. mtCO2 denotes one million tons of CO2. (Different colors indicate different industries, and larger circles indicate larger values).
The trends of DCE varied from industry to industry. The DCE of agriculture, forestry, animal husbandry, and fishery (Agric) fell in 2010, probably because 2010 was a key year for achieving the Eleventh Five-Year Plan’s energy conservation and emission reduction goals, and agriculture, forestry, animal husbandry, and fishery (Agric), as a key industry for carbon emissions, vigorously promoted digital transformation, eliminated poor general production capacity, actively promoted the development and promotion of energy-saving technologies, and reduced the growth rate of DCE.
The DCE of the second industry, mining (Minin) and production and supply of electricity, heat, gas, and water (Produ) is increasing year by year. On the one hand, the energy consumption of secondary industry is relatively high, and some enterprises have insufficient motivation for energy conservation and emissions reduction or have been unable to bear the cost of the surge in digital transformation for energy conservation and emissions reduction [91]. On the other hand, because of China’s immature digital transformation, it is difficult to transform traditional technologies into digital emissions reduction technologies, and there are obstacles such as insufficient innovation and low efficiency. The ability to achieve digital carbon emissions reduction needs to be further improved [92].
The DCE of tertiary industry, represented by leasing and business services (Leasi), scientific research and technical services (Scien); household services, repair, and other services (House); and culture, sports, and entertainment (Cultu), showed a decreasing trend from 2011 to 2015. This may have been because during the Twelfth Five-Year Plan period, China vigorously developed the service industry and strategic emerging industries, took energy conservation and emissions reduction as the starting point for transforming the mode of economic development, and implemented a number of energy conservation and emissions reduction measures, such as actively promoting residential electricity and water ladder prices and implementing heat metering and charging; strengthening energy conservation and emissions reductions in agricultural and rural, commercial and civil, and public institutions; and encouraging financial institutions to provide credit support for energy conservation, emissions reduction, and low-carbon projects.
Figure 3 displays the induced rate of digital economy carbon emissions (IR) for 20 industries using a heat map, where darker colors indicate a higher IR. The IR refers to the amount of carbon emissions per unit of DV and can be used to analyze the reasons for different DCE values in each industry.
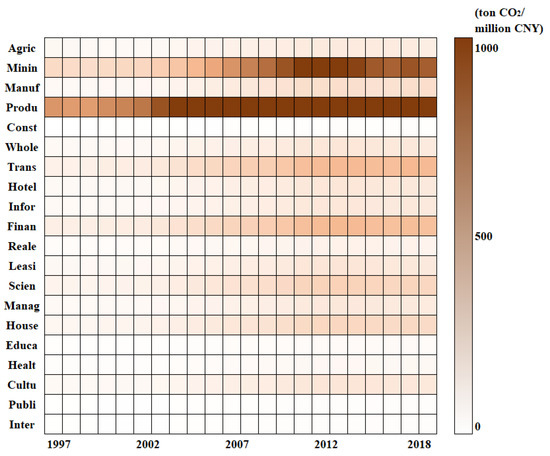
Figure 3.
Induced rate of digital economy carbon emissions for 20 industries in China from 1997 to 2018.
The IR for production and supply of electricity, heat, gas, and water (Produ) remains high, followed by mining (Minin) and transport, storage, and post (Trans). In 2018, the IR values for production and supply of electricity, heat, gas, and water (Produ); mining (Minin); and transport, storage, and post (Trans) were 2552.3, 856.6, and 432.0 tons CO2 per million CNY, respectively. The IR for the construction (Const), which had the lowest value, was only 11.8 tons CO2 per million CNY. The three industries with high IR values were all of the energy consumption type. Therefore, to achieve the goals of carbon peaking and carbon neutrality, we must focus on the IR of energy consumption type industries. This could be achieved through considering three aspects: First, clean energy using digital technologies, such as big data, artificial intelligence, and cloud computing, should be developed, and it should be applied to industry energy conservation and emissions reductions [93]. Second, a mining environmental supply chain network using digital technologies, such as big data and blockchain, should be designed, reducing carbon emissions throughout the supply chain process [94]. Third, energy consumption structures should be adjusted by formulating policies that encourage the use of clean energy. Research and development of renewable energy power generation technology, energy storage technology, etc., should be conducted to substantially increase the proportion of nonfossil energy use, and a new type of renewable energy-based power system should be built as early as possible [95].
4.3. Driving Factors of Carbon Emission Changes
In this paper, the SDA method was used to decompose carbon emission changes into four factors: digital economic labor productivity (DP), employment number, production technology level, and carbon emission intensity (Figure 4). Among them, the product of DP and employment number was the DV, and the industry level employment data in each year were from Wang et al. [96].
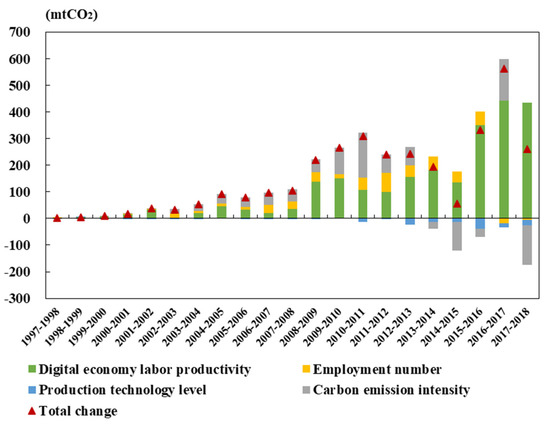
Figure 4.
Structural decomposition analysis of carbon emissions induced by the digital economy.
The change in carbon emissions caused by DP was found to be basically positive; the change in carbon emissions caused by employment number was negative after 2016; the change in carbon emissions caused by the production technology level was basically negative, and the change in carbon emissions caused by carbon emission intensity was basically negative after 2013. For the factor of DP, one of the important reasons for the gradual improvement in carbon emissions was the introduction of a large amount of automation equipment (i.e., industrial robots), which increased energy consumption and pollutant emissions which, in turn, led to an increase in carbon emissions [97,98,99].
For the factor of employment number, the commuting of employees [100,101], production process [102,103], and consumption [104,105], among other links, produce carbon emissions, but with the decline in employment in recent years, the rise of online offices, the rise of paperless offices, etc., the change in carbon emissions caused by the employment number has changed from positive to negative. For the factor of the production technology level, the improvement in the production technology level can promote carbon emission reductions while comprehensively improving productivity, indicating that China is persistently promoting ecological priorities, conservation, and intensification and green and low-carbon development. For the factor of carbon emission intensity, its impact on carbon emission changes has been negative since 2013, indicating that carbon emissions caused by the unit digital economy have begun to decrease. China has undertaken a series of measures towards low-carbon development commitments, launched the 2010 China Information and Communication Industry to Promote Low-Carbon Economic Development Summit Forum, and announced the adoption of low-carbon development measures for the information and communication industry.
From the above analysis, it is clear that DP is a major driver of carbon emissions. Therefore, further analysis was conducted on the carbon emissions induced by DP in different industries (Figure 5).
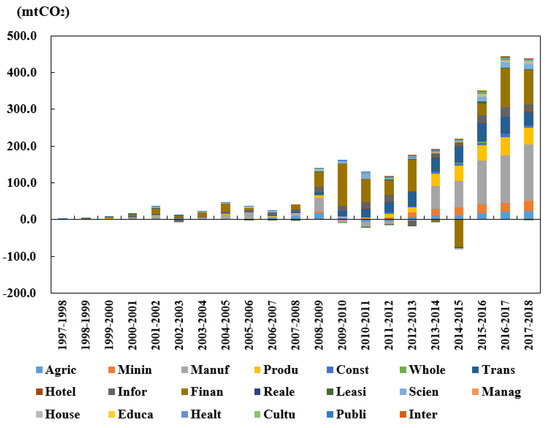
Figure 5.
Carbon emissions induced by digital economy labor productivity (mtCO2).
The carbon emissions induced by DP in manufacturing (Manuf) and financial intermediation (Finan) were found to be relatively high. In 2018, the carbon emissions induced by DP in manufacturing (Manuf) and financial intermediation (Finan) were 152.2 and 91.8 mt, accounting for 35.0% and 21.1% of all industries, respectively. The relatively high levels of carbon emissions induced by DP in manufacturing (Manuf) were because of the substitution of human workers with machines [106,107]; an increasing amount of machinery and equipment will lead to increasing energy consumption and pollutant emissions. For financial intermediation (Finan), most of the carbon emissions induced by DP came from indirect carbon emissions. Indirect carbon emissions from the financial intermediation (Finan) flow from financial intermediation (Finan) to other industries through the industrial chain and supply chain, such as investment and financing businesses [108], carbon market trading, and carbon financial derivatives [109]. From 2014 to 2015, the carbon emissions induced by DP in financial intermediation (Finan) were negative, which may have been because carbon finance began to develop in 2014; 2015 was the first year of carbon finance, when several carbon financial products involving asset management entered the market one after another. These products can effectively help enterprises scientifically manage carbon assets and achieve reasonable financing, leading to carbon emission reductions while improving DP.
5. Conclusions
The 20th Communist Party of China National Congress Report highlighted the need to actively and steadily promote carbon peaking and carbon neutrality. As a new engine for high-quality development, digital transformation has brought about wide-ranging economic and social changes and has become a crucial means of promoting low-carbon transformation across all industries by balancing industrial and economic development with carbon peaking and carbon neutrality. This paper calculated the induced effects of China’s industry digital transformation on carbon emissions from 1997 to 2018 and explored the driving factors behind carbon emissions.
This paper presents the following four findings. First, between 1997 and 2018, the DV in manufacturing (Manuf), construction (Const), and financial intermediation (Finan) remained at a high level, with the average annual growth rate of DV in all industries ranging from 20% to 60%. Second, from 1997 to 2018, the trend in DCE in different industries varied. Among them, the DCE of primary industry decreased in 2010, those from secondary industry showed an increasing trend year by year, and those from tertiary industry showed a decreasing trend from 2011 to 2015. Third, the induced rate of digital economy carbon emissions (IR) for energy consumption industries was found to be relatively high, which could be addressed by developing clean energy, designing environmentally friendly supply chain networks, and adjusting energy consumption structures. Fourth, the decomposition of carbon emission drivers showed that the digital economy labor productivity (DP) has not yet shown a promoting effect on carbon emission reductions.
Based on the results of this paper, the following policy recommendations are proposed. First, different carbon reduction policies and objectives should be formulated for different types of industries. As can be seen from the above results, there were years when DCE began to decline and the IR also varied among different types of industries. Therefore, it is crucial to issue relevant policies to achieve the goals of carbon peaking and carbon neutrality quickly and effectively. Second, China should strengthen the construction of a digital platform for ecological environment governance, unify data standards and technical specifications across industries, break down technical barriers caused by monopolistic behavior of data platforms, and lay out a digital green technology ecosystem around existing key core technologies. Third, we should build a green and low-carbon industrial chain and supply chain. Under the “chain era”, all departments are closely interrelated; therefore, carbon emission accounting standards, labeling systems, and traceability mechanisms should be established along the industrial chain and supply chain, and a mechanism for sharing responsibility for emission reductions between departments should be formed on this basis to strengthen the coordinated emission reductions of multiple departments.
This study had some limitations. First, because of space constraints, we were unable to display the complete charts for all 97 industry divisions in the main text. Second, because of the availability of carbon emissions data, our research only covered the years 1997–2018. We included the complete data for the DCE of all 97 industry divisions in the Supplementary Materials and hope that future research will update the time span of the study.
Supplementary Materials
The following supporting information can be downloaded at: https://www.mdpi.com/article/10.3390/su151612170/s1, Table S1: Carbon emissions induced by the digital economy of 97 industry divisions in China from 1997 to 2018 (mtCO2).
Author Contributions
Conceptualization, X.J.; methodology, X.J.; data curation, J.F.; software, J.F.; writing—original draft, Q.L.; writing—review and editing, X.J.; visualization, Y.L.; supervision, L.Z.; project administration, L.Z. All authors have read and agreed to the published version of the manuscript.
Funding
Study on the long-term mechanism of integrating socialist core values into poverty alleviation. The approval number is 20VHJ005.
Informed Consent Statement
Informed consent was obtained from all subjects involved in the study.
Data Availability Statement
All data can be obtained by email from the corresponding author.
Acknowledgments
Thanks to the Chinese Industrial Ecology Laboratory (IELab) for providing the input–output table.
Conflicts of Interest
The authors declare no conflict of interest.
Appendix A
Table A1.
Industry sections and names of 97 industry divisions.
Table A1.
Industry sections and names of 97 industry divisions.
| Code | Abbr. | Industry Section | Code | Industry Division |
|---|---|---|---|---|
| A | Agric | Agriculture, Forestry, Animal Husbandry, and Fishery | 1 | Agriculture |
| 2 | Forestry | |||
| 3 | Animal Husbandry | |||
| 4 | Fishery | |||
| 5 | Agricultural, Forestry, Animal Husbandry, Fishery Specialized and Support Activities | |||
| B | Minin | Mining | 6 | Coal Mining, Washing Industry |
| 7 | Petroleum, and Natural Gas Extraction Industry | |||
| 8 | Ferrous Metal Ore Mining and Dressing Industry | |||
| 9 | Nonferrous Metal Ore Mining and Dressing Industry | |||
| 10 | Nonmetal Mining and Dressing Industry | |||
| 11 | Mining Specialized and Support Activities | |||
| 12 | Other Mining Industries | |||
| C | Manuf | Manufacturing | 13 | Agricultural and Sideline Food Processing Industry |
| 14 | Food Manufacturing Industry | |||
| 15 | Wine, Beverage and Refined Tea Manufacturing Industry | |||
| 16 | Tobacco Products Industry | |||
| 17 | Textile Industry | |||
| 18 | Textile, Clothing and Apparel Industry | |||
| 19 | Leather, Fur, Feather and Their Product, and Shoe Manufacturing Industry | |||
| 20 | Wood Processing and Bamboo, Rattan, Palm, Grass, and Straw Products Industry | |||
| 21 | Furniture Manufacturing Industry | |||
| 22 | Paper and Paper Products Industry | |||
| 23 | Printing and Recordable Media Reproduction Industry | |||
| 24 | Cultural, Educational, and Sporting Goods Manufacturing Industry | |||
| 25 | Petroleum, Coal, and Other Fuel Processing Industry | |||
| 26 | Chemical Materials and Chemical Product Manufacturing Industry | |||
| 27 | Pharmaceutical manufacturing | |||
| 28 | Chemical Fiber Manufacturing Industry | |||
| 29 | Rubber and Plastic Products Industry | |||
| 30 | Nonmetal Mineral Products Industry | |||
| 31 | Ferrous Metal Smelting and Pressing Industry | |||
| 32 | Nonferrous Metal Smelting and Pressing Industry | |||
| 33 | Metal Product Industry | |||
| 34 | General Equipment Manufacturing Industry | |||
| 35 | Specialized Equipment Manufacturing Industry | |||
| C | Manuf | Manufacturing | 36 | Automobile Manufacturing Industry |
| 37 | Railway, Shipbuilding, Aerospace, and Other Transportation Equipment Manufacturing Industry | |||
| 38 | Electrical Machinery and Equipment Manufacturing Industry | |||
| 39 | Computer, Communication, and Other Electronic Equipment Manufacturing Industry | |||
| 40 | Instrumentation Manufacturing Industry | |||
| 41 | Other Manufacturing Industries | |||
| 42 | Comprehensive Utilization of Waste Resources Industry | |||
| 43 | Metal Product, Machinery, and Equipment Repair Industry | |||
| D | Produ | Production and Supply of Electricity, Heat, Gas and Water | 44 | Electricity, Heat Production, and Supply Industry |
| 45 | Gas Production and Supply Industry | |||
| 46 | Water Production and Supply Industry | |||
| E | Const | Construction | 47 | House Construction Industry |
| 48 | Civil Engineering Construction Industry | |||
| 49 | Construction Installation Industry | |||
| 50 | Building Decoration, Finishing, and Other Building Industries | |||
| F | Whole | Wholesale and Retail Trades | 51 | Wholesale Industry |
| 52 | Retail Industry | |||
| G | Trans | Transport, Storage, and Post | 53 | Railway Transportation Industry |
| 54 | Road Transportation Industry | |||
| 55 | Water Transportation Industry | |||
| 56 | Aviation Transportation Industry | |||
| 57 | Pipeline Transportation Industry | |||
| 58 | Multimodal Transportation and Transportation Agency Industry | |||
| 59 | Loading and Unloading, Handling, and Storage Industry | |||
| 60 | Postal Industry | |||
| H | Hotel | Hotels and Catering Services | 61 | Accommodation Industry |
| 62 | Catering Industry | |||
| I | Infor | Information Transmission, Software, and Information Technology | 63 | Telecommunications, Broadcasting, Television, and Satellite Transmission Services |
| 64 | Internet and Related Services | |||
| 65 | Software and Information Technology Services Industry | |||
| J | Finan | Financial Intermediation | 66 | Currency and Financial Services |
| 67 | Capital Market Services | |||
| 68 | Insurance Industry | |||
| 69 | Other Financial Industries | |||
| K | RealE | Real Estate Industry | 70 | Real Estate Industry |
| L | Leasi | Leasing and Business Services | 71 | Leasing Industry |
| 72 | Business Service Industry | |||
| M | Scien | Scientific Research and Technical Services | 73 | Research and Experimental Development |
| 74 | Professional Technical Services | |||
| 75 | Science and Technology Promotion and Application Services | |||
| N | Manag | Management of Water Conservancy, Environment and Public Facilities | 76 | Water Conservancy Management Industry |
| 77 | Ecological Protection and Environmental Governance Industry | |||
| 78 | Public Facility Management Industry | |||
| 79 | Land Management Industry | |||
| O | House | Household Services, Repair and Other Services | 80 | Residential Service Industry |
| 81 | Motor Vehicle, Electronic Product, and Daily Product Repair Industry | |||
| 82 | Other Services Industry | |||
| P | Educa | Education | 83 | Education |
| Q | Healt | Health and Social Service | 84 | Healthcare |
| 85 | Social Assistance | |||
| R | Cultu | Culture, Sports, and Entertainment | 86 | News and Publishing Industry |
| 87 | Radio, Television, Film, and Video Production Industry | |||
| 88 | Culture and Art Industry | |||
| 89 | Sports Industry | |||
| 90 | Entertainment Industry | |||
| S | Publi | Public Management, Social Security, and Social Organization | 91 | Organs of the Communist Party of China |
| 92 | National Institutions | |||
| 93 | People’s Political Consultative Conference and Democratic Parties | |||
| 94 | Social Security | |||
| 95 | Mass Organizations, Social Organizations, and Other Member Organizations | |||
| 96 | Grassroots Mass Self-Government Organizations and Other Organizations | |||
| T | Inter | International Organization | 97 | International Organizations |
References
- Chen, M.; Cui, Y.; Jiang, S.; Forsell, N. Toward Carbon Neutrality Before 2060: Trajectory and Technical Mitigation Potential of Non-CO2 Greenhouse Gas Emissions from Chinese Agriculture. J. Clean. Prod. 2022, 368, 133186. [Google Scholar] [CrossRef]
- Lin, J.; Nie, J.; Wang, T.; Yue, X.; Cai, W.; Liu, Y.; Zhang, Q. Towards Carbon-Neutral Sustainable Development of China. Environ. Res. Lett. 2023, 18, 060201. [Google Scholar] [CrossRef]
- Huo, T.; Du, Q.; Xu, L.; Shi, Q.; Cong, X.; Cai, W. Timetable and Roadmap for Achieving Carbon Peak and Carbon Neutrality of China’s Building Sector. Energy 2023, 274, 127330. [Google Scholar] [CrossRef]
- Yu, Y.; Shi, C.; Guo, J.; Pang, Q.; Deng, M.; Na, X. To What Extent Can Clean Energy Development Advance the Carbon Peaking Process of China? J. Clean. Prod. 2023, 412, 137424. [Google Scholar] [CrossRef]
- Yan, Y.; Li, J.; Xu, Y.; Zhang, Y. Research on Industry Difference and Convergence of Green Innovation Efficiency of Manufacturing Industry in China Based on Super-Sbm and Convergence Models. Math. Probl. Eng. 2021, 2021, 4013468. [Google Scholar] [CrossRef]
- Zheng, H.; Gao, X.; Sun, Q.; Han, X.; Wang, Z. The Impact of Regional Industrial Structure Differences on Carbon Emission Differences in China: An Evolutionary Perspective. J. Clean. Prod. 2020, 257, 120506. [Google Scholar] [CrossRef]
- Yang, J.; Zou, R.; Cheng, J.; Geng, Z.; Li, Q. Environmental Technical Efficiency and its Dynamic Evolution in China’s Industry: A Resource Endowment Perspective. Resour. Policy 2023, 82, 103451. [Google Scholar] [CrossRef]
- Chen, C.; Ye, F.; Xiao, H.; Xie, W.; Liu, B.; Wang, L. The Digital Economy, Spatial Spillovers and Forestry Green Total Factor Productivity. J. Clean. Prod. 2023, 405, 136890. [Google Scholar] [CrossRef]
- Lv, Z. The Impact of Digital Economy on Middle-Income Groups: An Empirical Study in China. Int. Bus. Econ. Stud. 2023, 5, 70. [Google Scholar] [CrossRef]
- Wang, L.; Chen, L. Impacts of Digital Economy Agglomeration on Carbon Emission: A Two-Tier Stochastic Frontier and Spatial Decomposition Analysis of China. Sustain. Cities Soc. 2023, 95, 104624. [Google Scholar] [CrossRef]
- Wu, J.; Zhao, R.; Sun, J. What Role Does Digital Finance Play in Low-Carbon Development? Evidence From Five Major Urban Agglomerations in China. J. Environ. Manag. 2023, 341, 118060. [Google Scholar] [CrossRef] [PubMed]
- GB/T 4754-2017; National Economic Industry Classification. National Bureau of Statistics; China National Institute of Standardization: Beijing, China, 2017.
- Ghosh, A. Input-Output Approach in an Allocation System. Economica 1958, 25, 58–64. [Google Scholar] [CrossRef]
- Meng, F.; Zhao, Y. How Does Digital Economy Affect Green Total Factor Productivity at the Industry Level in China: From a Perspective of Global Value Chain. Environ. Sci. Pollut. Res. 2022, 29, 79497–79515. [Google Scholar] [CrossRef]
- Ran, Q.; Yang, X.; Yan, H.; Xu, Y.; Cao, J. Natural Resource Consumption and Industrial Green Transformation: Does the Digital Economy Matter? Resour. Policy 2023, 81, 103396. [Google Scholar] [CrossRef]
- Wang, F.; Shackman, J.; Liu, X. Carbon Emission Flow in the Power Industry and Provincial CO2 Emissions: Evidence from Cross-Provincial Secondary Energy Trading in China. J. Clean. Prod. 2017, 159, 397–409. [Google Scholar] [CrossRef]
- Xian, Y.; Wang, K.; Shi, X.; Zhang, C.; Wei, Y.; Huang, Z. Carbon Emissions Intensity Reduction Target for China’s Power Industry: An Efficiency and Productivity Perspective. J. Clean. Prod. 2018, 197, 1022–1034. [Google Scholar] [CrossRef]
- Yu, S.; Hu, X.; Fan, J.; Cheng, J. Convergence of Carbon Emissions Intensity Across Chinese Industrial Sectors. J. Clean. Prod. 2018, 194, 179–192. [Google Scholar] [CrossRef]
- Ling, Y.; Xia, S.; Cao, M.; He, K.; Lim, M.K.; Sukumar, A.; Yi, H.; Qian, X. Carbon Emissions in China’s Thermal Electricity and Heating Industry: An Input-Output Structural Decomposition Analysis. J. Clean. Prod. 2021, 329, 129608. [Google Scholar] [CrossRef]
- Xin, H.; Wang, S.; Chun, T.; Xue, X.; Long, W.; Xue, R.; Zhang, R. Effective Pathways for Energy Conservation and Emission Reduction in Iron and Steel Industry Towards Peaking Carbon Emissions in China: Case Study of Henan. J. Clean. Prod. 2023, 399, 136637. [Google Scholar] [CrossRef]
- Liu, J.; Li, S.; Ji, Q. Regional Differences and Driving Factors Analysis of Carbon Emission Intensity from Transport Sector in China. Energy 2021, 224, 120178. [Google Scholar] [CrossRef]
- Heinonen, J.; Junnila, S. Implications of Urban Structure on Carbon Consumption in Metropolitan Areas. Environ. Res. Lett. 2011, 6, 014018. [Google Scholar] [CrossRef]
- Wang, R.; Wen, X.; Wang, X.; Fu, Y.; Zhang, Y. Low Carbon Optimal Operation of Integrated Energy System Based on Carbon Capture Technology, Lca Carbon Emissions and Ladder-Type Carbon Trading. Appl. Energy 2022, 311, 118664. [Google Scholar] [CrossRef]
- Deng, Z.; Kang, P.; Wang, Z.; Zhang, X.; Deng, Z. The Impact of Urbanization and Consumption Patterns on China’s Black Carbon Emissions Based on Input-Output Analysis and Structural Decomposition Analysis. Environ. Sci. Pollut. Res. 2021, 28, 2914–2922. [Google Scholar] [CrossRef] [PubMed]
- Lenzen, M. Primary Energy and Greenhouse Gases Embodied in Australian Final Consumption: An Input–Output Analysis. Energy Policy 1998, 26, 495–506. [Google Scholar] [CrossRef]
- Li, Y.L.; Chen, B.; Chen, G.Q. Carbon Network Embodied in International Trade: Global Structural Evolution and its Policy Implications. Energy Policy 2020, 139, 111316. [Google Scholar] [CrossRef]
- Wang, S.; Zhao, Y.; Wiedmann, T. Carbon Emissions Embodied in China–Australia Trade: A Scenario Analysis Based on Input–Output Analysis and Panel Regression Models. J. Clean. Prod. 2019, 220, 721–731. [Google Scholar] [CrossRef]
- Zhu, Q.; Peng, X.; Wu, K. Calculation and Decomposition of Indirect Carbon Emissions from Residential Consumption in China Based on the Input–Output Model. Energy Policy 2012, 48, 618–626. [Google Scholar] [CrossRef]
- Bai, D.; Dong, Q.; Khan, S.A.R.; Li, J.; Wang, D.; Chen, Y.; Wu, J. Spatio-Temporal Heterogeneity of Logistics CO2 Emissions and their Influencing Factors in China: An Analysis Based on Spatial Error Model and Geographically and Temporally Weighted Regression Model. Environ. Technol. Innov. 2022, 28, 102791. [Google Scholar] [CrossRef]
- Huang, J.; Li, X.; Wang, Y.; Lei, H. The Effect of Energy Patents on China’s Carbon Emissions: Evidence from the Stirpat Model. Technol. Forecast. Soc. Change 2021, 173, 121110. [Google Scholar] [CrossRef]
- Li, Z.; Wu, H.; Wu, F. Impacts of Urban Forms and Socioeconomic Factors on CO2 Emissions: A Spatial Econometric Analysis. J. Clean. Prod. 2022, 372, 133722. [Google Scholar] [CrossRef]
- Wang, J.; Rickman, D.S.; Yu, Y. Dynamics Between Global Value Chain Participation, CO2 Emissions, and Economic Growth: Evidence from a Panel Vector Autoregression Model. Energy Econ. 2022, 109, 105965. [Google Scholar] [CrossRef]
- Gao, C.; Tao, S.; He, Y.; Su, B.; Sun, M.; Mensah, I.A. Effect of Population Migration on Spatial Carbon Emission Transfers in China. Energy Policy 2021, 156, 112450. [Google Scholar] [CrossRef]
- Shi, K.; Liu, G.; Cui, Y.; Wu, Y. What Urban Spatial Structure is More Conducive to Reducing Carbon Emissions? A Conditional Effect of Population Size. Appl. Geogr. 2023, 151, 102855. [Google Scholar] [CrossRef]
- Cai, W.; Song, X.; Zhang, P.; Xin, Z.; Zhou, Y.; Wang, Y.; Wei, W. Carbon Emissions and Driving Forces of an Island Economy: A Case Study of Chongming Island, China. J. Clean. Prod. 2020, 254, 120028. [Google Scholar] [CrossRef]
- Wang, Z.; Chen, S.; Cui, C.; Liu, Q.; Deng, L. Industry Relocation or Emission Relocation? Visualizing and Decomposing the Dislocation Between China’s Economy and Carbon Emissions. J. Clean. Prod. 2019, 208, 1109–1119. [Google Scholar] [CrossRef]
- Wu, S.; Hu, S.; Frazier, A.E. Spatiotemporal Variation and Driving Factors of Carbon Emissions in Three Industrial Land Spaces in China From 1997 to 2016. Technol. Forecast. Soc. Chang. 2021, 169, 120837. [Google Scholar] [CrossRef]
- Cao, Q.; Kang, W.; Xu, S.; Sajid, M.J.; Cao, M. Estimation and Decomposition Analysis of Carbon Emissions from the Entire Production Cycle for Chinese Household Consumption. J. Environ. Manag. 2019, 247, 525–537. [Google Scholar] [CrossRef]
- Luo, J.; Gong, Y. Air Pollutant Prediction Based on Arima-Woa-Lstm Model. Atmos. Pollut. Res. 2023, 14, 101761. [Google Scholar] [CrossRef]
- Fang, H.; Jiang, C.; Hussain, T.; Zhang, X.; Huo, Q. Input Digitization of the Manufacturing Industry and Carbon Emission Intensity Based on Testing the World and Developing Countries. Int. J. Environ. Res. Public Health 2022, 19, 12855. [Google Scholar] [CrossRef]
- Li, G.; Liao, F. Input Digitalization and Green Total Factor Productivity Under the Constraint of Carbon Emissions. J. Clean. Prod. 2022, 377, 134403. [Google Scholar] [CrossRef]
- Liu, M.; Wen, J.; Meng, Y.; Yang, X.; Wang, J.; Wu, J.; Chen, H. Carbon Emission Structure Decomposition Analysis of Manufacturing Industry from the Perspective of Input-Output Subsystem: A Case Study of China. Environ. Sci. Pollut. Res. 2022, 30, 19012–19029. [Google Scholar] [CrossRef] [PubMed]
- Wang, J.; Dong, X.; Dong, K. How Digital Industries Affect China’s Carbon Emissions? Analysis of the Direct and Indirect Structural Effects. Technol. Soc. 2022, 68, 101911. [Google Scholar] [CrossRef]
- Lenzen, M.; Murray, J. Conceptualising Environmental Responsibility. Ecol. Econ. 2010, 70, 261–270. [Google Scholar] [CrossRef]
- Rodrigues, J.F.D.; Domingos, T.M.D.; Marques, A.P.S. Carbon Responsibility and Embodied Emissions; Routledge: Abingdon, UK, 2010. [Google Scholar]
- Rodrigues, J.; Domingos, T. Consumer and Producer Environmental Responsibility: Comparing Two Approaches. Ecol. Econ. 2008, 66, 533–546. [Google Scholar] [CrossRef]
- Xu, L.; Chen, G.; Wiedmann, T.; Wang, Y.; Geschke, A.; Shi, L. Supply-Side Carbon Accounting and Mitigation Analysis for Beijing-Tianjin-Hebei Urban Agglomeration in China. J. Environ. Manag. 2019, 248, 109243. [Google Scholar] [CrossRef]
- Moyer, J.D.; Hughes, B.B. Icts: Do they Contribute to Increased Carbon Emissions? Technol. Forecast. Soc. Chang. 2012, 79, 919–931. [Google Scholar] [CrossRef]
- Horner, N.C.; Shehabi, A.; Azevedo, I.L. Known Unknowns: Indirect Energy Effects of Information and Communication Technology. Environ. Res. Lett. 2016, 11, 103001. [Google Scholar] [CrossRef]
- Jiang, D. Transformation and Development of the Coal-Based Energy Industry Under the Goals of Carbon Peaking and Carbon Neutrality. Chin. J. Urban Environ. Stud. 2022, 10, 2250008. [Google Scholar] [CrossRef]
- Xu, Q.; Zhong, M.; Li, X. How Does Digitalization Affect Energy? International Evidence. Energy Econ. 2022, 107, 105879. [Google Scholar] [CrossRef]
- Gelenbe, E.; Caseau, Y. The Impact of Information Technology on Energy Consumption and Carbon Emissions. Ubiquity 2015, 2015, 1–15. [Google Scholar] [CrossRef]
- Andrae, A.; Edler, T. On Global Electricity Usage of Communication Technology: Trends to 2030. Challenges 2015, 6, 117–157. [Google Scholar] [CrossRef]
- Zhou, X.; Zhou, D.; Wang, Q.; Su, B. How Information and Communication Technology Drives Carbon Emissions: A Sector-Level Analysis for China. Energy Econ. 2019, 81, 380–392. [Google Scholar] [CrossRef]
- Belkhir, L.; Elmeligi, A. Assessing Ict Global Emissions Footprint: Trends to 2040 & Recommendations. J. Clean. Prod. 2018, 177, 448–463. [Google Scholar]
- Berkhout, F.; Hertin, J. De-Materialising and Re-Materialising: Digital Technologies and the Environment. Futures 2004, 36, 903–920. [Google Scholar] [CrossRef]
- Meng, C.; Du, X.; Zhu, M.; Ren, Y.; Fang, K. The Static and Dynamic Carbon Emission Efficiency of Transport Industry in China. Energy 2023, 274, 127297. [Google Scholar] [CrossRef]
- Añón Higón, D.; Gholami, R.; Shirazi, F. Ict and Environmental Sustainability: A Global Perspective. Telemat. Inform. 2017, 34, 85–95. [Google Scholar] [CrossRef]
- Yang, Z.; Gao, W.; Han, Q.; Qi, L.; Cui, Y.; Chen, Y. Digitalization and Carbon Emissions: How Does Digital City Construction Affect China’s Carbon Emission Reduction? Sustain. Cities Soc. 2022, 87, 104201. [Google Scholar]
- Zhang, Q.; Wang, Q. Digitalization, Electricity Consumption and Carbon Emissions—Evidence from Manufacturing Industries in China. Int. J. Environ. Res. Public Health 2023, 20, 3938. [Google Scholar] [CrossRef]
- Zhang, W.; Li, H.; Wang, S.; Zhang, T. Impact of Digital Infrastructure Inputs on Industrial Carbon Emission Intensity: Evidence from China’S Manufacturing Panel Data. Environ. Sci. Pollut. Res. 2023, 30, 65296–65313. [Google Scholar] [CrossRef]
- Husaini, D.H.; Lean, H.H. Digitalization and Energy Sustainability in Asean. Resour. Conserv. Recycl. 2022, 184, 106377. [Google Scholar] [CrossRef]
- Hoang, A.Q.; Tue, N.M.; Tu, M.B.; Suzuki, G.; Matsukami, H.; Tuyen, L.H.; Viet, P.H.; Kunisue, T.; Sakai, S.; Takahashi, S. A Review on Management Practices, Environmental Impacts, and Human Exposure Risks Related to Electrical and Electronic Waste in Vietnam: Findings from Case Studies in Informal E-Waste Recycling Areas. Environ. Geochem. Health 2022, 45, 2705–2728. [Google Scholar] [CrossRef]
- Tran, M.; Brand, C. Smart Urban Mobility for Mitigating Carbon Emissions, Reducing Health Impacts and Avoiding Environmental Damage Costs. Environ. Res. Lett. 2021, 16, 114023. [Google Scholar] [CrossRef]
- Chen, X.; Mao, S.; Lv, S.; Fang, Z. A Study on the Non-Linear Impact of Digital Technology Innovation on Carbon Emissions in the Transportation Industry. Int. J. Environ. Res. Public Health 2022, 19, 12432. [Google Scholar] [CrossRef]
- Dorahaki, S.; Rashidinejad, M.; Abdollahi, A.; Mollahassani-pour, M. A Novel Two-Stage Structure for Coordination of Energy Efficiency and Demand Response in the Smart Grid Environment. Int. J. Electr. Power Energy Syst. 2018, 97, 353–362. [Google Scholar] [CrossRef]
- Zhang, R.; Fu, W.; Kuang, Y. Can Digital Economy Promote Energy Conservation and Emission Reduction in Heavily Polluting Enterprises? Empirical Evidence from China. Int. J. Environ. Res. Public Health 2022, 19, 9812. [Google Scholar] [CrossRef] [PubMed]
- Ang, B.W. Monitoring Changes in Economy-Wide Energy Efficiency: From Energy–Gdp Ratio to Composite Efficiency Index. Energy Policy 2006, 34, 574–582. [Google Scholar] [CrossRef]
- Ang, B.W.; Mu, A.R.; Zhou, P. Accounting Frameworks for Tracking Energy Efficiency Trends. Energy Econ. 2010, 32, 1209–1219. [Google Scholar] [CrossRef]
- Zeng, L.; Xu, M.; Liang, S.; Zeng, S.; Zhang, T. Revisiting Drivers of Energy Intensity in China During 1997–2007: A Structural Decomposition Analysis. Energy Policy 2014, 67, 640–647. [Google Scholar] [CrossRef]
- Su, B.; Ang, B.W. Multiplicative Decomposition of Aggregate Carbon Intensity Change Using Input–Output Analysis. Appl. Energy 2015, 154, 13–20. [Google Scholar] [CrossRef]
- Zhang, Y. Supply-Side Structural Effect on Carbon Emissions in China. Energy Econ. 2010, 32, 186–193. [Google Scholar] [CrossRef]
- Ali, Y.; Ciaschini, M.; Socci, C.; Pretaroli, R.; Sabir, M. Identifying the Sources of Structural Changes in CO2 Emissions in Italy. Econ. Politica 2019, 36, 509–526. [Google Scholar] [CrossRef]
- Fan, J.; Cao, Z.; Zhang, X.; Wang, J.; Zhang, M. Comparative Study on the Influence of Final Use Structure on Carbon Emissions in the Beijing-Tianjin-Hebei Region. Sci. Total Environ. 2019, 668, 271–282. [Google Scholar] [CrossRef] [PubMed]
- Lu, Q.; Fang, K.; Heijungs, R.; Feng, K.; Li, J.; Wen, Q.; Li, Y.; Huang, X. Imbalance and Drivers of Carbon Emissions Embodied in Trade Along the Belt and Road Initiative. Appl. Energy 2020, 280, 115934. [Google Scholar] [CrossRef]
- Wang, Y.; Sun, M.; Xie, R.; Chen, X. Multiplicative Structural Decomposition Analysis of Spatial Differences in Energy Intensity Among G20 Countries. Appl. Sci. 2020, 10, 2832. [Google Scholar] [CrossRef]
- Ali, Y.; Pretaroli, R.; Sabir, M.; Socci, C.; Severini, F. Structural Changes in Carbon Dioxide (CO2) Emissions in the United Kingdom (UK): An Emission Multiplier Product Matrix (EMPM) Approach. Mitig. Adapt. Strateg. Glob. Chang. 2020, 25, 1545–1564. [Google Scholar] [CrossRef]
- Zhang, B.; Zhai, G.; Sun, C.; Xu, S. Re-Calculation, Decomposition and Responsibility Sharing of Embodied Carbon Emissions in Sino-Korea Trade: A New Value-Added Perspective. Emerg. Mark. Financ. Trade 2021, 57, 1034–1049. [Google Scholar] [CrossRef]
- Guevara, Z.; Henriques, S.; Sousa, T. Driving Factors of Differences in Primary Energy Intensities of 14 European Countries. Energy Policy 2021, 149, 112090. [Google Scholar] [CrossRef]
- Yuan, R.; Zhao, T. Changes in CO2 Emissions from China’s Energy-Intensive Industries: A Subsystem Input–Output Decomposition Analysis. J. Clean. Prod. 2016, 117, 98–109. [Google Scholar] [CrossRef]
- Wei, J.; Huang, K.; Yang, S.; Li, Y.; Hu, T.; Zhang, Y. Driving Forces Analysis of Energy-Related Carbon Dioxide (CO2) Emissions in Beijing: An Input–Output Structural Decomposition Analysis. J. Clean. Prod. 2017, 163, 58–68. [Google Scholar] [CrossRef]
- Xu, S.; Zhang, L.; Liu, Y.; Zhang, W.; He, Z.; Long, R.; Chen, H. Determination of the Factors that Influence Increments in CO2 Emissions in Jiangsu, China Using the Sda Method. J. Clean. Prod. 2017, 142, 3061–3074. [Google Scholar] [CrossRef]
- Yu, Y.; Hou, J.; Jahanger, A.; Cao, X.; Balsalobre-Lorente, D.; Radulescu, M.; Jiang, T. Decomposition Analysis of China’s Chemical Sector Energy-Related CO2 Emissions: From an Extended SDA Approach Perspective. Energy Environ. 2023, 1–22. [Google Scholar] [CrossRef]
- Wang, Y. An Industrial Ecology Virtual Framework for Policy Making in China. Econ. Syst. Res. 2017, 29, 252–274. [Google Scholar] [CrossRef]
- Asni, A.E.; Muk, B.; Dumancic, K. Defining and Measuring the Digital Economy in Croatia. In Proceedings of the International Conference on the Economics of Decoupling (ICED), Zagreb, Croatia, 30 November–1 December 2019. [Google Scholar]
- Wang, C.; Wang, Y. Accounting of ICT Capital Services at the Industry Level in China. Stat. Res. 2017, 34, 24–36. (In Chinese) [Google Scholar]
- Guan, Y.; Shan, Y.; Huang, Q.; Chen, H.; Wang, D.; Hubacek, K. Assessment to China’s Recent Emission Pattern Shifts. Earth’s Future 2021, 9, e2021EF002241. [Google Scholar] [CrossRef]
- Shan, Y.; Guan, D.; Zheng, H.; Ou, J.; Li, Y.; Meng, J.; Mi, Z.; Liu, Z.; Zhang, Q. China CO2 Emission Accounts 1997–2015. Sci. Data 2018, 5, 170201. [Google Scholar] [CrossRef]
- Shan, Y.; Huang, Q.; Guan, D.; Hubacek, K. China CO2 Emission Accounts 2016–2017. Sci. Data 2020, 7, 54. [Google Scholar] [CrossRef] [PubMed]
- GB/T 4754-2011; National Economic Industry Classification. National Bureau of Statistics; China National Institute of Standardization: Beijing, China, 2011.
- Yu, J.; Xu, R.; Zhang, J.; Zheng, A. A Review on Reduction Technology of Air Pollutant in Current China’s Iron and Steel Industry. J. Clean. Prod. 2023, 414, 137659. [Google Scholar] [CrossRef]
- Ming, C.; Ke, W. The Combining and Cooperative Effects of Carbon Price and Technological Innovation on Carbon Emission Reduction: Evidence from China’s Industrial Enterprises. J. Environ. Manag. 2023, 343, 118188. [Google Scholar]
- Cao, Z.; Qian, L. Crowding Effect of Institutional Openness Based on the Big Data Algorithm on the Efficiency of New Energy Technology Innovation. Front. Bioeng. Biotechnol. 2023, 11, 1178737. [Google Scholar] [CrossRef]
- Valderrama, C.V.; Santibaňez-González, E.; Pimentel, B.; Candia-Véjar, A.; Canales-Bustos, L. Designing an Environmental Supply Chain Network in the Mining Industry to Reduce Carbon Emissions. J. Clean. Prod. 2020, 254, 119688. [Google Scholar] [CrossRef]
- Tang, D. Evaluate the Sustainable Marketing Strategy to Optimal Online Leasing of New Energy Vehicles Under the Background Big Data Economy. J. Enterp. Inf. Manag. 2022, 35, 1409–1424. [Google Scholar]
- Wang, Y.; Jia, X.; Wang, C. Research on Sectoral Employment Accounting of China. Statistical Research. Stat. Res. 2021, 38, 3–18. (In Chinese) [Google Scholar]
- Wang, J.; Wang, W.; Liu, Y.; Wu, H. Can Industrial Robots Reduce Carbon Emissions? Based On the Perspective of Energy Rebound Effect and Labor Factor Flow in China. Technol. Soc. 2023, 72, 102208. [Google Scholar] [CrossRef]
- Paul, D.; Dieudonné, T.; Guillaume, C. Method and Evaluations of the Effective Gain of Artificial Intelligence Models for Reducing CO2 Emissions. J. Environ. Manag. 2023, 331, 117261. [Google Scholar]
- Wang, E.Z.; Lee, C.C.; Li, Y. Assessing the Impact of Industrial Robots on Manufacturing Energy Intensity in 38 Countries. Energy Econ. 2022, 105, 105748. [Google Scholar] [CrossRef]
- Yang, W. The Nonlinear Effects of Multi-Scale Built Environments on CO2 Emissions from Commuting. Transp. Res. D 2023, 118, 103736. [Google Scholar] [CrossRef]
- Yang, L.; Wang, Y.; Han, S.; Liu, Y. Urban Transport Carbon Dioxide (CO2) Emissions by Commuters in Rapidly Developing Cities: The Comparative Study of Beijing and Xi’an in China. Transp. Res. D Transp. Environ. 2017, 68, 65–83. [Google Scholar] [CrossRef]
- Segovia Hernández, J.G.; Gómez-Castro, F.I.; Romero-Izquierdo, A.G.; Conde-Mejía, C.; López-Molina, A. Partial Energy Integration Between Biofuels Production Processes: Effect on Costs, CO2 Emissions and Process Safety. Process Saf. Environ. Prot. 2022, 159, 918–930. [Google Scholar] [CrossRef]
- Wang, G.; Zhou, J. Multiobjective Optimization of Carbon Emission Reduction Responsibility Allocation in the Open-Pit Mine Production Process Against the Background of Peak Carbon Dioxide Emissions. Sustainability 2022, 14, 9514. [Google Scholar] [CrossRef]
- Fan, J.; Wang, J.; Qiu, J.; Li, N. Stage Effects of Energy Consumption and Carbon Emissions in the Process of Urbanization: Evidence From 30 Provinces in China. Energy 2023, 276, 127655. [Google Scholar] [CrossRef]
- Akan, T. Explaining and Modeling the Mediating Role of Energy Consumption Between Financial Development and Carbon Emissions. Energy 2023, 274, 127312. [Google Scholar] [CrossRef]
- Damioli, G.; Van Roy, V.; Vertesy, D. The Impact of Artificial Intelligence on Labor Productivity. Eurasian Bus. Rev. 2021, 11, 1–25. [Google Scholar] [CrossRef]
- Lei, C.; Farhad, T.; Muhammad, M. Role of Artificial Intelligence on Green Economic Development: Joint Determinates of Natural Resources and Green Total Factor Productivity. Resour. Policy 2023, 82, 103508. [Google Scholar]
- Peng, W.; Lu, S.; Lu, W. Green Financing for the Establishment of Renewable Resources Under Carbon Emission Regulation. Renew. Energy 2022, 199, 103508. [Google Scholar] [CrossRef]
- Yao, C. Carbon Derivatives-Directed International Supervision Laws and Regulations and Carbon Market Mechanism. Sustainability 2022, 14, 5976. [Google Scholar]


Disclaimer/Publisher’s Note: The statements, opinions and data contained in all publications are solely those of the individual author(s) and contributor(s) and not of MDPI and/or the editor(s). MDPI and/or the editor(s) disclaim responsibility for any injury to people or property resulting from any ideas, methods, instructions or products referred to in the content. |
© 2023 by the authors. Licensee MDPI, Basel, Switzerland. This article is an open access article distributed under the terms and conditions of the Creative Commons Attribution (CC BY) license (https://creativecommons.org/licenses/by/4.0/).