Article

Research on Spatiotemporal Changes and Control Strategy of Carbon Emission in Shenyang

College of Management, Shenyang Jianzhu University, Shenyang 110168, China
*
Author to whom correspondence should be addressed.
Sustainability 2023, 15(16), 12172; https://doi.org/10.3390/su151612172
Submission received: 17 June 2023 / Revised: 6 August 2023 / Accepted: 7 August 2023 / Published: 9 August 2023
(This article belongs to the Section Environmental Sustainability and Applications)

Abstract

:
Scientific estimation and monitoring of regional long-term carbon emission change rules are the data support and scientific basis for developing differentiated emission reduction strategies. Based on the estimation data of energy carbon emissions from 2010 to 2021, DMSP/OLS and NPP/VIIRS lighting data, and the ESDA, Kaya identity, and LMDI models, the temporal and spatial changes and driving mechanism of carbon emissions in Shenyang were discussed. The results showed that: (1) During the study period, the carbon emission of energy consumption in Shenyang showed an upward trend, but the growth rate increased first and then decreased, and the carbon peak was not reached; (2) The spatial distribution of carbon emissions showed a radiative pattern decreasing from the center to the periphery; (3) The global Moran’s I of carbon emission is greater than zero, forming a high-high concentration distribution in the central region, low-low concentration distribution in the peripheral region, and low-high concentration distribution in the Yuhong region; (4) Economic development, population size, and energy efficiency are significant carbon-increasing factors, while industrial structure and energy structure factors are significant carbon-reducing factors. The order of driving factors is as follows: industrial structure > economic development > energy efficiency > population size > energy structure.

1. Introduction

With the emergence of extreme weather caused by global warming, a low-carbon economy and green development have become a global consensus [1]. Statistics show that in 2020, China’s carbon emissions would reach 9.899 billion tons, an increase of 0.6% over the previous year, accounting for 30.7% of the global total carbon emissions, and becoming the world’s largest carbon emitter [2,3]. China attaches great importance to the issue of global carbon emissions. In order to promote the process of tackling climate change, China proposed the emission reduction target of “reducing carbon emissions per unit of GDP by 60–65% from 2005 to 2030” at the Paris Conference [4]. In 2020, at the 75th session of the United Nations General Assembly, China once again proposed that “China will increase its national contribution and adopt more powerful policy measures to strive to peak carbon dioxide emissions by 2030 and achieve carbon neutrality by 2060” [5]. At present, China’s economic development model based on fossil energy consumption is difficult to change significantly in the short term. Human activities consume energy and produce carbon emissions, which is one of the main causes of the greenhouse effect and extreme weather. Cities are the main bearing areas of human production and life, and also the key areas of global carbon emissions. According to the International Energy Agency, urban CO2 emissions will increase from 71% to 76% of global emissions between 2006 and 2030 [6,7]. In this international context, the carbon emission reduction target is divided into local administrative units, and through the scientific estimation of carbon emissions and analysis of regional carbon emission spatial and temporal changes and their driving mechanisms. The final proposal of targeted carbon emission control strategies is of great significance in realizing the goal of “reaching the carbon peak in 2030 and achieving carbon neutrality in 2060” [8,9]. Liaoning Province, as the largest heavy industry base in northern China, has large energy consumption and high carbon emissions. The industrial economy not only promotes the social and economic development of Liaoning Province, but also brings pressure to the ecological environment. Shenyang, the capital city of Liaoning Province, is also one of the famous industrial bases in China. While leading the national industry, Shenyang generates a large amount of energy consumption and carbon dioxide emissions, so it is the primary city concerned with carbon emission reduction. The research results are representative. In the critical period of industrial transformation, based on real statistical data, scientific analysis of temporal and spatial change characteristics of carbon emissions in Shenyang, the clarity of the braking effect of influencing factors, and proposed guidance and targeted control measures for carbon emission reduction in Shenyang and Liaoning Province are of great value and practical significance for achieving China’s carbon emission reduction target [10].
In recent years, high and continuously increasing carbon emissions have led to a large number of environmental problems. Domestic and foreign scholars have conducted a lot of research on carbon emissions from multiple angles and scales. The research direction includes measuring carbon emissions, intensity, predicting carbon emissions, and revealing the temporal and spatial characteristics of carbon emissions, as well as the mechanism of influencing factors. It mainly includes the following aspects: (1) Carbon emission accounting angle, including the carbon emission coefficient method [11,12,13], measured method [14,15], life cycle method [16], etc. The carbon emission coefficient method is a basic method for calculating carbon emissions by using fossil fuel consumption proposed by the Intergovernmental Panel on Climate Change (IPCC). The carbon emission coefficient method is easy to obtain data with; it is a simple formula, suitable for national, provincial, city, county, and other levels of carbon emission estimation, and is widely used by scholars. (2) From the perspective of spatiotemporal pattern changes of carbon emissions, the change law of carbon emissions is analyzed from two dimensions of time and space, such as the spatial correlation analysis of urban pollutants [17,18]. However, most current studies are limited by the availability of data, and studies are mainly focused on large-scale levels such as national and provincial levels. There are few studies on temporal and spatial changes in carbon emissions in cities and counties [19,20]. (3) Carbon emission driving mechanisms, such as the factor decomposition model [21,22], STIRPAT model [23,24], spatial measurement model [25,26], the Logarithmic Mean Divisia Index (LMDI) model, etc., can decompose the driving factors of carbon emission again [27,28,29,30], and show the effect of each factor in the way of contribution degree. This method can eliminate residual terms and solve the problem of zero and negative values, and has the advantages of strong operability and wide applicability. It has been widely used in the field of carbon emission driving mechanism research. (4) The emission reduction effect of green policies, such as designing carbon emission control policies on the basis of environmental policy analysis [31].
On the whole, the research angles and levels of carbon emissions are relatively extensive, but there are still shortcomings: (1) Due to data collection and other reasons, the research objects of carbon emissions are mostly at the national or provincial level. However, the direction and speed of urban development led to large differences in carbon emissions from energy consumption. (2) Research on China’s carbon emissions mainly focuses on the Beijing-Tianjin-Hebei region and the Long Pearl River Delta region and rarely takes northeastern cities as research objects. Shenyang is the key city of Liaoning Province, which is a heavy industry province, but there is still a gap in the long-term carbon emission research. (3) Most of the existing studies only carried out the overall analysis of the research objectives and failed to deeply study the differences in carbon emissions in different cities, districts, and counties within the region. (4) In the literature, low-carbon emission reduction measures are mostly proposed based on the single research result of the mechanism of influencing factors, and more applicable, feasible, and efficient carbon emission reduction management and control strategies are not combined with the spatiotemporal change conclusion, and the research results of driving factors. Therefore, this study chooses Shenyang, a representative old industrial city in Northeast China, as the research object, and uses DMSP (Defense Meteorological Satellite Program)/OLS (Operational LinescanSystem), and NPP (National Polar-orbiting Partnership)/VIIRS (Visible Infrared Imaging Radiometer Suite) night light data to simulate and estimate the carbon emissions of energy consumption in Shenyang during 2010–2021. The characteristics of long-term carbon emission in Shenyang were explored from two dimensions of time and space, and carbon reduction measures were proposed at the county level. Based on the extended LMDI model, the decomposition model of driving factors of Shenyang carbon emission was constructed, and the index system and mechanism of driving factors were determined. It is expected to provide a new perspective for the study of urban carbon emission and its influencing factors, and provide a scientific basis, policy reference, and decision support for the high-quality development of Shenyang aiming at carbon emission reduction.

2. Methods and Data

2.1. Research Methodology

2.1.1. Nighttime Lighting Data and Their Calibration

Nighttime light images are images formed by sensors detecting weak near-infrared radiation at the surface at night, recording surface light intensity, which is one of the effective methods to estimate carbon emissions [32,33,34,35,36]. The 1976 launch of the DMSP/OLS satellite sensor and the NPP/VIIRS sensor launched in late 2011 can provide long-time series nighttime light remote sensing data to support the study.
DMSP is a solar synchronous orbit satellite operating at an altitude of about 830 km, with a period of about 101 min, orbiting the Earth 14 times a day, and the night observation time is about 20:30–21:30 local time of the observation site. The OLS sensor carried by the DMSP satellite has two bands: Vision-Near-Infrared (VNIR) and Thermal Infrared (TIR). The VNIR band ranges from 0.4–1 μm, the spectral resolution is 6 bit, and the gray value is 0–63. The TIR band ranges from 10–13 μm, the spectral resolution is 8 bit, and the gray value is 0–255. DMSP/OLS data includes three types of products: average night light intensity data, cloudless observation frequency data, and night stable light data. The brightness value of the unit pixel of night stable light data is expressed by its annual average light intensity. It has been proved by scholars to be more applicable to the estimation of socio-economic factors. This paper selects the night stable light data of DMSP/OLS (2013–2021), and its gray value ranges from 0 (no light) to 63 (maximum light intensity). The gray value represents the relative value, which is the value of a certain gray level obtained by the pixel from black to white. In this paper, NPP/VIIRS monthly average light radiation data are selected. NPP is a solar synchronous orbit satellite with an altitude of about 830 km, orbiting the Earth about 14 times a day, and the satellite’s repetition period is 16 days. The VIIRS sensor on the NPP satellite has 22 channels, ranging from 0.41 μm to 12.01 μm, including 9 visible-near-infrared, 8 mid-infrared, and 4 low-light infrared, which can carry out high-sensitivity noctilucent observation of the surface at a resolution of 500 m, and the spectral resolution is 10 bit. The data cover latitude 75° N–65° S and longitude −180°–180°, almost covering the area of global human activities. Due to the data difference between the two types of sensors and the phenomenon of pixel brightness supersaturation in DMSP/OLS sensors, this study deals with the two types of data from three aspects: supersaturation problem, data correction, and data continuity. DMSP/OLS light data were desaturated with reference to Lu Xiu et al., and the data continuity from 2010 to 2013 was corrected [37]. There is no light value supersaturation problem in NPP/VIIRS data, but there is background noise in its images. With reference to the practice of YU et al. [38], night images were processed with the maximum light value to realize the correction of data continuity from 2013 to 2021.
By comparing DMSP/OLS and NPP/VIIRS data, using DMSP/OLS data as the reference object, the NPP/VIIRS night lighting data was corrected, and the linear fitting equations of the two types of lighting images in 2013 were established. As shown in Equation (2), goodness of fit R2 > 0.8, which proves that the fitting is good and the model has high accuracy. Based on the fitting Equation (1), the 2013–2021 NPP/VIIRS data were corrected to be consistent with the 2010–2013 DMSP/OLS data, and finally, the 2010–2021 nighttime lighting time series dataset of Shenyang City was constructed.
T D N = 64.141 D N + 1700.547
where TDN is the gray value of NPP/VIIRS converted to DMSP/OLS scale, and DN is the gray value of NPP/VIIRS scale.

2.1.2. Estimation and Fitting of Carbon Emissions from Energy Consumption

(1)
Estimate carbon emissions from energy consumption
More than 90% of the carbon emissions generated by human activities come from energy consumption. The carbon emissions of energy consumption are calculated based on the statistical data of energy consumption in Shenyang and calculated according to the carbon emission coefficient method proposed by IPCC. The method has the advantages of being simple and clear, and having a mature formula, easy data acquisition, a perfect carbon emission factor database, and a large number of examples for reference. In this study, 9 major energy sources are selected as the accounting objects for calculation, and the calculation formula is as follows:
C E r = i = 1 9 E C r i × K i × C i
where CEr is the total carbon emission of Shenyang in year r, million t; ECri is the terminal consumption of energy type i in year r; Ki is the energy conversion standard coal coefficient of energy type i, the natural gas conversion standard coal coefficient is in kg/m3, the electricity conversion standard coal conversion coefficient is in kg/(kW-h); Ci is the energy carbon emission coefficient of energy type i; i is the energy type, electricity, and heat carbon emission. The energy conversion standard coal factors and energy carbon emission factors are shown in Table 1:
(2)
Energy Carbon Emission Fitting
The nighttime lighting data reflect a positive correlation between the intensity of human activities on Earth and urban carbon emissions. The higher the grayscale value of nighttime lighting images, the more carbon emissions. Therefore, based on the estimated carbon emissions of Shenyang from 2010 to 2021, a long-time series carbon emission dataset of Shenyang was obtained by fitting and analyzing the corrected night lighting data. Both night lighting data and carbon emission estimates increased linearly, at a high rate in the middle of the study, and slowly after reaching the node. Considering the implementation of national and Shenyang carbon emission reduction policies and the differences between the two types of nightlight data, we conducted linear regression analysis without intercept terms in three stages [39], as shown in Equation (3).
y = k x
where y is the estimated carbon emissions from energy consumption, x is the corrected nighttime lighting data study area gray value TDN, and k is the fitting factor.
According to the calculation results of Equation (2) and the fitting coefficient k in Table 2, the final carbon emission dataset fitted to Shenyang night lighting data is calculated.

2.1.3. Spatial Autocorrelation Analysis

The first law of geography proposed by WaldoTobler shows that “there is always a correlation between the spatial distribution of anything, including agglomeration, random and regular distribution” [40]. The article adopts spatial autocorrelation analysis in Exploratory Spatial Data Analysis (ESDA). It explores the spatial dimension aggregation characteristics of carbon emissions in Shenyang city from the global spatial autocorrelation analysis and local spatial autocorrelation analysis [41].
(1)
Global spatial autocorrelation analysis
The global spatial autocorrelation analysis reflects the overall characteristics of the spatial correlation of carbon emissions in Shenyang, which is represented by the global Moran’s I index, whose value range is [−1, 1]. Moran’s I index greater than zero indicates that the spatial distribution of carbon emissions is positively correlated, and the closer it is to 1, the higher the spatial concentration of carbon emissions. Moran’s I index of less than zero indicates that the spatial distribution of carbon emissions has heterogeneity, and the closer it is to −1, the stronger the spatial heterogeneity of carbon emissions. Moran’s I index equal to zero indicates that carbon emissions in the study area are not correlated. The expression for Moran’s I index is:
I = n i = 1 n j = 1 n W i j y i y ¯ y j y ¯ S 2 i = 1 n j = 1 n W i j
S 2 = i = 1 n y i y ¯ 2 , y ¯ = 1 n i = 1 n y i
where I denotes Moran’s I index, n is the total number of spatial units in the study area, yi and yj denote the i-th and j-th spatial unit carbon emissions, respectively, Wij is the spatial weight, and y is the mean value of carbon emissions in the study area.
(2)
Local spatial autocorrelation analysis
Global spatial autocorrelation analysis discusses the spatial correlation of carbon emissions from the overall perspective, but ignores the atypical spatial characteristics in the study area to a certain extent. Local spatial autocorrelation analysis can effectively fill this research gap. The local spatial autocorrelation analysis is divided into four quadrants of HH (high-high aggregation area), HL (high-low aggregation area), LL (low-low aggregation area), and LH (low-high aggregation area) by Moran scatter diagram. HH (LL) represents the spatial homogeneity of adjacent spatial units, and HL (LH) represents the spatial heterogeneity of adjacent spatial units. Moran scatter plot clearly and intuitively shows the correlation of local spaces in the form of quadrants.

2.1.4. LMDI Logarithmic Decomposition Method

(1)
Kaya identity
The Kaya identity was proposed by the Japanese scholar Kaya at the IPCC Symposium in 1989. As shown in Equation (6), the Kaya identity breaks down changes in carbon emissions into the combined effects of three drivers: energy consumption, economic growth, and population. Based on Kaya identity and the actual development situation of Shenyang, energy structure, energy efficiency, industrial structure, economic development, and population size were selected as the driving factors of Shenyang’s carbon emission. On this basis, this study extended the Kaya identity of Shenyang’s carbon emissions. As shown in Equation (7):
C = C E × E G × G P × P
C E = C E E × E S I × S I G D P × G D P P O P × P O P
where CE is carbon emission; E is energy consumption; SI is the added value of the secondary industry; GDP is the gross regional product; POP is the total resident population of the region.
Let
T = CE/E, Q = E/SI, G = SI/GDP, M = GDP/POP and P = POP.
The expanded Kaya’s constant equation can be simplified as:
C E = T × Q × G × M × P
where Indicator T is represented by carbon emissions generated per unit of energy consumption, representing energy structure; Indicator Q is expressed as energy consumption per unit of secondary industry-added value, representing energy efficiency; Index G is expressed by the proportion of the secondary industry in GDP, representing the industrial structure; Indicator M is represented by per capita GDP of the study region, representing economic development; Index P is the total number of permanent residents and represents the population size. Equation (8) decomposed the change of carbon emissions in Shenyang into the comprehensive effects of five driving factors: energy structure (T), energy efficiency (Q), industrial structure (G), economic development (M), and population size (P).
(2)
LMDI logarithmic decomposition method
The Kaya identity can decompose the driving factors of carbon emission, but there is a problem that the residual term cannot be eliminated. Therefore, based on the expansion form of the Kaya identity constructed above, combined with the LMDI model proposed by Ang et al., the problems of negative value, zero value, and residual term are dealt with. The LMDI decomposition model can decompose energy consumption into the contribution degree of each influencing factor, gain an in-depth understanding of energy consumption changes, eliminate residual terms, and solve zero and negative problems. The LMDI logarithmic decomposition method has two types of models, including the LMDI-Imodel and LMDI-IImodel, and each type of model includes two decomposition methods: addition and multiplication. Because the results of addition and multiplication decomposition methods are inconsistent in the LMDI-IImodel, the LMDI-Iadditive decomposition method was used to study the driving factors of carbon emission in Shenyang. Ct is defined as the carbon emissions of energy consumption in the t period, and C0 is the carbon emissions of energy consumption in the base period. The additive decomposition of the comprehensive influence and effect of driving factors of carbon emissions is as follows:
Δ C = C t C 0 = Δ C P + Δ C M + Δ C G + Δ C Q + Δ C T
where ΔC is the change of carbon emission during the study period; ΔCP is the population size effect; ΔCM is the effect of economic development; ΔCG is the effect of industrial structure; ΔCQ is the effect of energy efficiency; ΔCT is the effect of energy structure, and the corresponding expression of the effect of each driving factor is as follows:
Δ C P = i C i t C i 0 ln C i t ln C i 0 ln P t P 0
Δ C M = i C i t C i 0 ln C i t ln C i 0 ln M t M 0
Δ C G = i C i t C i 0 ln C i t ln C i 0 ln G t G 0
Δ C Q = i C i t C i 0 ln C i t ln C i 0 ln Q t Q 0
Δ C T = i C i t C i 0 ln C i t ln C i 0 ln T t T 0

2.2. Study Area and Data Sources

2.2.1. Overview of the Study Area

Shenyang City is located in the center of Northeast Asia and the Bohai Sea Economic Circle and is the capital city of Liaoning Province. In 2021, Shenyang had 9.118 million permanent residents, including 7.67 million urban residents, accounting for 22.42% of the total population of Liaoning Province. The regional GDP is CNY 724.92 billion, accounting for 26.17% of the GDP of Liaoning Province, of which the output value of the secondary industry is CNY 257.03 billion, and the built-up area is 567 square kilometers. As the central city of Northeast China and one of the fifteen sub-provincial cities, Shenyang has an important strategic position. Shenyang has a certain driving force and radiation to the surrounding cities and even the whole country and has a strong driving role in the development of Liaoning province and Northeast China.

2.2.2. Data Sources

Unless otherwise noted, all statistical data on energy consumption in two counties and one city in ten districts of Shenyang are from 2010 to 2021. Data sources include: (1) Vector data of administrative divisions: 1:100,000 vector data of China’s administrative boundaries were derived from the National Geographic information public service platform—World Map. Using ArcGIS 10.2 mask extraction function, the scale vector administrative boundary vector data of Shenyang and the county were obtained. (2) Night light data: non-radiometric calibration DMSP/OLS stabilized night light data from 2010 to 2013, the gray value of data pixels ranged from 0 to 63, and the spatial resolution was 30; NPP/VIIRS 2013–2021 monthly scale light radiation data, no gray value ceiling effect, and a spatial resolution of 15. (3) Energy consumption statistics: The main “carbon source” of the city is generated by energy consumption, which mainly includes coal, coke, crude oil, gasoline, kerosene, diesel, fuel oil, natural gas, etc. The statistical data on the city’s energy consumption are mainly derived from statistical yearbooks and annual statistical bulletins such as the China Energy Statistical Yearbook and the Shenyang Statistical Yearbook from 2010 to 2021. The interpolation method was used to supplement the missing data for each year. The energy-related indicators used to calculate carbon emissions in this study are derived from the GB/T2589-2020 General Principles for the Calculation of Integrated Energy Consumption and the IPCC Guidelines for National Greenhouse Gas Emission Inventories 2006. (4) Socio-economic data: In this paper, socio-economic indicators such as GDP, the permanent resident population at the end of the year, and added value of the secondary industry were selected from the Shenyang Statistical Yearbook and the China Urban Statistical Yearbook. See Table 3 for detailed data sources.

3. Results

3.1. Spatial and Temporal Changes Characteristics of Carbon Emissions from Energy Consumption in SHENYANG

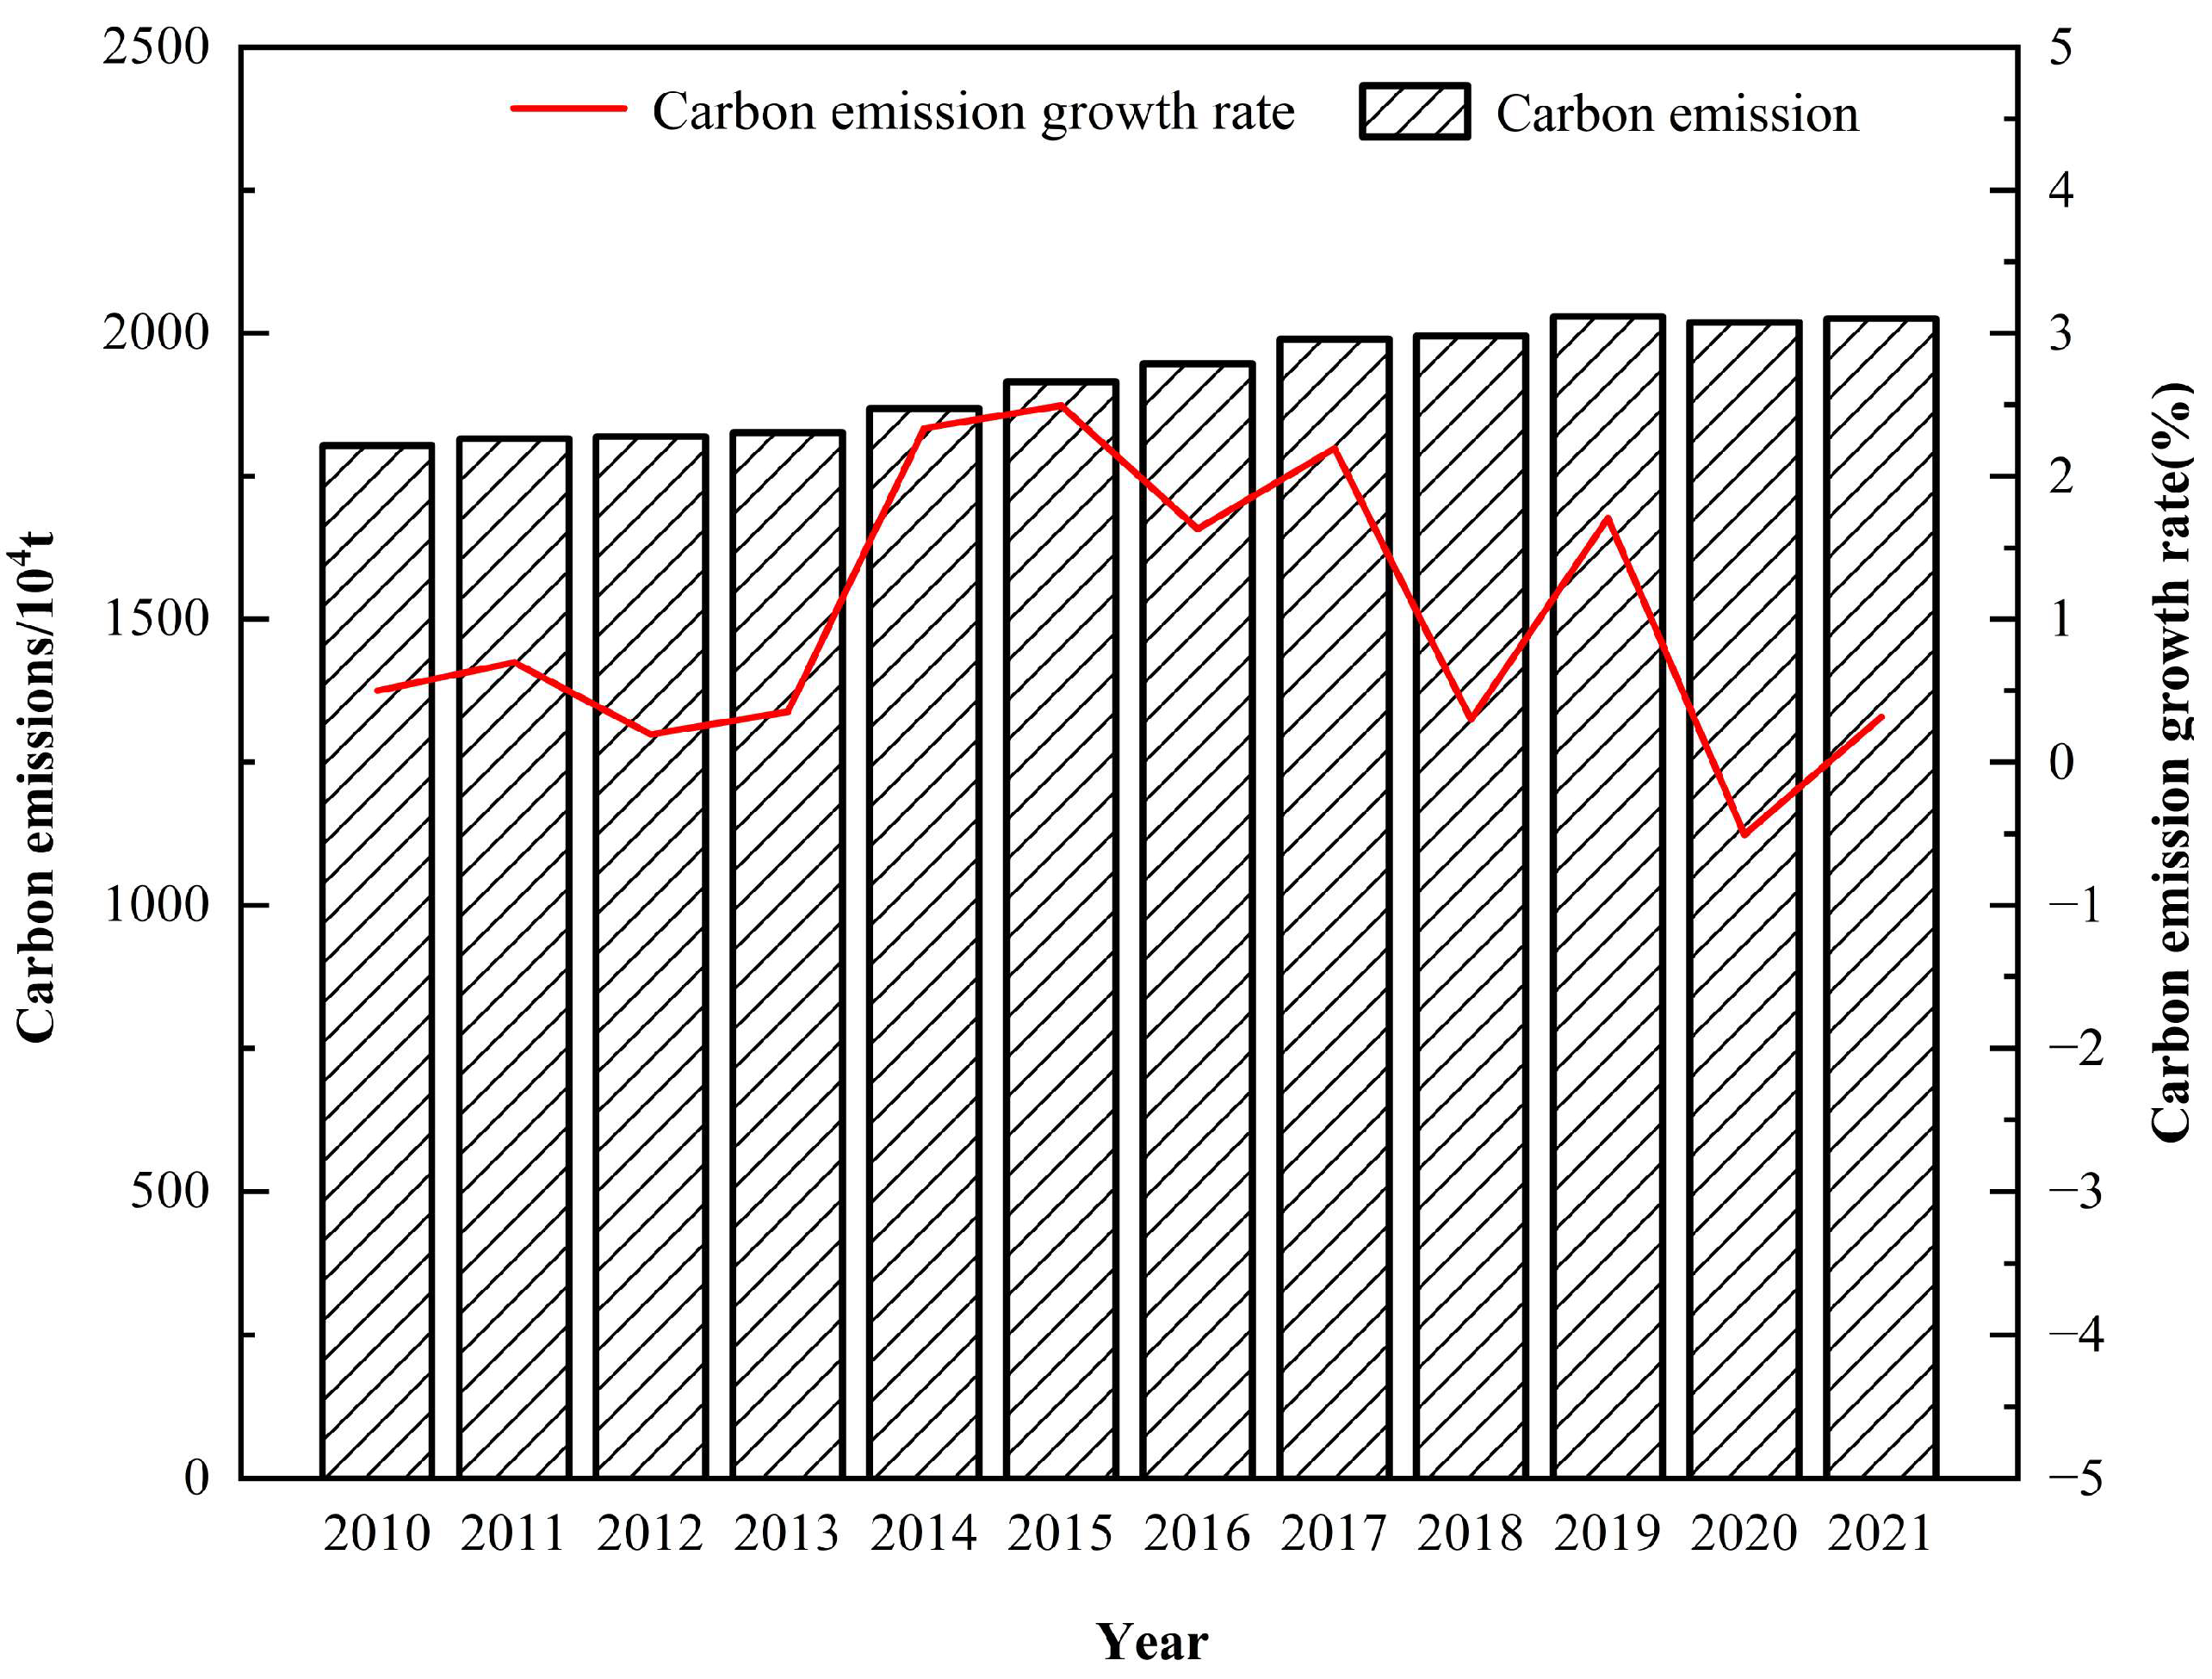
3.1.1. Time Series Change Characteristics

Based on the carbon emission coefficient method (Formula (2)), the estimated energy consumption carbon emissions in Shenyang during 2010–2021 were obtained. The long-term carbon emission dataset of Shenyang during 2010–2021 was obtained through fitting with the corrected long-term time series night light data of 2010–2021, as shown in Table 2. The changes in the fitted carbon emission time series in Shenyang from 2010 to 2021 were obtained (Figure 1). From the total carbon emission, it can be seen that the overall carbon emission of Shenyang showed a growing trend, from 18.033200 tons in 2010 to 20.2543 million tons in 2021, with a growth rate of 12.32% and an average annual growth rate of 1.03%. During the study period, the carbon emission growth rate of Shenyang showed a trend of first increasing and then decreasing, and the carbon emission growth rate showed an overall increasing trend from 2010 to 2019, among which the average annual growth rate was 2.165% from 2014 to 2017. The main reason was that Shenyang, as an old industrial base, continued to advance the development process of the secondary industry during the study period. The rapid development of industries with high energy consumption and high emissions, such as industry and construction, has led to a rapid growth trend of carbon emissions. From 2018 to 2019, the average annual growth rate of carbon emissions was 1.005%, down 1.160% from the previous period. The main reason is that Shenyang, in response to the national “13th Five-Year Plan” period, accelerated industrial restructuring, took low-carbon development as an important driving force for economic development, and promoted China’s carbon dioxide emissions to peak around 2030 and strive to peak as soon as possible. The average annual growth rate of carbon emissions in Shenyang from 2020 to 2021 was −0.094%. At this stage, Shenyang City continues to be guided by the realization of the dual-carbon target and has strengthened its upfront carbon reduction measures. While the city is growing economically, the growth rate of carbon emissions will continue to decline, showing a trend of convergence on the whole, but carbon emissions have not yet reached the carbon peak. In particular, carbon emissions were negative for the first time in 2020 due to national policies and the new coronavirus outbreak.
To provide a clearer, more intuitive, and more precise analysis of the growth of carbon emissions in Shenyang City, the scope of the refined study is analyzed in terms of counties and districts. Within the jurisdiction of Shenyang, Heping District, Shenhe District, Tiexi District, and Hunnan District all showed significant growth of carbon emissions per unit, and the rapid growth period was mainly concentrated from 2014 to 2017, which was consistent with the overall growth trend of carbon emissions in Shenyang. The main reason for this is that all four study areas are located in the core area of Shenyang City and are relatively active in terms of economic development. The carbon emission in Dadong District, Huanggu District, Sujiatun District, Shenbei New District, and Yuhong District increased at a relatively low rate during the study period. The four regions, Liaozhong District, Kangping County, Faku County, and Xinmin City, have higher overall carbon emissions, but the unit like yuan carbon emissions are at the bottom of the county study area, and the carbon emissions increased slightly during the study period, which is mainly related to the slow economic development.

3.1.2. Spatial Pattern Change Characteristics

To intuitively observe the change rule of carbon emission in Shenyang, this paper uses the application software ArcMap 10.2. Based on the quantile method, the carbon emissions of Shenyang during 2010–2021 were divided into six categories: the spatial distribution map of carbon emissions in low carbon emission areas, low carbon emission areas, medium-low carbon emission areas, medium-high carbon emission areas, high carbon emission areas, and high carbon emission areas of Shenyang during 2010–2021 were drawn (Figure 2). As can be seen from the carbon emission distribution map, the spatial distribution of carbon emissions in Shenyang City during the study period presents a certain pattern, and the districts and counties with higher energy carbon emissions per unit area are all located in the central region of Shenyang City, with a general trend of decreasing from the center to the periphery. Specifically, carbon emissions from Heping District, Shenhe District, and Dadong District are always at the top of carbon emissions from all counties in Shenyang, which is related to the geographical location of the study area and its being the center of economic development in Shenyang. Sujiatun District, Liaozhong County, Xinmin City, Faku County, and Kangping County are always located in the low-carbon emission area due to factors such as economic development and population size. During the study period, carbon emissions in Shenyang City showed a spatial distribution pattern of radiation from the center to the periphery, in which Heping District, Shenhe District, Dandong District, Tiexi District, and Huanggu District were the five districts in the city center, and the intensity of carbon emissions in its radiating counties showed a decreasing trend from the center to the periphery. It is worth noting that the relative carbon emission level of Dadong District changes from a high-value area to a higher area, Huanggu District changes from a higher area to a medium-high area, while Tiexi District changes from a medium-high carbon emission area to a high carbon emission area, and Heping District changes from a higher area to a high carbon emission area. At the beginning of the study, the greater number of industrial parks in the Greater East Side, including industrial and heavy industries, high energy consumption, and low rates of clean energy utilization led to high levels of relative carbon emissions in the region. With the implementation of energy-saving and emission-reduction policies of the State and Shenyang City, as well as the development of science and technology year by year, the late carbon emissions in the Dadong District are on a downward trend. Other counties had certain fluctuations during the study period and remained in a stable state.

3.1.3. Spatial Autocorrelation Characteristics

(1)
Global spatial autocorrelation
On the basis of analyzing the spatial pattern of carbon emissions in Shenyang, ArcGIS application software was used to calculate the Moran’s I index of carbon emissions in Shenyang from 2010 to 2021, aiming to analyze the spatial correlation of carbon emissions in Shenyang at the overall level. The results in Table 4 show that the Moran’s I index of carbon emissions of Shenyang from 2010 to 2021 is greater than 0, and the p-value of the normal statistic Z is less than 0.05 at the significance level of 5%, which reflects that carbon emissions of Shenyang show a significant positive correlation during the study period. From the time dimension, the overall positive correlation showed a “strong-weak” fluctuation decline, in which there was a small increase from 2010 to 2013, and Shenyang’s carbon emissions reached the peak of spatial accumulation in 2013. From 2014 to 2021, the carbon emission of Shenyang showed a fluctuating downward trend, indicating that the spatial aggregation of carbon emissions in Shenyang City is decreasing, which is related to the promotion and implementation of carbon reduction policies in each district and county.
(2)
Local spatial autocorrelation
The global Moran’s I index can only express the overall spatial correlation degree of the study area. To further reveal the similarities and differences of spatial correlation among districts and counties in Shenyang, a local spatial autocorrelation analysis was conducted based on Geoda software, and the results were shown in Table 5. Comprehensive analysis shows that high-high and low-low are the main types of local spatial autocorrelation, the overall distribution pattern does not change much from 2010 to 2021, and the local spatial correlation of carbon emissions in Shenyang is in a relatively stable state. Specifically, the areas with high-high carbon emissions are concentrated in Heping District, Shenhe District, and Huanggu District in the central area of Shenyang; the areas with low-low emissions are concentrated in Shenbei New District, Faku County, and Xinmin City in the peripheral area of Shenyang, mainly due to the differences in geographical location, economic development level and population density of the areas; Yuhong District has been in the low-high area type during the study period; no study area has shown high-low aggregation.
As a result, the spatial distribution characteristics of energy carbon emissions in Shenyang are as follows: (1) Heping District, Shenhe District, Huanggu District, and Tiexi District are high carbon emitting counties and are close to high carbon emitting counties, so they can adopt technology interoperability and industrial association with neighboring high carbon emitting counties to achieve joint carbon reduction; (2) Shenbei New District, Faku County, and Xinmin City are low carbon emitting counties and are close to low carbon emitting counties while maintaining a low level of carbon emissions, they can reduce carbon emissions in high carbon areas with high carbon emission areas through capacity transfer and other ways; (3) Yuhong District is a low-carbon emitting district and is close to a high carbon emitting district, so it can achieve low-carbon economic development through information exchange and technological innovation.

3.2. Analysis of Carbon Emission Drivers in Shenyang

To further analyze the internal driving mechanism of driving factors on carbon emissions, based on the above relevant data, the LMDI decomposition model was adopted to decompose the carbon emission increment of Shenyang from 2010 to 2021, and five types of factor effect data were obtained: energy structure effect (CT), energy efficiency effect (CQ), industrial structure effect (CG), economic development effect (CM), and population size effect (CP). The analysis results are shown in Table 6. The effect data in Table 6 shows the utility value of each influencing factor to the change of Shenyang’s carbon emission in the current year. In order to more intuitively show the contribution degree of each driving factor to the change in Shenyang’s carbon emission, the contribution degree of each driving factor of Shenyang’s carbon emission is drawn by the histogram (Figure 3).
As can be seen from the histogram, the total effect for 2010–2021 is an increase of 222.07 billion tons. Among the driving factors, economic development, energy efficiency, and population size change led to an increase of 10,170,083 tons of carbon emissions, among which economic development had the most significant promoting effect on carbon emissions. The optimization of the industrial structure and energy structure reduced carbon emissions by 794.9013 million tons, of which the optimization effect of the secondary industry structure was more obvious.
(1)
Energy structure effect
According to the factor decomposition results of the LMDI model, from 2010 to 2021, the contribution of energy structure adjustment to the carbon emission inhibition effect is 1.059172 million tons, and the contribution rate is −47.69%. In the 12-year study period from 2010 to 2021, there was a positive promoting effect in the six-year study period from 2014, 2015, 2016, 2017 2020, and 2021, especially in the 2019–2020, energy structure utility increased by 1,317,139 tons of carbon emissions. In other years, the effect of energy structure plays a restraining role, but it is weaker than that of industrial structure. In the energy consumption of Shenyang, coal consumption accounts for 80% of the total energy consumption, so the effect of energy structure can reflect the clean utilization level of coal to a certain extent, and the clean energy consumption and clean energy utilization level of Shenyang are relatively low. To sum up, the improvement of energy structure still has a huge development space for Shenyang’s emission reduction, and breakthroughs in reducing energy carbon emissions can be achieved by improving the technical level of clean energy utilization and adopting new energy alternatives.
(2)
Energy efficiency effect
Energy efficiency can reflect the level and effect of energy utilization and technological development. According to the factorization results of the LMDI model, energy efficiency has an overall promoting effect on energy carbon emissions in Shenyang, which is an obvious carburizing factor, but compared with the growth of carbon emissions brought by economic development, it is relatively weak. The total contribution of energy efficiency effect to carbon emissions from energy consumption in Shenyang was 3,330,952 tons, and the contribution rate was 149.97%. In the early stage of 2010–2021, it will inhibit carbon emissions, while in the middle and later stages, it will promote carbon emissions. This is due to the double impact of technological progress on energy consumption and carbon emissions, i.e., the rebound effect of carbon emissions [42], a “paradoxical” phenomenon of increased energy efficiency and rising energy consumption. Among them, primary energy consumption is the main source of carbon emissions, which leads to the rebound effect of carbon emissions. In the face of the rebound effect caused by the improvement of energy efficiency, the rebound effect of low-carbon emission reduction in Shenyang is relieved by strengthening the construction of transmission infrastructure and developing new energy micro-grid, “Internet +” and other digital technologies.
(3)
Industrial structure effect
The industrial structure reflects the effects of industrial transformation, optimization, upgrading, and internal adjustment on carbon emissions. According to the decomposition results of LMDI factors, industrial structure is an obvious carbon reduction factor, and the contribution of the industrial structure effect to carbon emission of energy consumption in Shenyang is −310.20%. From 2010 to 2013, the effect of the industrial structure showed a positive driving effect on carbon emission, and after 2013, the overall carbon emission showed a significant inhibiting effect, which was consistent with the trend of the secondary industry in Shenyang, increasing first and then decreasing. In recent years, with the transformation, optimization, and upgrading of Shenyang’s industrial structure, the proportion of Shenyang’s secondary industry decreased from 50.7% in 2010 to 35.5% in 2021, a decrease of more than 15%. With the continuous optimization of industrial structure, Shenyang’s secondary industry should change the development of the traditional heavy industry. Focusing on the coordinated development of light and heavy industries, it will continue to promote the rapid development of advantaged industries and realize the upgrading and optimization of industrial structure. The proportion of the secondary industry in Shenyang will continue to decrease. Therefore, the effect of industrial structure factors on carbon emission reduction in Shenyang will be enhanced.
(4)
Economic development effect
The economic development of Shenyang is represented by per capita GDP. According to the decomposition results, the improvement of economic development has increased the carbon emissions of Shenyang by 4.527335 tons, with an average contribution rate of 203.84%, which has a positive promoting effect on carbon emissions. From 2010 to 2021, in addition to some years due to industrial transformation and other factors leading to negative per capita GDP growth, the remaining years are positive driving effects. Economic growth is the symbol of rapid urban development, and high carbon emissions accompanied by economic growth are the key points that need to be improved in the future urban development process. Scientific emission reduction means and reasonable emission reduction targets are the necessary ways to achieve high-quality development.
(5)
Population scale effect
The population size factor of Shenyang City is expressed by the number of permanent residents at the end of the year. According to the factor decomposition results of the LMDI model, compared with the effect of economic development level on carbon emissions in Shenyang, the expansion of population size has a weak effect on carbon emissions in this region. From 2010 to 2021, the population size effect of Shenyang always presents a positive promoting effect, and the total contribution of population size expansion to the carbon emission promotion effect is 2,311,796 tons, with an average contribution rate of 104.08%. The growth of the population effect depends on the increase in population. With the implementation of China’s “three-child policy”, the population growth rate will accelerate in the future, and the impact of the population size effect on carbon emissions will be enhanced. Therefore, the government should pay attention to the improvement of the proportion of talent and the concept of environmental protection.

4. Discussion

Adjust the proportion of coal consumption, vigorously promote the advantages of wind and photovoltaic power generation industries, and optimize the energy consumption structure. Energy sources with higher carbon emission factors consume the same amount of energy and produce greater carbon emissions than those with lower carbon emission factors. The proportion of coal consumption in energy consumption in Shenyang is 58%, which exceeds the proportion of coal consumption in the country. The energy structure is relatively simple, and the optimization of energy structure still has a large space for carbon emission reduction. Adjusting the energy structure, controlling the proportion of coal consumption, developing clean energy, encouraging high-energy enterprises to shift from fossil energy to clean energy, vigorously developing and popularizing renewable energy such as photovoltaic power generation, wind power generation, nuclear power, offshore power generation biomass energy, and realizing diversified energy consumption are effective measures to optimize the energy structure [43]. As Shenyang has a temperate monsoon climate, four distinct seasons, and no access to the sea, it has a strong industrial and heavy industry development background and has industrial advantages of wind power and photovoltaic power generation, so it will continue to promote the development of clean energy such as photovoltaic power generation, wind power generation, and nuclear power, so as to further promote the green and low-carbon transformation of energy and build a safe and efficient energy consumption structure.
Low-carbon technology innovation improves energy efficiency and accelerates the development of key projects such as photovoltaic building integration. Shenyang’s high-speed economic development and advanced scientific and technological level lay a solid foundation for the research and development of low-carbon technologies. Improving energy utilization efficiency is an important way to reduce carbon emissions in Shenyang. Building Integrated PV (BIPV), solid-state heat storage, energy storage, clean heating, and other technologies are the key projects of energy conservation and emission reduction in Shenyang. Shenyang Municipal government should continue to promote the innovation of low-carbon technology. On the one hand, it should break the technical barriers, consolidate the talent reserve, and give sufficient policy and subsidy support to the research and development of low-carbon technology with development potential; increase the investment of scientific research funds and personnel training in the field of low-carbon technology, pay attention to the cooperation and development of industry, university, and research, and form a virtuous cycle of energy conservation and emission reduction industry chain [44]. Enterprises and universities are encouraged to cooperate to train professional and technical personnel, and jointly build high-quality talent incubation bases and experimental centers to provide a broad platform for scientific research for college students. On the other hand, actively introduce advanced technology and learn advanced management experience; cross-regional low-carbon exchanges and cooperation, learning advanced low-carbon technology and management experience. Enterprises actively introduce advanced low-carbon technologies at home and abroad, promote technological upgrading, and improve energy utilization efficiency. The Government maintains an open attitude of learning and innovation to develop low-carbon technologies while absorbing advanced technologies from developed countries to realize the healthy development of low-carbon technologies in the region. Technological innovation research and development can not only promote the completion of the “double carbon” goal, but also transform into more efficient productivity to promote the rapid development of the region.
It is necessary to rationalize the industrial structure system, help optimize and upgrade the industrial structure, and accelerate the decoupling of economic growth and carbon emissions. The industrial structure is an important carbon reduction factor for Shenyang’s carbon emissions. On the one hand, it is necessary to rationalize the industrial structure system, introduce policies to limit carbon emissions from the three high industries, reduce the proportion of high-energy-consuming industries in GDP, strictly control new production capacity, and shorten the carbon footprint of the industrial chain of the transportation, chemical, and iron and steel industries. Guided by industrial optimization and upgrading, it is necessary to promote the implementation of low-carbon transformation and development of the whole industry, and promote the green and low-carbon traditional industries from the source to the end. It is necessary to establish low-carbon and green eco-industrial recycling demonstration zones, conduct standardized management of resources [45], and develop the industrial transformation of new energy, high-end equipment, and digital economy. Enterprises should respond to the call of the national and local governments, with the principle of “reduction-circulation-reuse”, develop a low-carbon circular economy model, and accelerate the low-carbon transformation of the industry. On the other hand, it is necessary to upgrade and adjust the industrial structure system. The output value of the tertiary industry, dominated by the service industry, is relatively less dependent on energy. It can effectively reduce energy consumption and improve energy utilization efficiency by means of information technology, management methods, and big data. We will actively develop new-generation information technology and low-carbon technologies such as artificial intelligence [46], 5G infrastructure [47], new energy [48], and new materials [49]; strengthen inter-regional cooperation, promote the coordinated regional development of Liaoning Province, and give full play to the leading role and development advantages of the sub-provincial cities, so as to achieve the goal of carbon peak as soon as possible and finally achieve carbon neutrality. Shenyang Municipality has jurisdiction over 10 districts, two counties, and one county-level city; each district and county has different leading industrial advantages, among which Hunnan District focuses on the development of new-generation information technology, new energy, high-end equipment, and other industries; Yuhong District takes machinery and equipment, auto parts, and other leading industries. Each district and county gives full play to its leading industrial advantages and promotes the upgrading of dominant leading industries. We will promote coordinated development among regions, strengthen the integrated development of innovation chains and industrial chains, empower the development of districts and counties, and optimize and upgrade the industrial structure.
It is necessary to cultivate public awareness of energy conservation and emission reduction, and improve infrastructure construction. Human activities consume fossil energy and produce carbon dioxide. Population size factor has a positive promoting effect on the carbon emission of energy consumption in Shenyang. As the capital city of Liaoning Province, Shenyang has attracted a large number of people due to its favorable location advantage and high-speed economic development trend. With the continuous expansion of population size, the increase of energy consumption in social life leads to the continuous rise of carbon dioxide emissions. The government should actively advocate the establishment of a resource-saving and environmentally friendly society, and cultivate the public’s awareness of energy conservation and emission reduction, which plays an important role in Shenyang City’s shift to a low-carbon consumption lifestyle and the reduction of energy consumption and carbon emissions. Changing consumer attitudes through the purchase of energy-saving home appliances, low-carbon environmental protection lectures, popularizing knowledge of low-carbon living, and carrying out low-carbon education activities in primary and secondary schools and colleges and universities. Schools, as an important channel for the dissemination of social concepts and cultures, are an effective way to form a long-term, in-depth concept of low-carbon living. Through the formation of students’ energy-saving and emission-reduction lifestyles, the family as a unit promotes society-wide low-carbon consumption, forming a virtuous development. In addition to gradually infiltrating the concept of low-carbon consumption, the government should facilitate residents’ daily low-carbon life and promote positive carbon emission reduction through measures such as improving infrastructure construction, optimizing the urban public transport network, popularizing bicycle sharing, carrying out garbage classification, and raising the standards of ladder utilities and electricity.

5. Conclusions

Based on the DMSP/OLS and NPP/VIIRS nighttime lighting data, this study formed a basic dataset of carbon emissions from energy consumption in Shenyang from 2010 to 2021, analyzed the spatial and temporal distribution characteristics of carbon emissions from energy consumption in Shenyang based on this dataset, and decomposed and analyzed the drivers of carbon emissions in Shenyang based on Kaya’s identity combined with the LMDI model. Our conclusions are as follows:
(a)
From 2010 to 2021, the carbon emission of energy consumption in Shenyang showed an upward trend, and the growth rate of carbon emission showed a trend of first rising and then decreasing. Total carbon emissions increased from 18.033 million tons in 2010 to 20.2543 million tons in 2021, and the average annual growth rate decreased from 2.165 percent in 2014–2017 to 0.46 percent in 2018–2021. The effect of carbon reduction has initially achieved results but has not yet reached a peak;
(b)
The carbon emission of energy consumption in Shenyang is radially distributed with Heping District and Shenhe District as the center of high carbon emission decreasing in all directions, and the overall spatial dimension of carbon emission in Shenyang is relatively stable;
(c)
The global Moran’s I index of carbon emissions in Shenyang from 2010 to 2021 is all greater than zero, and the correlation degree shows an overall trend of “increase—decrease”, indicating that the spatial concentration degree of carbon emissions in Shenyang decreases. High-high agglomeration is mainly distributed in the central region of the Heping District, Shenhe District, and Huanggu District, through technological exchanges and industrial integration with neighboring high carbon-emission districts and counties, to jointly reduce carbon emissions. Low-low agglomeration is mainly distributed in Shenbei New District, Faku County, and Xinmin City on the periphery of Shenyang, and reduces carbon emissions in high carbon zones by transferring production capacity with high carbon emission zones and counties. The phenomenon of low and high agglomeration occurred in Yuhong District, and the low-carbon economic development was realized using information exchange and technological innovation;
(d)
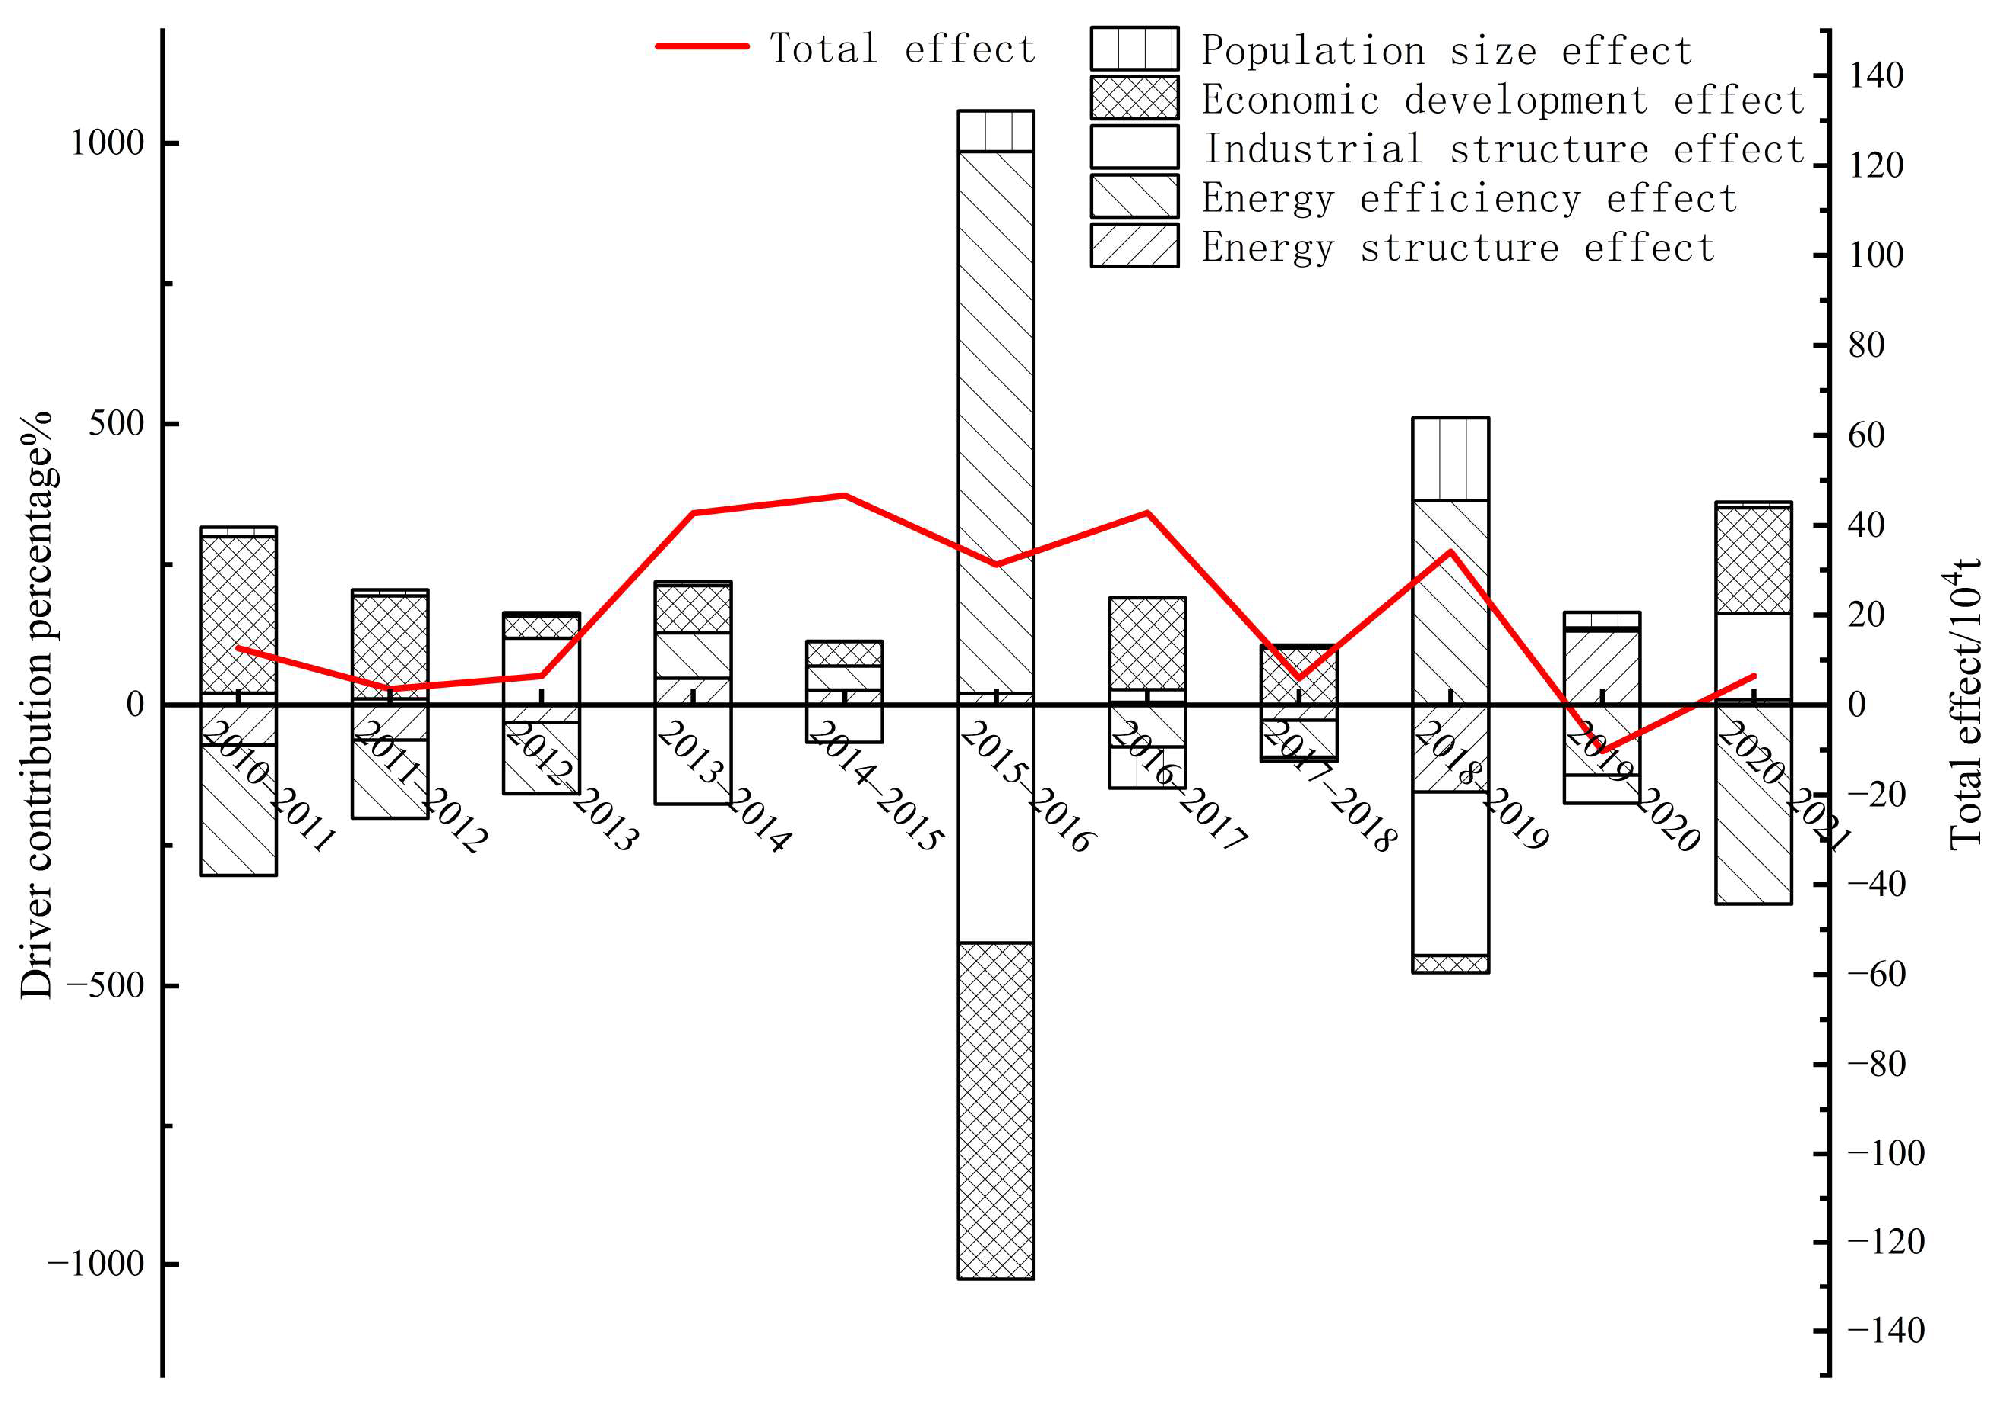
Economic development, population size, and energy efficiency have a significant positive contribution to Shenyang’s overall carbon emissions, while industrial structure and energy structure have a negative inhibitory effect on Shenyang’s overall carbon emissions, with economic development and industrial structure having more significant effects. The effects of driving factors are ranked as follows: Industrial Structure > Economic Development > Energy Efficiency > Population Size > Energy Structure.
In this paper, the long-term DMSP/OLS night light dataset of Shenyang was reconstructed to provide good data support for the long-term dynamic monitoring of carbon emission change in Shenyang. Using ESDA, Kaya identity, the LMDI model, this paper discusses the spatial-temporal change characteristics of Shenyang’s carbon emissions and the mechanism of influencing factors and puts forward differentiated low-carbon emission reduction policy suggestions. However, there are still some issues that require further discussion. First of all, the method adopted in this paper weakens and eliminates some problems existing in DMSP/OLS and NPP/VIIRS images to a certain extent, but the correction of the subsequent two types of image data is still important to be studied in the future. Secondly, ESDA is used to analyze the spatial correlation of carbon emissions. The spatial weights were adjacent queens, and the influence of social and economic factors on the spatial weights was not considered. In the future, a variety of weight indicators such as economic weight and population weight will be added to comprehensively analyze the impact on the spatial correlation of carbon emissions, so as to draw a more comprehensive conclusion on the change of spatial pattern of carbon emissions. Finally, the factors affecting the change in carbon emissions are complex, including but not limited to the level of science and technology, policy orientation, innovation ability, etc. Due to the difficulty of index data collection, the driving factor research index of the paper was not included. How to enrich and improve the quantification of driving factors is the focus direction of future carbon emission research.

Author Contributions

Conceptualization, T.B. and M.Z.; methodology, M.Z.; software, T.B.; data curation, M.Z.; writing—original draft preparation, T.B. and M.Z.; writing—review and editing, T.B. and M.Z.; formal analysis, T.B. and M.Z.; supervision, T.B. All authors have read and agreed to the published version of the manuscript.

Funding

This research was funded by grants from the Social Science Planning Fund of Liaoning Province (L19BGL031).

Institutional Review Board Statement

Not applicable.

Informed Consent Statement

Not applicable.

Data Availability Statement

Data available in a publicly accessible repository.

Conflicts of Interest

The authors declare no conflict of interest. The funders had no role in the design of the study; in the collection, analyses, or interpretation of data; in the writing of the manuscript; or in the decision to publish the results.

References

  1. Zhang, Q.; Han, Y.X.; Song, L.C. The summarize of development of global climate change and its effect factors. Adv. Earth Sci. 2005, 9, 990–998. [Google Scholar]
  2. Zhang, Y.J. The impact of financial development on carbon emissions: An empirical analysis in China. Energy Policy 2011, 39, 2197–2203. [Google Scholar] [CrossRef]
  3. Liu, Z.C.; Wang, A.J.; Yu, W.J.; Li, M. Research on regional carbon emissions in China. Acta Geoentica Sin. 2010, 31, 727–732. [Google Scholar]
  4. Xi, J.P. Jointly Build a win-win, fair and equitable climate change governance mechanism. People’s Daily, 1 December 2015. [Google Scholar]
  5. Xi, J.P. Building on past achievements and embarking on a new global journey against climate change: Remarks at the climate ambition summit. People’s Daily, 13 December 2020. [Google Scholar]
  6. Shan, Y.; Guan, D.; Liu, J.; Mi, Z.; Liu, Z.; Liu, J.; Schroeder, H.; Cai, B.; Chen, Y.; Shao, S.; et al. Methodology and applications of city level CO2 emission accounts in China. J. Clean. Prod. 2017, 161, 1215–1225. [Google Scholar] [CrossRef] [Green Version]
  7. Agency, I.E. World Energy Outlook 2008; Organization for Economic: Paris, France, 2008; p. 569. [Google Scholar]
  8. Ma, H.; Wang, L.Y. What is carbon peaking carbon neutrality. Jiangxi Daily, 14 April 2021. [Google Scholar]
  9. Wang, J.N.; Cai, B.F.; Cao, D.; Zhou, Y.; Liu, L.C. Scenario study on regional allocation of CO2 emissions allowance in China. Acta Sci. Circumstantiae 2011, 31, 680–685. [Google Scholar]
  10. Gai, M.; Zhang, F.X. Regional carbon emissions, economic development and environmental protection coupling in liaoning province. Sci. Geogr. Sin. 2018, 38, 164–766. [Google Scholar]
  11. Shan, Y.; Huang, Q.; Guan, D.; Hubacek, K. China CO2 emission accounts 2016–2017. Sci. Data 2020, 7, 54. [Google Scholar] [CrossRef] [Green Version]
  12. Aslan, A.; Destek, M.A.; Okumus, I. Sectoral carbon emissions and economic growth in the US: Further evidence from rolling window estimation method. J. Clean. Prod. 2018, 200, 402–411. [Google Scholar] [CrossRef]
  13. Liu, X.; Wang, Y. Analysis of driving factors of carbon emission in China’s manufacturing industry based on LMDI decomposition. Stat. Decis. 2022, 38, 60–63. [Google Scholar]
  14. Waxman, E.M.; Cossel, K.C.; Giorgetta, F.; Truong, G.W.; Swann, W.C.; Coddington, I.; Newbury, N.R. Estimating vehicle carbon dioxide emissions from Boulder, Colorado using horizontal path-integrated column measurements. Atmos. Chem. Phys. Discuss. 2019, 19, 4177–4192. [Google Scholar] [CrossRef] [Green Version]
  15. Azeez, O.S.; Pradhan, B.; Shafri, H.Z.M.; Shukla, N.; Lee, C.-W.; Rizeei, H.M. Modeling of CO Emissions from Traffic Vehicles Using Artificial Neural Networks. Appl. Sci. 2019, 9, 313. [Google Scholar] [CrossRef] [Green Version]
  16. Meng, F.; Fan, Z.; Wang, D.; Guo, W.; Liu, Y.; Cai, B.; Yang, Z. Urban carbon footprint accounting and implications for carbon neutrality from alife cycle perspective: A case study of Shenzhen. J. Beijing Norm. Univ. (Nat. Sci.) 2022, 58, 878–885. [Google Scholar]
  17. Marbuah, G.; Amuakwa, F. Spatial analysis of emissions in Sweden. Energy Econ. 2017, 68, 383–394. [Google Scholar] [CrossRef] [Green Version]
  18. Shang, M.; Wang, R.R.; Hu, Z. Spatial-temporal pattern evolution and driving mechanism of carbon emissions from energy consumption at provincial level in China: An analysis from the perspective of environmental regulation. Environ. Pollut. Control 2022, 44, 529–534+551. [Google Scholar]
  19. Nassar, R.; Napier-Linton, L.; Gurney, K.R.; Andres, R.J.; Oda, T.; Vogel, F.R.; Deng, F. Improving the temporal and spatial distribution of CO2 emissions from global fossil fuel emissions data sets. J. Geophys. Res. Atmos. 2013, 118, 917–933. [Google Scholar] [CrossRef]
  20. Hao, R.; Wei, W.; Liu, C.; Jie, B.; Du, H. Spatialization and spatial-temporal dynamics of energy consumption carbon emissions in China. Environ. Sci. 2022, 43, 5305–5314. [Google Scholar]
  21. Liu, Y.; Liu, H. Characteristics, influence factors, and prediction of agricultural carbon emissions in Shandong Province. Chin. J. Eco-Agric. 2022, 30, 558–569. [Google Scholar]
  22. Chen, J.; Li, Q. Research on the influencing factors of energy consumption carbon emission in Sichuan Province under the background of the construction of Chengdu-Chongqing double city economic circle: From the perspective of LMDI method. Ecol. Econ. 2021, 37, 30–36. [Google Scholar]
  23. Tian, J.; Zhang, J. Analysis of influencing factors of carbon emission in coal-rich areas based on STIRPAT model. J. Xi’an Univ. Sci. Technol. 2021, 41, 692–699. [Google Scholar]
  24. Liu, M.; Yue, Y.; Liu, S.; Li, J.; Liu, J.; Sun, M. Multi-dimensional analysis of synergistic effect of pollution reduction and carbon reduction in Tianjin based on STIRPAT Model. J. Environ. Sci. 2023, 44, 1277–1286. [Google Scholar]
  25. Mao, Y.; Qu, Y.; Zheng, T. Carbon emission effect and Energy efficiency mechanism of green credit: An analysis based on spatial econometric model. Financ. Theory Pract. 2022, 9, 57–68. [Google Scholar]
  26. Miao, J.; Hua, C.; Feng, J. The upgrading effect of industrial collaborative agglomeration and carbon emission: An empirical analysis based on spatial econometric model. Ecol. Econ. 2019, 36, 28–33. [Google Scholar]
  27. Ang, B.W.; Zhang, F.Q.; Choi, K.H. Factorizing changes in energy and environmental indicators through decomposition. Energy 1998, 23, 489–495. [Google Scholar] [CrossRef]
  28. Ang, B.W.; Liu, F.L. A new energy decomposition method: Perfect in decomposition and consistent in aggregation. Energy 2001, 26, 537–548. [Google Scholar] [CrossRef]
  29. Ang, B.W. The LMDI approach to decomposition analysis: A practical guide. Energy Policy 2005, 33, 867–871. [Google Scholar] [CrossRef]
  30. Ang, B.W.; Liu, F.L.; Chew, E.P. Perfect decomposition techniques in energy and environmental analysis. Energy Policy 2003, 31, 1561–1566. [Google Scholar] [CrossRef]
  31. Song, G.J.; Wang, Y.L.; Jiang, Y.J. Carbon emission control policy design based on the targets of carbon peak and carbon neutrality. China Popul. Resour. Environ. 2021, 31, 55–63. [Google Scholar]
  32. Chen, Z.Q. A Multiscale Analysis on Urban Area and Spatial Structure Based on Nighttime Light Data; East China Normal University: Shanghai, China, 2017. [Google Scholar]
  33. Sahoo, S.; Gupta, P.K.; Srivastav, S.K. Comparative analysis between VIIRS-DNB and DMSP-OLS night-time light data to estimate electric power consumption in Uttar Pradesh, India. Int. J. Remote Sens. 2020, 41, 2565–2580. [Google Scholar] [CrossRef]
  34. Li, J. Analysis on evolution of technology innovation and regional economic development spatio-temporal pattern: Based on NPP/VIIRS night light data. Areal Res. Dev. 2022, 41, 1–5+11. [Google Scholar]
  35. Hu, C.Y.; Zhang, W.J.; Liu, X.Y. On the spatio-temporal evolution and coordinated development of North-South economic gap—An empirical study based on county-level NNP/VIIRS nighttime light data. China Bus. Market. 2022, 36, 60–69. [Google Scholar]
  36. Ustaoglu, E.; Bovkir, R.; Aydinoglu, A.C. Spatial distribution of GDP based on integrated NPS-VIIRS nighttime light and MODIS EVI data: A case study of Turkey. Environ. Dev. Sustain. 2021, 23, 10309–10343. [Google Scholar] [CrossRef]
  37. Lu, X.; Li, J.; Duan, P.; Zhang, B.R.; Li, C. Correction of nighttime light images of DMSP/OLS in China. Bull. Surv. Mapp. 2019, 7, 127–131+159. [Google Scholar]
  38. Yu, B.; Tang, M.; Wu, Q.; Yang, C.; Deng, S.; Shi, K.; Peng, C.; Wu, J.; Chen, Z. Urban built-up area extraction from log- transformed NPP- VIIRS nighttime light composite data. IEEE Geosci. Remote Sens. Lett. 2018, 15, 1279–1283. [Google Scholar] [CrossRef]
  39. Du, H.B.; Wei, W.; Zhang, X.Y.; Qiu, Y. Spatio-temporal evolution and influencing factors of energy-related carbon emissions in the Yellow River Basin: Based on the DMSP/OLS and NPP/VIIRS nighttime light data. Geogr. Res. 2021, 40, 2051–2065. [Google Scholar]
  40. Tobler, W. A computer movie simulating urban growth in the detroit region. Econ. Geogr. 1970, 46, 234–240. [Google Scholar] [CrossRef]
  41. Xu, J.H. Quantitative Geography; Higher Education Press: Beijing, China, 2006. [Google Scholar]
  42. Wang, Q.; Zhou, D. Improved model for evaluating rebound effect of energy resource and its empirical research. J. Manag. 2008, 5, 688–691. [Google Scholar]
  43. Han, M.; Xiong, J.; Liu, W. Spatio-temporal distribution, competitive development and emission reduction of China’s photovoltaic power generation. J. Nat. Resour. 2022, 37, 1338–1351. [Google Scholar] [CrossRef]
  44. Lu, R.; Li, X. Research on cooperation mechanism of government-university-research and industry-energy conservation: A case study of Tianjin. Sci. Technol. Prog. Countermeas. 2015, 32, 48–54. [Google Scholar]
  45. Li, Z.; Hu, S.; Liu, H. An appraisal of the Yangtze River Delta eco-green integrated development demonstration zone. Sci. Technol. Rev. 2021, 39, 30–35. [Google Scholar]
  46. Ge, L.; Fan, Y.; Lai, J.; Sun, Y.; Zhang, Y. Artificial Intelligence Enabled Microgrid Optimization Technology for Low Carbon Economy. High Volt. Technol. 2023, 49, 2219–2238. [Google Scholar]
  47. Zeng, B.; Mu, H.; Dong, H.; Zeng, M. Optimization of active distribution network operation considering decarbonization endowment from 5G base stations. J. Shanghai Jiao Tong Univ. 2022, 56, 279–292. [Google Scholar]
  48. Wang, Z. New energy industry leads economic green and low-carbon development. Energy Storage Sci. Technol. 2023, 12, 1306–1307. [Google Scholar]
  49. Liu, J.; Liu, Z. Research on Application and development countermeasures of green and low-carbon Packaging Materials. Packag. Eng. 2015, 36, 145–148. [Google Scholar]
Figure 1. Changes in Carbon Emissions and Their Growth Rates in Shenyang, 2010–2021.
Sustainability 15 12172 g001
Figure 2. Spatial Distribution of Carbon Emissions in Shenyang, 2010–2021.
Sustainability 15 12172 g002
Figure 3. Distribution of Contribution of Energy Carbon Emission Drivers in Shenyang 2010–2021.
Sustainability 15 12172 g003
Table 1. Energy Conversion Factor and Carbon Emission Factor.
Energy TypeStandard Coal Coefficient (tce·t−1)Carbon Emission Coefficient (t·tce−1)
Coal0.71430.7559
Coke0.97140.8550
Crude oil1.42860.5857
Gasoline1.47140.5538
Kerosene1.47140.5714
Diesel oil1.45710.5921
Fuel oil1.42860.6185
Natural gas1.3300 kg/m30.4483
Electricity0.345 kg/kWh0.2720
Note: The standard coal conversion factor refers to GB/T 2589–2020 “General Rules for Calculating Comprehensive Energy Consumption”; the carbon emission factor refers to “IPCC Guidelines for National Greenhouse Gas Inventories”.
Table 2. Fitting regression results for carbon emissions in Shenyang, 2010–2021.
YearFit Coefficients kGoodness of Fit R2Significance Level P
2010–2012126.2120.9990.000
2013–201740.9640.9990.000
2018–202140.6020.9980.000
Table 3. Primary Data Sources.
CategoryDataData Sources
Raster dataYear by year DMSP-OLS stabilized night light data (2010–2013)NGDC (National Geophysical Data Center) (https://ngdc.noaa.gov/eog/download.html, accessed on 10 July 2022)
Year by year NPP-VIIRS Night Light Data (2013–2021)EOG (Earth Observation Group) (https://eogdata.mines.edu/products/vnl/, accessed on 10 July 2022)
Socioeconomic dataData of permanent resident population of Shenyang at the end of the yearShenyang Statistical Yearbook (2010–2021)
China Urban Statistical Yearbook (2010–2021)
Gross regional product of Shenyang
9 kinds of fossil energy consumptionChina Energy Statistical Yearbook (2010–2021)
Shenyang Statistical Yearbook (2010–2021)
Fossil energy to standard coal coefficientGB/T2589-2020 General Rules for Comprehensive Energy Consumption Calculation
Carbon emission coefficientIPCC Guidelines for National Greenhouse Gas Emission Inventories 2006
Vector dataShenyang administrative boundary vector dataNational geographic information public service platform—map world (https://www.tianditu.gov.cn/, accessed on 13 July 2022)
Table 4. Moran’s I Index of Carbon Emissions in Shenyang, 2010–2021.
YearMoran’s I Indexp ValueZ Value
20100.62920.0003.9030
20130.64000.0003.9606
20170.50730.0003.3232
20210.50530.0003.3297
Table 5. Local Spatial Autocorrelation Results for Carbon Emissions in Shenyang, 2010–2021.
YearHigh Carbon Emission Zone—High Carbon Emission ZoneLow Carbon Emission Zone—Low Carbon Emission ZoneLow Carbon Emission Zone—High Carbon Emission ZoneHigh Carbon Emission Zone—Low Carbon Emission Zone
2010Heping District,
Shenhe District,
Huanggu District
Shenbei New District,
Faku County,
Xinmin City
Yuhong DistrictNone
2013Heping District,
Shenhe District,
Huanggu District
Faku County,
Xinmin City
Yuhong DistrictNone
2017Heping District,
Shenhe District,
Huanggu District,
Tiexi District
Shenbei New District,
Faku County,
Xinmin City
Yuhong DistrictNone
2021Heping District,
Shenhe District,
Huanggu District
Shenbei New District,
Faku County,
Xinmin City
Yuhong DistrictNone
Table 6. Factor Decomposition of Incremental Carbon Emissions from Energy Consumption in Shenyang, 2010–2021.
Energy Structure EffectEnergy Efficiency EffectIndustrial Structure EffectEconomic Development EffectPopulation Size EffectTotal Effect
2010–2011−71.163−232.28821.242278.38616.44512.622
2011–2012−62.335−139.14911.167183.22610.6353.544
2012–2013−31.294−126.769118.83939.2516.4136.440
2013–201447.35080.841−176.22384.0106.69942.676
2014–201526.55242.843−66.64142.9410.91346.609
2015–201620.490964.031−423.792−602.16672.67031.233
2016–20174.865−74.75322.477163.498−73.34942.739
2017–2018−27.337−65.671−7.361101.0695.2775.977
2018–2019−154.481363.625−291.182−31.017147.16434.108
2019–2020131.714−124.992−50.3645.07628.307−10.258
2020–20219.721−354.622152.854188.46010.0056.418
Total−105.917333.095−688.984452.734231.180222.107
Disclaimer/Publisher’s Note: The statements, opinions and data contained in all publications are solely those of the individual author(s) and contributor(s) and not of MDPI and/or the editor(s). MDPI and/or the editor(s) disclaim responsibility for any injury to people or property resulting from any ideas, methods, instructions or products referred to in the content.

