Article

Performance Improvement Plan towards Energy-Efficient Naturally Ventilated Houses in Tropical Climate Regions

1
Graduate School of Human-Environment Studies, Kyushu University, 744 Motooka, Fukuoka 819-0395, Japan
2
Faculty of Human-Environment Studies, Kyushu University, 744 Motooka, Fukuoka 819-0395, Japan
*
Author to whom correspondence should be addressed.
Sustainability 2023, 15(16), 12173; https://doi.org/10.3390/su151612173
Submission received: 22 June 2023 / Revised: 3 August 2023 / Accepted: 6 August 2023 / Published: 9 August 2023
(This article belongs to the Section Green Building)

Abstract

:
The majority of the population in Indonesia lives in naturally ventilated and unconditioned residential buildings because they cannot afford energy services. This situation is common in many countries in tropical regions, negatively affecting the occupants’ health due to overheating. Therefore, housing types that can cool down indoor temperatures to the extent possible using a passive approach, rather than an active approach, should be developed. This study aims to improve naturally ventilated houses by considering the louver area and insulation of houses. First, we employ an on-site measurement for collecting data such as the indoor/outdoor temperature and relative humidity in an Indonesian city, Lhokseumawe. In addition, the experimental data are used to validate a numerical simulation model. Second, the numerical simulation is utilized to establish energy-efficient design solutions for houses in 14 Indonesian locations. The results show that, compared with the insulation cases, different louver areas insignificantly change indoor air conditions by approximately 0.3 to 1 °C. Additionally, the application of a combined performance improvement for both louver areas and building envelope insulation levels can reduce the indoor air temperature and relative humidity by 2.2 °C and 8%, respectively. Moreover, the daily cooling demand for the proposed improvement plan is reduced by 18.90% compared with that for the existing case. Furthermore, the annual cooling loads for the entire simulated regions are reduced by 46.63 GJ/year (23.09%). This study is a potential starting point for achieving zero-energy housing and occupants’ sufficient thermal comfort in unconditioned and naturally ventilated houses in Indonesia.

1. Introduction

Approximately 40% of the energy consumption worldwide is attributed to buildings, indicating their crucial role in the energy market. Moreover, the demand for building energy is expected to persistently increase in the forthcoming decades [1]. Tropical regions such as Indonesia have similar weather patterns of high temperature and humidity annually, thus triggering higher energy demands for cooling indoors.
Energy poverty has emerged as a critical issue in global development, particularly in Indonesia. Many small islands in Indonesia do not have electricity, and most Indonesians are in deep energy poverty [2], which describes a condition whereby a household spends more than 10% of its total income on energy services [3]. Furthermore, providing access to energy in Indonesia is still challenging because many people live in remote areas and are spread on approximately 16.056 islands. The Papua and East Nusa Tenggara provinces have electrification ratios of approximately 61.4% and 59.8% [2], respectively. This implies that most Indonesians experiencing energy poverty may be unable to afford air conditioning or electricity, increasing the risk of heat-related diseases. Because of the thermal discomfort experienced by individuals living in energy poverty, their physical and mental health are adversely affected [4,5,6,7,8,9]. Moreover, this may result in underlying medical conditions such as respiratory [10] and cardiovascular diseases [8,11,12].
Furthermore, Indonesia still lacks building codes to reduce building thermal loads. In 2005, national standards related to building envelopes, air conditioning, lighting, and building energy auditing were established for the first time, but they were not mandated. In 2012, the capital city of DKI Jakarta issued the first and only mandatory green building regulation. The main focus of these regulations is to improve energy efficiency, water efficiency, indoor air quality, waste and soil treatment, and construction practices. They apply to a wide range of building sizes and types, encompassing apartment buildings, office buildings, trade buildings, and multi-functional structures. Furthermore, they are relevant to business establishments, hotels, social and cultural facilities, health care buildings, as well as educational service buildings. The aim is to encourage sustainable and environmentally conscious approaches in the construction and operation of these buildings, promoting responsible resource use and minimizing environmental impact. However, most neighboring and remote cities lack attention. This implies that the mandatory regulation energy standard for building designs in Indonesia needs to be complied with and upgraded according to climate zones.
To address the abovementioned issues, a passive design plan for naturally ventilated Indonesian houses should be developed as an initial step to comply with the existing standards according to the climate zones. Therefore, this study developed a passive design for a naturally ventilated house by investigating the effects of various passive design improvements on indoor environmental conditions. We simulated the cooling loads of the developed improvement plans and compared them to existing general Indonesian households. Additionally, considering various climate conditions, we examined the annual cooling loads of the performance improvement plan in various cities in Indonesia according to their respective climate zones.
The remainder of this paper is organized as follows: Section 2 provides an overview of the research methodology, including details on the test house and improvement plan. In Section 3, we discuss the development of the base simulation model using the dynamic numerical program THERB, the calculation of the discharge coefficient via computational fluid dynamics (CFDs), and the collection of wind pressure coefficients obtained from the literature review by CPX. Then, we compared the accuracy of these methods. Section 4 presents the simulation results. Finally, the conclusions are presented in Section 5.

2. Methodology

The methodology of this study consists of four significant steps shown in Figure 1. The first step is to perform on-site measurements of the temperature and humidity indoors and outdoors. Then, the data are used to verify the accuracy of a base simulation model. The details of the housing configuration are also identified for the numerical simulation. The second step is to develop a base simulation model of the test house. The third step is to develop an improvement plan for Indonesian housing to save energy. The area for the improvement plan is primarily related to the louver opening area and insulation level. The final step is to identify the proper improvement plan in various regions of Indonesia by simulating annual cooling loads using the validated model.

2.1. Overview of the Test House

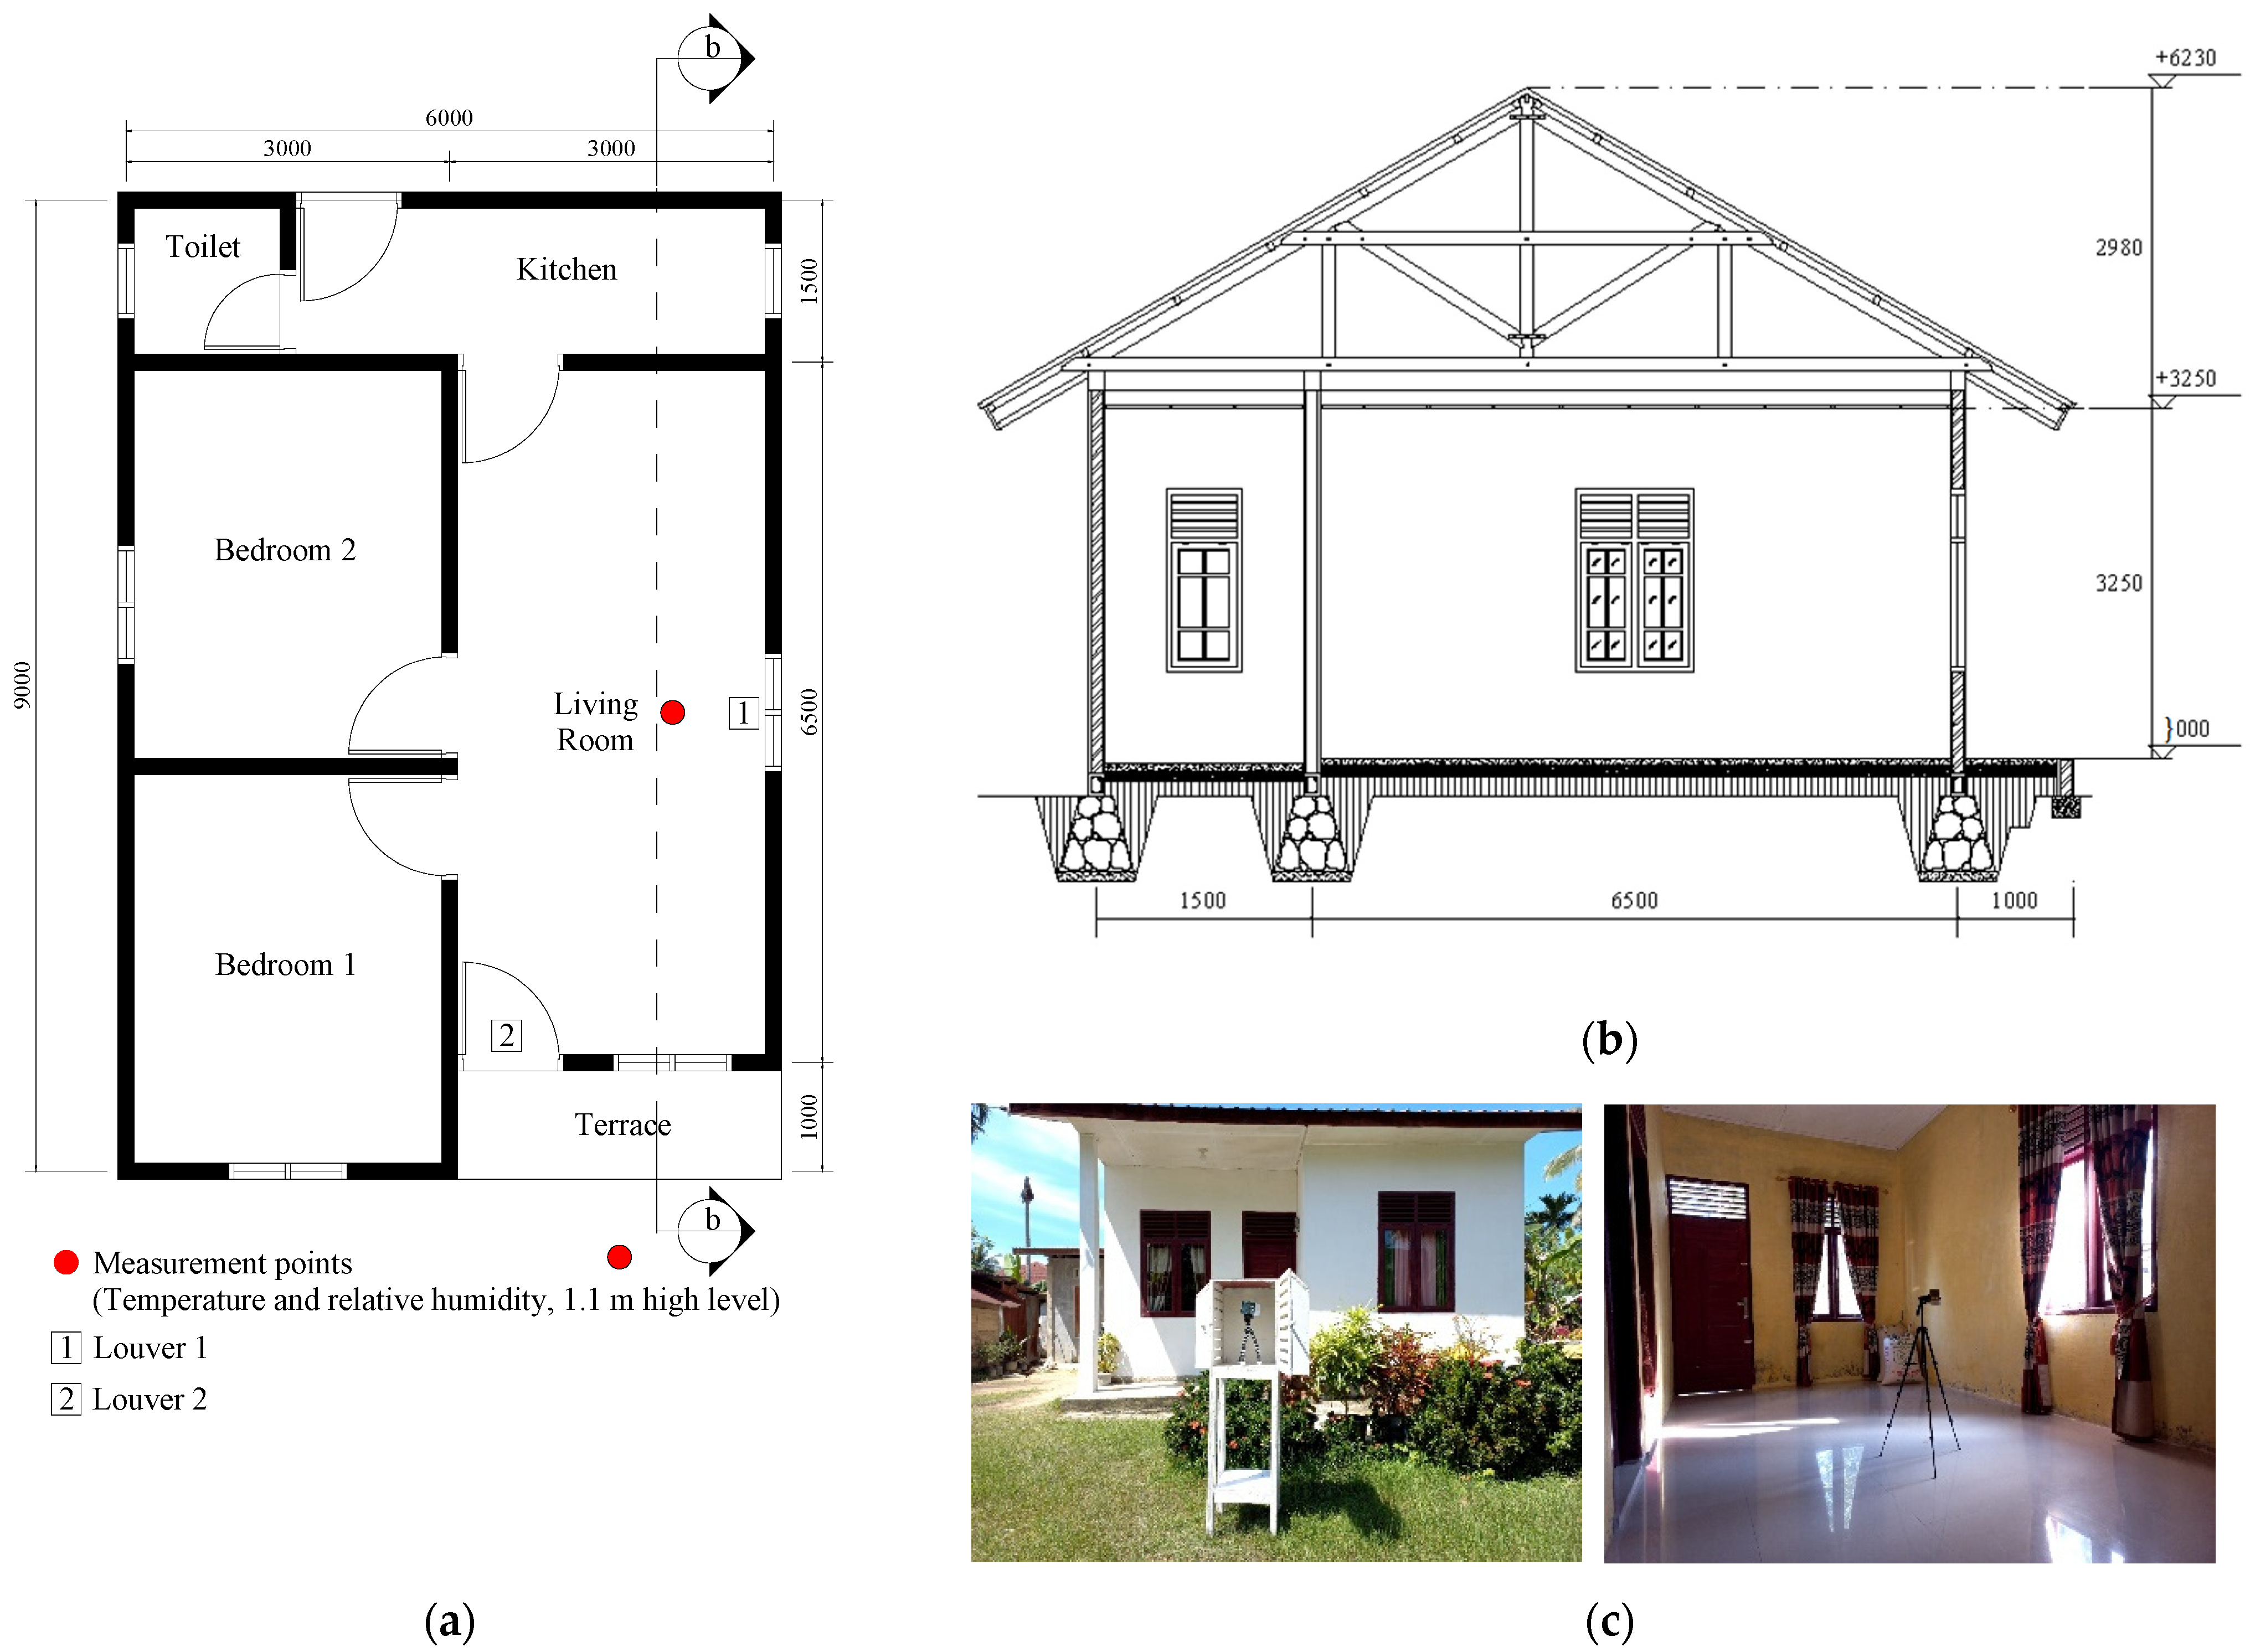
The configuration of the test house for the numerical analysis is based on an existing house where people are living, as shown in Figure 2. The house is a housing prototype, built in large numbers after the tsunami attack in 2004 in Indonesia. By 2008, approximately 104,200 permanent residences had been built based on this floor plan by various sponsors, including the Indonesian government and local and international non-governmental organizations [13]. The experimental houses are low-cost, with a building envelope comprising a combination of concrete and brickwork, and feature a zinc roof material, as shown in Table 1. The configuration of this house is typical in Indonesian households and was classified as a detached modern house [14] with a total floor area of 54 m2 and averaging a four-person occupancy. The material employed exhibited high thermal conductivity, which affected the process of rapid heat transfer from outdoors to indoors.
Most low-income occupants primarily rely on window and door openings to avoid excessive indoor temperatures during the daytime at peak heat conditions, rather than operating the air conditioner for cooling. In tropical buildings, window openings can be effective to reduce heat buildup, which in turn can lower indoor air temperatures and nighttime cooling loads [15]. For free cooling, the opening ratio design significantly affects the ventilation rate. Louver-attached windows, which can partly improve the comfort level by increasing air velocity, are among the traditional design factors of Indonesian housing [16]. Louvers are typically arranged in a pattern, either horizontally or vertically, and are usually made from wood, although modern homes may also use metal or plastic materials.
Notably, the building material functions as a barrier between the outside temperature, from sources such as solar radiation, and the inside temperature. Therefore, factors such as material properties, thickness, the air cavity, and outer surface configurations should be considered. Because most occupants spend sufficient time in the living room during daily activities, this study set the living room as a target of simulation. In addition, the temperature and relative humidity were measured inside the living room and outside using a USB Temperature and Humidity Data Logger DS 102. The specifications of the measurement devices are listed in Table 2.

2.2. Climates, Target Cities, and Calculation Condition

Climatic zones in Indonesia are determined by the temperature range and wind speed. They are divided into eight climate zones: equatorial, sub-equatorial, highland tropical, extremely highland tropical, monsoonal, sub-monsoonal, savanna, and sub-savanna zones [17].
This study proposes a passive design based on an optimal combination of passive design measures, which is determined through thermal load simulation. The classification of these zones significantly depends on the criteria of thermal climatic zones and local climatic conditions. Therefore, this study selected 14 cities that are uniformly distributed across the eight thermal climatic regions and have weather data available for simulation. The selected cities include two in the equatorial, two in the sub-equatorial, one in the highland, one in the extremely highland, two in the monsoonal, two in the sub-monsoonal, two in the savanna, and two in the sub-savanna zones.
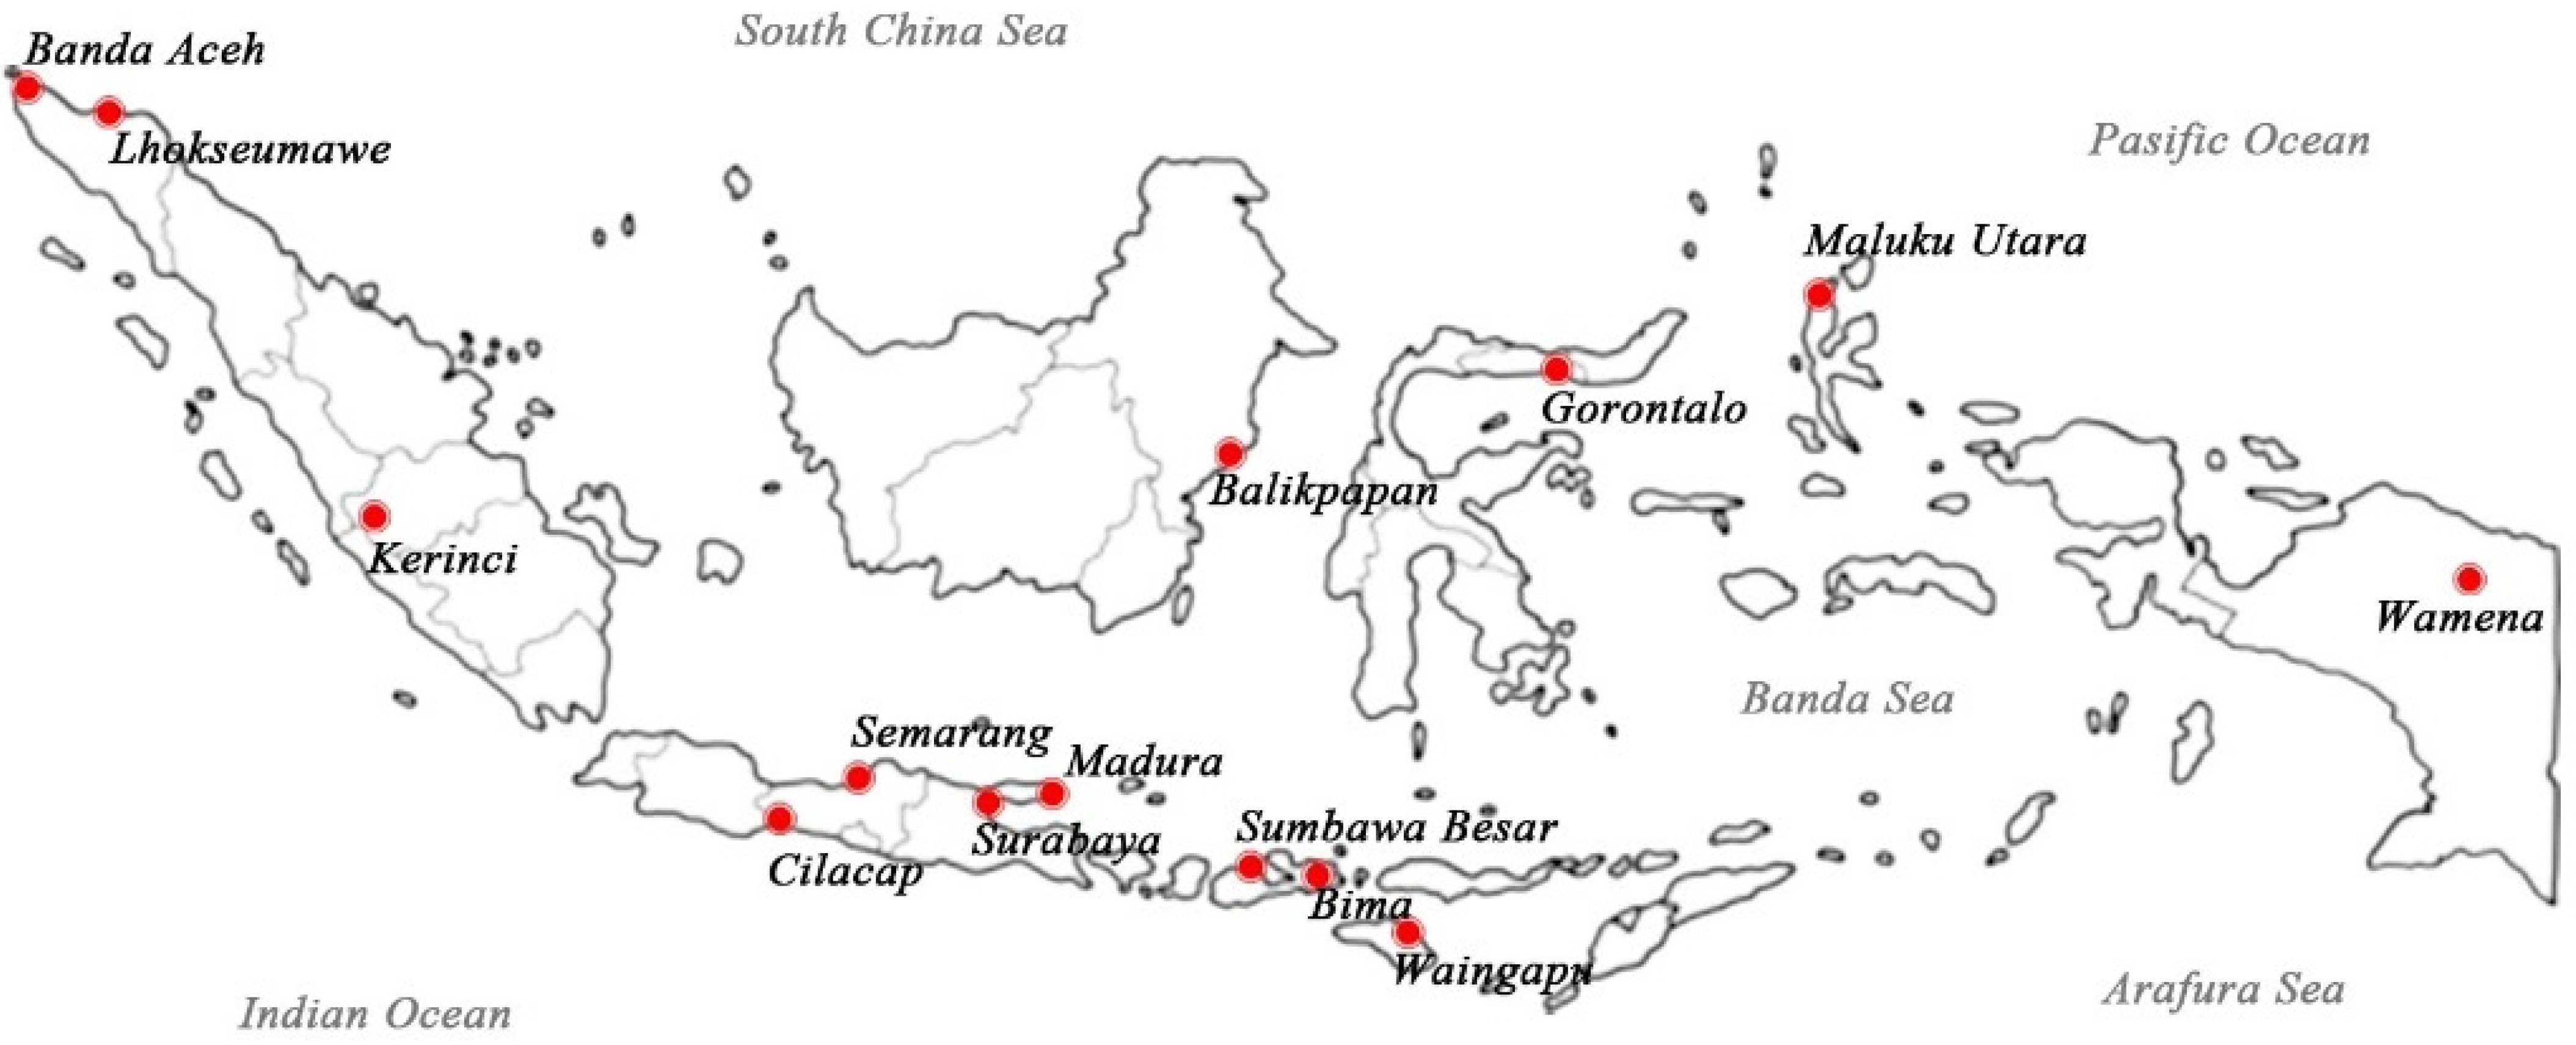
Furthermore, to investigate the hourly performance of the target room in the test house, the simulation was conducted for two weeks in the dry season (July) with an interval of 60 s, and the data were averaged hourly. The selection time of the simulation was predicted as the peak of hot and humid conditions in Indonesia. Meanwhile, to calculate the daily cooling load, the simulation periods were one year (January 1 to December 31), and the data were divided by 365. In addition, to simulate the selected cities, the weather data were expanded from IWEC2, as recommended by ASHRAE for building simulations. The calculation conditions for the annual cooling loads of the target cities are listed in Table 3. Figure 3 illustrates the locations of the cities on the Indonesia map, and Table 4 presents their climatic conditions.

2.3. Improvement Plan

Several studies have explored optimizing passive design techniques, such as the insulation level of building envelopes, window-to-wall ratio (opening ratio), overhang depth, air leakage, and energy performance of glazing, for residential buildings [15,18,19,20,21]. The passive design is significantly influenced by climate conditions and is an effective means of reducing energy consumption in residential buildings. The external wall insulation level is the most significant parameter in terms of its impact on the annual thermal load, contributing to approximately 70% of the total impact [18]. In tropical climates, the opening ratio of windows in residential buildings has a significant impact on the indoor environment and energy consumption. When the window-to-wall ratio is reduced from 1 to 0.4, the largest reductions in indoor air temperatures are observed [15]. Additionally, window openings are effective in reducing nighttime cooling loads because they promote heat dissipation during the daytime [15]. Therefore, the opening ratio and insulation level of the building envelope are effective to maintain indoor environment conditions and control the annual cost of cooling loads in tropical regions. Consequently, the performance of the improvement plan in this study was dependent on various opening ratios (louver) and insulation levels.
Because the louver shape of the test house is commonly used in low-cost houses in Indonesia, this study examines the impact of the louver by enlarging and reducing the area and comparing it to existing conditions. The insulation consisted of four integrated levels: external wall, roof, and ceiling insulations. One study reported that the material composition of the building envelope significantly reduces annual cooling loads and indoor environmental conditions. Ashouri et al. investigated two insulation materials, rockwool and glasswool. They reported that the optimal thicknesses resulted in annual cost savings of 1.6028 K/m2 for glasswool and 0.7658 K/m2 for rockwool [22].
Therefore, this study employs two primary insulation materials (glasswool and rockwool), and another material, particle board or plywood, is used for comparison. For the roof part, the insulation of the proposed cases was strengthened by more than 100% compared with that of the existing case. In addition, the external wall insulation is upgraded by adding glasswool, plywood, and particle boards, including air cavities. The U-value of the external wall is 0.51 W/(m2·K), whereas that of the existing condition is 3.29 W/(m2·K). A significant improvement was also achieved for the ceiling by adding 100 mm of rockwool. The ceiling proposed in this study could reduce the U-value to 0.33 W/(m2·K) compared with the existing value of 5.48 W/(m2·K). In addition, various combinations of louver opening ratios and insulation levels were combined to determine the best performance among the test cases. Case N represents the actual condition of the test house, and this study examines 24 cases of improved plans. Figure 4 demonstrates the insulation improvement plan, and Table 5 illustrates the configuration of the simulation cases.
This study calculated the indoor environmental conditions using a dynamic simulation program termed THERB for HAM [23]. This program is an official software (TherbV70NAF) approved by the Japanese government with nationwide applications. It can calculate the time series of indoor temperatures, humidity, and heating/cooling loads for the entire building, considering the complete heat, air, and moisture (HAM) features with the network airflow model (NAF). The network airflow model is based on the continuity, aperture, and crevice flow equations expressed as follows:
i = 1 I Q i = 0
Q i = C d i A i 2 g γ Δ p i 4 C d i A i Δ p i
Q i = a i l i Δ p i 1 n  
where Q represents the air flow rate [m3], A is the opening area [m2], ɑ is the gap characteristic value [-], g is the gravitational acceleration [=9.8 m/s2], l is the gap length [m], ΔP is the pressure difference [Pa], Cd is the discharge coefficient [-], γ is the specific weight of air [kg/m3], and n = 1.5 (constant between 1 and 2). In addition, for an independent ventilation layer, the dimensionless flow rate is derived as a function of the dimensionless length of the ventilation layer. The modified Rayleigh number from the dimensionless energy equation, the equation of motion, continuity, and the actual ventilation rate are also predicted.

3. Development of the Base Simulation Model

3.1. Discharge Coefficient

The discharge coefficient (Cd) accounts for the effects of flow contraction and frictional losses through an opening. A value of Cd = 0.6 is typically used and can be derived analytically for a sharp-edged orifice opening [24,25]. Awbi et al. showed that the discharge coefficient value varies with the geometry of the opening and the pressure differential due to external factors [26]. Because the louver openings of the test house have a specific geometry and are unidentified in the references, this study utilized CFDs to investigate the discharge coefficients. The numerical analysis of the CFDs is divided into finite difference, finite element, spectrum, and finite volume methods. In this study, a numerical analysis was conducted using a finite volume method, which subdivides the computational domain into a finite number of minute volume spaces and considers the balance of each physical quantity in each minute space. The balance of the physical quantity is discretized and expressed by integrating the fundamental equation in each control volume. An unknown quantity is defined at the center of each control volume, and using this value, the inflow and outflow of physical quantities at the boundaries of each control volume are calculated. Furthermore, a solution is obtained using a discretization formula. The nature of the wind that blows near the Earth’s surface changes with the objects on the ground. The average wind speed near the ground surface decreases and increases as it moves vertically upward. This change in the wind speed depends on the influence of the ground surface. The following formula provides the average wind speed at a certain height Uz:
U z = U s Z Z s α  
where Uz is the average wind speed at the ground level Z [m/s], and Us is the average wind speed at a reference ground height Zs [m/s]. The power exponent α is affected by the roughness of the ground surface and becomes more significant as the degree of roughness increases. According to the Building Load Guidelines of the Architectural Institute of Japan [27], this value expresses the relationship between the condition of the ground surface and the power index based on the observational results of the natural wind and the roughness of the ground surface, as shown in Table 6.
Moreover, the turbulence energy, which is the turbulence intensity of the fluid flow, is expressed by Equation (5) from the wind speed and turbulence intensity expressed by Equation (6).
I z = 0.1 Z Z g α 0.05
k z = I z U z 2
where I(z) is the turbulence strength at the ground level Z, and the dissipation factor, which indicates the speed at which turbulence disappears, is expressed by the following equation:
ε z = C μ 1 2 k z U s Z s α Z Z s α 1
where Cµ is the eddy viscosity. The inflow boundary condition for the numerical simulation of the discharge coefficients, including the inflow wind speed, turbulence energy dissipation rate, and turbulence energy, is used as input values in the CFD simulation (Figure S1). The analysis conditions of the calculated discharge coefficients for louver openings are shown in Table 7.
The discharge coefficients are averaged to obtain the results: Louvers 1 and 2 are 0.57 and 0.68, respectively. In addition, the values of the discharge coefficients are used as input data, which are building data, in the numerical simulation software (TherbV70NAF).

3.2. Wind Pressure Coefficient

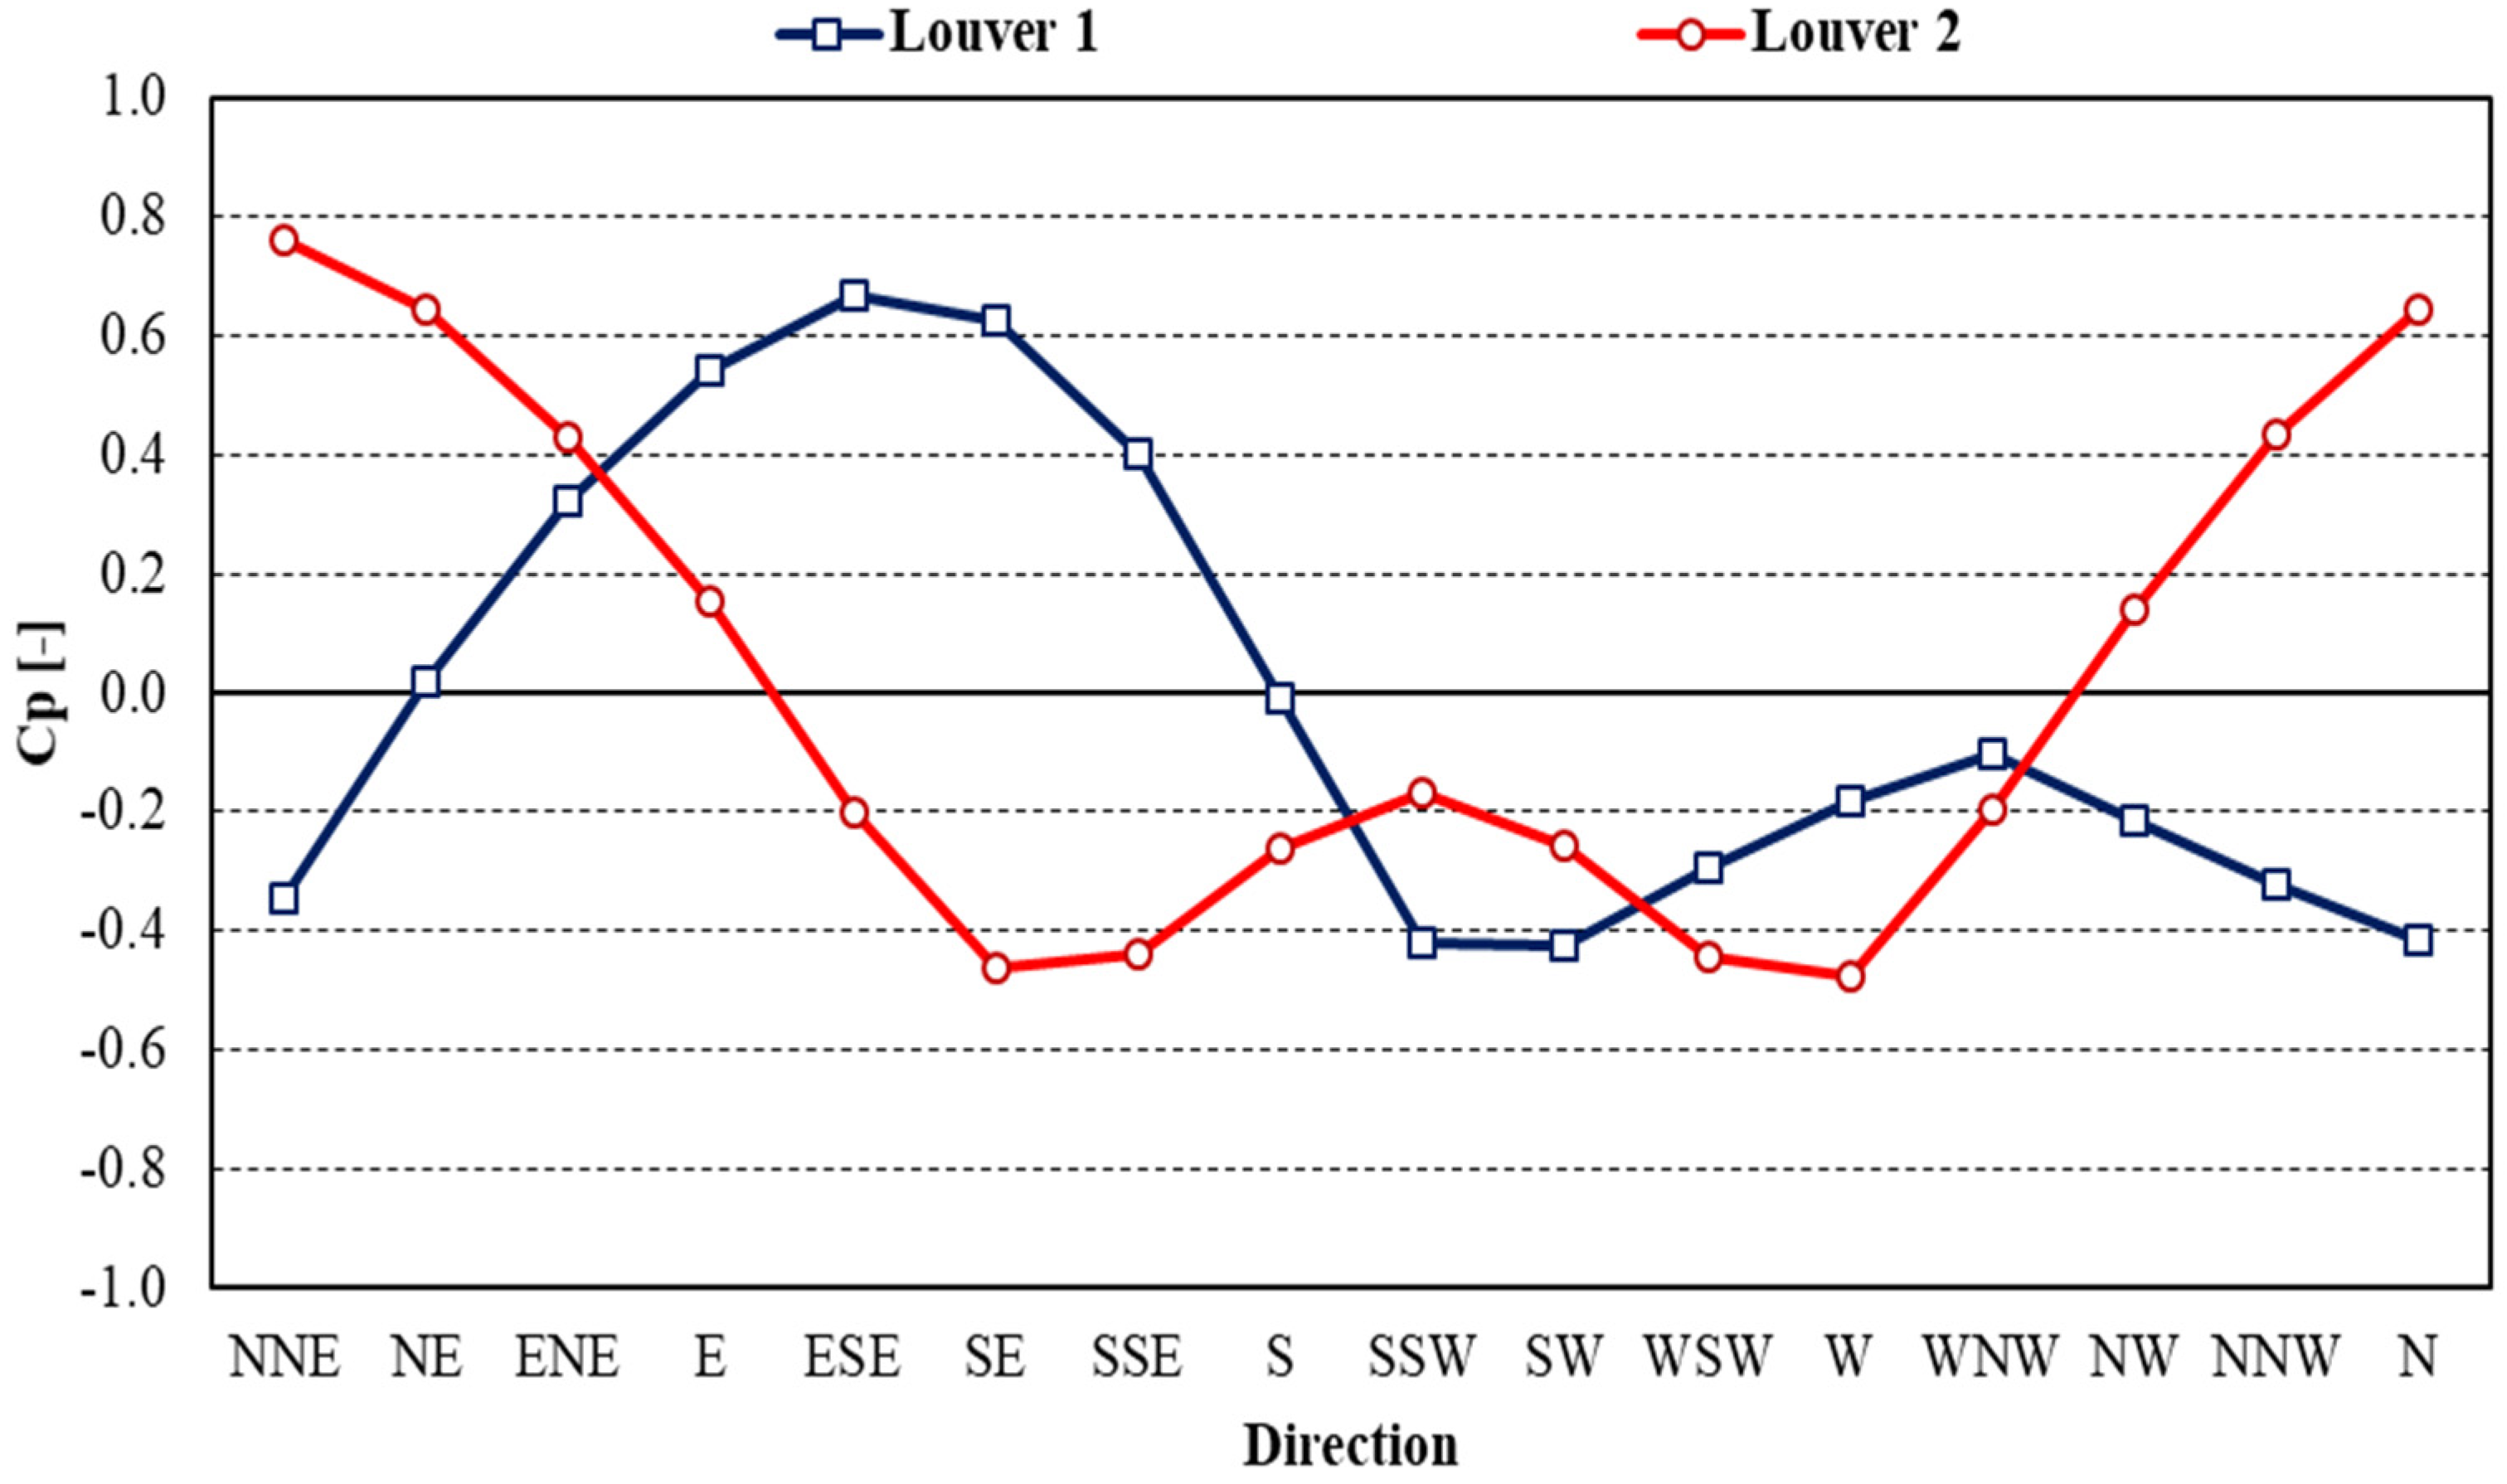
The wind pressure coefficient (Cp) expresses the degree to which a building receives wind force and describes the pressure distribution on the building surfaces. The value of the wind pressure coefficient depends on a wide range of parameters, including the building shape, envelope detailing, position on the façade, wind speed, wind direction, and turbulence intensity. Cóstola et al. [28] identified two main sources of Cp data. The primary sources include full-scale measurements, wind-tunnel measurements, and CFD simulations, and the secondary sources include databases and analytical models. In this study, the wind pressure coefficients utilize a database for the natural ventilation design that is compiled in CP-X [29]. This database employs a wind tunnel experiment to determine the wind pressure coefficients, including those of detached houses that are similar to that of the test house. The standard values of the wind pressure coefficients of the test house, according to the reference, are shown in Figure 5. They are used as the input values of the wind pressure coefficients in the room data of the numerical simulation.

3.3. Simulation Accuracy Verification

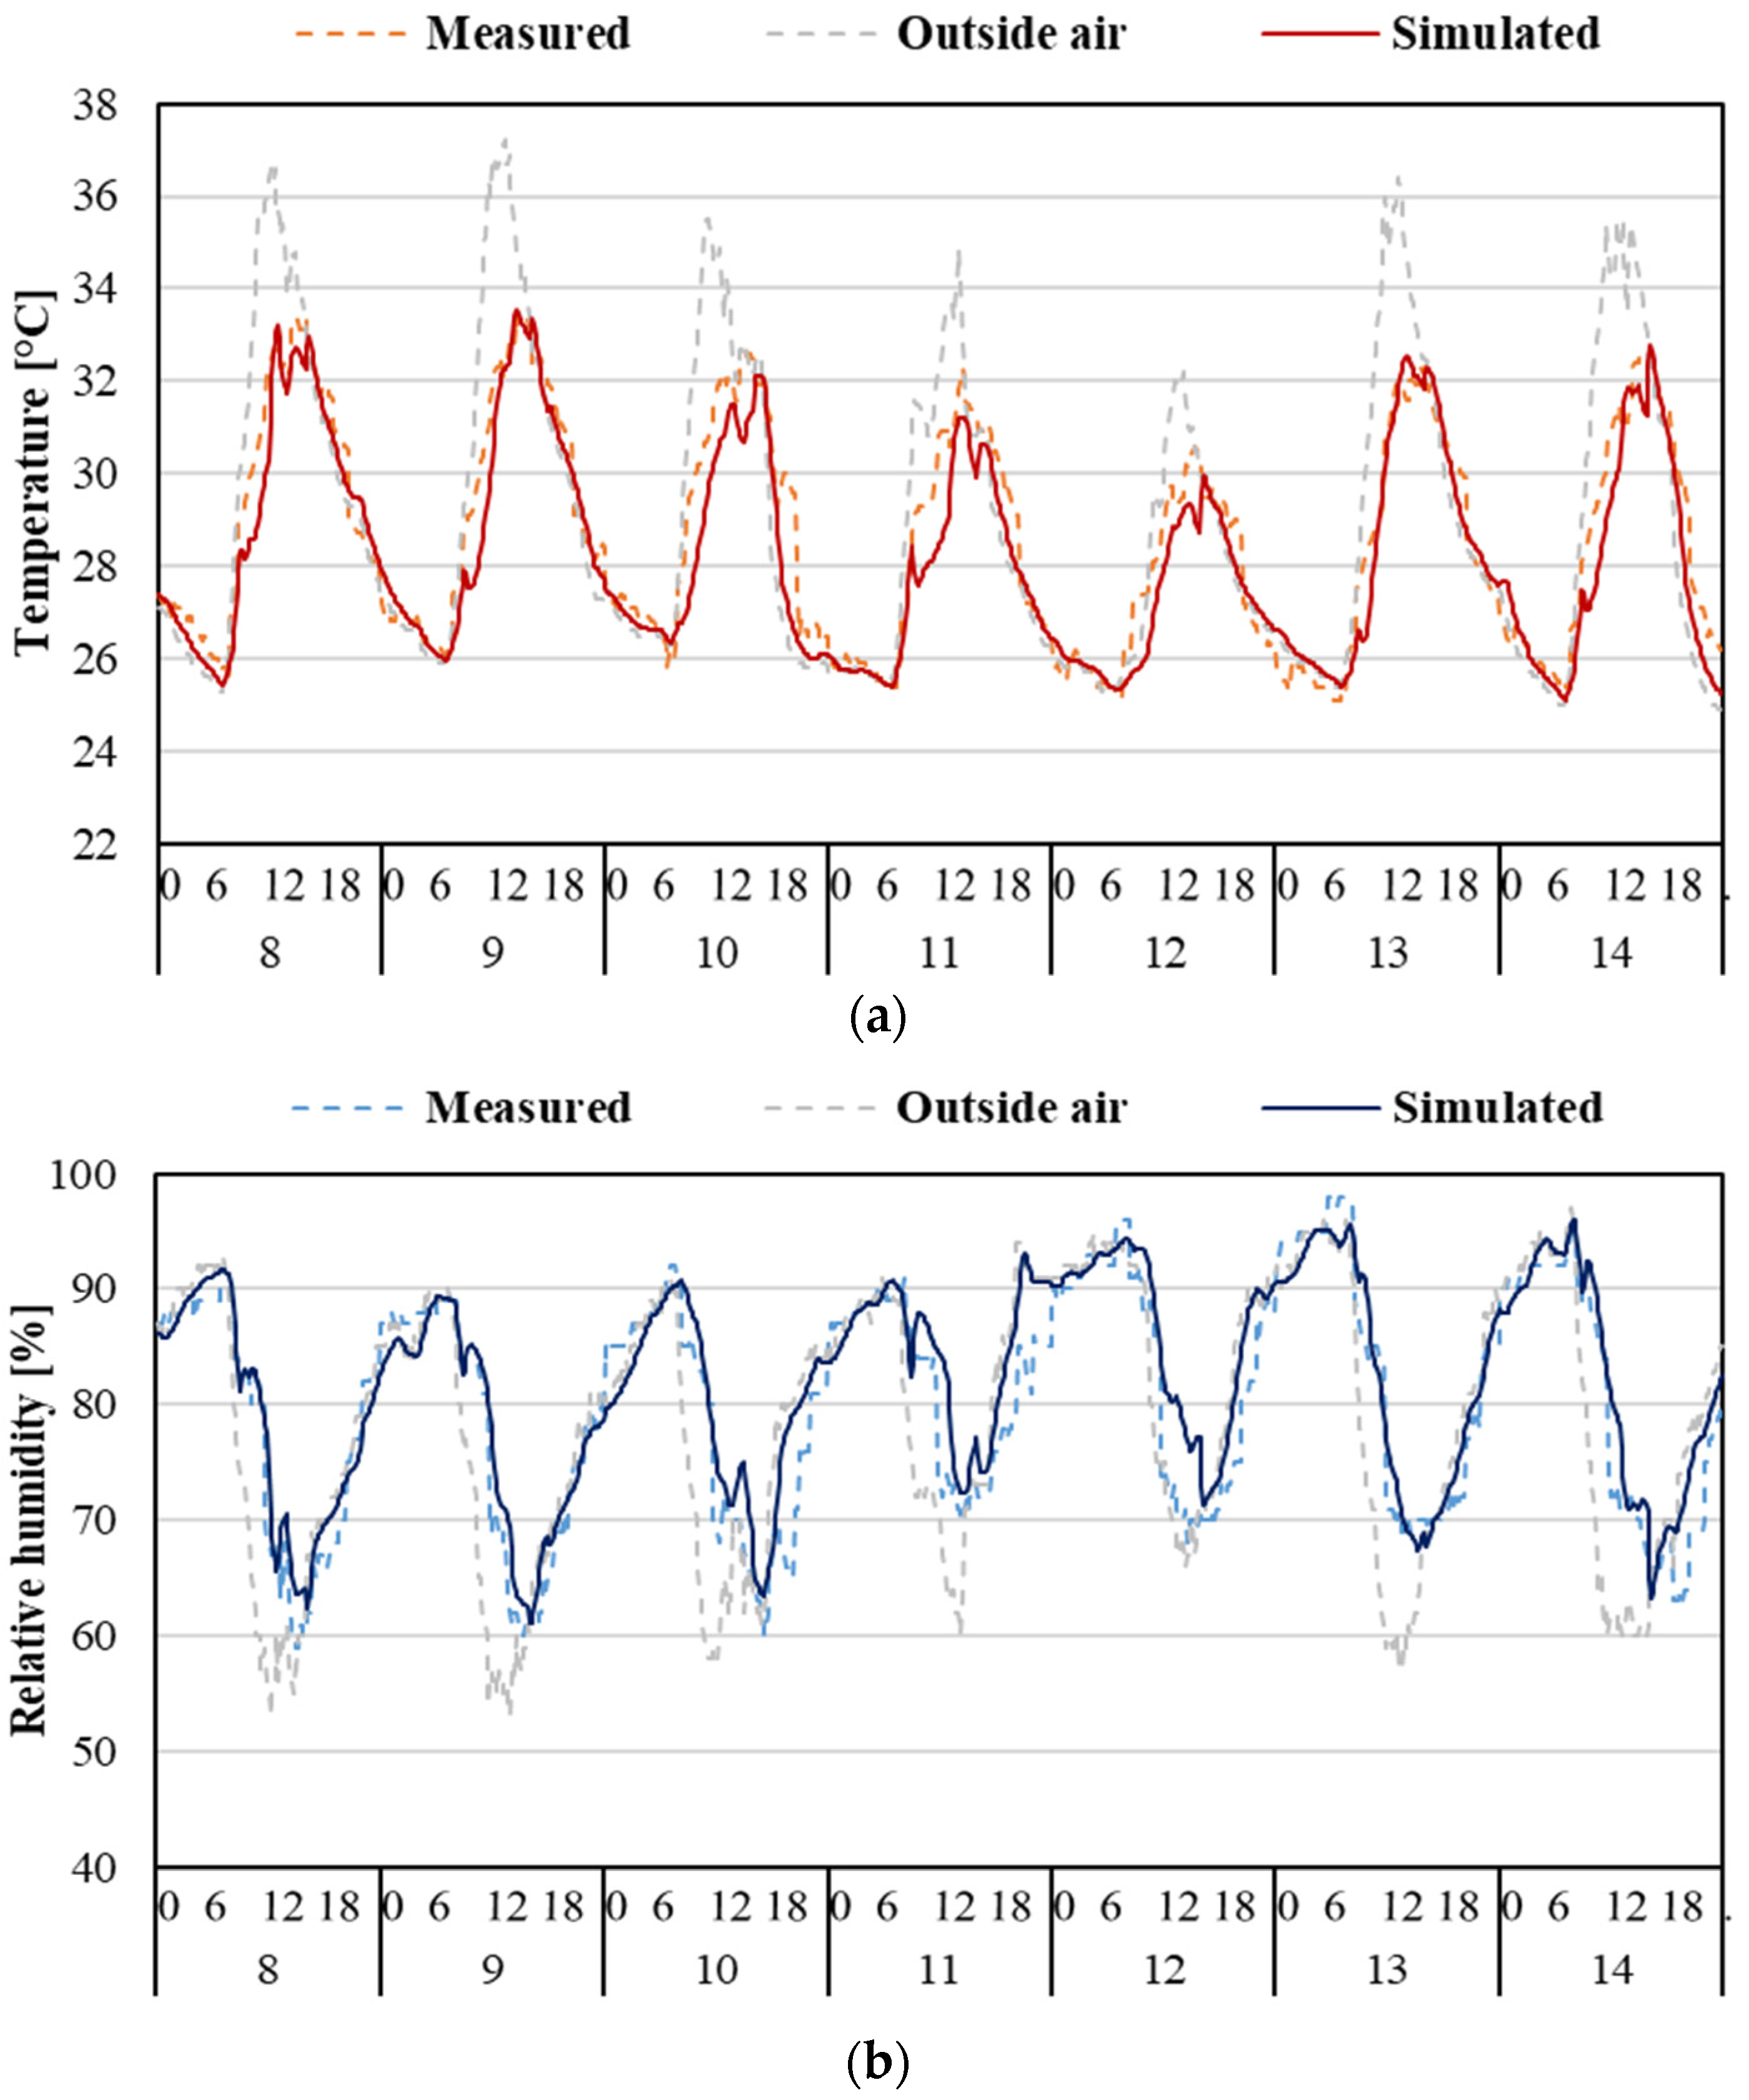
The temperature and relative humidity of the test houses located in Lhokseumawe, Indonesia, were measured during the peak of the dry season for 26 days, from 20 June to 15 July 2022. Outdoor measurement data and Indonesia meteorological standard data were used for the simulation. The accuracy of the simulation was verified by comparing the simulated and measured results. Figure 6 compares the simulated and measured results of the temperature and humidity of the living rooms. Two error indicators, mean bias error (MBE) and the coefficient of variation of the root mean square error (CV(RMSE)), were calculated for the base case according to reasonable standards and guidelines, including ASHRAE [30], the measurement and verification of federal energy projects [31], and the international performance measurement and verification protocol [32].
The MBE and CV(RMSE) [33,34] were calculated using Equations (8) and (9). The calibration criteria of the reasonable standards and guidelines and the two calculated error indicators for the base-case calibration are listed in Table 8.
The measured values were expressed at 10 min intervals using dotted lines. The results show that the predicted MBEs and cross-validation root mean square errors (CV(RMSE)s) were within the acceptable range, as defined by the validation criteria set by ASHRAE guidelines and IPMVP, with no more than a 5% deviation, respectively. These findings suggest that THERB for HAM with NAF can accurately predict indoor air temperatures in naturally ventilated houses.
M B E = i = 1 N M i S i N
C V R M S E = i = 1 N M i S i 2 / N i = 1 N M i N
where Mi and Si are the measured and simulated data at an instant i, respectively, and N is the number of calibration values.

4. Simulation Results

4.1. Louver Improvement

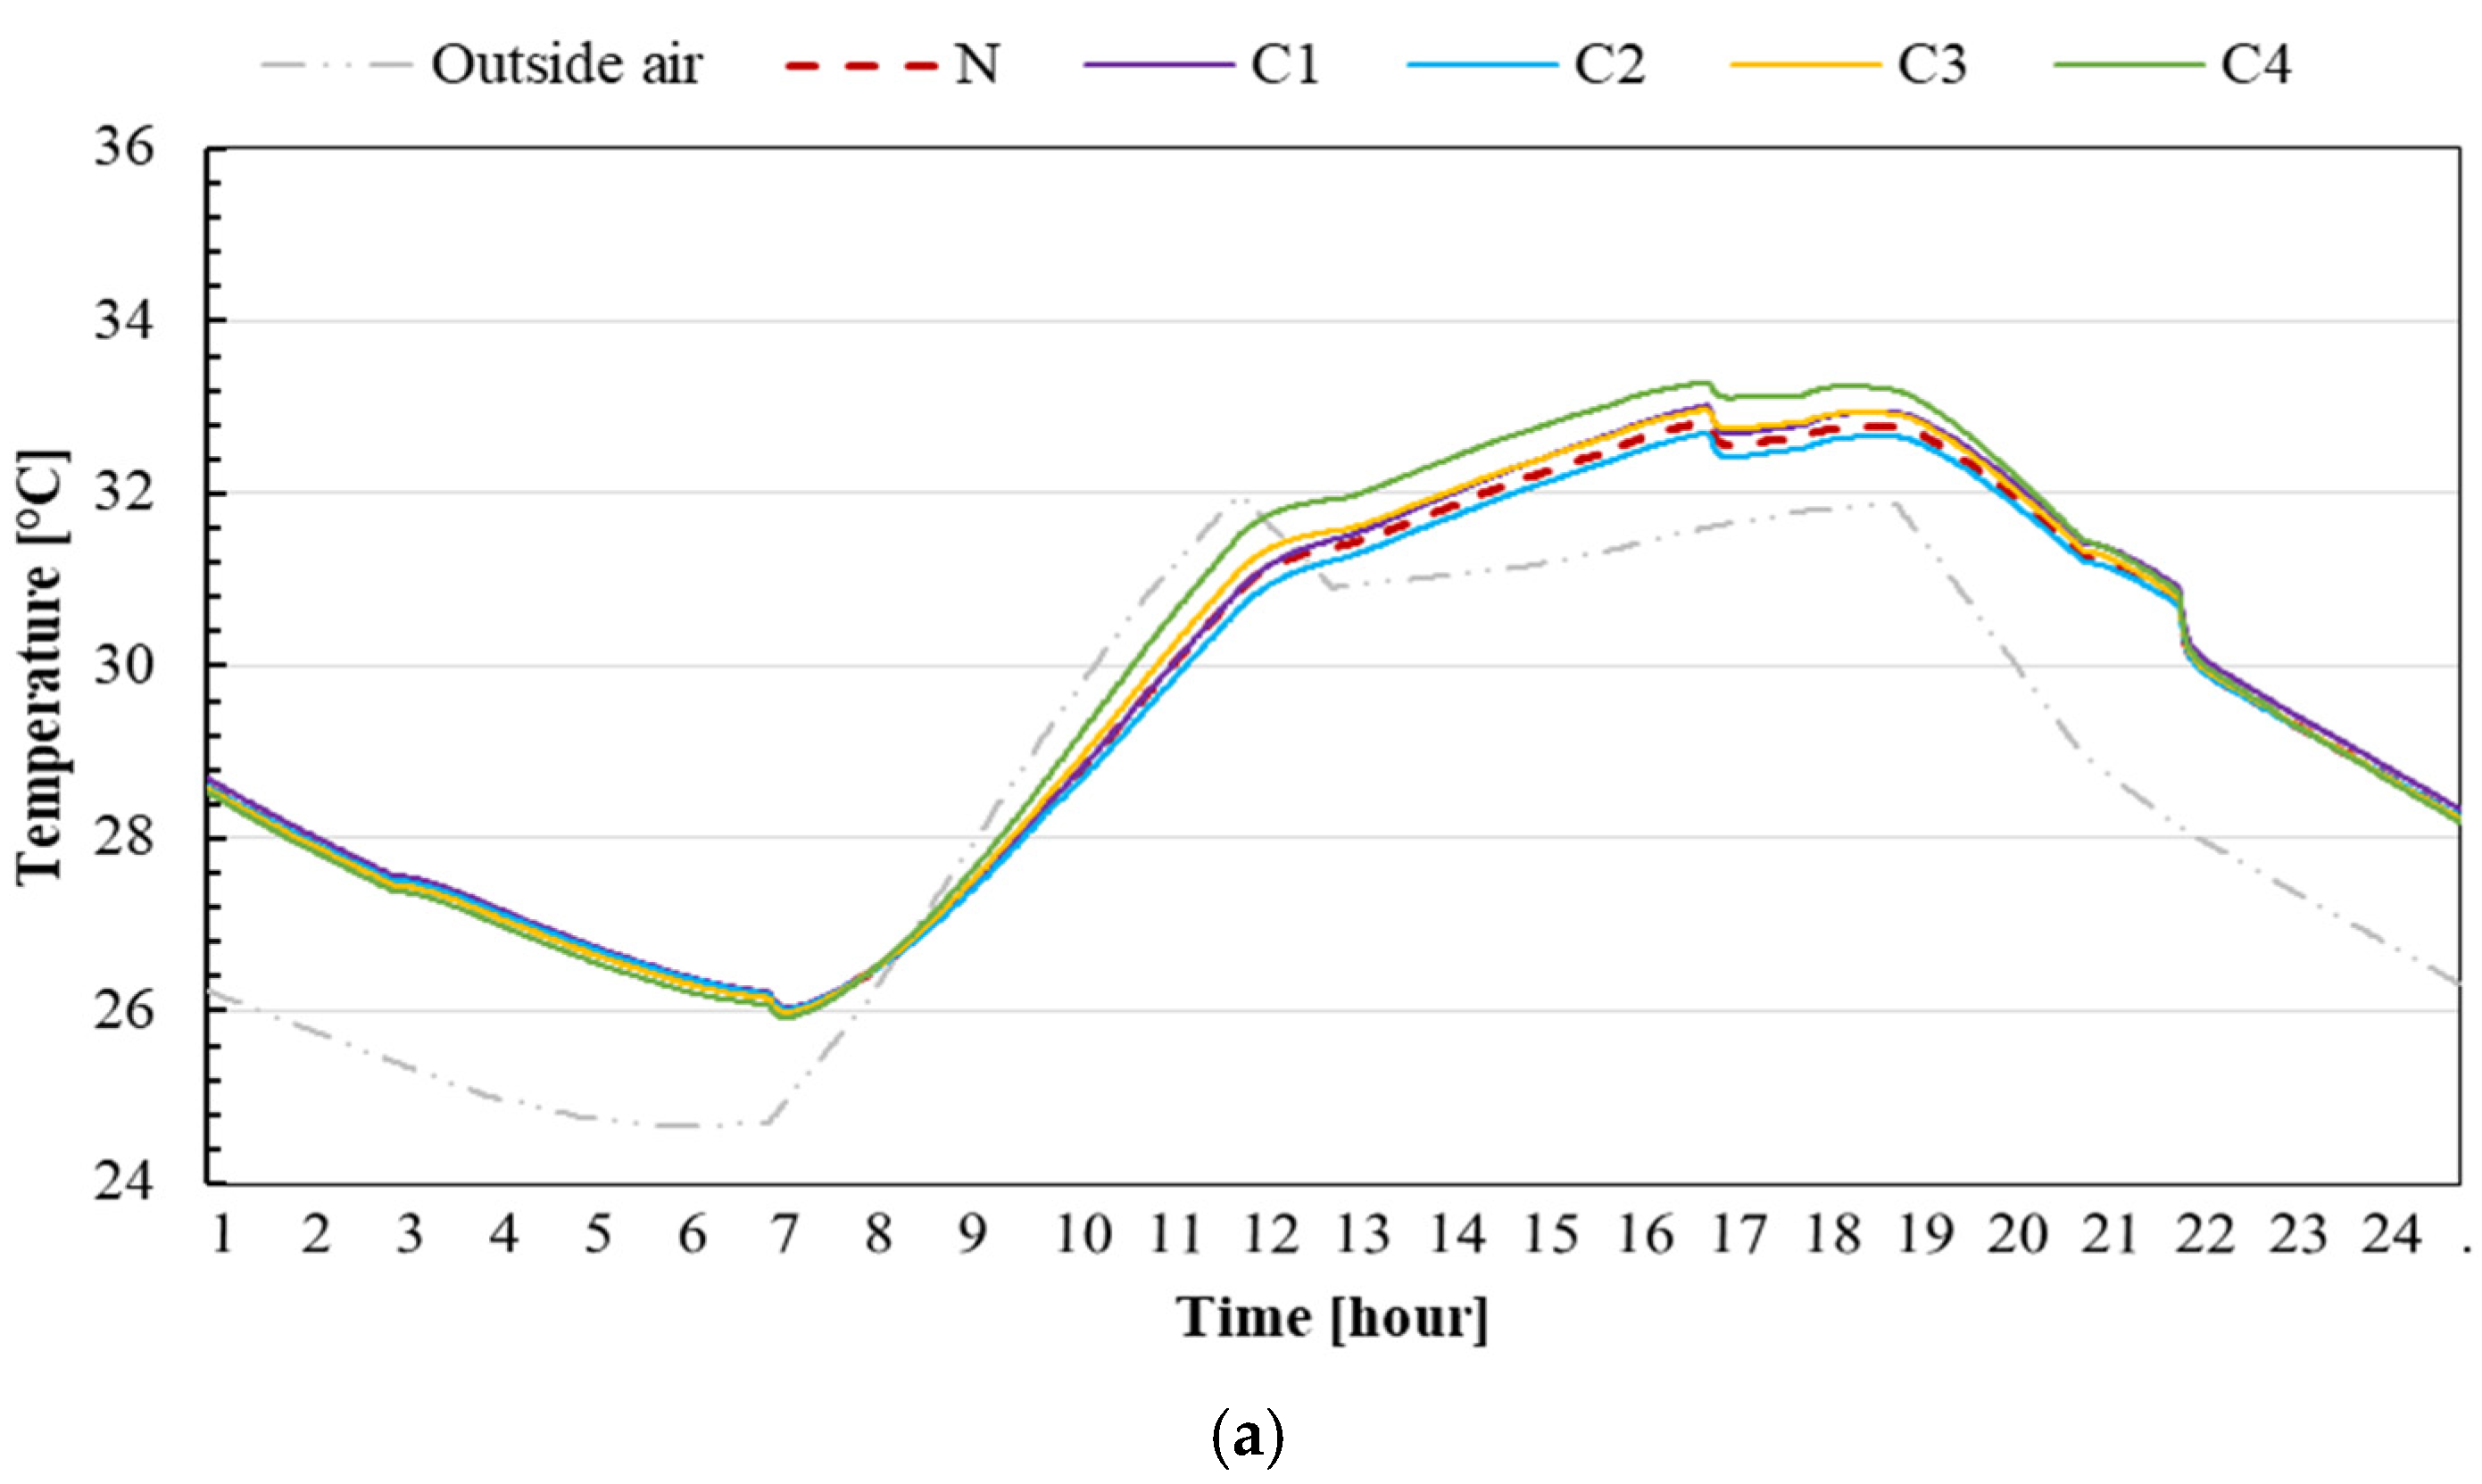
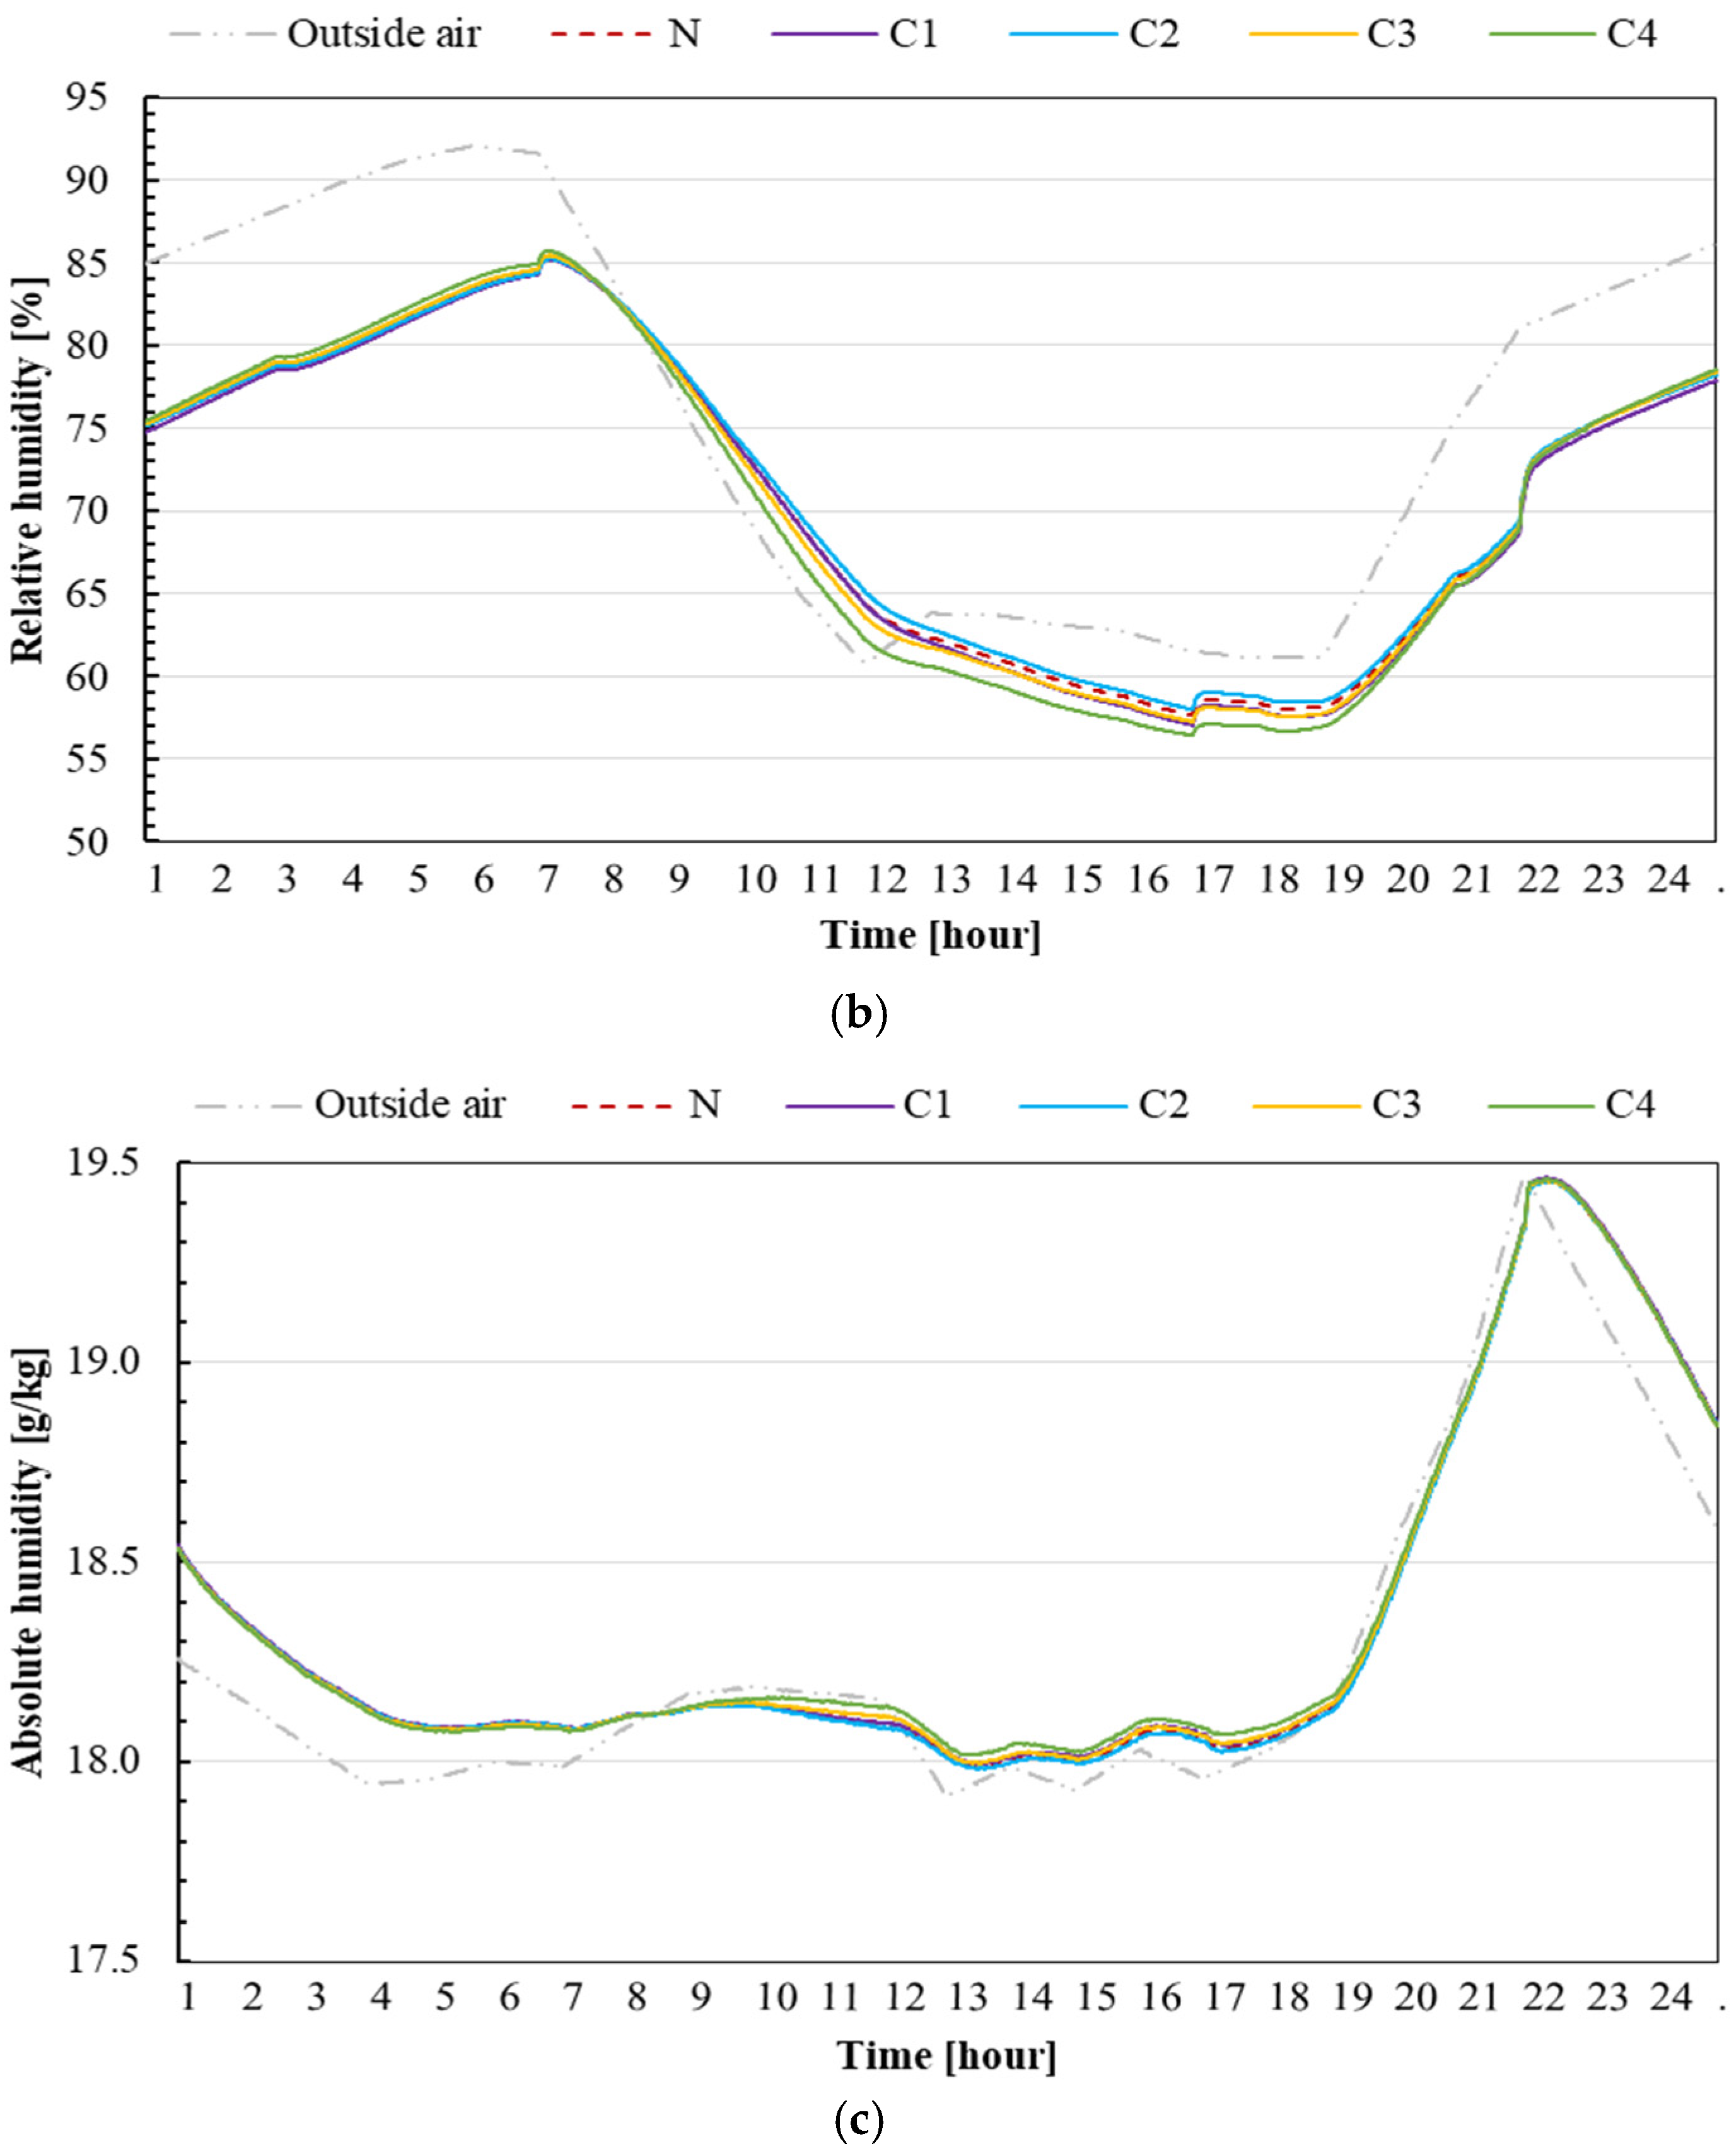
Various louver openings in the living room with an area ranging from 0.08 to 0.76 m2 were evaluated, as shown in Figure 7. The tendency of the hourly air temperature slightly decreased with large louver areas at night from 10:00 p.m. to 08:00 a.m., by approximately 0.3 °C. However, the situation was considerably reversed during the daytime, when the temperature increased by 1 °C for large louvers. Meanwhile, the hourly indoor relative humidity increased at night by approximately 86% at peak conditions and dropped significantly by 56% during the day for the largest louver. However, the situation reversed for the lowest louver area. In addition, the absolute humidity slightly fluctuated for all louvers tested, where the highest absolute humidity occurred at 10.00 p.m. by approximately 19.4 g/kg and dropped significantly to 18 g/kg during the daytime.
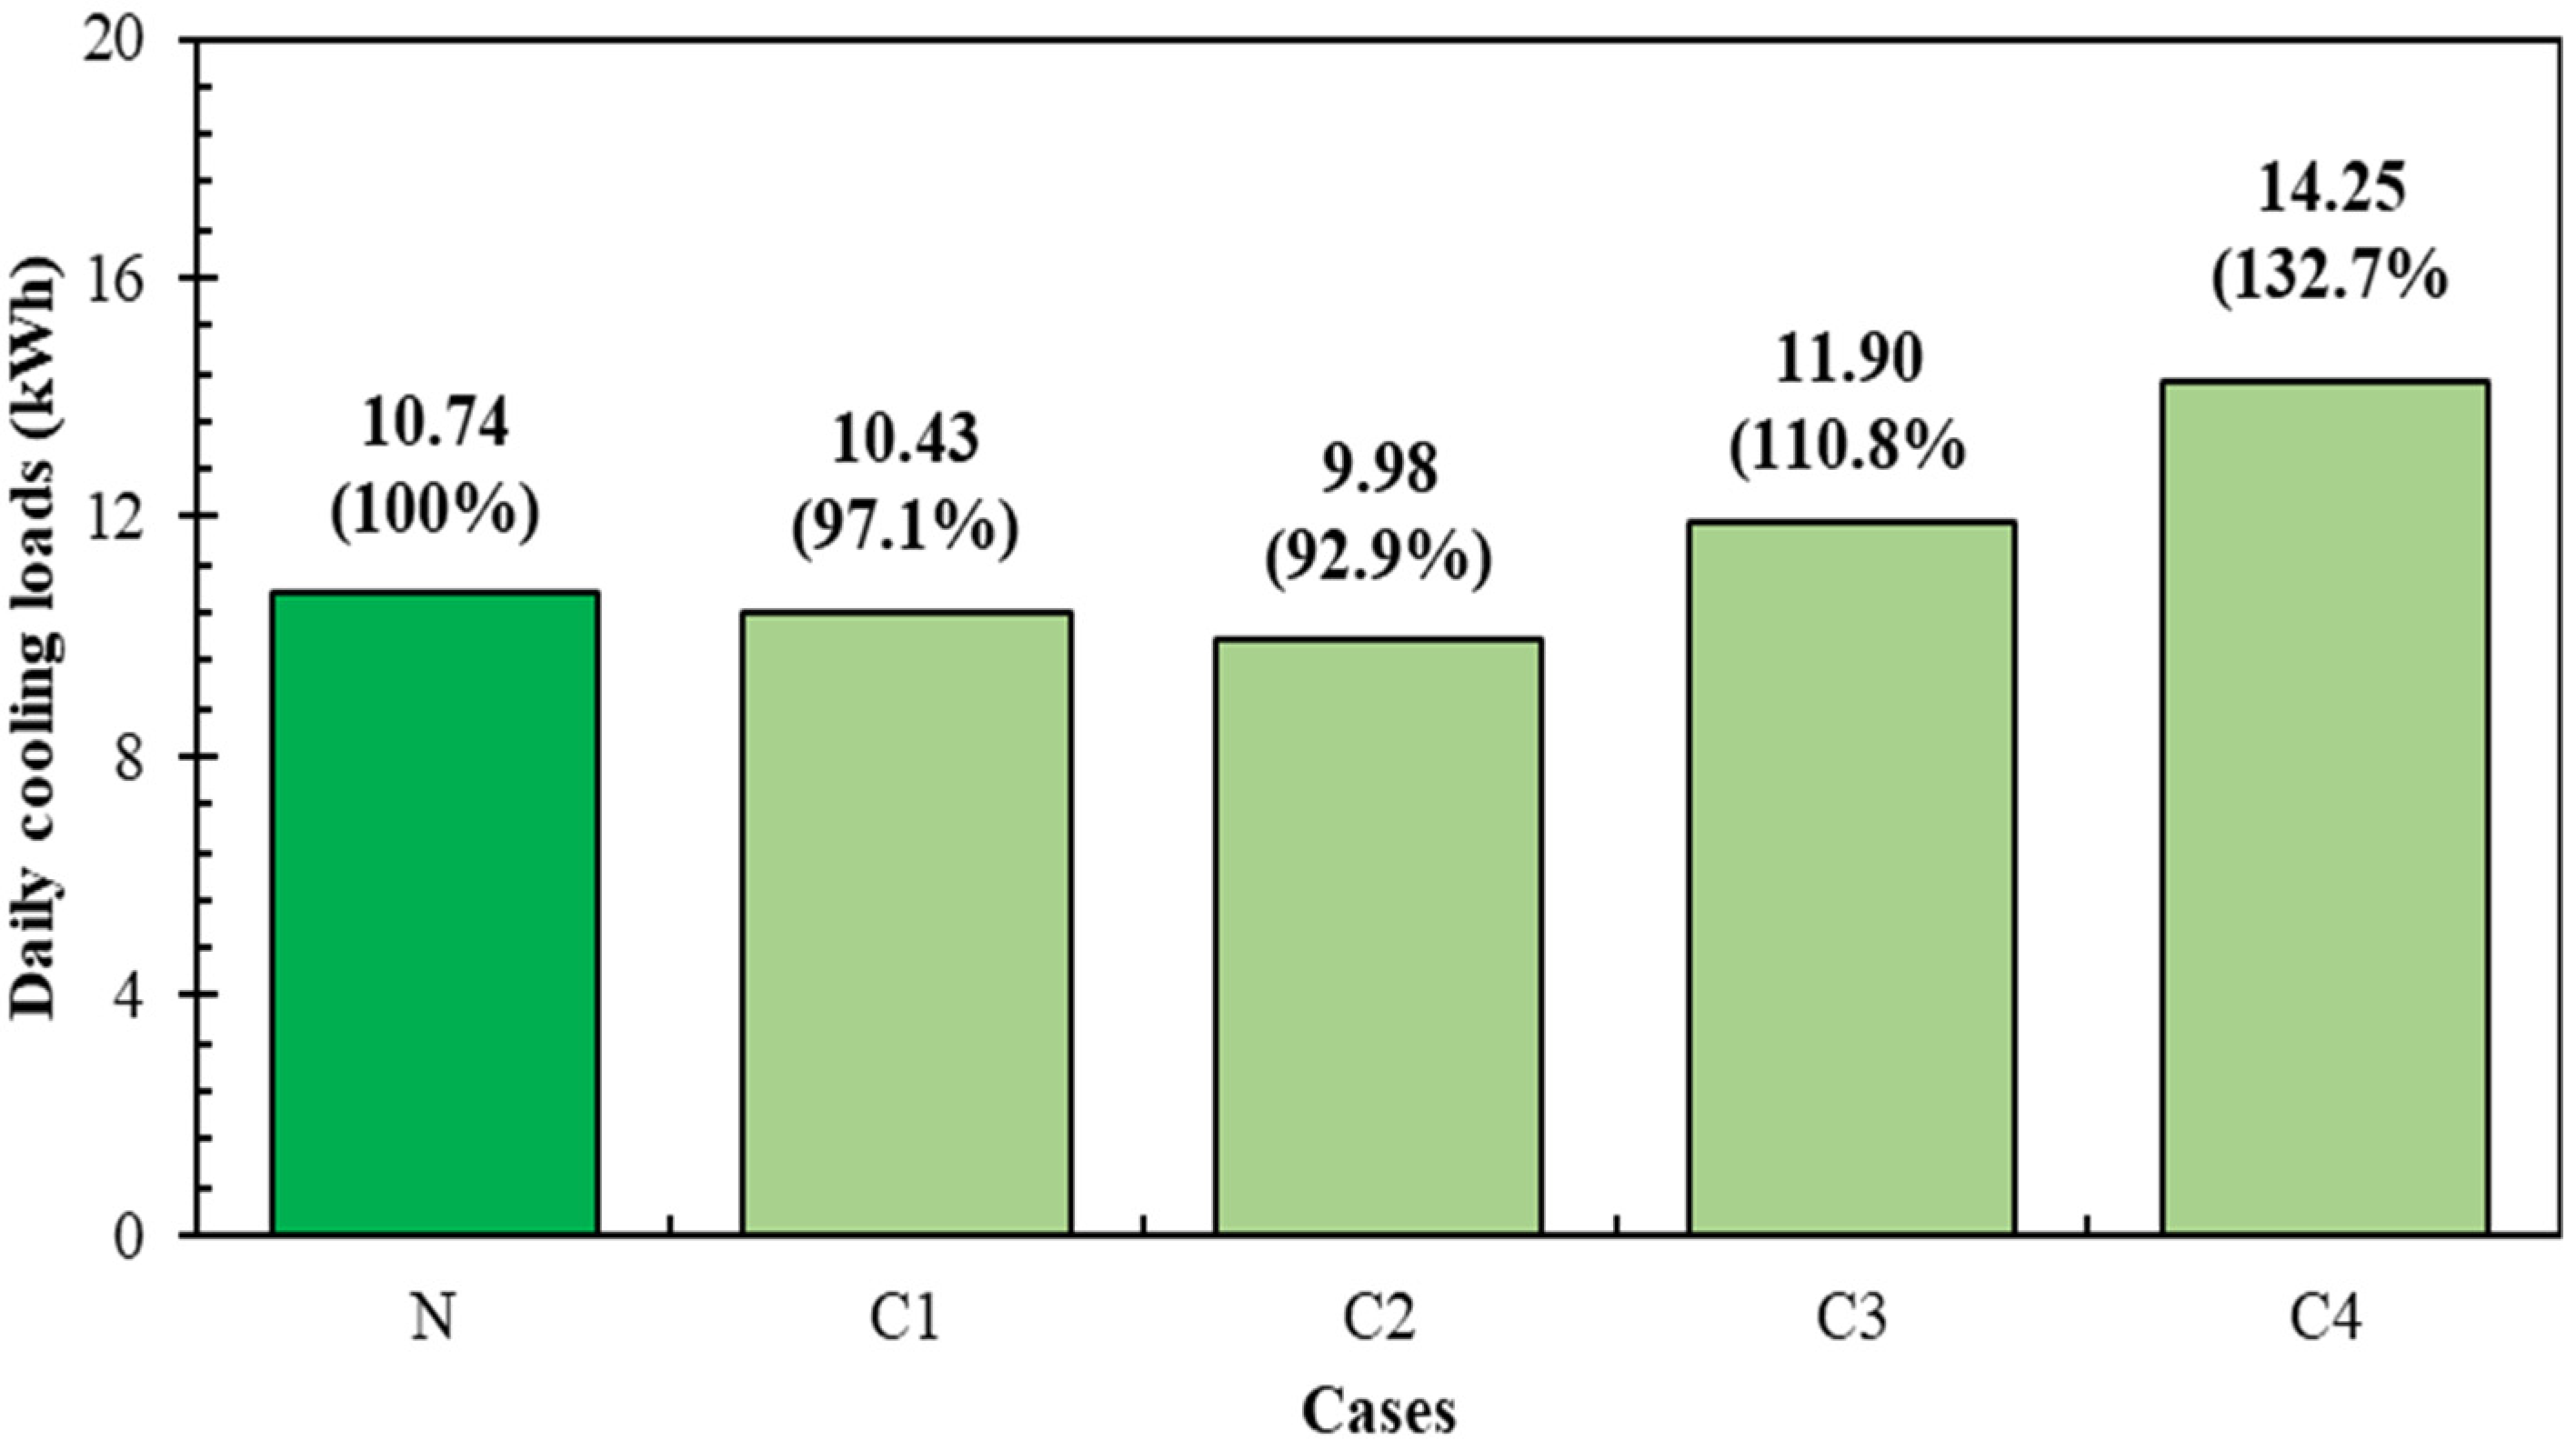
The daily cooling loads of the louver area cases were calculated, as shown in Figure 8. Unlike in the existing case, the lowest cooling load is classified in Case 2 with a value of 9.98 kWh (92.9%). However, when we enlarge the opening areas (C3 and C4), the daily cooling loads increase gradually to 14.25 kWh (132.7%).

4.2. Insulation Improvement

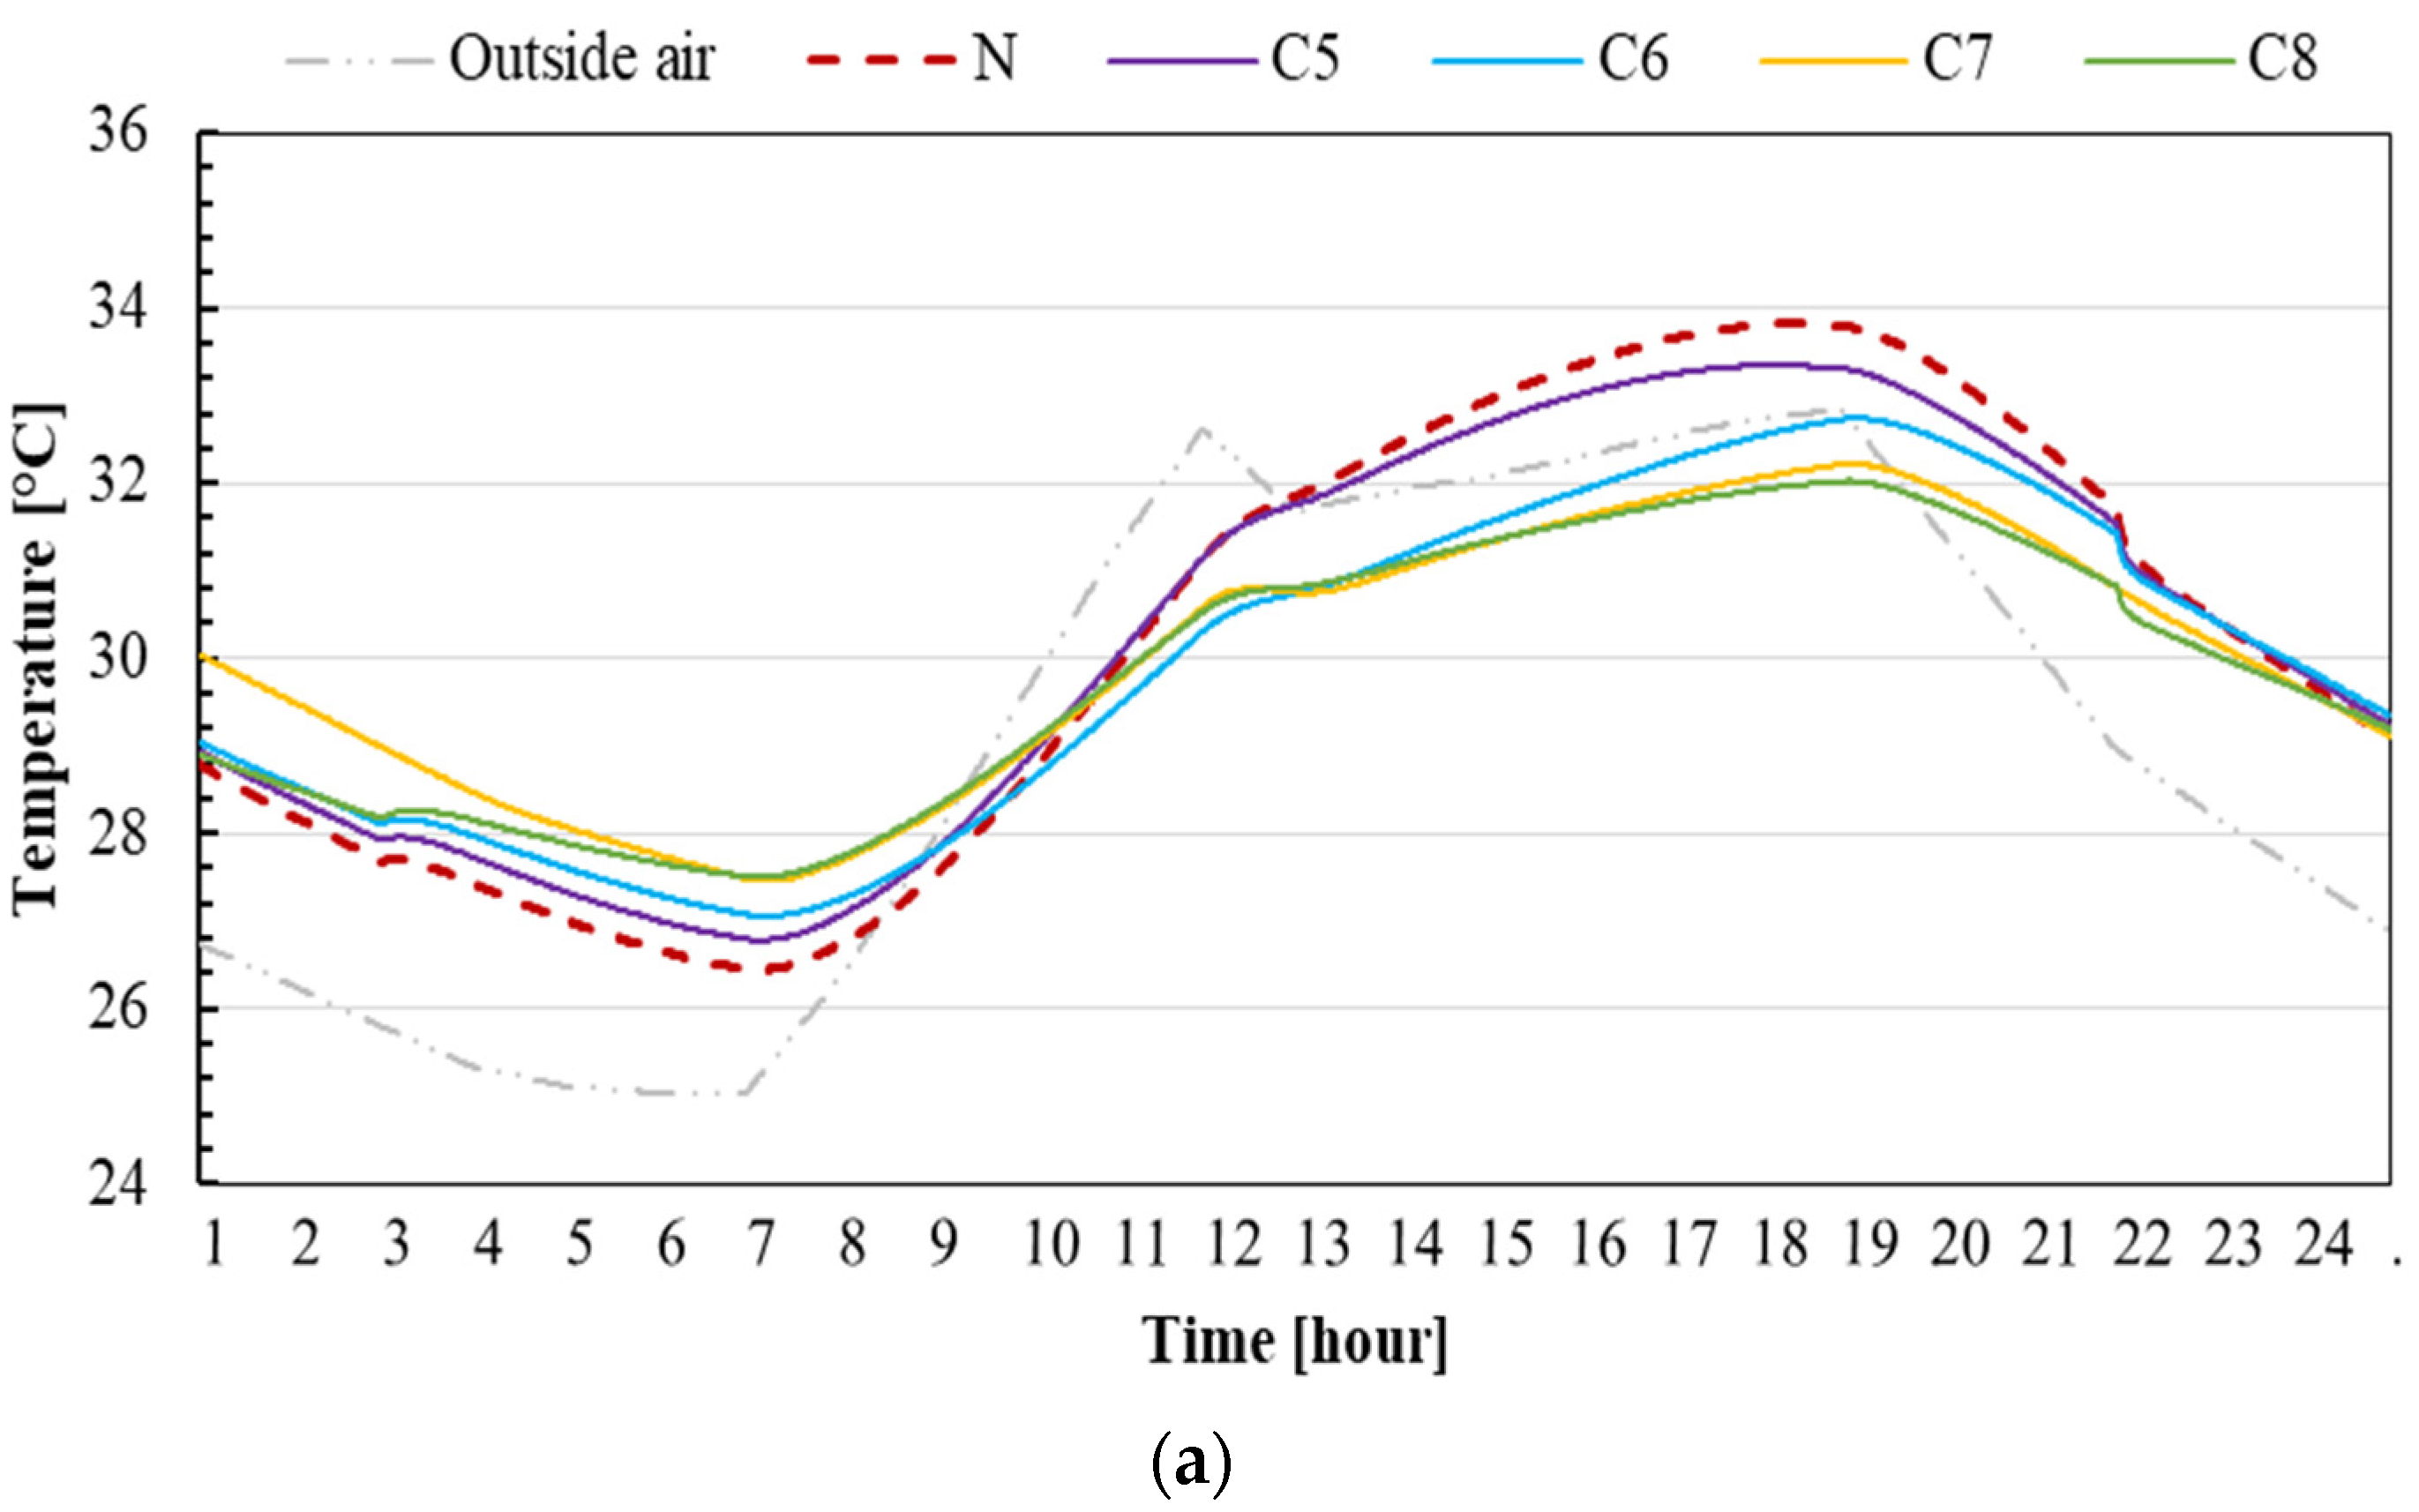
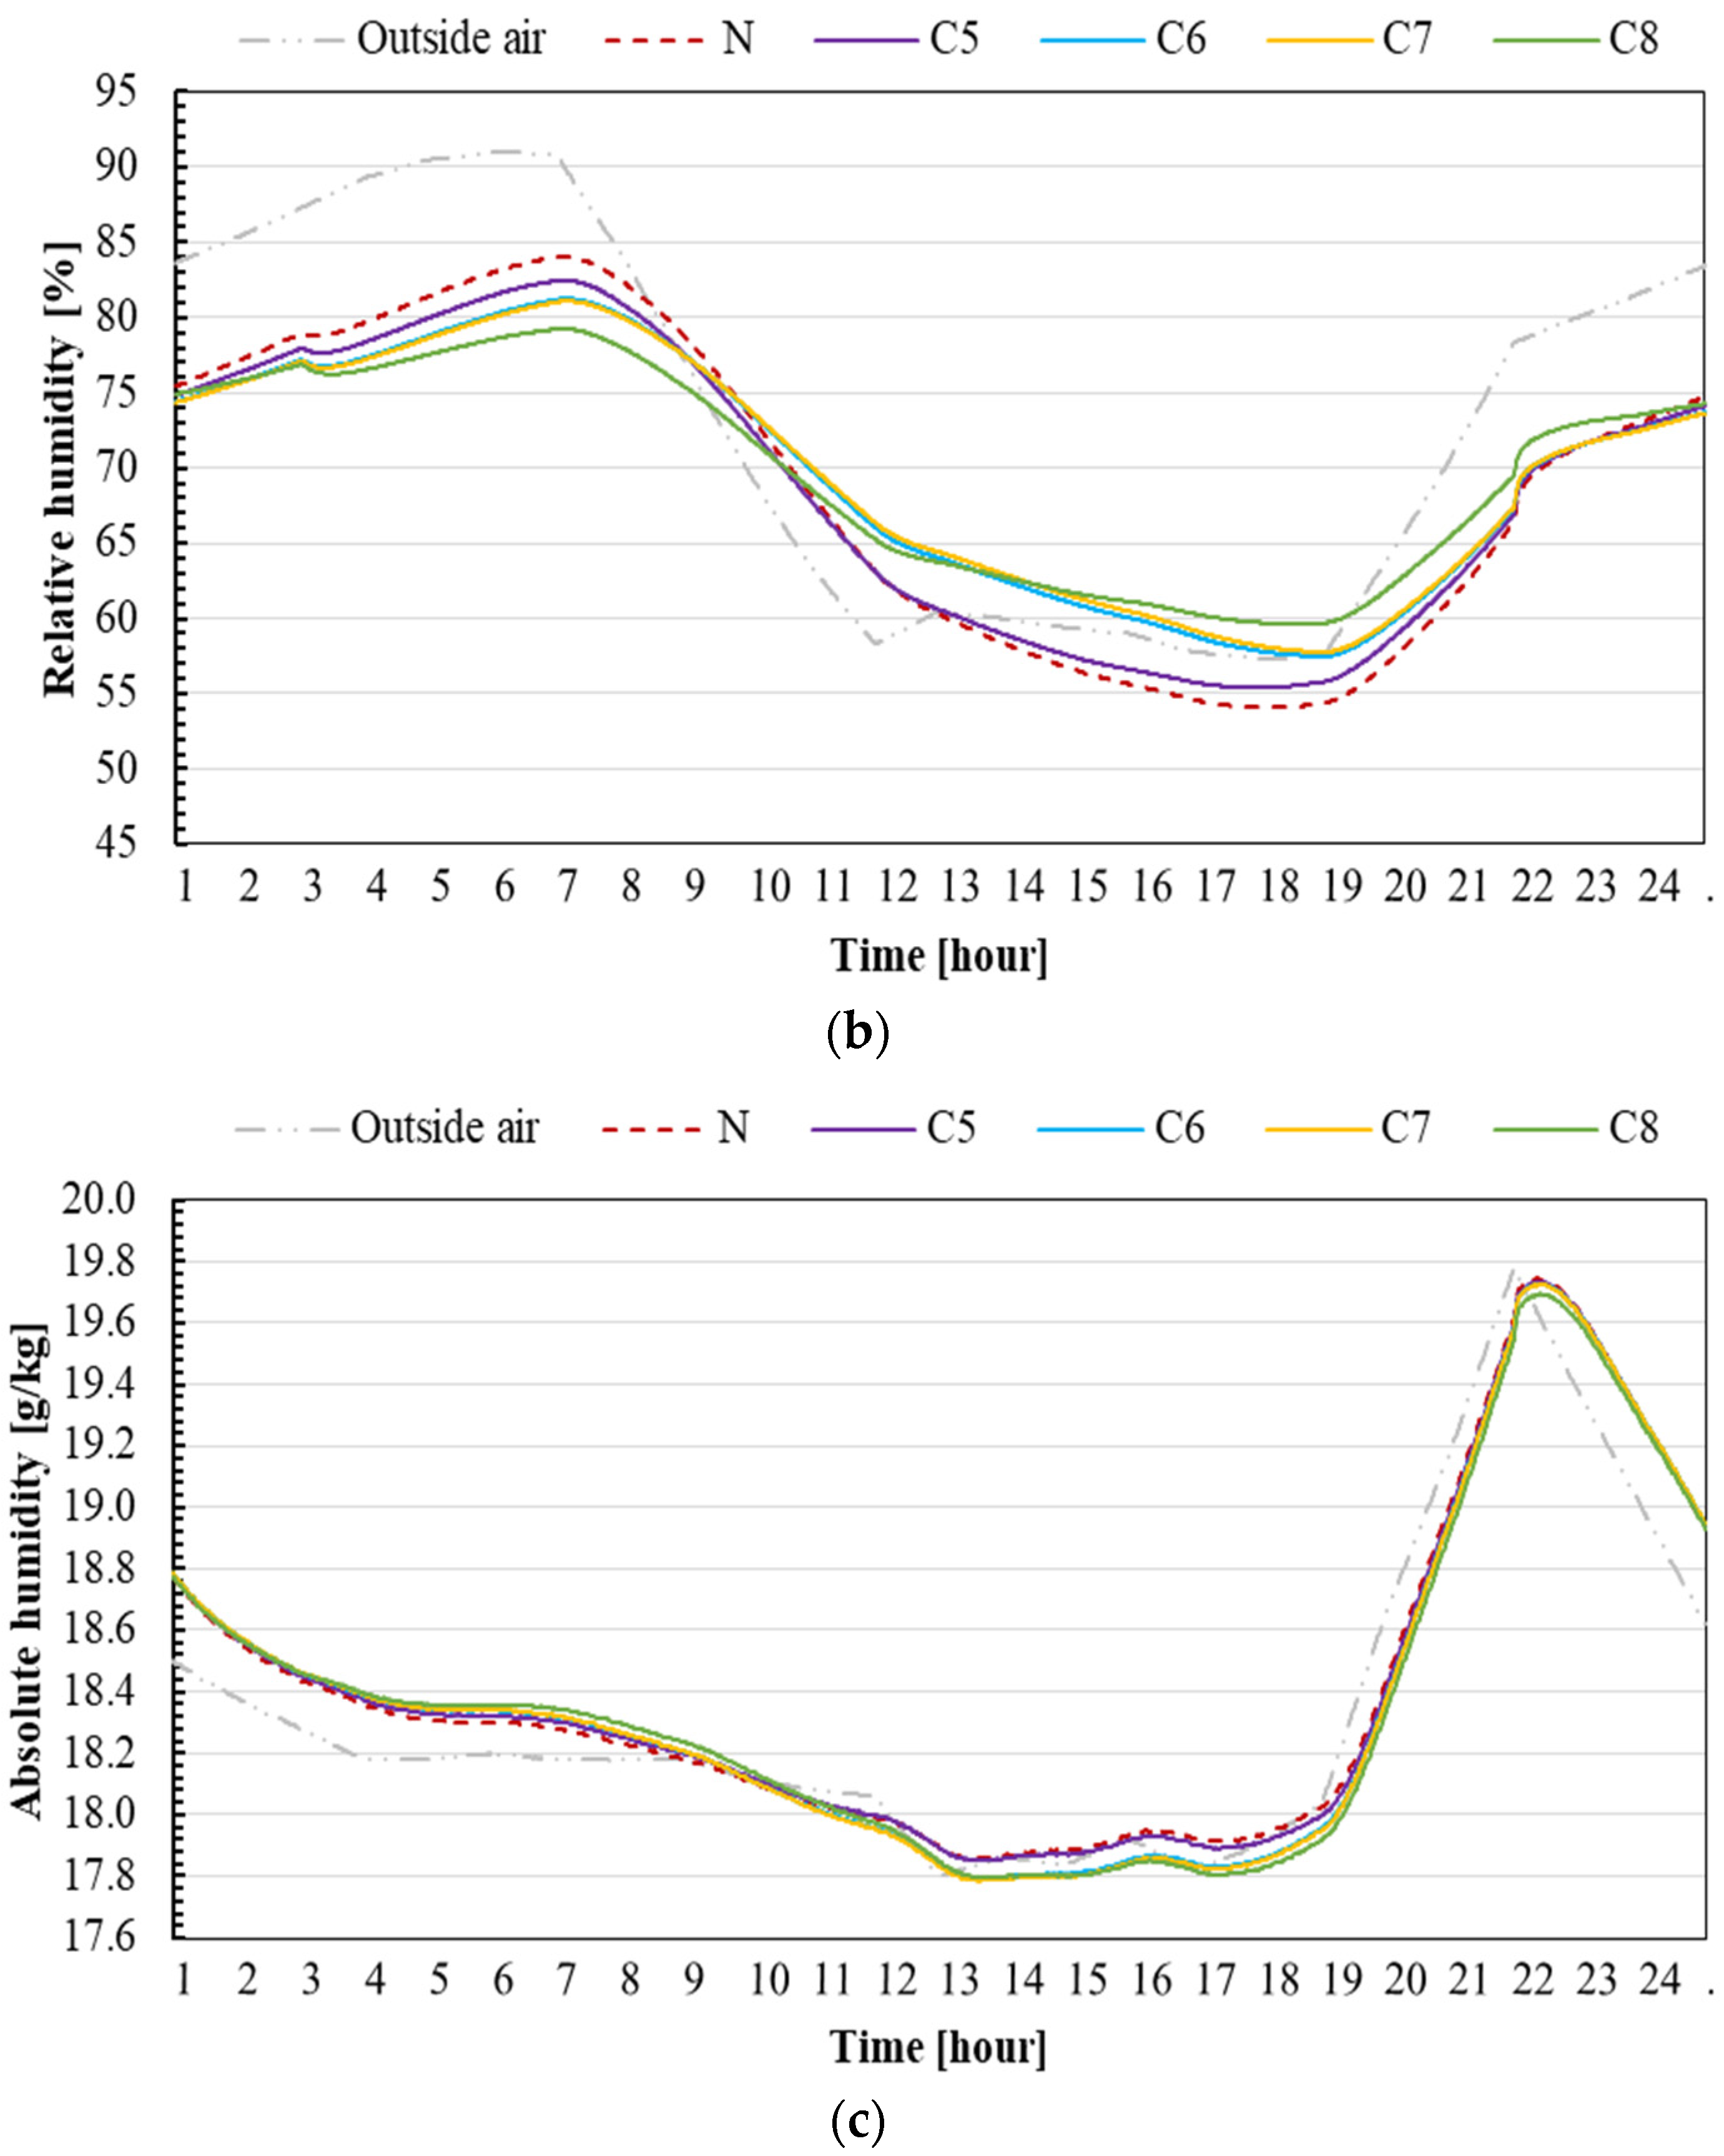
The insulation improvement plan in this study is optional for maintaining indoor environment conditions. The impacts of insulation under external wall insulations, roof insulations, ceiling insulations, and their combinations were investigated. Figure 9 compares the hourly indoor temperature, relative humidity, and absolute humidity between the existing and developed cases. The hourly indoor temperature obtained by adding insulation level 1 reduces the temperature from 0.5 to 0.9 °C at night and during the day at peak conditions. However, combining the insulations of the external wall, roof, and ceiling (level 4) significantly reduces the indoor temperature from 1.0 to 2.1 °C compared with the existing case at peak conditions. However, relative humidity significantly changed by 7% when the temperature increased at night and during the daytime. Moreover, the absolute humidity slightly fluctuated according to the cases developed, where the maximum value was introduced at night at 19.8 g/kg and dropped extremely to 17.8 g/kg during the day. In addition, the daily cooling loads of the target room are gradually reduced by various additional insulation levels, as shown in Figure 10. The daily cooling loads are decreased on insulation level 4 (Case 8) by approximately 16.4% compared with that of the existing case.

4.3. Combined Model

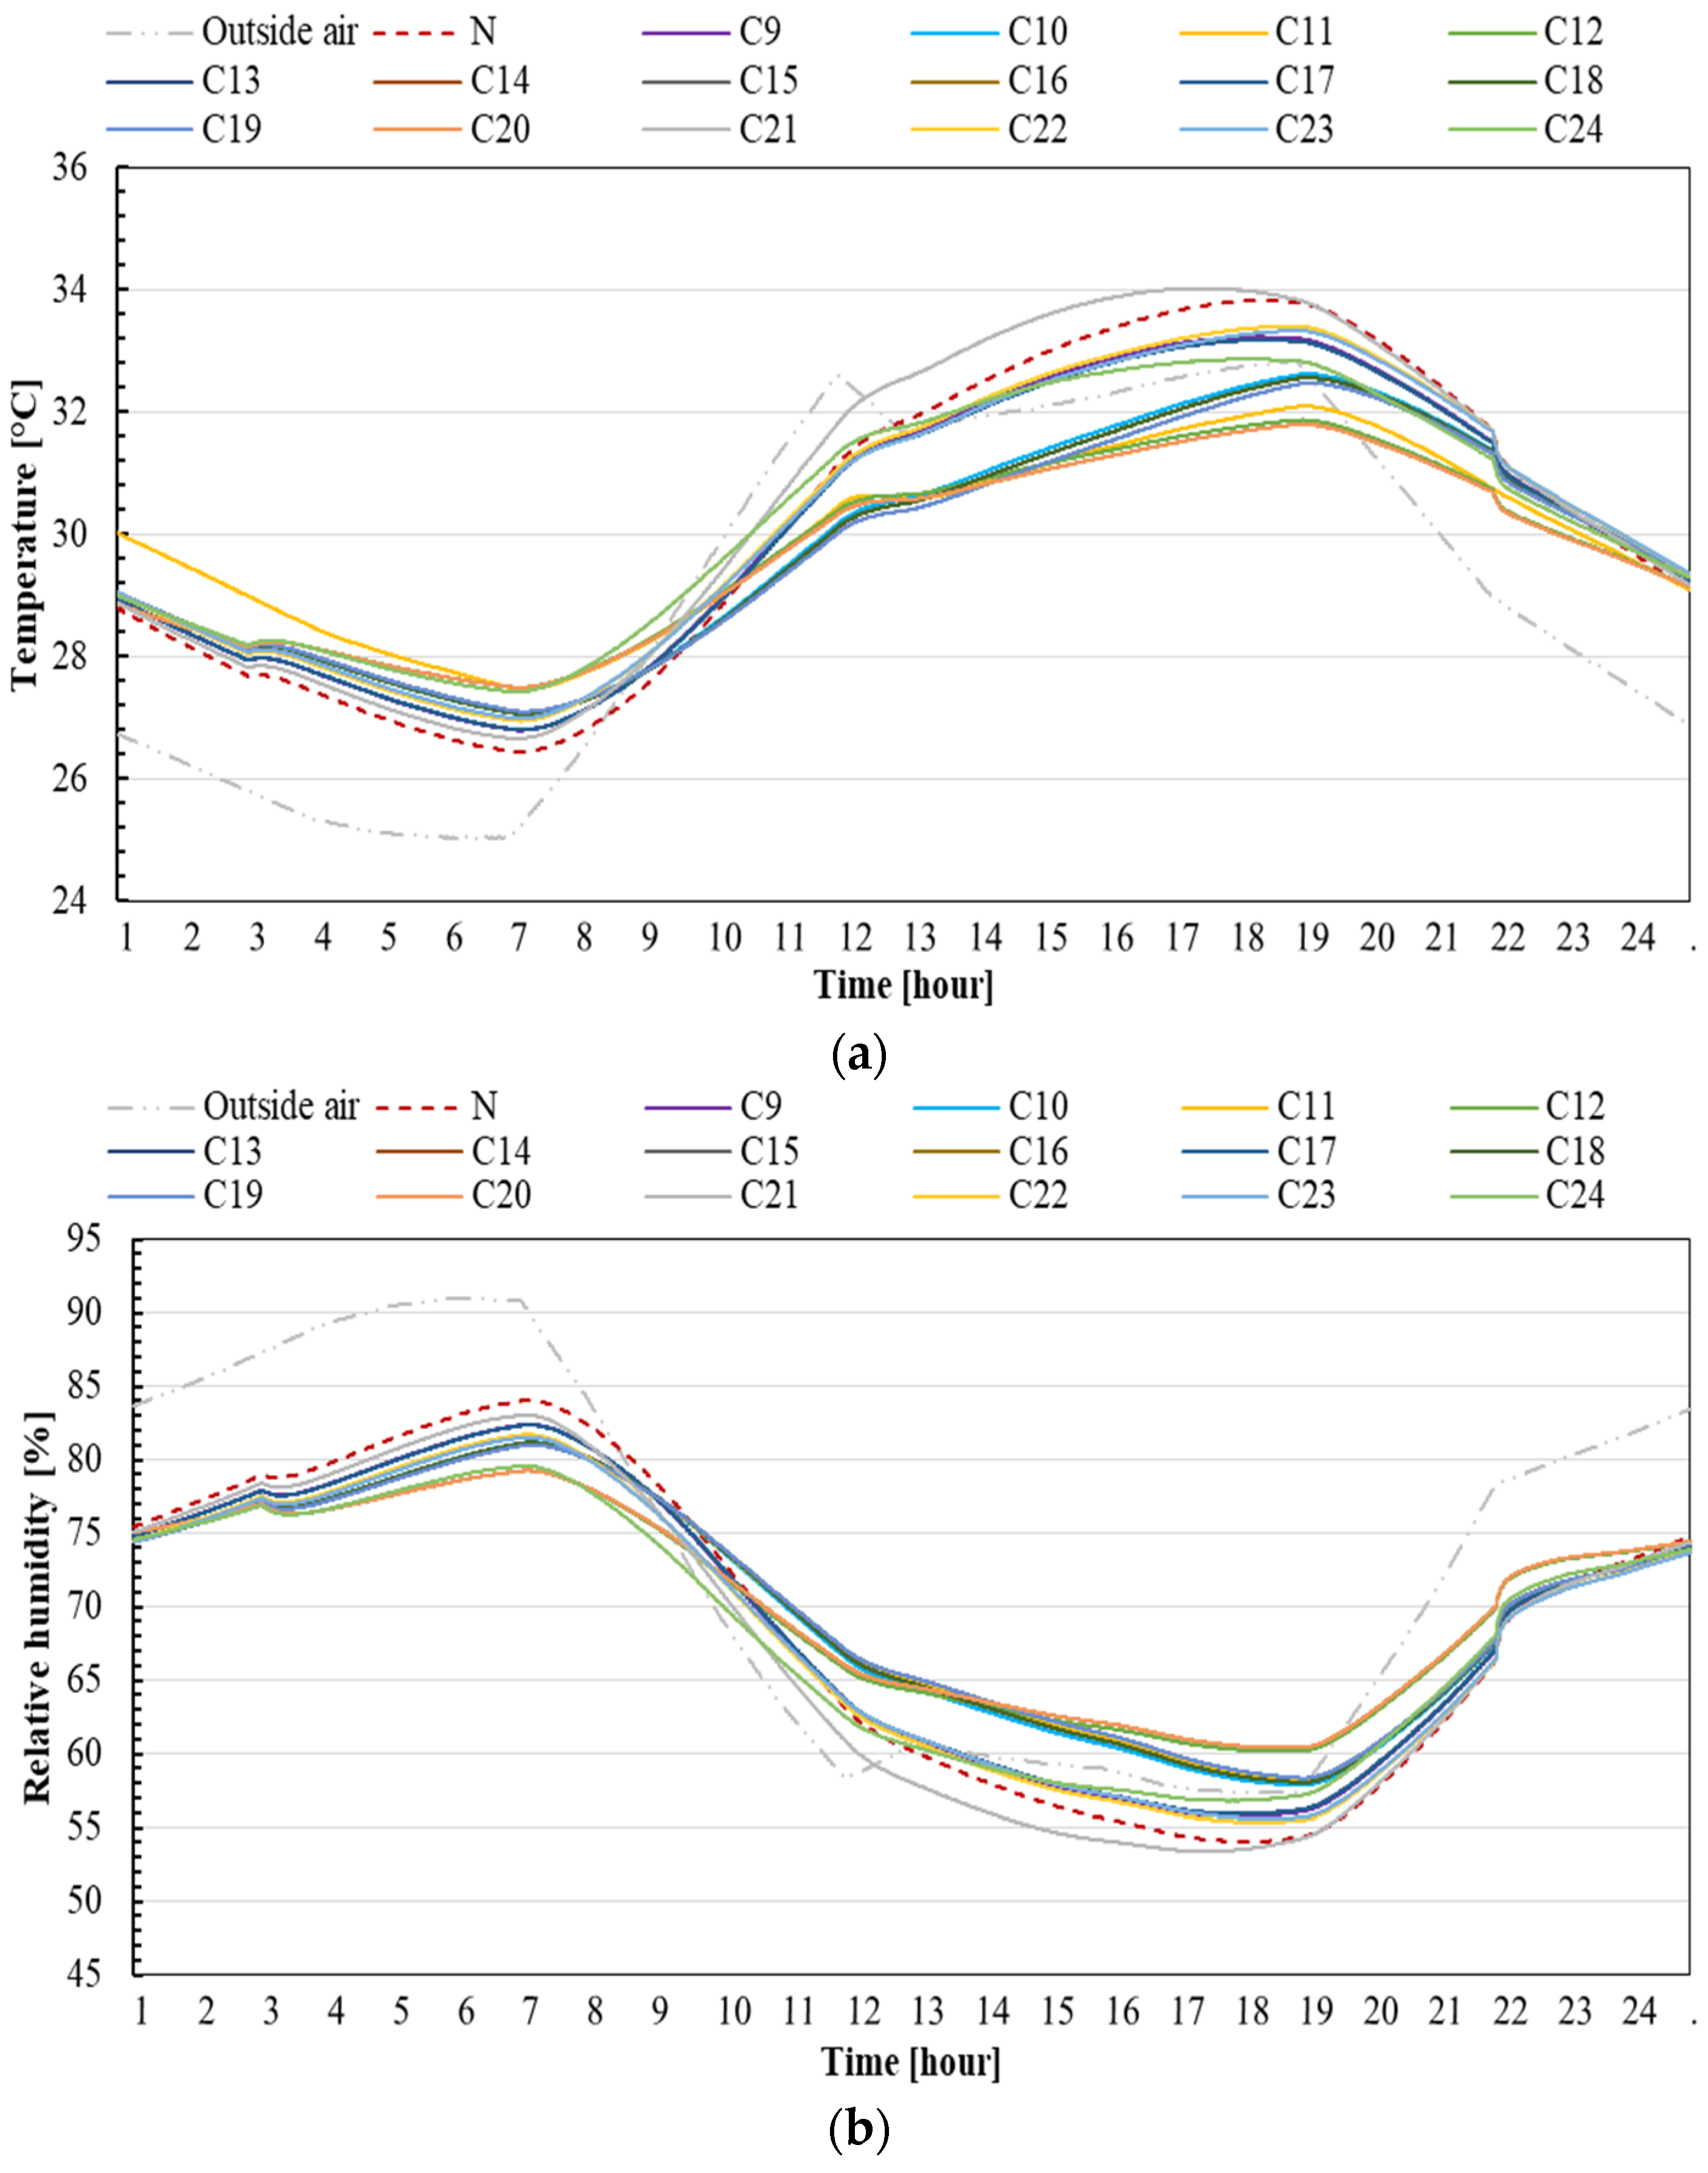
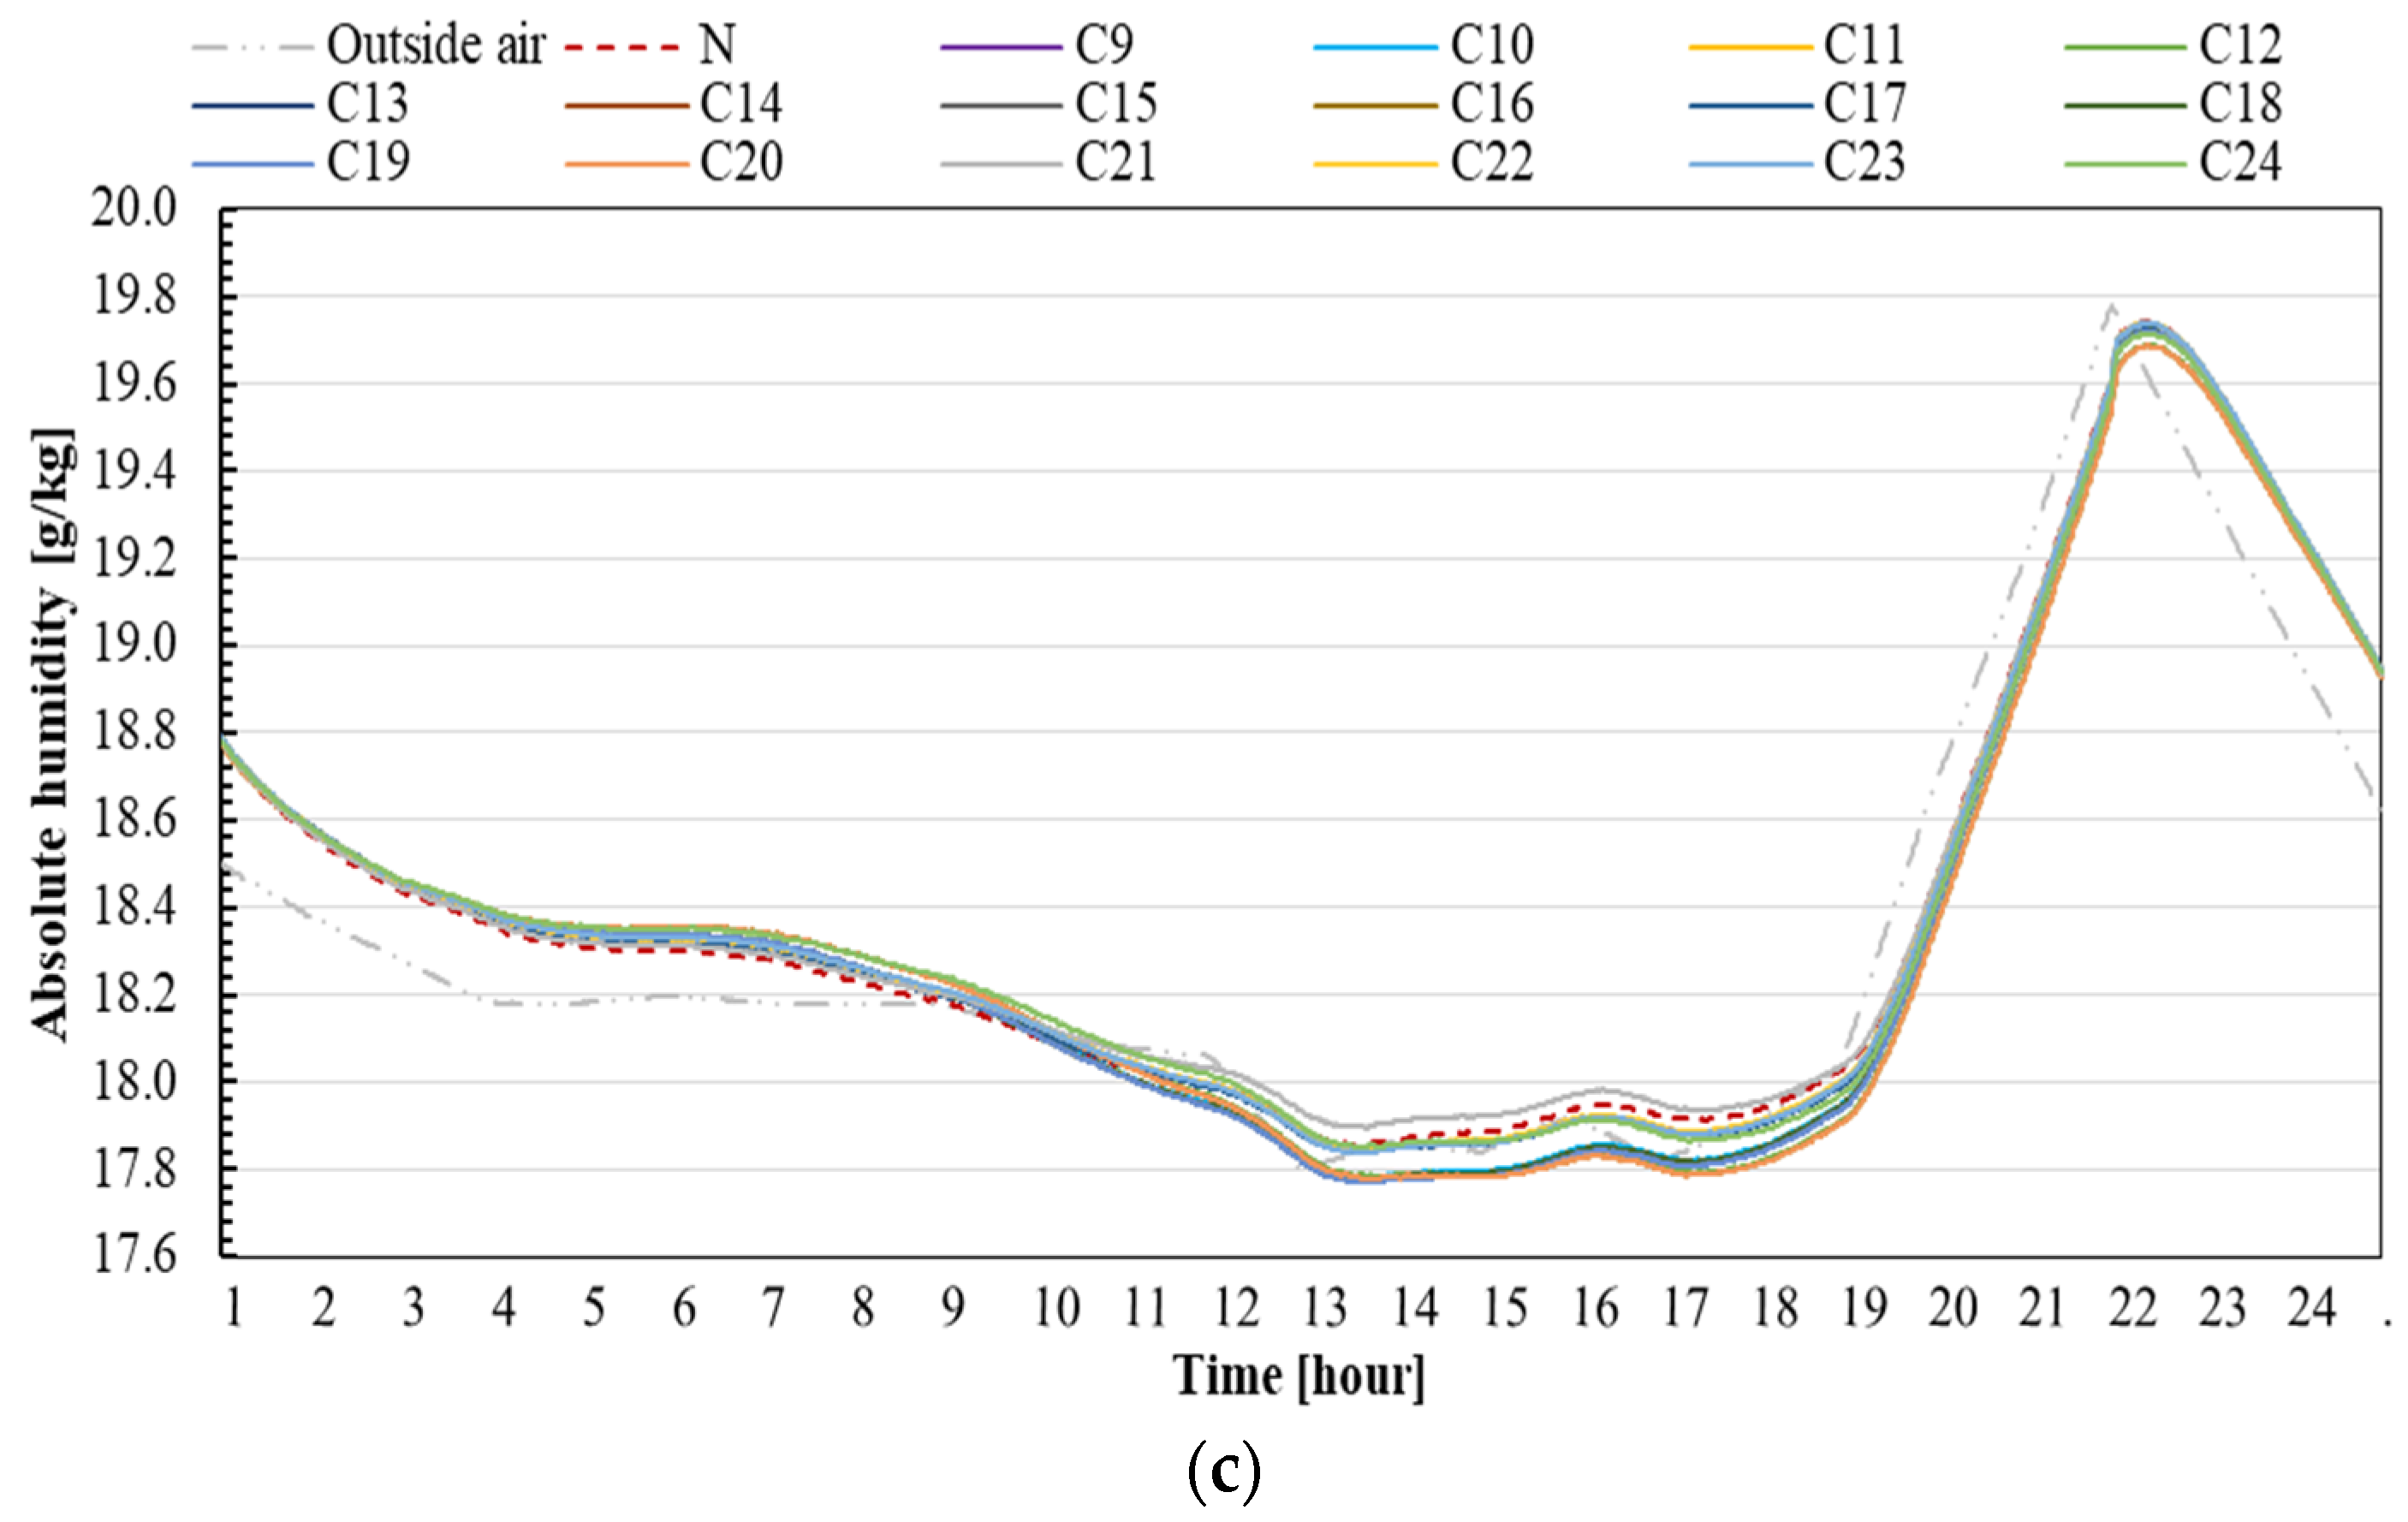
The combined model between the louver opening area and various levels of insulation was analyzed for 16 simulated cases. The impacts of the various cases on the indoor environment were identified, as shown in Figure 11. The hourly indoor temperature is reduced by 1.6 to 2.2 °C compared with existing cases at peak daytime conditions. The relative humidity decreases from 6% to 8% and stabilizes at 60% during the day and 78% at night. The absolute humidity presents a similar condition to the insulation cases developed, where a maximum of 19.7 g/kg occurred at 10.00 pm and dropped extremely to 17.75 g/kg during the day. Therefore, this study confirms that combining the louver opening area and insulation by reducing the louver area of the existing case and adding insulations of level 4 on an external wall, roof, and ceiling can effectively maintain indoor environment conditions compared with the existing case. In addition, the daily cooling loads of the target room for the combined cases show various results for the entire case, as illustrated in Table 9. The results show that optimizing an improvement plan by combining the louver opening area (C2) and adding an insulation level 4 (C8) declines the daily cooling loads by 25.09% compared with the existing case.

4.4. Annual Cooling Loads on the Target Cities

The annual cooling loads for the existing and improved cases of the 14 cities were analyzed, as illustrated in Table 10.
This study reports that the maximum annual cooling loads for existing cases are classified in Semarang at approximately 24.93 GJ/year, followed by Surabaya at 22.93 GJ/year and Bima at 22.58 GJ/year. The other cities are evaluated as averaging 14.42 GJ/year, with a minimum occurring in Wamena.
By modifying the louver opening area, the annual cooling loads decreased approximately by 14.26% in Bima, followed by Madura at 13.66%, Kerinci at 12.90%, Semarang at 10.69%, and Gorontalo at 9.96%. The average decrease in annual cooling loads for all cities simulated is 1.37 GJ/year (9%) compared with the existing case.
Meanwhile, adding the insulation level into the test house to control annual cooling loads is better than modifying louver openings by approximately 1.80 GJ/year (12%) for all of the cities. The annual cooling loads of Kerinci is decreased by 31.03%, followed by Gorontalo at 16.84%, Banda Aceh at 16.80%, and Lhokseumawe at 16.33% compared to each existing case.
Moreover, combination case 16 (C16) shows the best optimization of energy consumption reduction for all the simulated cases. The maximum annual cooling loads are decreased by approximately 6.55 GJ/year (29%) in Bima, followed by Madura at 5.39 GJ/year (23.93%), Semarang at 5.08 GJ/year (20.37%), and Gorontalo at 4.19 GJ/year (27.97%) compared with the existing case. Notably, the estimation of total annual cooling by applying the optimizing cases of this study was 155.30 GJ/year, and it could save the annual cooling load by 46.63 GJ/year (23.09%) for all of the simulated cities compared with the existing case.

5. Conclusions

In this study, we proposed an improvement plan by modifying the louver opening area targeting typical Indonesian housing and adding proper insulation to the external wall, roof, and ceiling. The numerical software THERB with NAF (TherbV70NAF) was used, and the simulation accuracy was confirmed using field-measured data. THERB for HAM is an official software approved by the Japanese government and is validated through standardized tests, such as the Building Energy Simulation Test (BESTEST) [23,35]. A numerical analysis was conducted to examine the improved effect of the developed cases. Additionally, the annual cooling loads for the 14 target cities in Indonesia were calculated. A summary of this study is as follows:
  • Louver openings affect indoor conditions, where the larger the louver opening area, the higher the indoor temperature during daytime, and the lower the relative humidity. However, the situation was sharply reversed at night, when the temperature slightly decreased for a larger louver compared with the existing case.
  • Proper insulation effectively reduced indoor temperatures and controlled relative humidity. Compared to the existing model, level 4 insulation could reduce the indoor temperature and relative humidity by 2.10 °C and 7% at peak conditions.
  • The combination cases improved between various louver openings, and insulation could reduce the indoor temperature to 2.2 °C at peak conditions, and the relative humidity was stable at 60% and 78% during the day and at night.
  • Daily cooling loads of the test house in the selected area present a significant decrease in energy consumption by applying the most improved case of approximately 25.09% compared with the existing case.
  • The annual cooling load of each city declined by over 3.33 GJ/year. Therefore, the total annual cooling employing the optimizing cases was 155.30 GJ/year, which could save the annual cooling load of 46.63 GJ/year (23.09%) compared with the existing case.
This study established a plan to improve indoor temperature and reduce the energy consumption of low-income households in tropical climates through a passive approach. These results can be used as a reference not only for Indonesia but also for researchers in other tropical countries. Additionally, a simulation model was validated using measured values from a city in Indonesia. However, to gain a deeper understanding of the improved plan’s impact, it is essential to conduct an experimental review by measuring a house where the proposed system is installed across all climate zones in the selected cities. Therefore, the proposed system in this study can be implemented in the regulation of green building for single housing designs and construction in Indonesia, aiming to achieve energy efficiency and comfort.

Supplementary Materials

The following supporting information can be downloaded at: https://www.mdpi.com/article/10.3390/su151612173/s1, Figure S1: Inflow boundary condition (a) inflow wind speed, (b) turbulence energy dissipation rate, and (c) turbulence energy.

Author Contributions

Conceptualization, A.O. and Y.C.; Methodology, A.O.; Resources, A.O.; Data curation, M.I. and Y.C.; Writing—original draft, M.I.; Writing—review & editing, Y.A.; Visualization, M.I.; Supervision, A.O., Y.C. and Y.A. All authors have read and agreed to the published version of the manuscript.

Funding

This research received no external funding.

Institutional Review Board Statement

We confirm that the study did not require ethical approval.

Informed Consent Statement

We confirm that the study did not involve humans.

Acknowledgments

We thank Malikussaleh University, the Asian Development Bank (ADB), and The Ministry of Research, Technology, and Higher Education of the Republic of Indonesia for supporting this study through the Doctoral Degree Scholarship Program (Grant No. L3749-INO).

Conflicts of Interest

The authors declared that they have no conflict of interest in this research.

References

  1. Xing, Y.; Hewitt, N.; Griffiths, P. Zero carbon buildings refurbishment––A Hierarchical pathway. Renew. Sustain. Energy Rev. 2011, 15, 3229–3236. [Google Scholar] [CrossRef]
  2. Sambodo, M.T.; Novandra, R. The state of energy poverty in Indonesia and its impact on welfare. Energy Policy 2019, 132, 113–121. [Google Scholar] [CrossRef]
  3. Choi, Y.; Song, D.; Ozaki, A.; Lee, H.; Park, S. Do energy subsidies affect the indoor temperature and heating energy consumption in low-income households? Energy Build. 2022, 256, 111678. [Google Scholar] [CrossRef]
  4. Grey, C.N.B.; Schmieder-Gaite, T.; Jiang, S.; Nascimento, C.; Poortinga, W. Cold homes, fuel poverty and energy efficiency improvements: A longitudinal focus group approach. Indoor Built Environ. 2017, 26, 902–913. [Google Scholar] [CrossRef] [PubMed] [Green Version]
  5. Liddell, C.; Morris, C. Fuel poverty and human health: A review of recent evidence. Energy Policy 2010, 38, 2987–2997. [Google Scholar] [CrossRef]
  6. Oreszczyn, T.; Hong, S.H.; Ridley, I.; Wilkinson, P. Determinants of winter indoor temperatures in low income households in England. Energy Build. 2006, 38, 245–252. [Google Scholar] [CrossRef]
  7. Paravantis, J.A.; Santamouris, M. An analysis of indoor temperature measurements in low- and very-low-income housing in Athens, Greece. Adv. Build. Energy Res. 2016, 10, 20–45. [Google Scholar] [CrossRef]
  8. Rudge, J.; Gilchrist, R. Measuring the health impact of temperatures in dwellings: Investigating excess winter morbidity and cold homes in the London Borough of Newham. Energy Build. 2007, 39, 847–858. [Google Scholar] [CrossRef]
  9. Santamouris, M.; Alevizos, S.; Aslanoglou, L.; Mantzios, D.; Milonas, P.; Sarelli, I.; Karatasou, S.; Cartalis, K.; Paravantis, J. Freezing the poor—Indoor environmental quality in low and very low income households during the winter period in Athens. Energy Build. 2014, 70, 61–70. [Google Scholar] [CrossRef]
  10. Bardhan, R.; Debnath, R.; Jana, A.; Norford, L.K. Investigating the association of healthcare-seeking behavior with the freshness of indoor spaces in low-income tenement housing in Mumbai. Habitat Int. 2018, 71, 156–168. [Google Scholar] [CrossRef]
  11. Jevons, R.; Carmichael, C.; Crossley, A.; Bone, A. Minimum indoor temperature threshold recommendations for English homes in winter – A systematic review. Public Health 2016, 136, 4–12. [Google Scholar] [CrossRef]
  12. Webb, E.; Blane, D.; de Vries, R. Housing and respiratory health at older ages. J. Epidemiol. Community Health 2013, 67, 280–285. [Google Scholar] [CrossRef] [PubMed]
  13. BRR. Monthly Report; Pusdatin BRR, NAD NIAS: Banda Aceh, Indonesia, 2008. [Google Scholar]
  14. Sari, L.H.; Hasan, I.; Irwansyah, M.; Meutia, E. An Environmental Assessment of Vernacular Housing in Banda Aceh, Indonesia. Tesa Arsit. 2017, 15, 1–12. [Google Scholar] [CrossRef]
  15. Tong, S.; Wen, J.; Wong, N.H.; Tan, E. Impact of façade design on indoor air temperatures and cooling loads in residential buildings in the tropical climate. Energy Build. 2021, 243, 110972. [Google Scholar] [CrossRef]
  16. Prianto, E.; Depecker, P. Optimization of architectural design elements in tropical humid region with thermal comfort approach. Energy Build. 2003, 35, 273–280. [Google Scholar] [CrossRef]
  17. Putra, I.D.G.A.; Nimiya, H.; Sopaheluwakan, A.; Kubota, T.; Lee, H.S.; Pradana, R.P.; Alfata, M.N.F.; Perdana, R.B.; Permana, D.S.; Riama, N.F. Development of climate zones for passive cooling techniques in the hot and humid climate of Indonesia. Build. Environ. 2022, 226, 109698. [Google Scholar] [CrossRef]
  18. Gong, X.; Akashi, Y.; Sumiyoshi, D. Optimization of passive design measures for residential buildings in different Chinese areas. Build. Environ. 2012, 58, 46–57. [Google Scholar] [CrossRef]
  19. Huang, H.; Zhou, Y.; Huang, R.; Wu, H.; Sun, Y.; Huang, G.; Xu, T. Optimum insulation thicknesses and energy conservation of building thermal insulation materials in Chinese zone of humid subtropical climate. Sustain. Cities Soc. 2020, 52, 101840. [Google Scholar] [CrossRef]
  20. Sana, S.; Hayati, A.; Salmanzadeh, M. Optimization of Window-to-Wall Ratio for Buildings Located in. Energies 2021, 14, 1974. [Google Scholar]
  21. Ahmadi, F.; Wilkinson, S.; Rezazadeh, H.; Keawsawasvong, S.; Najafi, Q.; Masoumi, A. Energy efficient glazing: A comparison of microalgae photobioreactor and Iranian Orosi window designs. Build. Environ. 2023, 233, 109942. [Google Scholar] [CrossRef]
  22. Ashouri, M.; Astaraei, F.; Ghasempour, R.; Ahmadi, M.; Feidt, M. Optimum insulation thickness determination of a building wall using exergetic life cycle assessment. Appl. Therm. Eng. 2016, 106, 307–315. [Google Scholar] [CrossRef]
  23. Ozaki, A.; Tsujimaru, T. Prediction of hygrothermal environment of buildings based upon combined simulation of heat and moisture transfer and airflow. In Proceedings of the Building Simulation, Montreal, QC, Canada, 15–18 August 2005; pp. 899–906. [Google Scholar]
  24. Etheridge, D. Natural Ventilation of Buildings: Theory, Measurement and Design; John Wiley & Sons, Ltd.: Hoboken, NJ, USA, 2011. [Google Scholar] [CrossRef]
  25. Heiselberg, P.; Svidt, K.; Nielsen, P.V. Characteristics of airflow from open windows. Build Environ. 2001, 36, 859–869. [Google Scholar] [CrossRef]
  26. Iqbal, A.; Afshari, A.; Wigö, H.; Heiselberg, P. Discharge coefficient of centre-pivot roof windows. Build. Environ. 2015, 92, 635–643. [Google Scholar] [CrossRef]
  27. AIJ. AIJ Recommendations for Loads on Buildings (2015); Architectural Institute of Japan: Tokyo, Japan, 2019; Available online: https://www.aij.or.jp/ (accessed on 15 March 2023).
  28. Cóstola, D.; Blocken, B.; Hensen, J. Overview of pressure coefficient data in building energy simulation and airflow network programs. Build. Environ. 2009, 44, 2027–2036. [Google Scholar] [CrossRef] [Green Version]
  29. Maruta, E.; Sawachl, T.; Sato, K.-I.; Takahashi, Y.; Nishizawa, S. Wind Pressure Coefficient Database for Natural Ventilation Design; Building Research Institute, National Research and Development Agency: Tokyo, Japan, 2018; Available online: https://www.kenken.go.jp/japanese/contents/publications/data/189/all.pdf (accessed on 28 February 2023).
  30. ASHRAE 14. Measurement of Energy, Demand, and Water Savings; ASHRAE Guideline 14-2014; ASHRAE: Atlanta, GA, USA, 2014; Volume 4, pp. 1–150. Available online: www.ashrae.org%0Awww.ashrae.org/technology (accessed on 20 March 2023).
  31. U. S. Department of Energy–Federal Energy Management Program. M&V Guidelines: Measurement and Verification for Performance-Based Contracts—Version 4.0; U.S. Department of Energy: Washington, DC, USA, 2015; Volume 3, pp. 1–108. [Google Scholar]
  32. Efficiency Valuation Organization. International Performance Measurement & Verification Protocol, Handbook of Financing Energy Projects; National Technical Information Service: Springfield, VA, USA, 2016; Volume I, 122p. [Google Scholar]
  33. Mustafaraj, G.; Marini, D.; Costa, A.; Keane, M. Model calibration for building energy efficiency simulation. Appl. Energy 2014, 130, 72–85. [Google Scholar] [CrossRef]
  34. Royapoor, M.; Roskilly, T. Building model calibration using energy and environmental data. Energy Build. 2015, 94, 109–120. [Google Scholar] [CrossRef] [Green Version]
  35. Choi, Y.; Cho, W.; Ozaki, A.; Lee, H. Influence of the moisture driving force of moisture adsorption and desorption on indoor hygrothermal environment and building thermal load. Energy Build. 2021, 253, 111501. [Google Scholar] [CrossRef]
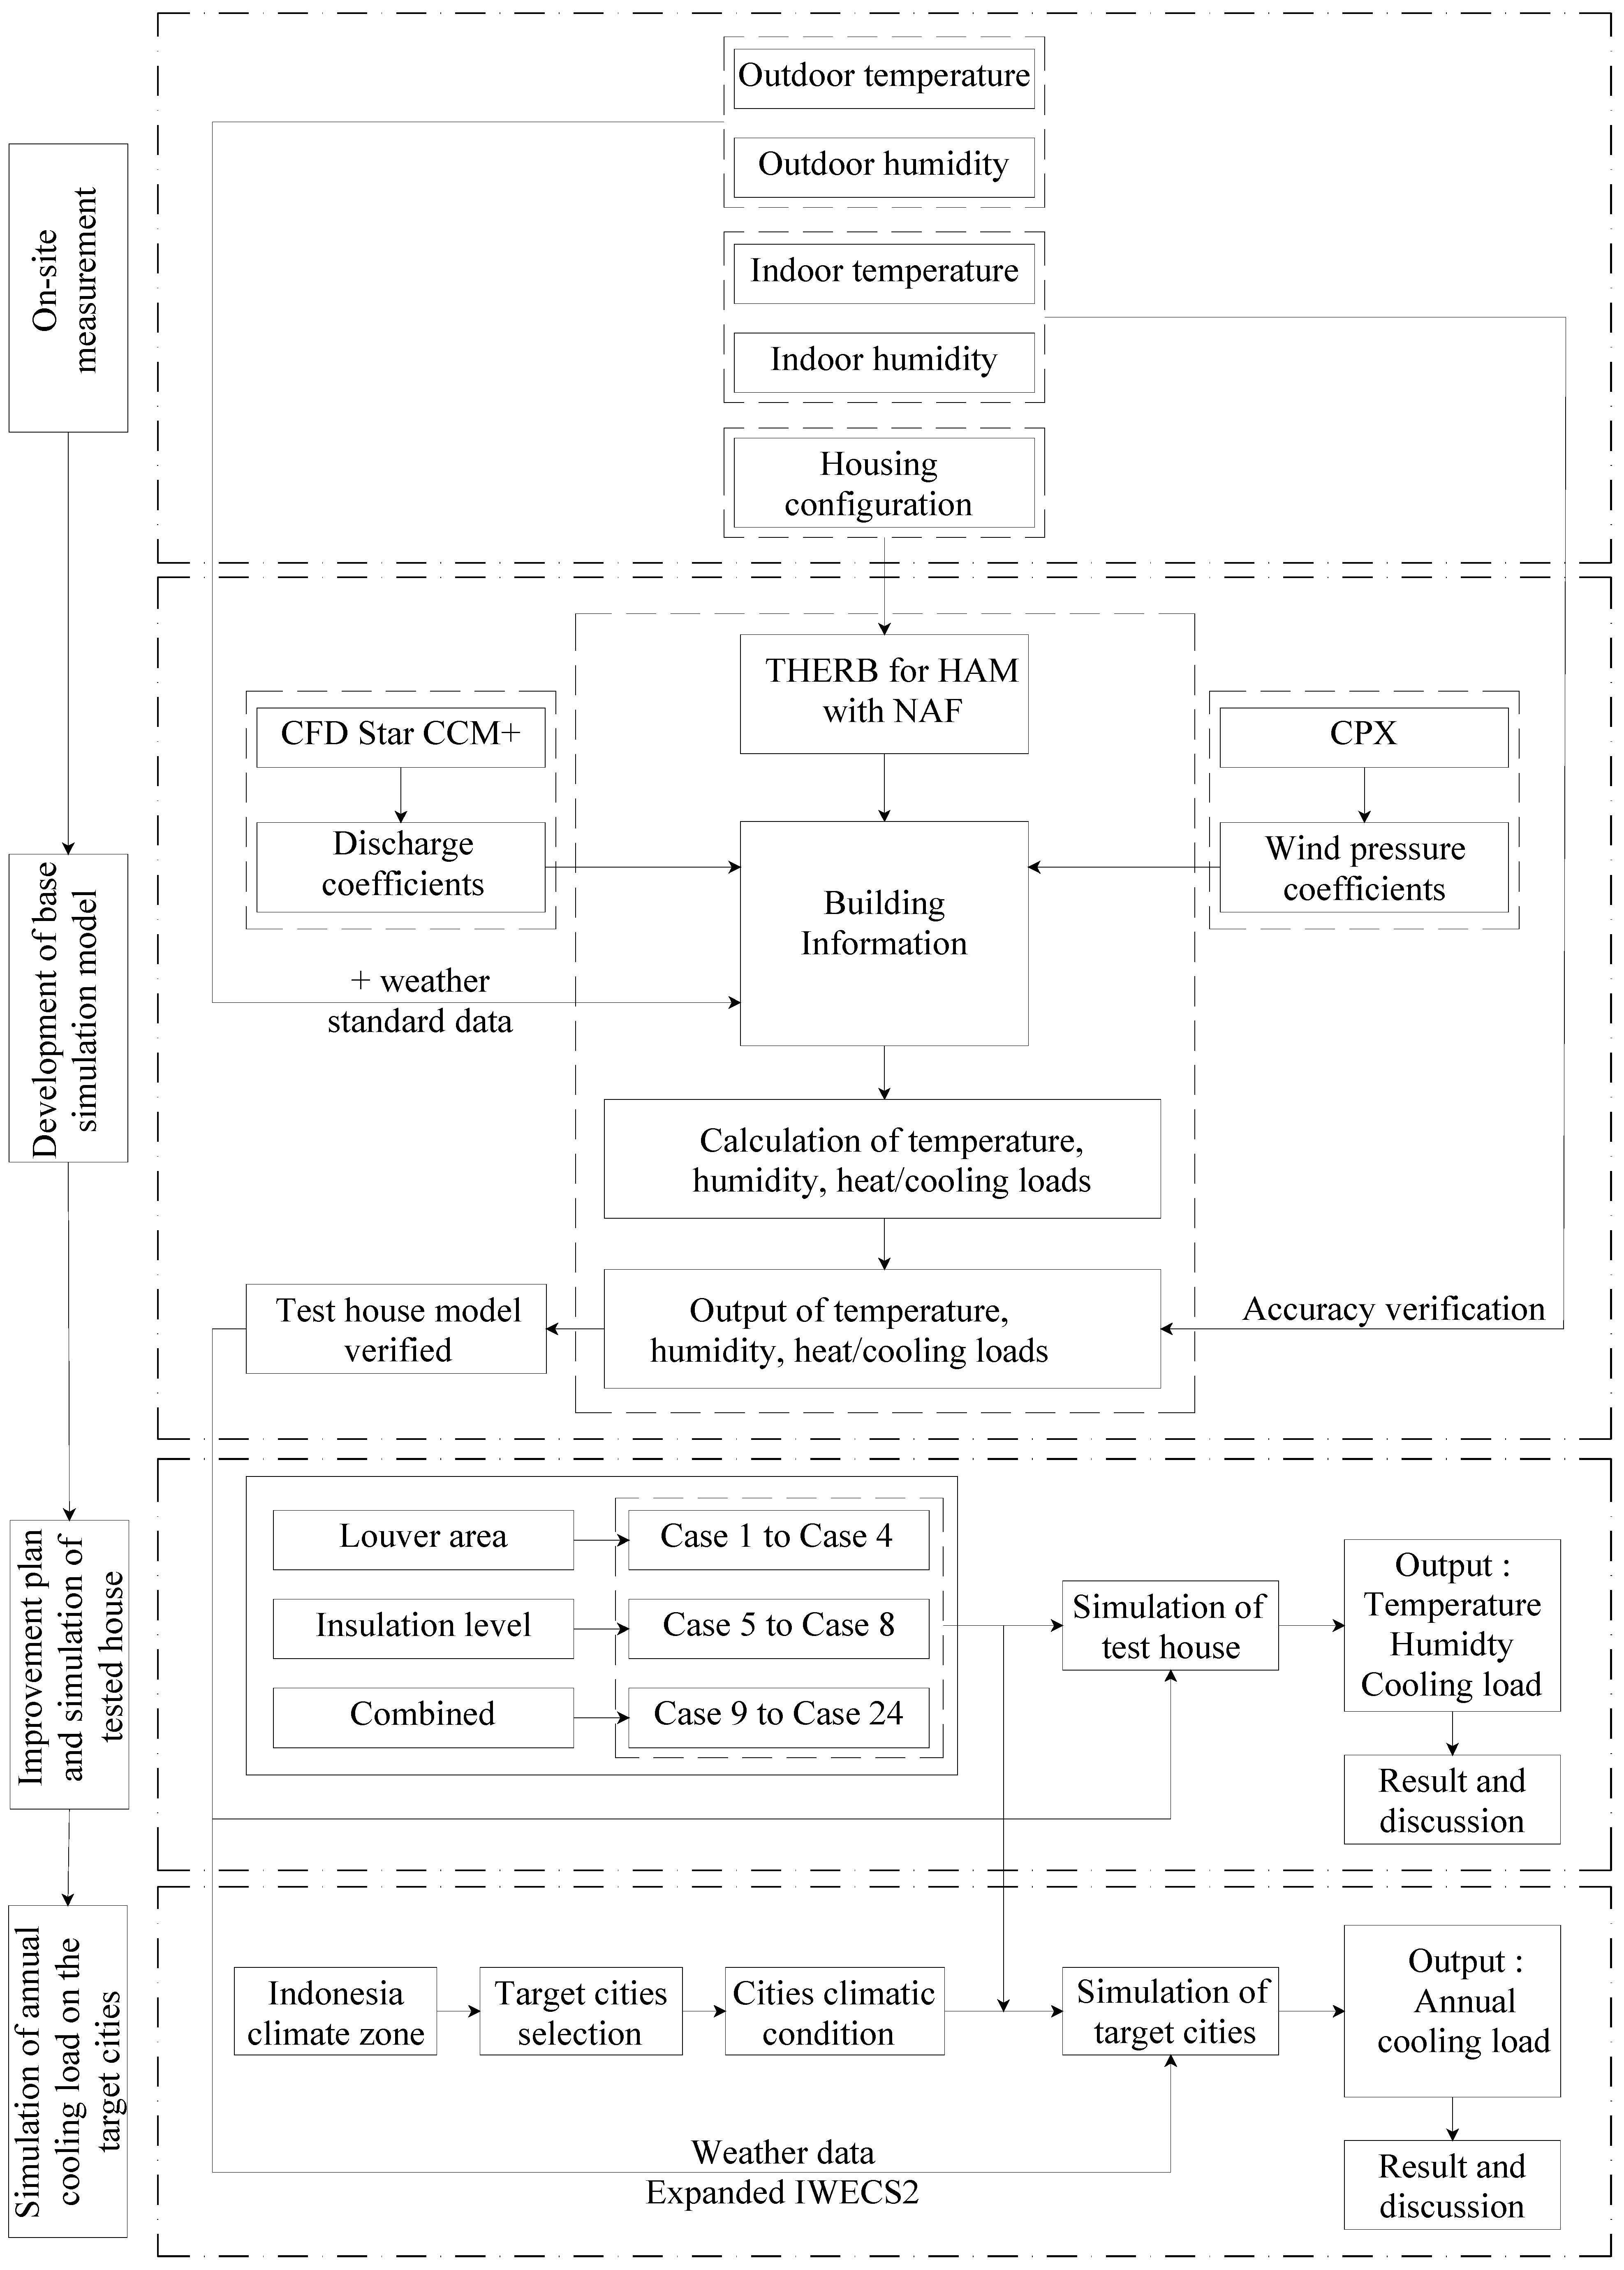
Figure 1. Research steps.
Sustainability 15 12173 g001
Figure 2. Plan and section of test house (unit: mm): (a) floor plan; (b) cross-section; (c) measurement photograph.
Sustainability 15 12173 g002
Figure 3. Various target cities according to climate zones of Indonesia [17].
Sustainability 15 12173 g003
Figure 4. Insulation of improvement plan.
Sustainability 15 12173 g004
Figure 5. The wind pressure coefficients.
Sustainability 15 12173 g005
Figure 6. Comparison of measured value and simulated value: (a) temperature; (b) relative humidity; (c) absolute humidity.
Sustainability 15 12173 g006aSustainability 15 12173 g006b
Figure 7. Comparison of living room conditions by louver improvement cases: (a) temperature; (b) relative humidity; (c) absolute humidity.
Sustainability 15 12173 g007aSustainability 15 12173 g007b
Figure 8. Daily cooling loads of louver improvement cases.
Sustainability 15 12173 g008
Figure 9. Comparison of living room conditions by insulation improvement cases: (a) temperature; (b) relative humidity; (c) absolute humidity.
Sustainability 15 12173 g009aSustainability 15 12173 g009b
Figure 10. Daily cooling loads of insulation improvement cases.
Sustainability 15 12173 g010
Figure 11. Comparison of living room conditions by combined improvement cases: (a) temperature; (b) relative humidity, (c) absolute humidity.
Sustainability 15 12173 g011aSustainability 15 12173 g011b
Table 1. Building envelope information of the test house.
CategoryLayerThicknessThermalSpecific HeatSpecificMoistureMoisture
ConductivityGravityConductivityCapacity
[m][W/(m·K)][J/(kg·K)][kg/m3][kg/(m·s·Pa)][kg/(m3(kJ/kg)]
Roof
(U-Value = 8.13 W/(m2·K))
Zinc plate0.00021108962800--
Ceiling
(U-Value = 5.48 W/(m2·K))
Plywood0.0040.1201880.0556.05.670 × 10−132.200 × 10⁻¹
Exterior wall
(U-Value = 2.90 W/(m2·K))
Cement mortar0.031.910917.02009.04.570 × 10−121.830 × 10⁻¹
Brickwork0.10.807880.01792.02.600 × 10−111.072 × 10⁻²
Floor
(U-Value = 4.50 W/(m2·K))
Sand0.11.910840.01764.00.0000.000
Concrete0.051.619890.02206.01.020 × 10−121.881
Cement mortar0.021.910917.02009.04.570 × 10−121.830 × 10⁻¹
Concrete tile0.0091.18372100--
Table 2. Measurement devices.
DescriptionSpecification
Measures temperature range−40 °C to +60 °C
Measures humidity range1%RH–99%RH
Temperature accuracy±1 °C under 0–50 °C
Humidity accuracy±4% under 20–80%
Logging interval8 s to 4 h
Table 3. Simulation condition for annual cooling loads.
Condition
Calculation periodsJanuary 1 to December 31
Calculation interval3600 s
Calculation targetLiving room
Indoor set-point of temperature and RHTemperature: 24 °C
RH: 60%
Space conditioning time6–9, 12–13, 17–22 (Living schedule of a family)
Weather dataExpanded IWEC2 Weather data
Table 4. Climate conditions of target cities.
CityTemperature [°C]Relative Humidity [%]Wind Velocity [m/s]Solar Radiation [w/m2]
MinMaxAverageMinMaxAverageMinMaxAverageMinMaxAverage
Lhokseumawe18.6037.9026.984410081.58030.801.6801134111.01
Banda Aceh19.1036.9026.943410080.07025.701.7401149162.29
Kerinci9.5030.7022.703210082.62027.801.500925147.15
Wamena6.7028.6019.582610080.46015.402.210897114.37
Cilacap2.5055.6026.361810082.65048.302.0301250111.58
Sumbawa Besar18.3038.8026.862410078.21015.401.620874136.34
Waingapu12.1039.0026.842410076.95012.902.130922150.67
Surabaya19.0037.7027.931610075.10020.602.700889187.55
Balikpapan22.0037.0027.495010085.36030.802.190887178.51
Maluku Utara21.0034.4026.784110086.01011.301.170868135.64
Semarang14.3037.4028.162210074.26029.902.770940202.51
Gorontalo20.7034.6027.164110082.33027.801.490917218.44
Bima18.2036.3027.512510078.49025.702.200943271.95
Madura21.2034.1027.764710081.10039.103.860955205.40
Table 5. Simulated cases’ configuration.
CasesLouver AreaInsulation LevelRemarks
Louver 1 [m2]Louver 2 [m2]No Ins.Ins. 1Ins. 2Ins. 3Ins. 4
N0.320.19 Existing test house
C10.160.095 Reduce louver area (louver area of existing × 0.5)
C20.080.048 Reduce louver area (louver area of existing × 0.25)
C30.640.38 Enlarge louver area (louver area of existing × 2)
C41.280.76 Enlarge louver area (louver area of existing × 4)
C50.320.19 Insulation 1 (a1, b1, c2, d1)
C60.320.19 Insulation 2 (a2, b2, c2, d1)
C70.320.19 Insulation 3 (a3, b3, c2, d1)
C80.320.19 Insulation 4 (a3, b3, c3, d1)
C90.160.095 Combined 1 (c1 and c5)
C100.160.095 Combined 2 (c1 and c6)
C110.160.095 Combined 3 (c1 and c7)
C120.160.095 Combined 4 (c1 and c8)
C130.080.048 Combined 5 (c2 and c5)
C140.080.048 Combined 6 (c2 and c6)
C150.080.048 Combined 7 (c2 and c7)
C160.080.048 Combined 8 (c2 and c8)
C170.640.38 Combined 9 (c3 and c5)
C180.640.38 Combined 10 (c3 and c6)
C190.640.38 Combined 11 (c3 and c7)
C200.640.38 Combined 12 (c3 and c8)
C211.280.76 Combined 13 (c4 and c5)
C221.280.76 Combined 14 (c4 and c6)
C231.280.76 Combined 15 (c4 and c7)
C241.280.76 Combined 16 (c4 and c8)
Table 6. Ground roughness classification.
Ground Surface Roughness Classification
Zg (sky wind altitude)250350450550650
α0.10.150.20.270.35
Table 7. Analysis conditions.
ContentDetail
Analysis softwareSTAR-CCM+ (v12.04B)
Analysis domain50 m (x) × 90 m (y) × 25 m (z)
Number of meshes3,300,000
Inflow boundary condition1/5 power law
Outflow boundary conditionGradient 0 at the outflow boundary
Air/Side Boundary Conditions Slip
Wall conditionsFloor surface: wall boundary condition based on wall function
Target building: wall boundary condition based on wall function
Calculation algorithmSIMPLE method
Turbulence modelRealizable k-ε model
Table 8. Calibration criteria and prediction error.
IndicatorPrediction ErrorStandard
TemperatureRHAbs. HumidityASHRAEIPMVPFEMP
MBE2.06%3.05%3.22%±10%±10%±5%
CV (RMSE)2.69%3.97%4.01%<30%<30%<20%
Table 9. Daily cooling load of improvement cases in the test house.
CasesParametersDaily Cooling Loads
kWh%
NExisting Model10.74100.00
C1Reduce louvre 110.4397.18
C2Reduce louvre 29.9892.98
C3Enlarge louvre 111.90110.88
C4Enlarge louvre 214.25132.77
C5Insulation 110.4797.53
C6Insulation 29.6389.67
C7Insulation 39.5188.60
C8Insulation 48.9883.67
C9C1 + C59.9492.57
C10C1 + C69.0884.54
C11C1 + C78.9483.24
C12C1 + C88.3677.88
C13C2 + C59.6890.21
C14C2 + C68.7581.48
C15C2 + C78.6380.41
C16C2 + C88.0474.91
C17C3 + C511.70108.97
C18C3 + C610.93101.79
C19C3 + C710.80100.60
C20C3 + C810.3296.13
C21C4 + C514.05130.89
C22C4 + C613.35124.39
C23C4 + C713.27123.64
C24C4 + C812.88120.01
Table 10. Annual cooling load of the developed cases for 14 target cities.
CasesParametersAnnual Thermal Load per Unit of Living Room (63.37 m³) for Each City ((GJ/year) and (%))
Lhok-Seumawe Banda AcehKerinciWamenaCilacapSumbawa Besar WaingapuSurabayaBalikpapanMaluku UtaraSemarangGorontaloBimaMadura
NExisting Model14.1112.691.64−0.0711.4515.356.2822.9318.0414.5224.9314.9722.5822.50
(100%)(100%)(100%)(100%)(100%)(100%)(100%)(100%)(100%)(100%)(100%)(100%)(100%)(100%)
Case 1Reduce
louvre 1
13.7112.421.60−0.0711.0514.486.1522.0817.7114.0623.4514.2620.5020.38
(97%)(98%)(97%)(102%)(97%)(94%)(98%)(96%)(98%)(97%)(94%)(95%)(91%)(91%)
Case 2Reduce
louvre 2
13.1211.831.43−0.0710.5413.665.8321.2417.1413.5422.2713.4819.3619.43
(93%)(93%)(87%)(101%)(92%)(89%)(93%)(93%)(95%)(93%)(89%)(90%)(86%)(86%)
Case 3Enlarge
louvre 1
15.6413.941.98−0.0813.1917.737.0725.6719.4916.1029.4317.2826.3326.78
(111%)(110%)(120%)(114%)(115%)(115%)(113%)(112%)(108%)(111%)(118%)(115%)(117%)(119%)
Case 4Enlarge
louvre 2
18.7316.632.58−0.1716.2822.358.6130.9922.6019.4037.1221.4032.9633.36
(133%)(131%)(157%)(237%)(142%)(146%)(137%)(135%)(125%)(134%)(149%)(143%)(146%)(148%)
Case 5Insulation 113.7612.311.51−0.0911.2615.076.1722.5117.7314.2024.6714.5822.0822.28
(98%)(97%)(92%)(125%)(98%)(98%)(98%)(98%)(98%)(98%)(99%)(97%)(98%)(99%)
Case 6Insulation 212.6511.371.32−0.0910.3814.125.7021.4816.9113.5023.6013.3220.5521.16
(90%)(90%)(81%)(124%)(91%)(92%)(91%)(94%)(94%)(93%)(95%)(89%)(91%)(94%)
Case 7Insulation 312.5011.241.22−0.1010.3214.015.6621.2616.6513.4423.4213.0820.3821.00
(89%)(89%)(74%)(134%)(90%)(91%)(90%)(93%)(92%)(93%)(94%)(87%)(90%)(93%)
Case 8Insulation 411.8010.561.13−0.099.8213.445.3820.6016.0212.9222.7612.4519.5420.38
(84%)(83%)(69%)(117%)(86%)(88%)(86%)(90%)(89%)(89%)(91%)(83%)(87%)(91%)
Case 9C1 + C513.0611.751.35−0.0810.6213.915.8721.4217.1213.5122.8813.5819.6820.00
(93%)(93%)(82%)(105%)(93%)(91%)(93%)(93%)(95%)(93%)(92%)(91%)(87%)(89%)
Case 10C1 + C611.9310.701.18−0.089.9312.945.3720.2316.1812.7821.7412.4118.0518.80
(85%)(84%)(72%)(107%)(87%)(84%)(86%)(88%)(90%)(88%)(87%)(83%)(80%)(84%)
Case 11C1 + C711.7410.591.13−0.089.6312.815.3320.1015.9112.7221.5512.0317.8618.65
(83%)(83%)(69%)(107%)(84%)(83%)(85%)(88%)(88%)(88%)(86%)(80%)(79%)(83%)
Case 12C1 + C810.999.870.96−0.089.1212.205.0219.3915.2612.1720.8411.3316.9817.98
(78%)(78%)(58%)(109%)(80%)(79%)(80%)(85%)(85%)(84%)(84%)(76%)(75%)(80%)
Case 13C2 + C512.7311.501.33−0.0710.2913.325.7020.9016.7713.2321.9813.0818.9019.22
(90%)(91%)(81%)(96%)(90%)(87%)(91%)(91%)(93%)(91%)(88%)(87%)(84%)(85%)
Case 14C2 + C611.4910.441.12−0.079.4512.315.2219.7115.7712.7020.7911.7217.2418.01
(81%)(82%)(68%)(100%)(82%)(80%)(83%)(86%)(87%)(87%)(83%)(78%)(76%)(80%)
Case 15C2 + C711.3410.271.04−0.079.2612.215.1719.5215.5412.3720.6011.5016.9617.82
(80%)(81%)(63%)(100%)(81%)(80%)(82%)(85%)(86%)(85%)(83%)(77%)(75%)(79%)
Case 16C2 + C810.579.530.92−0.078.6911.574.8518.7914.8711.8119.8510.7816.0317.12
(75%)(75%)(56%)(96%)(76%)(75%)(77%)(82%)(82%)(81%)(80%)(72%)(71%)(76%)
Case 17C3 + C515.3713.601.87−0.0813.0017.516.9425.3819.2115.8229.1517.1925.8526.51
(109%)(107%)(114%)(115%)(113%)(114%)(111%)(111%)(106%)(109%)(117%)(115%)(115%)(118%)
Case 18C3 + C614.3612.851.66−0.0812.4016.606.4924.4818.3315.4628.2316.0124.4625.51
(102%)(101%)(101%)(107%)(108%)(108%)(103%)(107%)(102%)(106%)(113%)(107%)(108%)(113%)
Case 19C3 + C714.1912.641.61−0.0812.1316.506.4624.2018.2615.1328.0315.6824.3125.39
(101%)(100%)(98%)(107%)(106%)(107%)(103%)(106%)(101%)(104%)(112%)(105%)(108%)(113%)
Case 20C3 + C813.5612.031.49−0.0811.7016.016.2123.6217.6814.6527.4515.1123.5624.83
(96%)(95%)(91%)(110%)(102%)(104%)(99%)(103%)(98%)(101%)(110%)(101%)(104%)(110%)
Case 21C4 + C518.4616.342.45−0.1716.0422.118.4930.8022.2719.1336.9721.2132.5533.16
(131%)(129%)(149%)(235%)(140%)(144%)(135%)(134%)(123%)(132%)(148%)(142%)(144%)(147%)
Case 22C4 + C617.5515.582.27−0.1815.4821.398.1029.9221.5018.7936.1319.9931.4332.30
(124%)(123%)(138%)(247%)(135%)(139%)(129%)(131%)(119%)(129%)(145%)(134%)(139%)(144%)
Case 23C4 + C717.4415.472.20−0.1615.3421.288.0629.7921.4418.5636.0219.9031.1732.16
(124%)(122%)(134%)(225%)(134%)(139%)(128%)(130%)(119%)(128%)(145%)(133%)(138%)(143%)
Case 24C4 + C816.9314.992.07−0.1815.0120.877.8729.3220.9918.1835.5619.5030.6131.75
(120%)(118%)(126%)(246%)(131%)(136%)(125%)(128%)(116%)(125%)(143%)(130%)(136%)(141%)
Disclaimer/Publisher’s Note: The statements, opinions and data contained in all publications are solely those of the individual author(s) and contributor(s) and not of MDPI and/or the editor(s). MDPI and/or the editor(s) disclaim responsibility for any injury to people or property resulting from any ideas, methods, instructions or products referred to in the content.