Article

The Influence of Road Pavement Materials on Surface Texture and Friction

Department of Highway and Environmental Engineering, Faculty of Civil Engineering, University of Žilina, Univerzitná 8215/1, 010 26 Žilina, Slovakia
*
Author to whom correspondence should be addressed.
Sustainability 2023, 15(16), 12195; https://doi.org/10.3390/su151612195
Submission received: 17 July 2023 / Revised: 31 July 2023 / Accepted: 4 August 2023 / Published: 9 August 2023

Abstract

:
This article’s primary goal was to analyze the effect of texture on skid resistance. Surface texture was recorded with a revolutionary device designed to create 3D surface scans, the Static Road Scanner. The skid resistance was represented by a pendulum test value. Measurements were made on three different groups of surfaces. Reference surfaces with known standard grain sizes represented the first group. The second group consisted of specimens made from a different type of aggregate. The last group of surfaces consisted of asphalt specimens made from different sizes and types of aggregates used in a mixture. The test results shed some more light on understanding texture’s effect on surface friction. Although some results were expected, not all of them were proven. For instance, a high level of texture doesn’t necessarily mean high friction. A relatively strong relationship was found between friction and microtexture on the reference surfaces with grain sizes up to 125 µm. However, the relationships between texture and skid resistance on the aggregate and asphalt specimens turned out to be shallow for the investigated samples. For this reason, it was recommended to expand the number of investigated surfaces in further research to ensure sufficiently different levels of texture.

1. Introduction

The morphology of a road surface texture is one of the most important factors for the realization of friction on the pavement surface and the resulting skid resistance of the road [1,2,3]. Insufficient skid resistance is a decisive factor in traffic accidents [4,5,6]. Quality and objective diagnostics of road surface characteristics play a key role in maintaining road traffic safety at the required level during a road’s life cycle [7]. In general, it can be stated that skid resistance is influenced by several factors, such as the speed of a vehicle, tire inflation, tire tread depth, tread pattern, temperature, water film presence and depth, asphalt mixture composition, and the mineralogical composition of aggregates. However, there is still no doubt that the road surface and material it is made of are critical factors in determining friction. The material from which the wearing course is made and how it is built affect the texture of the road surface, which affects friction [8]. Besides friction, the texture of the road surface also affects other principal matters related to life quality, such as the amount of generated noise and particulate matter emissions [9]. Although the primary source of emissions is road transport [10], the wear of the road surface, depending on its texture, contributes a considerable share [11]. For this reason, measuring the texture of the road surface, in cooperation with assessing the impact of road traffic on the environment [12,13,14,15], is crucial for providing a holistic approach within the Pavement Management System [5,16,17,18,19,20]. The texture of the road surface consists of macrotexture and microtexture, which are decisive properties of the road surface, affecting the mutual interaction between the wheel and the road and thus also the safety of the road traffic [21,22,23,24,25,26,27].
The mentioned components of the morphology of asphalt pavements are integrally related, and their specific levels are influenced by the construction materials and techniques affecting the texture of the pavement [28,29]. Macrotexture refers to the more significant pavement surface irregularities associated with voids between aggregate particles, and it primarily depends on the size, shape, and distribution of the coarse aggregate fractions used in the wearing course. An adequate macrotexture is essential for the rapid outflow of water accumulated on the road surface to prevent aquaplaning [30]. In addition, it helps the development of the hysteresis component of friction, which is related to the energy loss when a tire deforms around macro-irregularities and consequently increases the skid resistance [31]. Many methods and devices have been developed to evaluate pavement surfaces’ macrotextures, and road network administrators commonly use many of them. Despite this, there is still research developing new contactless, real-time, and efficient pavement texture measurement approaches [32,33,34,35]. The study [35] utilized close-range photogrammetry to measure the texture of asphalt pavement surfaces, with a view of explaining the variation in friction measurements obtained using a GripTester. The texture parameters were related to friction measured at the image capture locations. The result was that a lane with higher friction values generally showed higher individual texture parameters across different scenarios. However, meaningful texture–friction correlations along the lanes were only obtained with the top 2 mm of the surface. The relationship between the texture parameters and the skid resistance was also investigated in the study [36], with the conclusion that the skid resistance increased along with an increase in the texture parameters. However, this statement was made based on the measurements of only two pavement specimens.
Microtexture refers to irregularities in the surfaces of aggregate particles, which are mainly a function of the mineralogy of the particles [37], the basic roughness level of the aggregate surface, and the ability of the aggregate to maintain its roughness against wear caused by traffic and climatic factors [38]. The microtexture plays an essential role in the contact between wet roads and tires. In addition, the task of the microtexture is to penetrate the thin water film on the road surface, so that close contact between the tire and the road is maintained. In general, the microtexture contributes to friction at all speeds, but dominates at low speeds (around 50 km/h); macrotexture generally controls friction at high speeds [25].
Knowledge of the influence of different materials in the composition of the mixture on the texture of a road surface is important, as they can favorably affect friction and other properties of the surface, as well as the cost efficiency of the road design. The optimization of wearing course design in terms of surface texture and skid resistance is necessary for increasing road safety.
This article aims to shed more light on the texture–friction relationship, where the surfaces of different materials were used for this objective. One of the main goals of the paper was to determine the impact of the individual scales of texture on skid resistance. Even though it is widely known that macrotexture significantly affects friction at high speeds (primarily due to the impacts of water drainage and hysteresis), it also has a nonnegligible effect at low speeds. The study [39] proved that the hypothesis that British Pendulum Number (BPN) is dependent only on surface microtexture and represents a low speed friction appears to be invalid. The skid number–speed gradient is not something universal, but varies from mix to mix.
According to the obtained results, this research aimed to imply the knowledge of the use of different types and sizes of aggregates considering the best skid resistance properties and a low cost for optimized wearing course design. To determine the rate of the impact of texture on skid resistance, measurements of the Pendulum Test Values (PTV) and the Mean Profile Depth (MPD) were performed on a wide range of surfaces. The friction dependences on the micro- and macrotexture were evaluated.

2. Methodology of Measurements

The methodology of the performed measurements consisted of obtaining data on the 3D texture of the surface of the individual tested materials using the developed Static Road Scanner (SRS). These raw surface data were further filtered and evaluated while we received parameters characterizing the surface roughness, for example, the MPD parameters for the microtexture and macrotexture, respectively. When recording the surfaces of the different materials, the influence of the results, with varying colors of surface, different lighting conditions, and the measurements’ repeatability, was also investigated. The experience gained was subsequently applied to the measurements on specimens with different types of aggregates. The last measurements were carried out on asphalt mixture specimens. The measurements were made on both new specimens, where the aggregates were coated with an asphalt binder, and on specimens washed with perchloroethylene, where the microtexture of the grain aggregates was revealed.
Subsequently, the British Pendulum Tester was used to obtain the coefficient of friction—the Pendulum Test Value according to the standard [40]. The magnitude of the resistance against the sliding of the rubber slider was on all the scanned surfaces. On the aggregate and asphalt specimens, measurements of the coefficient of friction were performed in both directions opposite each other. The resulting PTV value was defined as the arithmetic mean of both measurements in opposite directions.

2.1. Measuring Devices

2.1.1. British Pendulum Tester

A laboratory test with a British Pendulum Tester (BPT), shown in Figure 1, was used to obtain information about the friction on the surfaces of the individual test materials. The principle of the test is the sliding of a rubber pad over a surface and a subsequent loss of energy. The measurements of the friction coefficient were performed on wet and dry surfaces. The water film on the surfaces was created by spraying the rubber slider and its sliding path. The water film’s thickness was not measured. The resulting Pendulum Test Value (PTV) represented the value of the coefficient of friction on the individual test materials.

2.1.2. Static Road Scanner

To create a 3D model of the surfaces of the individual materials, the Static Road Scanner (SRS) device was used, as shown in Figure 1. This device was designed at the University of Žilina to record texture irregularities down to the microtexture scale. Two different methods were used for recording the surface. The first method used laser scanning with a resolution of 15 µm on the X and Y axes. The second one used a structured light with a resolution of 2.49 µm. The goal was to capture the texture from the area matching the track of the BPT rubber slider. The device output a 3D surface model in a text file with X, Y, and Z coordinates. This surface model was used as an input for the texture parameters calculation, subsequently performed in the MATLAB® R2020a software. This algorithm could calculate the standard roughness parameters according to the standard [41], and one of the outputs was also the MPD parameter, which is commonly used for road network surface texture characterization using profilometers, according to the standard [42]. The parameter can be used for the evaluation of a texture for irregularities in the scale of the macrotexture, but also that of the microtexture. The principle of the MPD determination was that, for each profile of the captured surface, the result was the arithmetically averaged two peak levels obtained on each half of the profile minus the average whole profile level. The lengths of the profiles were determined by the length of the specimen or the length of the slip path of the rubber slider. Single profiles were spaced every 15 µm from each other, which was determined by the SRS device resolution.

2.2. Testing Surfaces

Three different groups of surfaces were measured, depending on their individual materials. The first group of surfaces consisted of reference sandpapers with a known, standardly determined grain size (Figure 2a). The second group consisted of specimens made of different aggregate grains to assess the influence of the types of aggregate on the friction (Figure 2b). The last group was represented by asphalt specimens, made from different types and grain sizes of aggregates, to ensure a diverse microtexture and macrotexture of the surface (Figure 2c).

2.2.1. Reference Surfaces

Sandpapers with a known, standardized grain size, according to FEPA standards (from P16 to P7000), were used as the reference surfaces. The measurements took place on sandpapers not only with different grain sizes but also with different colors. In this way, more than 50 different types of reference surfaces were tested, with surface irregularities (grain sizes) ranging from 3 µm to 1324 µm. Since the homogeneity of the factory-produced sandpapers was assumed, the size of the scanned area of the sandpapers was limited to 30 × 10 mm.

2.2.2. Specimens of Aggregate

In the case of the aggregate specimens, it was a matter of simulating a different surface microtexture according to the type of aggregate used. To produce these specimens, aggregates of limestone, dolomite, andesite, and granodiorite, obtained from various quarries in Slovakia, were used. It was assumed that the highest level of microtexture was on the specimens using granodiorite, the middle level on those using andesite, and the lowest level on those using limestone. In total, nine specimens were produced with different types of aggregates from different quarries.

2.2.3. Specimens of Asphalt Mixture

As previously mentioned, the asphalt specimens were manufactured with the goal of providing a wide range of surfaces with diverse microtextures and macrotextures. Different fractions of aggregate should ensure different macrotextures of the surfaces, while using different types of aggregate should provide different microtextures. The aggregate fraction used to produce the asphalt specimens had maximum grain sizes of 8, 11, and 16 mm. The aggregates used for the specimens were Granodiorite (Gra), Andesite (And), and Limestone (Lim). This was how 12 specimens with different microtextures and macrotextures of their surfaces were created.

3. Results and Discussion

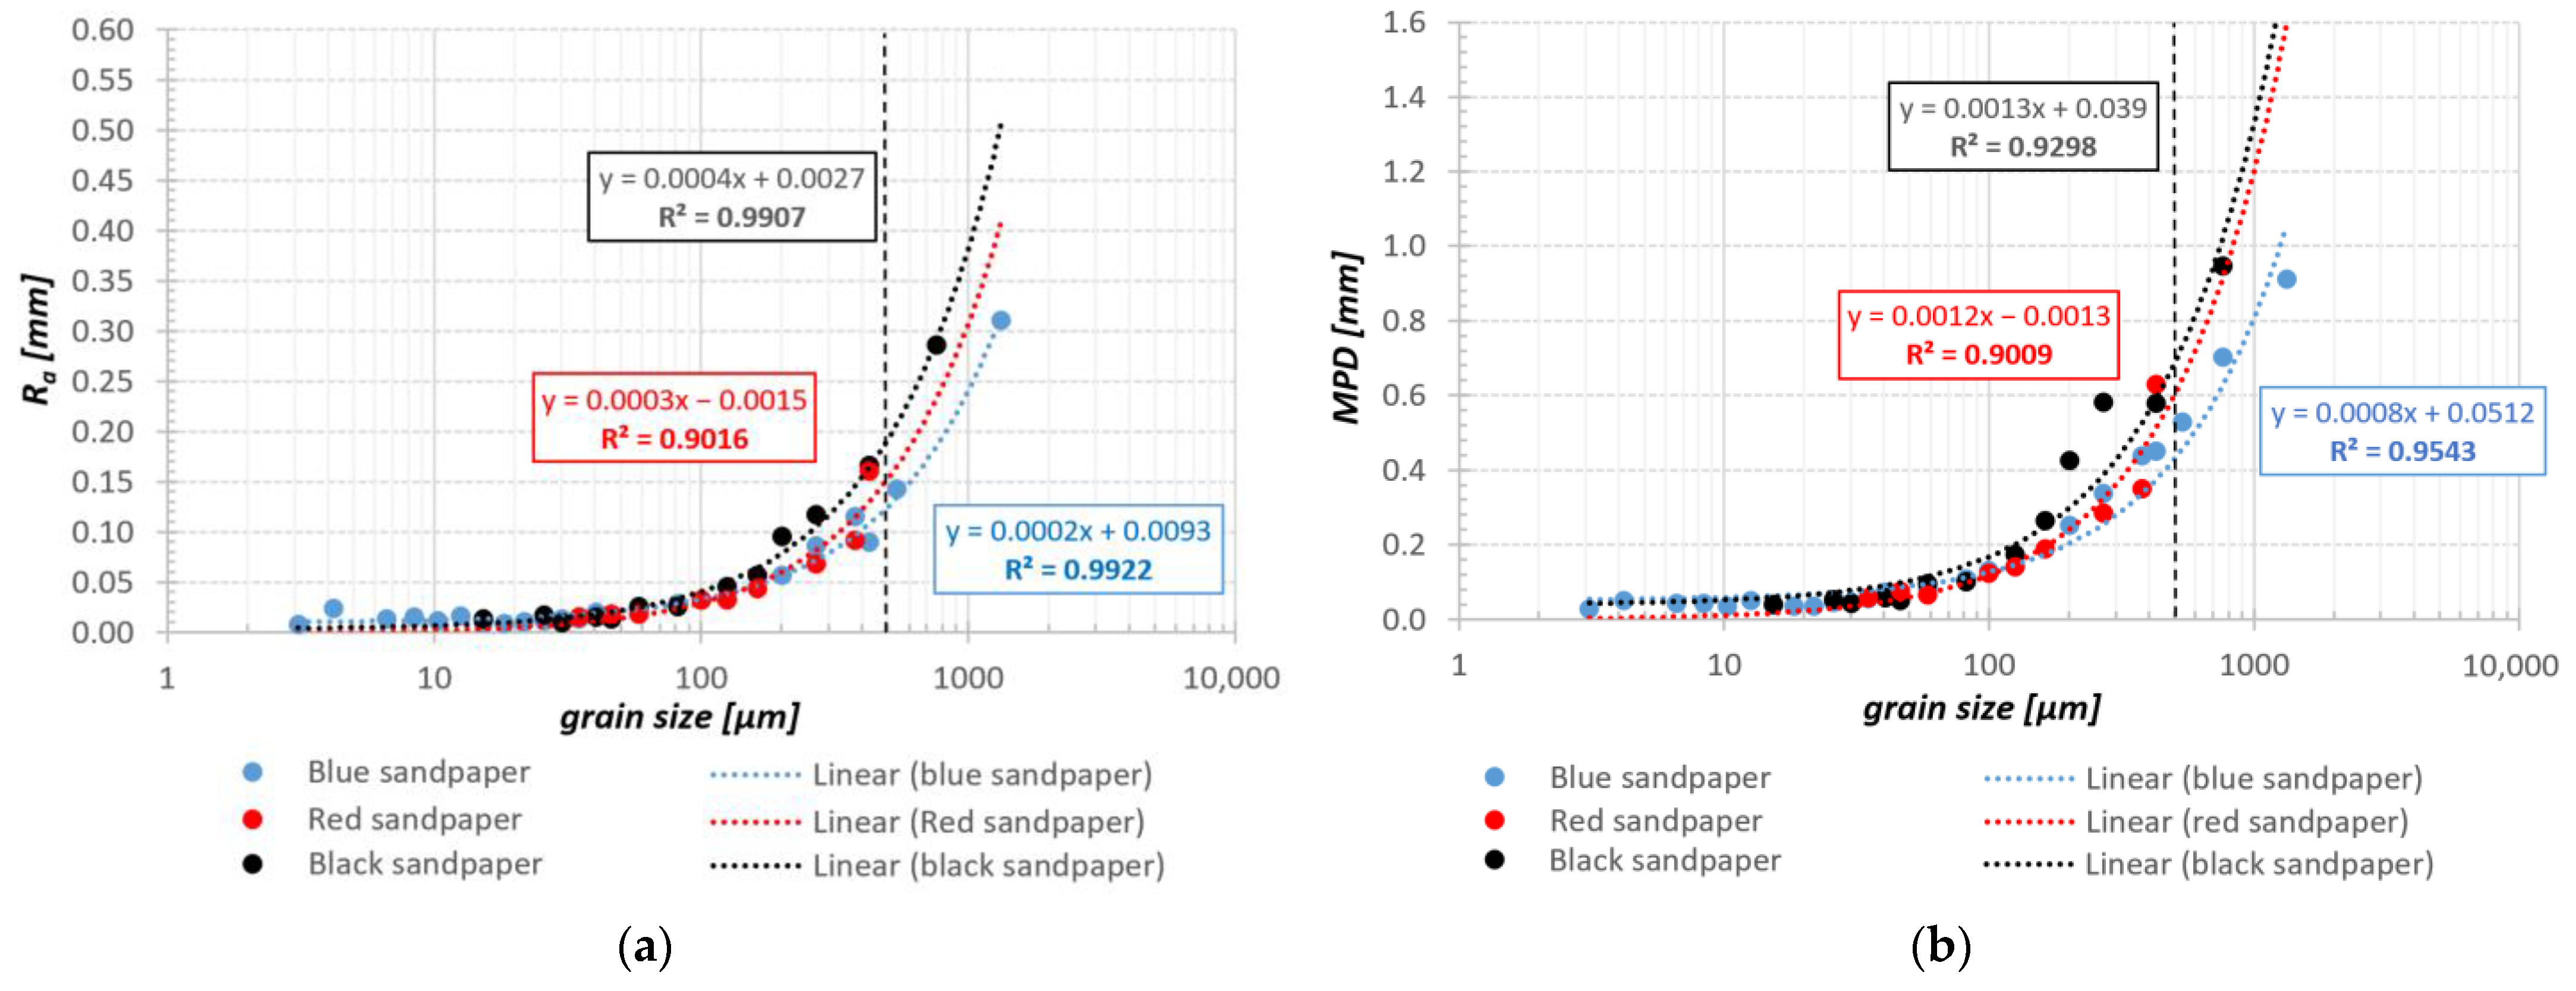
3.1. Results of Reference Surfaces

The measurements on the reference surfaces were primarily intended to test the SRS device’s reliability by comparing the measured values of the surface scans with the known values of the geometric parameters. The effects of various boundary conditions during the measurement on the accuracy of the resulting parameters were also investigated. The mentioned conditions during this measurement represented different surface colors (blue, gray, black, and red) and different light conditions (covered or uncovered device).
Subsequently, the device’s reliability was determined by comparing the measured parameters and the parameters declared by the sandpaper manufacturer. An example of the comparison between the grain size specified by the manufacturer and the measured parameter, Ra, is shown in Figure 3a. The relationship between the sandpaper grain size and the MPD value can be seen in Figure 3b.
The individual relationships are shown on semi log graphs to visualize the obtained results better. The presented results confirm the reliability of the SRS device. Individual, negligible differences between the sandpapers of different colors may have been due to different sandpaper manufacturers, where a different production process may have caused this slight deviation. Measurements under different marginal conditions had practically identical results, which confirmed the reliability of the device, independent of the lighting conditions.
Subsequently, the measured textures of all the reference surfaces were compared with the PTV friction values. Given the assumption that the microtexture was formed on a scale of irregularities smaller than 0.5 mm, it was mainly a matter of determining the relationship between the microtexture and the friction. Only the P16 and P24 sandpapers had a grain size exceeding the microtexture range. A comparison between the measured PTV value and paper grain size is shown in Figure 4a, and a comparison between the PTV value and MPD on the same sandpapers is shown in Figure 4b. The border between the microtexture and macrotexture is illustrated by the dashed line.
The results are presented only on blue and black sandpapers, as the sample of red papers was not sufficiently represented. Initially, it was assumed that increasing the sandpaper grain size would increase the PTV value. As can be seen from Figure 4, this trend was not demonstrated. In contrast, the PTV value rose only to a grain size (or MPD) of about 100 µm and then decreased. The highest friction values were achieved for irregularities with a value from approximately 80 to 125 µm. The range of the measured PTV values was from 61 to 103. As expected, relatively small friction values were obtained for surfaces with small irregularities. Lower values were also measured for surfaces considered to be rougher, i.e., irregularities greater than 200 µm. This fact indicates that it was impossible to determine friction based only on the height parameters of the profile. Since high texture values do not necessarily mean a high value of friction, finding other texture parameters, or their combinations, will be necessary.
If we consider only surfaces with unevenness sizes up to 125 µm, we can talk about a clear rising tendency of the friction based on texture. Here, a relatively strong relationship between microtexture and friction could be found. The relationship between the grain size and the pendulum test values is shown in Figure 5a, and the relationship between the pendulum test values and the MPD is shown in Figure 5b. For a better representation, a power function of the regression curve was used.
As seen in Figure 5, a relatively strong relationship between the microtexture and friction was found. However, this relationship was legitimate only for even surfaces with irregularities up to 125 µm. This meant that the friction prediction would not be sufficient without a characterization of the macrotexture.

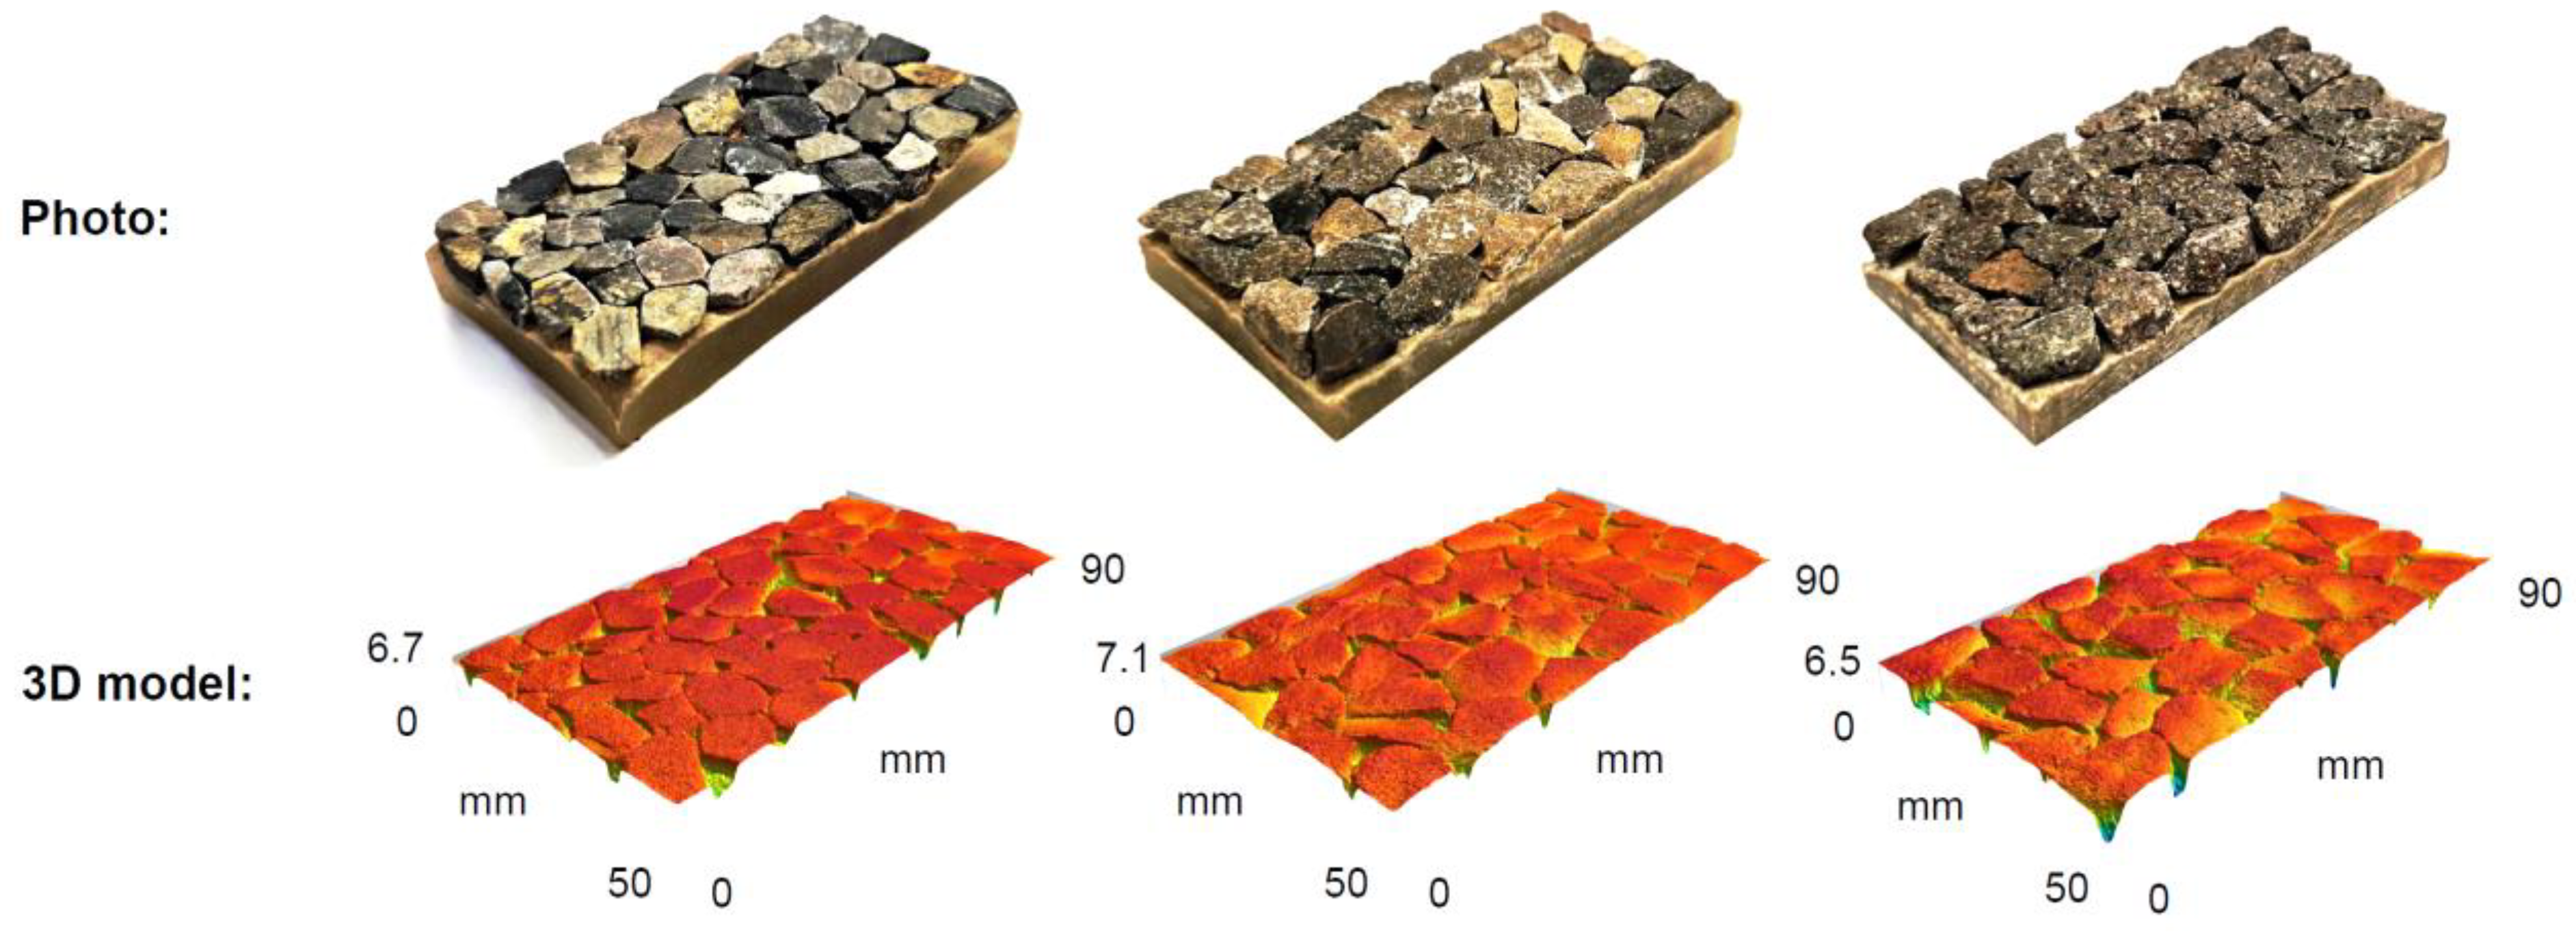
3.2. Results Obtained on Specimens of Aggregate

As mentioned in the article above, one of the groups of surfaces was made up of specimens consisting of various types of aggregate. Different types of aggregates were supposed to ensure different levels of microtexture. Aggregates from limestone, dolomite, andesite, and granodiorite, obtained from various quarries in Slovakia, were used to produce these specimens. Nine specimens were manufactured, upon which tests were carried out. Photos of examples of the selected aggregate specimens and their 3D models created from laser scans can be seen in Figure 6.
The same tests were performed on the aggregate specimens as those on the previous reference surfaces. Three-dimensional scans were created using the SRS device, and the coefficient of friction was measured using a pendulum test. All the tests were performed under the same boundary conditions. The measurement of the PTV using the pendulum test was performed only on surfaces covered with a water film in two opposite directions. The resulting levels of the textures represented by the MPD, as well as the skid resistance represented by the PTV, are shown in Table 1.

3.2.1. Results of Texture Measurement on Aggregate Specimens

In addition to the characteristics analyzed on the primary surfaces, including a range of both the macrotexture and microtexture (up to a resolution of 0.015 mm, given by the maximum resolution of the SRS device), the characteristics were analyzed for surfaces containing only irregularities falling into the scales of macrotexture and microtexture, respectively, obtained by filtering the primary profiles. This surface data filtering was performed according to the standard [43]. For a better representation of the results of the macrotextures on the individual specimens, they are shown in Figure 7a, and to show the results of the microtextures on the specimens, they are shown in Figure 7b.
It was hypothesized that different types of aggregate would provide significantly different levels of microtexture. The lowest level of microtexture was predicted for the specimens made from limestone, followed by the specimens made from andesite, and the highest level of microtexture was expected for the specimens from granodiorite.
Although the macrotexture and microtexture values had a similar course for individual aggregate specimens, the assumption that the lowest microtexture values would be recorded for limestone and the highest for granodiorite was not confirmed. In contrast, the aggregate specimens had microtexture values at approximately the same level. The highest values for both textures were recorded for specimen no. 7, which was made of andesite.

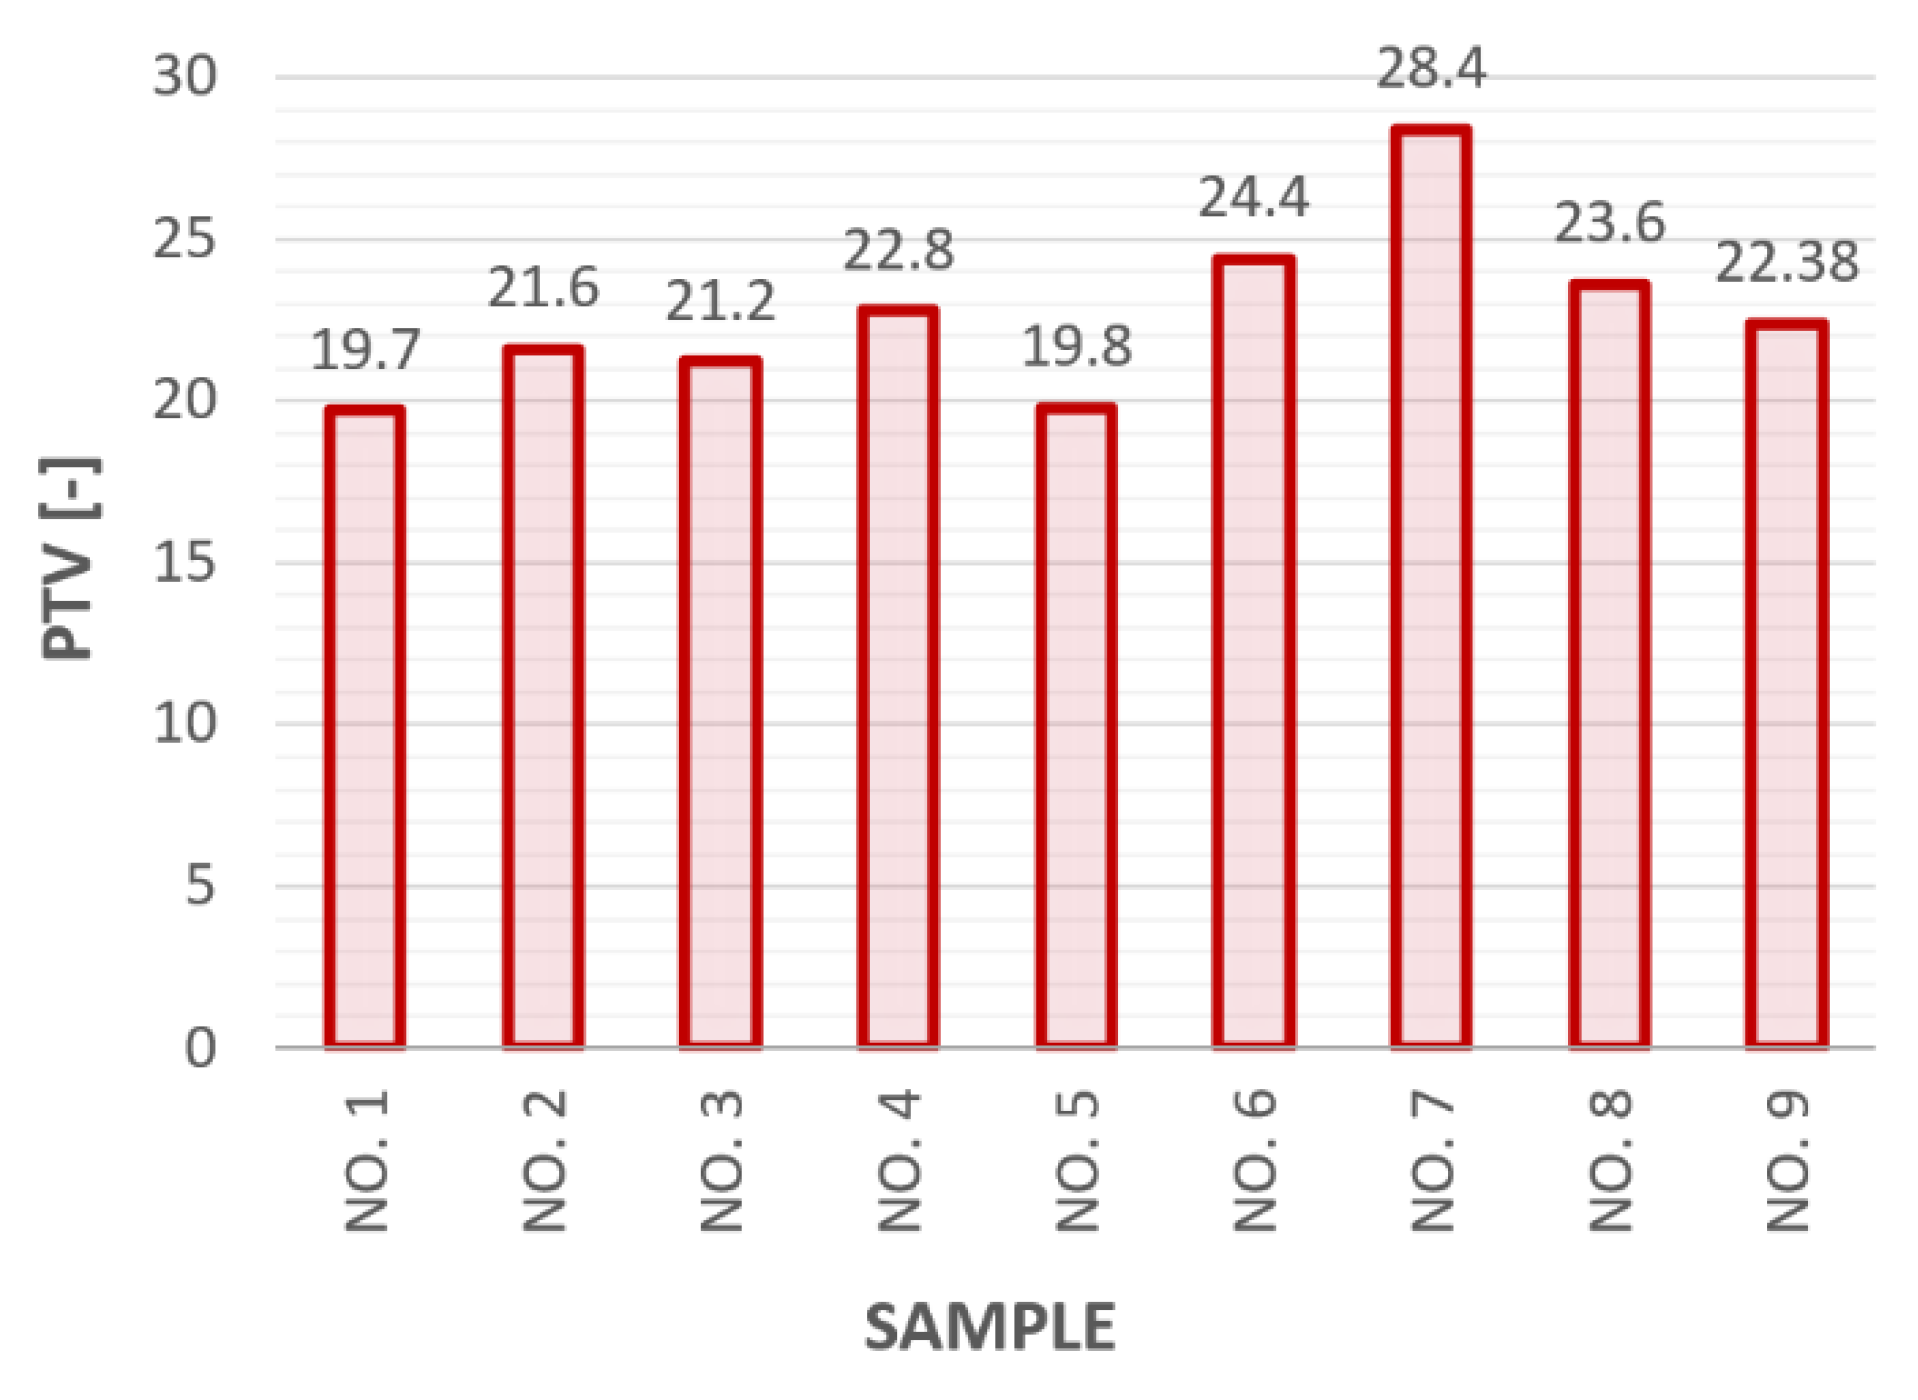
3.2.2. Skid Resistance Results on Aggregate Specimens

In addition to measuring the textures on the individual specimens, skid resistance measurements were carried out using a pendulum test. These tests were carried out on specimens covered with a water film in two opposite directions. The results of the measured values from the pendulum test are shown in Figure 8.
The lower levels of skid resistance characterized by the PTV were caused by a smaller contact area due to smaller dimensions of the specimen and the use of a narrow slider. The highest PTV value was recorded on specimen no. 7, upon which the highest texture values were also recorded. Even so, the differences between the levels of skid resistance were not as significant as expected.

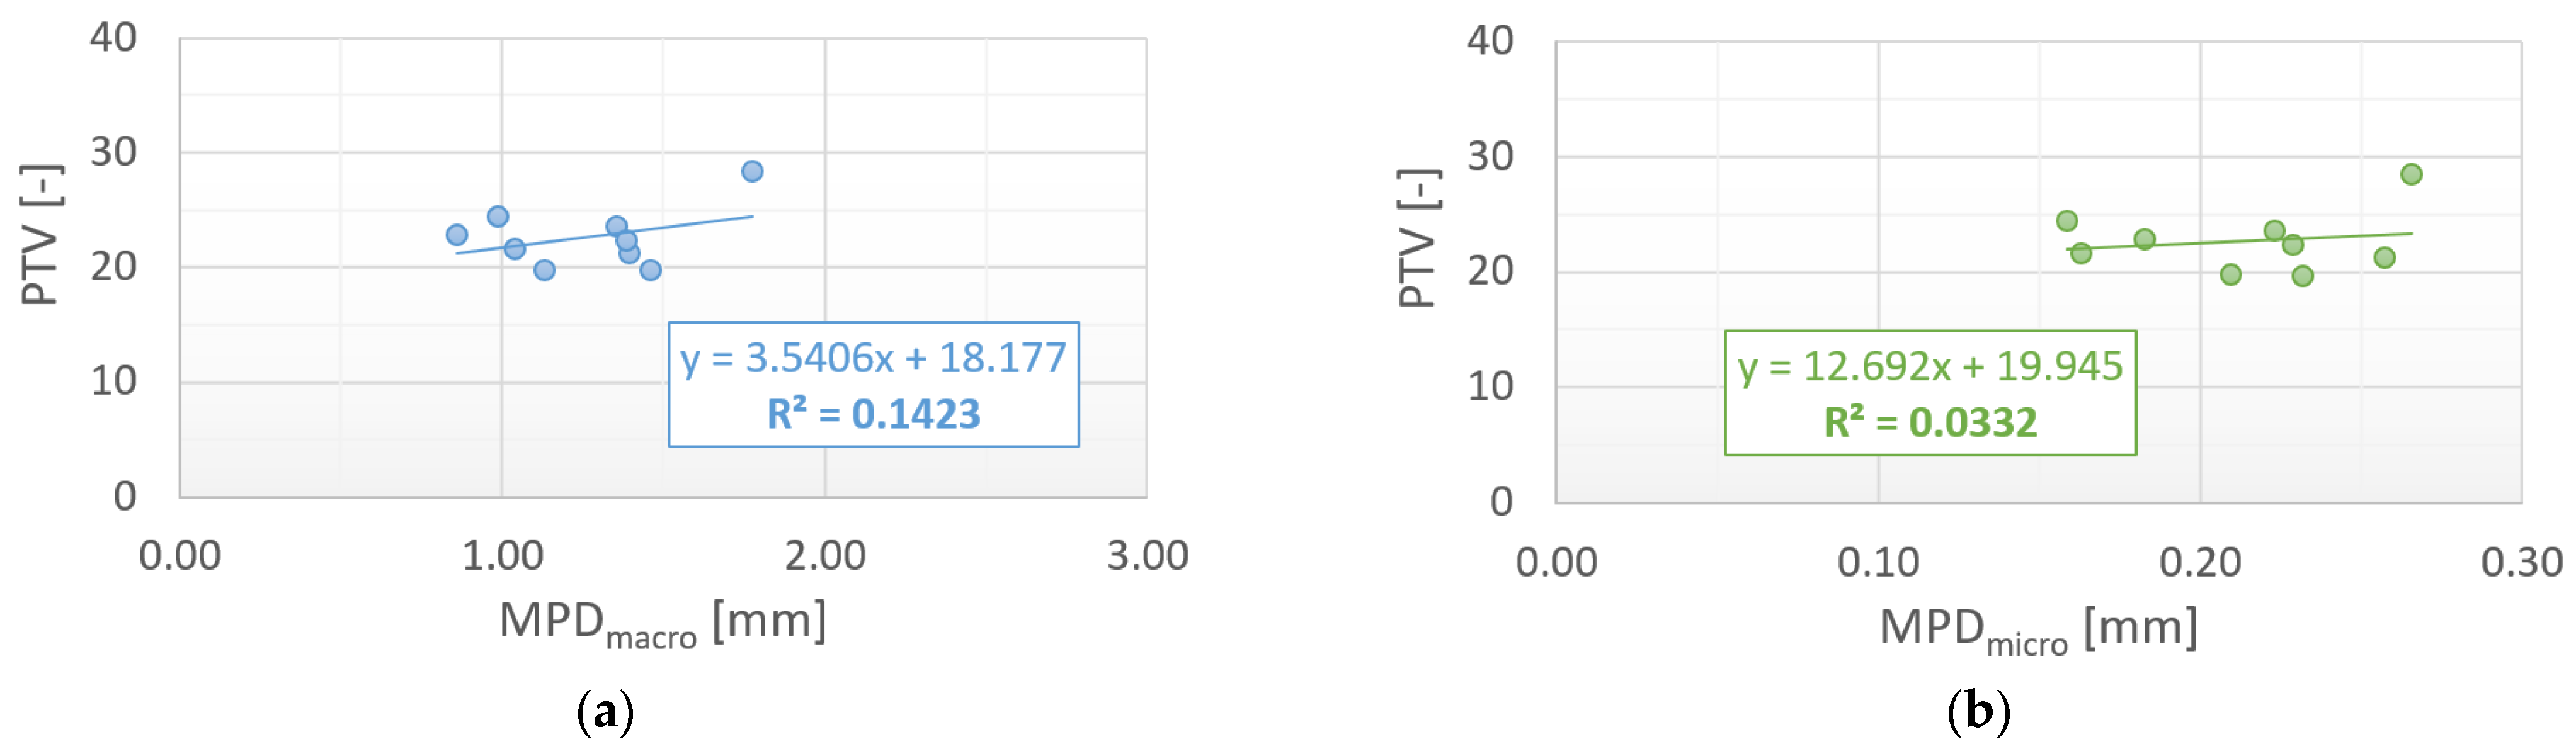
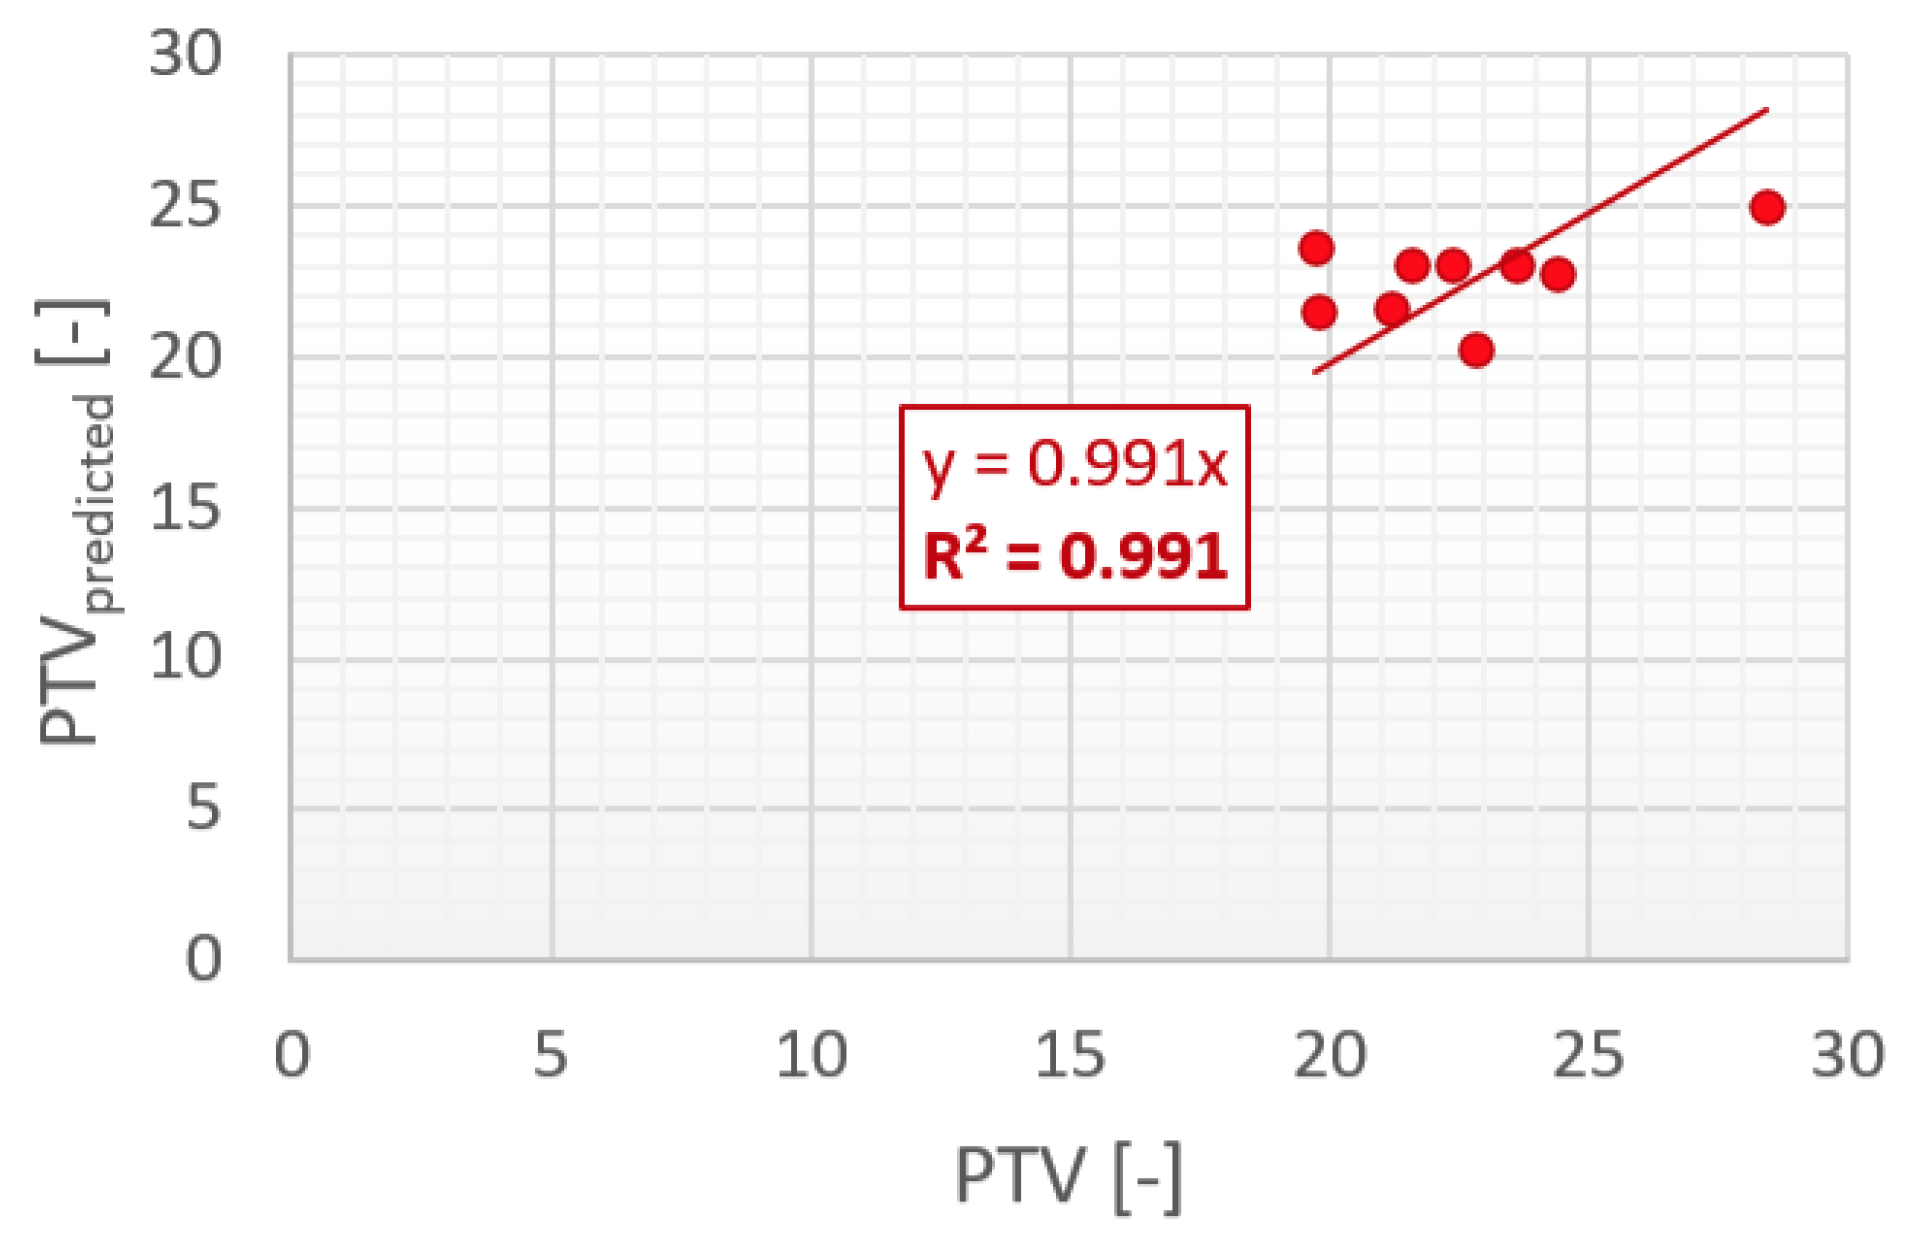
3.2.3. Relationship between Texture and Friction on Aggregate Specimens

The dependences between the MPD and PTV parameters were investigated to identify the rate of impact of the surface texture on the friction of the individual specimens. The relationships between the skid resistance and macrotexture on the individual aggregate specimens are shown in Figure 9a, and the correlation of the skid resistance and microtexture of the specimens are shown in Figure 9b.
As can be seen from Figure 9, the relationship between the skid resistance and single texture values was weak. The assumption that different types of aggregates would affect the skid resistance was not confirmed on the crafted specimens. Practically no relationship was found between the MPD values of the macrotexture or microtexture and the PTV on the aggregate specimens. This could have been due to the low differences between the texture and skid resistance levels in the manufactured aggregate specimens. As mentioned above, it was confirmed that high texture values do not necessarily mean a high friction value. Since both scales of texture contributed somehow to friction, the measured coefficient of friction was compared with the predicted one, which was calculated as a combination of the micro- and macrotexture MPD values based on a multiple regression analysis.
According to the regression analysis, the relationship between the predicted and measured PTV values was evaluated as strong (the coefficient of determination R2 = 0.991). However, this was caused due to the settings of the calculation, where the regression line was calculated through zero. However, as shown in Figure 10, the trend of the scattered graph did not prove such a significant tendentious relationship, and this relationship could not be considered as valid and relevant.
For further research, it is recommended to test more aggregate specimens with a higher range of differences in their texture values, to change the specimens’ production procedure, and the method of filtering the primary surface data.

3.3. Results Obtained on Specimens of Asphalt Mixture

In order to create testing surfaces with different microtextures and macrotextures, respectively, the asphalt specimens were made from different materials according to the description above in the article. A total of 12 different asphalt specimens were manufactured and tested. As with the previous reference surfaces, the specimens were subjected to 3D scanning using the SRS device and were subsequently tested by the British Pendulum Tester. These tests were performed under the same conditions on the new asphalt specimens, when the aggregate grains were covered with an asphalt binder, but also on washed specimens. The washing was carried out using perchloroethylene, which should reveal the microtexture of the individual aggregate grains on the specimen’s surface.
The texture scanning was performed by the SRS device on the area matching the track of the British Pendulum rubber slider. The microtexture was recorded by the SRS device only on some selected grains, because the structured light sensor provides only a small depth of field and its measurement is very time consuming. At the locations of the 3D scans, the pendulum test measurements were performed in two opposite directions. Measurements were performed on wet and dry surfaces as well. The resulting PTV values were determined as the arithmetic mean of these two values. The results obtained from both SRS and BPT device measurements are shown in Table 2.

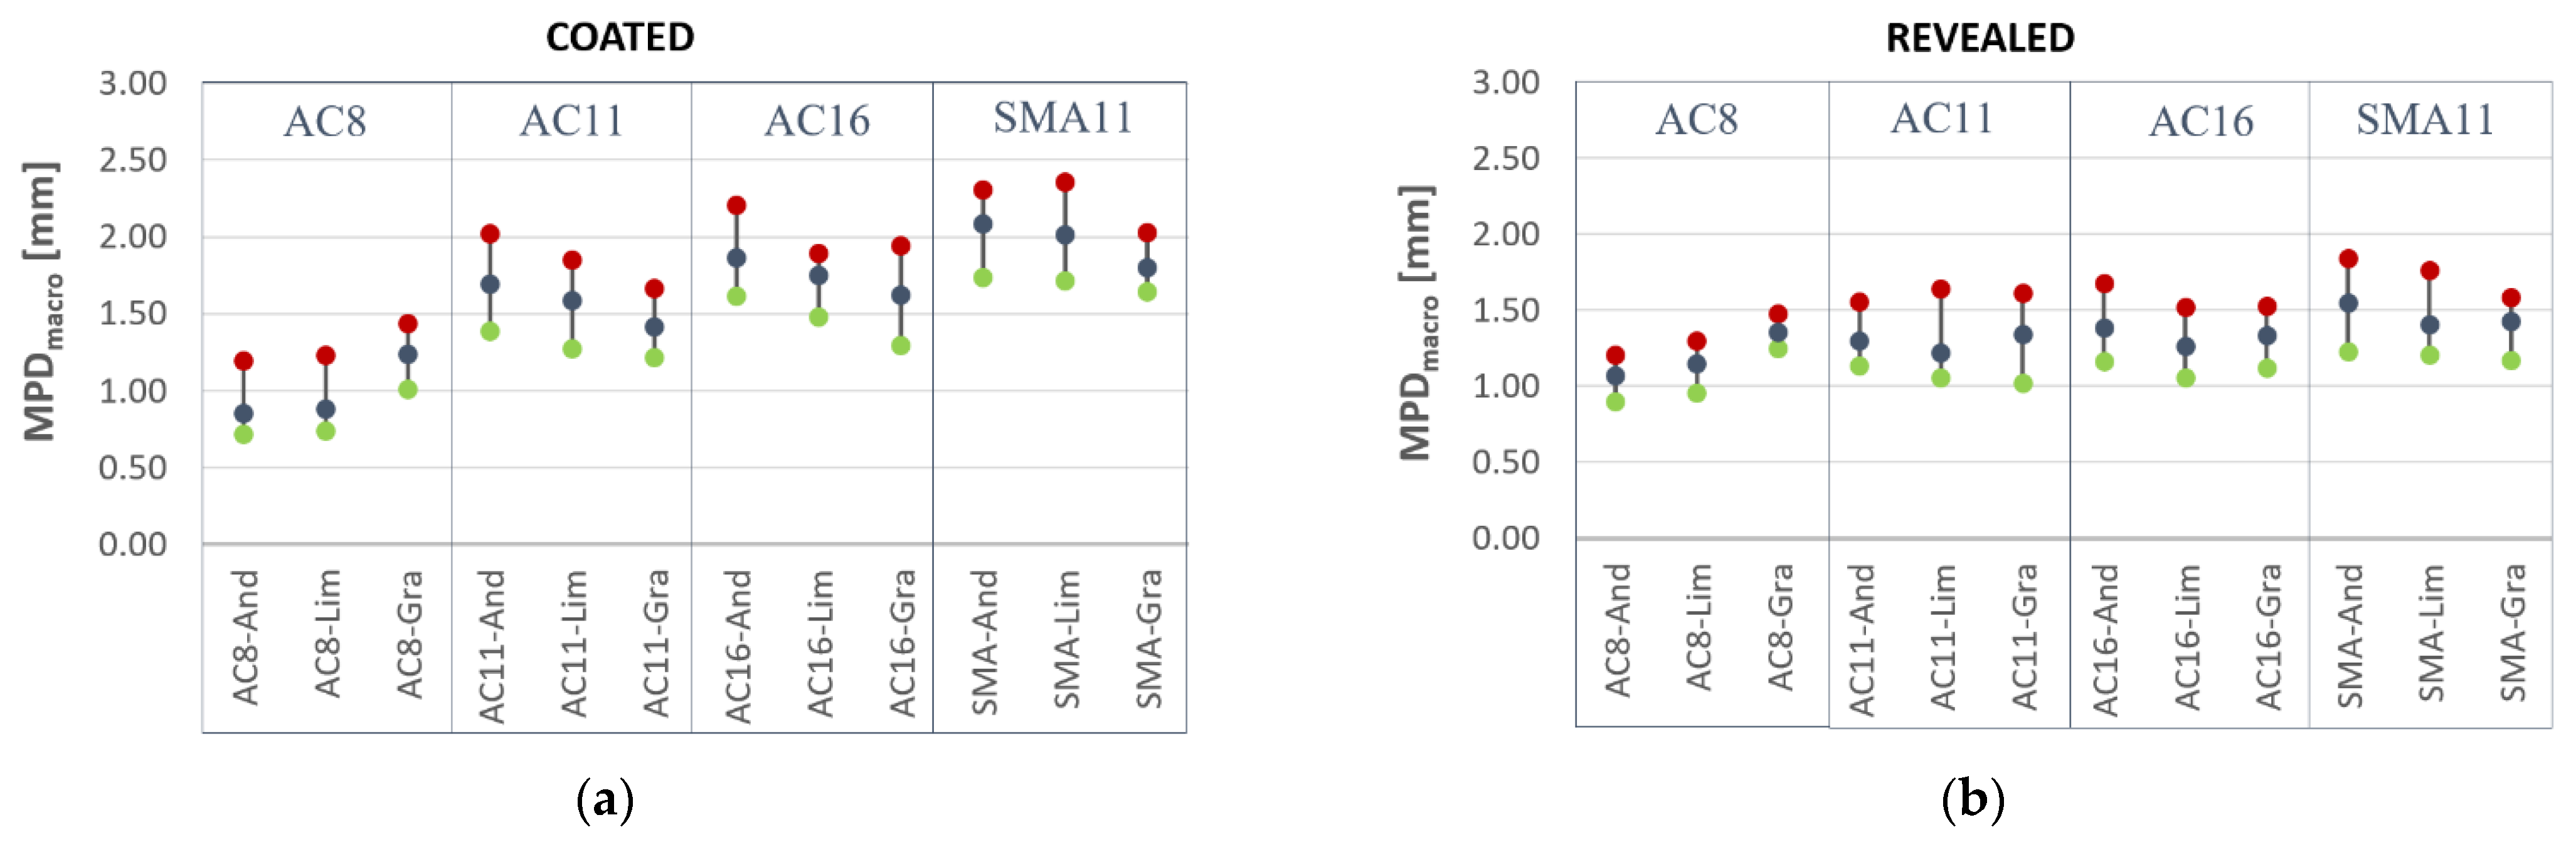
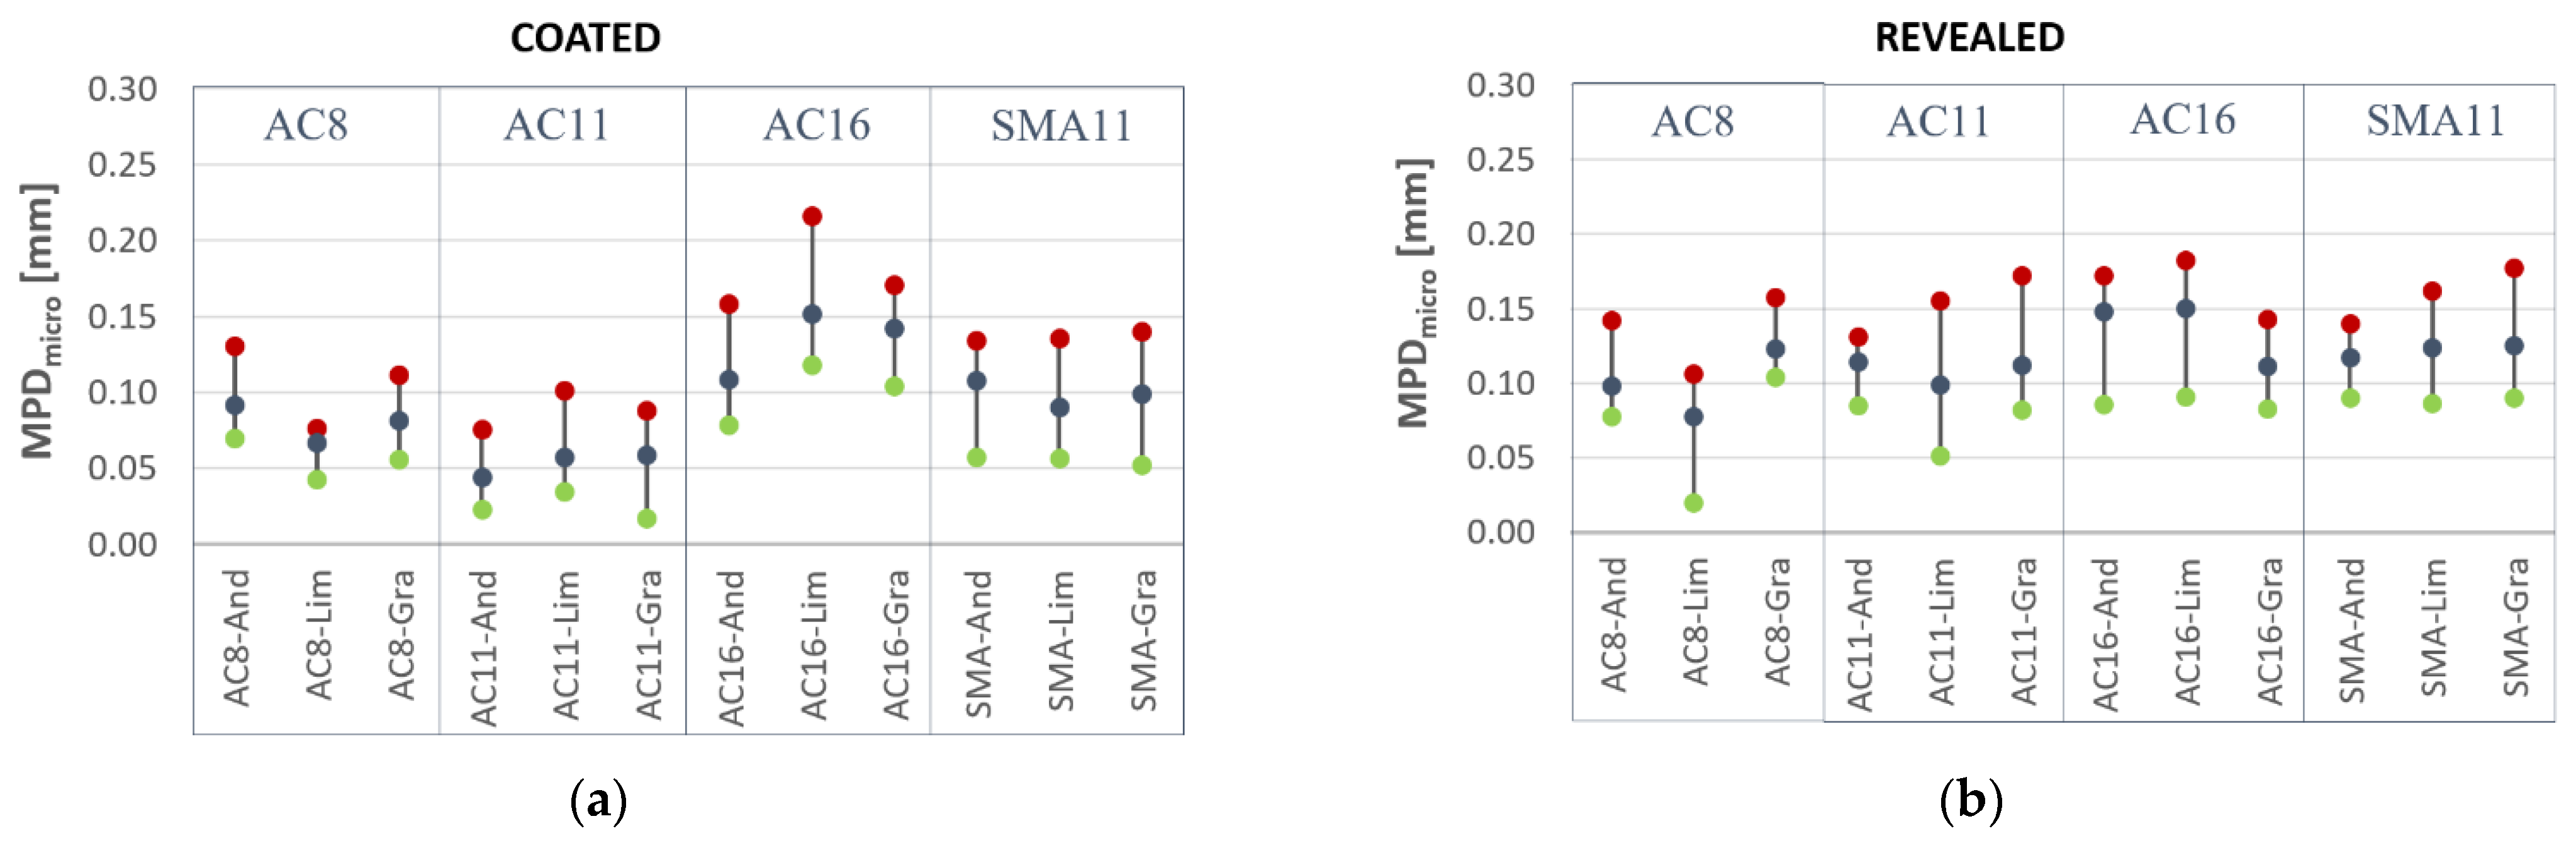
3.3.1. Texture Results on Asphalt Specimens

As mentioned, the individual specimens’ textures were evaluated for both micro- and macrotexture. Likewise, the MPD values were determined on the coated and washed specimens. For a better visualization of the macrotexture results, the MPD values for the coated specimens are shown in Figure 11a, and the values for the washed specimens are shown in Figure 11b.
According to the measurements on the coated surfaces of the specimens, the values of the macrotexture parameters corresponded, on average, to the maximum mixture grain size, as seen in Figure 11. For all types of aggregate used, the smallest MPD value was measured on the specimens marked as AC8. However, the highest MPD values were obtained on the SMA11 specimens, even though the AC16 specimens had a larger maximum grain size of used aggregate. This could have been because the SMA is an open-graded asphalt mixture containing only a small percentage of medium-sized aggregate particles, usually filling the voids between aggregates. This could affect the average profile height and then the measured MPD value.
The results on the very same specimens, but after removing the bitumen film, can be seen in Figure 11b. The same pattern according to the MPD value was recorded here, but the difference between the values of the individual specimens was less visible. The MPD value increased slightly only for the AC8 specimens, while the MPD values decreased for the other specimens. This may have been due to the fact that the film was only removed from the top of the surface of the individual aggregate grains, but not from the voids between the individual grains, causing a decrease in the MPD value.
Likewise, to show the microtexture results, the MPD values for the coated specimens are shown in Figure 12a, and the values for the washed specimens are shown in Figure 12b.
Before measuring the microtexture, there was an assumption that the MPD values would be low on the bitumen-coated aggregate surfaces, regardless of the type of aggregates used in the mixture. However, as shown in Figure 12, these assumptions were not fulfilled, and the microtexture values differed significantly. Another assumption was that, after wiping away the asphalt binder, the microtexture would be revealed, and the values would increase for all the aggregate types. It was expected that the lowest microtexture would be found on the specimens with used limestone, medium values would be on the specimens made of andesite, and the highest level of microtexture would be on those made of granodiorite. This assumption was only partially fulfilled, as the average level of microtexture increased after the aggregate grains were exposed. However, the dispersion of the measured values on the exposed aggregate grains was very high. The anticipated order of the aggregates according to the level of microtexture was proven only for specimens AC8 and AC11. However, considering the dispersion of the values obtained on the investigated surfaces of the different aggregates, the level of microtexture was approximately the same. The reason for this could be that the microtexture parameters were calculated from the data recorded by a sensor with a high resolution, but a low depth of field, and without the subsequent filtering of longer wavelengths. For that reason, irregularities with a longer wavelength, which is representative of the microtexture level, might have also influenced the results. Another reason could be the insufficient data and number of measured aggregate grains on the individual specimens.

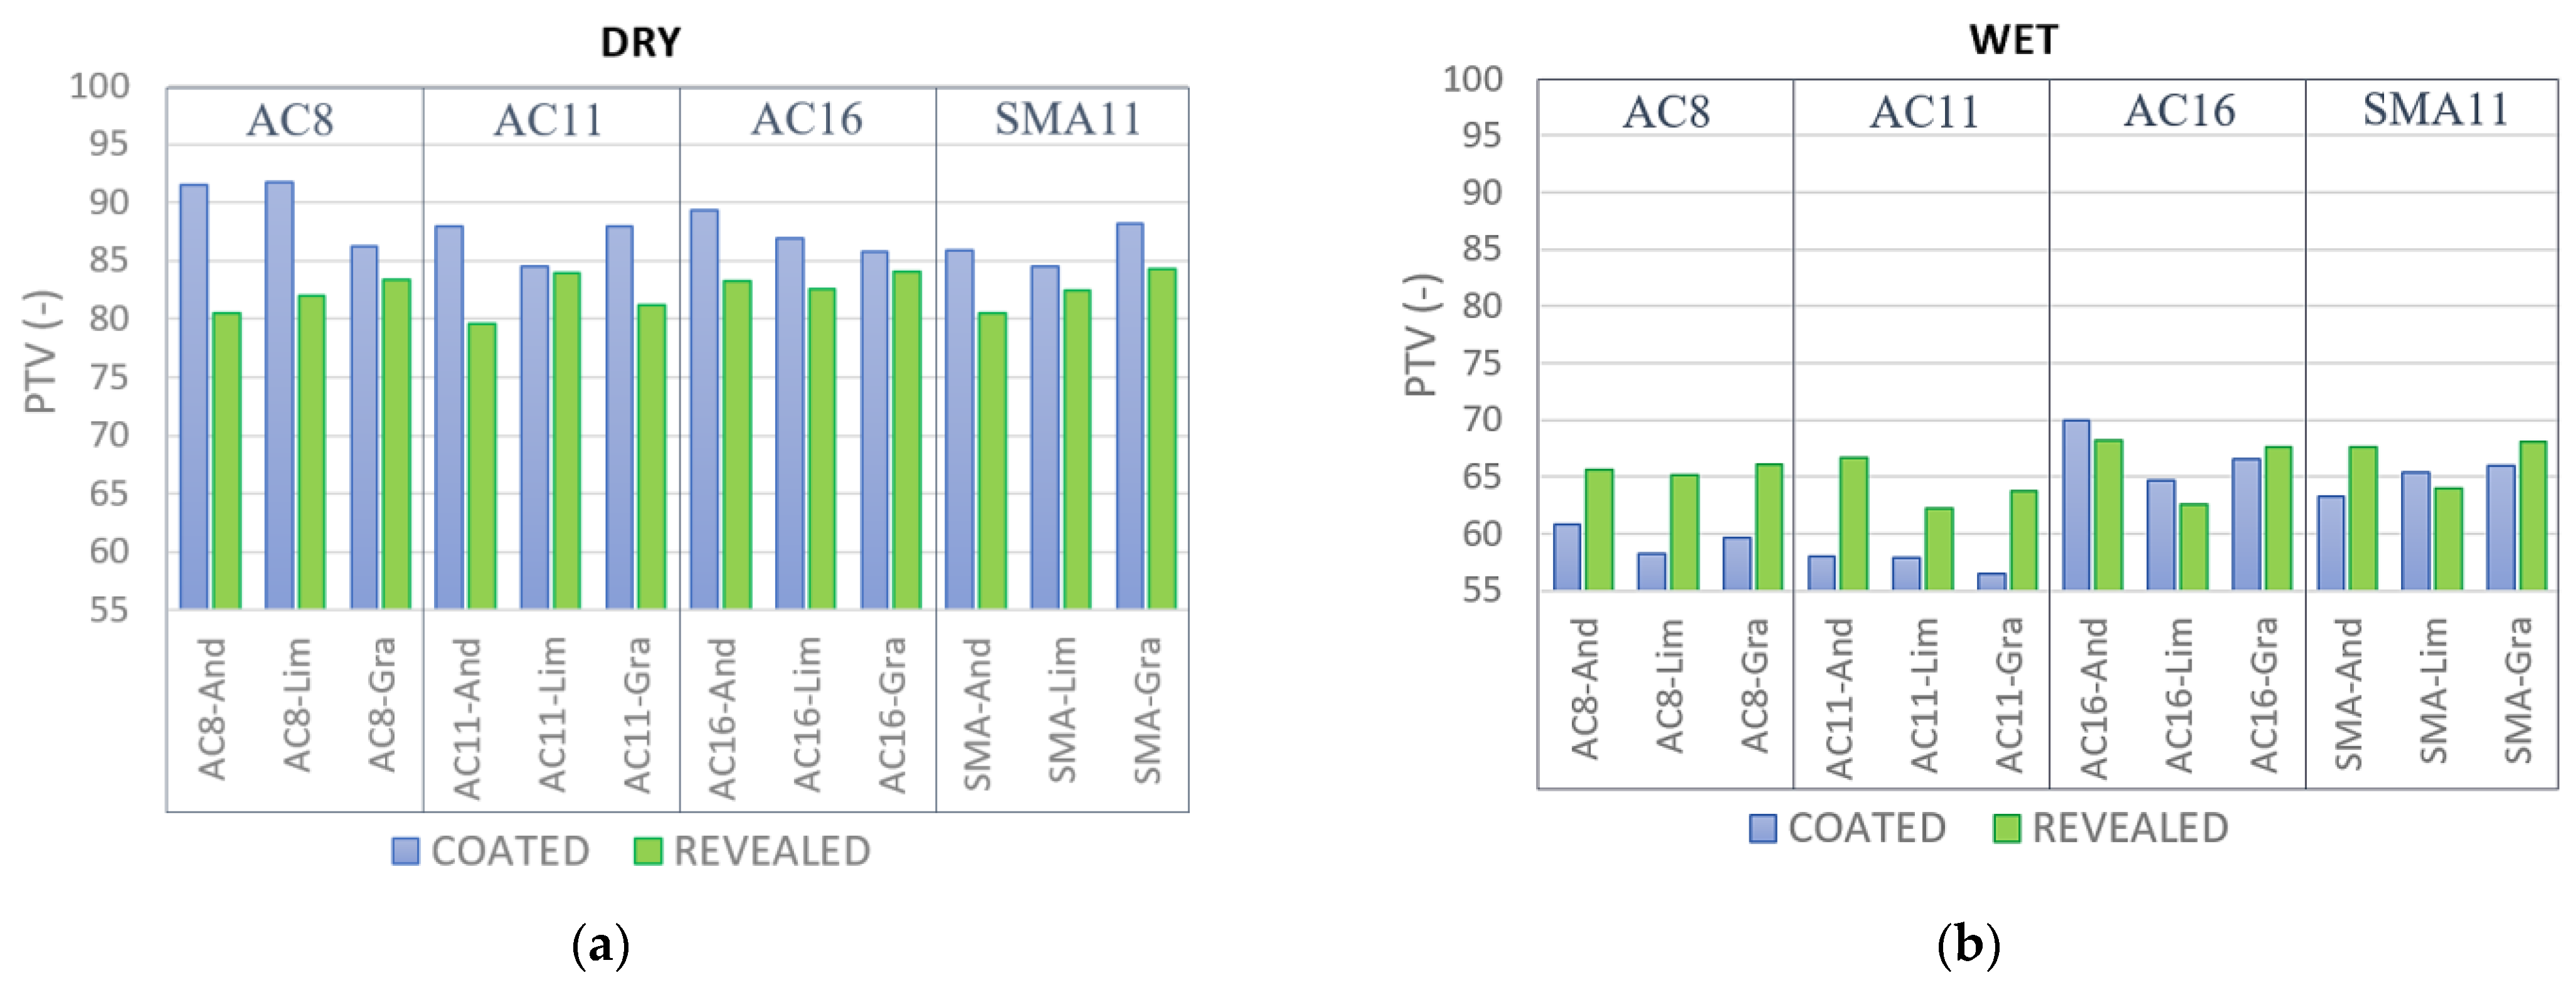
3.3.2. Results of Skid Resistance on Asphalt Specimens

As already mentioned, in addition to measuring the texture on all the asphalt specimens, the coefficient of friction was also measured using the pendulum tester, according to the principles mentioned earlier in the article. PTV values were also measured on the specimens covered with a bitumen film, but also after its removal. The results of the measured values from the dry pendulum test are shown in Figure 13a, and the results of the values from the wet pendulum test are shown in Figure 13b.
As expected, all the dry specimens coated with a bitumen film achieved higher PTV values than the exposed specimens. This was caused by adhesion, which is highest on smooth and dry surfaces, and also by the fact that the highest values were recorded on the specimen with the smallest grain size AC8, which had the most significant contact area when passing the pendulum rubber slider. On the other specimens, the trend was similar but somewhat lower. After removing the asphalt binder from the surface of the aggregate grains, the friction coefficients, measured on the dry surfaces, surprisingly decreased. This was caused by the exposure of the microtexture, which reduced the contact area, and thus the friction forces, while it was most pronounced on the AC8 mixture. Despite this, the values of the pendulum test were at a relatively high level for all the mixtures.
As anticipated, the friction coefficients were significantly higher on the dry surfaces (Figure 13a) than on the wet surfaces (Figure 13b) for all the specimens. The highest values on the coated wet specimens were achieved with the larger aggregate grains SMA11 and AC16, i.e., specimens with a higher macrotexture value. This may have been due to their better drainage properties, but also to a higher loss of kinetic energy when hitting larger aggregate grains. As expected, in contrast to the dry specimens, the PTV values obtained on the wet specimens increased after removing the asphalt binder in almost all cases. These values increased most significantly for the specimens with a smaller macrotexture. Despite the obtained results, it is still impossible to say without a doubt which type of aggregate had the most significant effect on friction.
In Figure 14, the ratio of the decrease and the increase in the PTV values after the asphalt binder removal from the surfaces are shown, respectively, thus revealing the microtextures.
On all the dry specimens, a decrease in the pendulum test values was noted after removing the bitumen film, as seen in Figure 14. As mentioned, this was due to reduced adhesion forces, which increase on smooth and dry surfaces. The most significant decrease was recorded on the mixtures of the AC8 and AC11 dry surfaces. These specimens with smaller aggregate grains in their mixtures had the biggest contact areas and achieved the highest friction coefficient values when tested on the surfaces covered with a bitumen film. Despite this decrease, their PTV values remained at a relatively high level.
The opposite result was obtained for the wet specimens. After the asphalt binder removal, the friction coefficient values increased the most on the mentioned specimens with smaller aggregate grains. The values also increased for two SMA11 mixtures and one AC16 mixture. This proved the microtexture’s crucial function, ensuring friction in wet conditions. The PTV values decreased on the wet specimens SMA11-Lim, AC16-And, and AC16-Lim, posing a question of if the friction coefficient value was more influenced by the macrotexture than the revealed microtexture of the specimens with larger grains.
The decrease rate in the PTV values after the application of a water film on the surfaces of the coated and washed specimens can be seen in Figure 15.
As already mentioned, there was a decrease in the value of the skid resistance after applying a water film on the surfaces of all types of specimens. It is clear from Figure 15 that there was a more significant reduction in the PTV value for the coated specimens. This more pronounced reduction was evident, especially on the specimens using a smaller aggregate grain in their mixture (AC8 and AC11). The maximum recorded decrease on the coated surfaces after wetting the surface was approximately 37%, while the decrease was only about 21% for the same specimens with an exposed microtexture. This indicated that a larger contact area and microtexture replaced the missing macrotexture. In mixtures with a larger grain of the used stone, a smaller decrease was recorded, indicating a greater influence of the macrotexture on the skid resistance. A lower decrease was also observed in the specimens made of andesite, and on the contrary, the highest decrease in the specimens made with limestone. Despite the relatively low differences, it is undeniable that the microtexture contributed to the wet skid resistance on the exposed surfaces, especially in mixtures with smaller aggregate grains.

3.3.3. Relationship between Texture and Friction on Asphalt Specimens

To determine the rate of the effect of the surface texture on the friction of the evaluated asphalt specimens, the correlations between the MPD and PTV parameters were investigated. These correlations were analyzed for the dry and wet surfaces, as well as for the macrotexture and microtexture obtained by filtering the primary surfaces. The correlations of the skid resistance and macrotexture on the dry specimens are shown in Figure 16a, and on the wet specimens in Figure 16b.
As can be seen from Figure 16, the correlations between the skid resistance and the macrotexture of the monitored specimens were very low. The strongest relationship between the MPDmacro and PTV value was on a dry surface covered with a bituminous film. As mentioned earlier in the article, this could have been due to the effect of adhesive forces and a larger contact surface in the mixtures with smaller aggregate grains. This meant that, in the case of a dry and coated surface, the skid resistance decreased as the aggregate grain increased. Likewise, no significant correlation was recorded, even on the wet surfaces. However, a slight upward trend can already be observed on the surface of the coated specimen. One of the reasons may be the better drainage of the surfaces with larger aggregate grains, i.e., a larger macrotexture.
No significant relationship between the variables was noted for any group of specimens. This may have been due to the insufficient range of the measured macrotextures in the spectrum of surfaces, but also due to the low differences between the pendulum test values measured on the different specimens. It is therefore recommended to expand this range of specimens in future experiments, as well as to perform testing in situ at road sections, also with the use of a dynamic friction tester.
The relationships between the skid resistance and microtextures of the individual asphalt specimens were also analyzed. The correlations between the MPDmicro and PTV values on the dry specimens are shown in Figure 17a, and on the wet specimens in Figure 17b.
As in the previous case, no significant correlation between the texture and friction was noted for the microtextures on all specimens. As shown in Figure 17, the correlation between the MPDmicro and PTV values was, in most cases, even lower than that for the macrotexture. For the dry surfaces, this was due to the fact that, despite the fact that there was a relatively wide range of microtexture levels, the obtained friction coefficient values were very similar. The microtexture parameter values on the exposed surfaces ranged from 80 to 150 µm, which corresponded to the irregularities range of the reference surfaces (sanding papers) with the highest obtained friction. Even with these microtexture values, the PTV values were measured without significant variances, which meant that the microtexture change in this range did not cause a substantial change in the PTV.
Significant relationships between the skid resistance and microtexture were not recorded on the wet surfaces either. A relatively high value of R2 was recorded for the coated wet specimens, but due to the high level of dispersion of the measured values, this seems to be a coincidence. Practically no relationship was found between the microtexture MPD values and the coefficient of friction on the asphalt specimens.

4. Conclusions

This article’s main goal was to analyze the effect of surface texture on skid resistance. The texture was recorded using a revolutionary device designed for creating 3D surface scans, the Static Road Scanner, developed at the University of Žilina. The British Pendulum test value represented the skid resistance. Measurements were made on three different groups of surfaces. The MPD and PTV parameters measured on twelve different surfaces were used to evaluate the individual relationships between the texture and skid resistance. From the obtained results, it can be concluded that:
  • The SRS device designed at the University of Žilina is reliable and suitable for pavement texture evaluation. The measurements demonstrated this on reference surfaces with a known surface roughness;
  • The measurements on the reference surfaces showed that increasing microtexture values do not only indicate increasing skid resistance values. The highest pendulum test values were achieved on surfaces with grain sizes ranging from 80 to 125 µm. After the grain size exceeded 150 µm, a decreasing trend of skid resistance was recorded. In the part of the microtexture level up to 125 µm, it was possible to find a relatively strong correlation between the microtexture and friction;
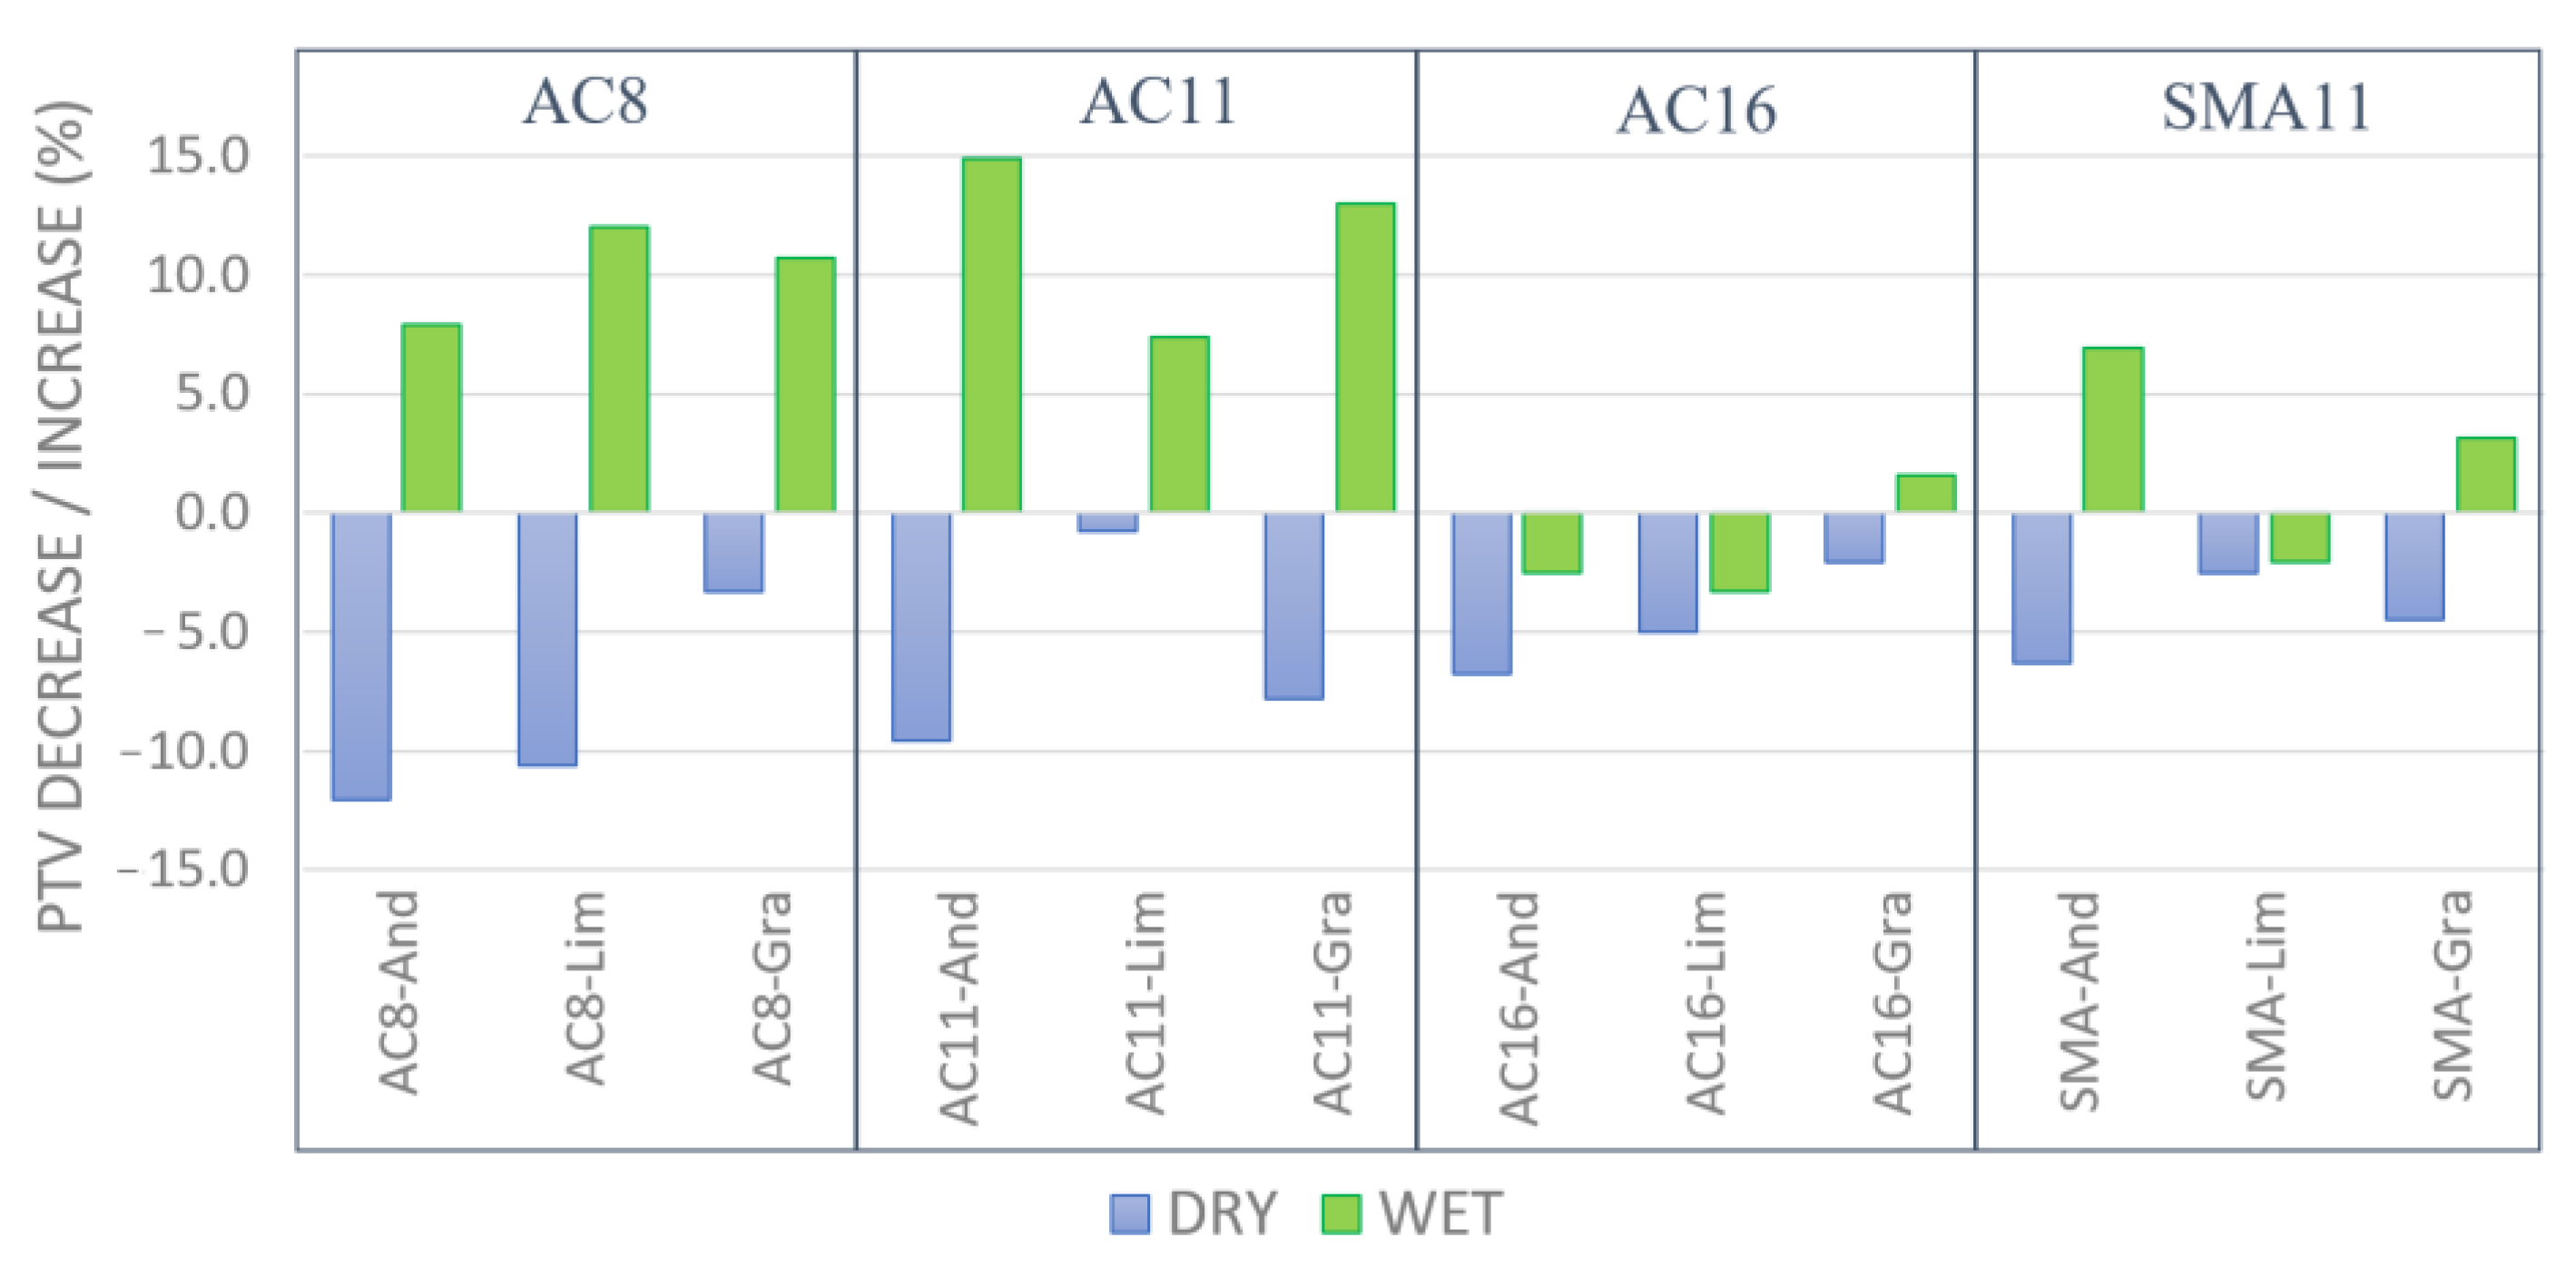
  • The measurements on asphalt mixture specimens with various values of micro- and macrotexture confirmed some expected results. These included, for example, the level of the macrotexture being influenced by the size of the maximum aggregate grain used, a decrease in the skid resistance value on wet surfaces, and an increase on wet surfaces without a bitumen film. Despite these expected results, some did not turn out as expected. One of them was that the evaluation of the microtexture did not confirm the expected friction levels for different types of aggregates. Although an effort was made to create surfaces with a wide range of micro- and macrotexture values, this range proved insufficient. This could also have caused the relationships between the texture and skid resistance on the asphalt specimens to be shallow for the investigated samples. For this reason, it is recommended to expand this range in further research to ensure sufficiently different levels of texture;
  • It was shown that high texture values do not necessarily mean high skid resistance. These results indicate that it will not be possible to predict the skid resistance of the surface of individual materials based only on simple texture parameters. Therefore, the following research must focus on evaluating the 3D area and volume characteristics in a broader range of surfaces with different micro- and macrotextures. In terms of asphalt mixture design, the optimum ratio of the size combination of micro- and macrotexture., i.e., the type and size of used aggregates, is necessary for optimal road pavement surface skid resistance.

Author Contributions

Conceptualization, M.K. and M.B.; methodology, M.K. and M.B.; software, M.B. and P.P.; validation, M.K., M.D. and D.J.; formal analysis, M.K.; investigation, M.B. and P.P.; resources, M.K. and M.B.; data curation, M.B.; writing—original draft preparation, M.B.; writing—review and editing, M.K.; visualization, M.B. and P.P.; supervision, M.K. and M.D.; project administration, D.J.; funding acquisition, M.K., M.D. and D.J. All authors have read and agreed to the published version of the manuscript.

Funding

This research was funded by The Scientific Grant Agency: VEGA 1/0337/22.

Institutional Review Board Statement

Not applicable.

Informed Consent Statement

Not applicable.

Data Availability Statement

Not applicable.

Acknowledgments

The paper is a result of the research supported by the research project VEGA 1/0337/22 “Analysis of the influence of road surface texture on skid resistance, driving safety and the potential of particulate matter resuspension”.

Conflicts of Interest

The authors declare no conflict of interest.

References

  1. Pranjić, I.; Deluka-Tibljaš, A. Pavement Texture–Friction Relationship Establishment via Image Analysis Methods. Materials 2022, 15, 846. [Google Scholar] [CrossRef] [PubMed]
  2. Chen, B.; Xiong, C.; Li, W.; He, J.; Zhang, X. Assessing Surface Texture Features of Asphalt Pavement Based on Three-Dimensional Laser Scanning Technology. Buildings 2021, 11, 623. [Google Scholar] [CrossRef]
  3. Hu, Y.; Sun, Z.; Han, Y.; Li, W.; Pei, L. Evaluate Pavement Skid Resistance Performance Based on Bayesian-LightGBM Using 3D Surface Macrotexture Data. Materials 2022, 15, 5275. [Google Scholar] [CrossRef] [PubMed]
  4. Davies, R.; Cenek, P.; Henderson, R. The Effect of Skid Resistance and Texture on Crash Risk. In Proceedings of the Surface Friction Roads and Runways, Christchurch, New Zealand, 1–4 May 2005. [Google Scholar]
  5. Fwa, T.F. Skid Resistance Determination for Pavement Management and Wet-Weather Road Safety. Int. J. Transp. Sci. Technol. 2017, 6, 217–227. [Google Scholar] [CrossRef]
  6. Sandberg, U. Influence of Road Surface Texture on Traffic Characteristics Related to Environment, Economy and Safety: A State-of-the-Art Study Regarding Measures and Measuring Methods; Swedish National Road and Transport Research Institute (VTI): Linköping, Sweden, 1998. [Google Scholar]
  7. Mikolaj, J.; Remek, L. Material Structural and Economical Aspects of Life Cycle Extension of Asphalt Concrete Surfacing. In Pavement and Asset Management; CRC Press: Boca Raton, FL, USA, 2019; pp. 685–692. [Google Scholar]
  8. Georgiou, P.; Loizos, A. A Laboratory Compaction Approach to Characterize Asphalt Pavement Surface Friction Performance. Wear 2014, 311, 114–122. [Google Scholar] [CrossRef]
  9. Jandacka, D.; Durcanska, D.; Cibula, R. Concentration and Inorganic Elemental Analysis of Particulate Matter in a Road Tunnel Environment (Žilina, Slovakia): Contribution of Non-Exhaust Sources. Front. Environ. Sci. 2022, 10, 952577. [Google Scholar] [CrossRef]
  10. Kocianova, A.; Drliciak, M.; Pitlova, E. Influence of Roundabout Capacity Enhancement on Emission Production. IOP Conf. Ser. Mater. Sci. Eng. 2017, 236, 012035. [Google Scholar] [CrossRef]
  11. Jandacka, D.; Kovalova, D.; Durcanska, D.; Decky, M. Chemical Composition, Morphology, and Distribution of Particulate Matter Produced by Road Pavement Abrasion Using Different Types of Aggregates and Asphalt Binder. Cogent Eng. 2021, 8, 1884325. [Google Scholar] [CrossRef]
  12. Jandačka, D.; Ďurčanská, D. Particulate Matter Assessment in the Air Based on the Heavy Metals Presence. Civ. Environ. Eng. 2014, 10, 26–39. [Google Scholar] [CrossRef] [Green Version]
  13. Margorínová, M.; Trojanová, M.; Decký, M.; Remišová, E. Noise Costs from Road Transport. Civ. Environ. Eng. 2018, 14, 12–20. [Google Scholar] [CrossRef] [Green Version]
  14. Trojanová, M.; Hodásová, K.; Kleštincová, M. Contextual Design of Road Traffic Noise Reducing Devices. Civ. Environ. Eng. 2022, 18, 515–522. [Google Scholar] [CrossRef]
  15. Remisova, E. The influence of the asphalt mixture composition on the pavement surface texture and noise emissions production. Air Pollut. Clim. Change 2014, 2, 583–590. [Google Scholar] [CrossRef]
  16. Pavement Management Guide, 2nd ed.; AASHTO—American Association of State Highway and Transportation Officials: Washington, DC, USA, 2012.
  17. Saliminejad, S.; Gharaibeh, N.G. Impact of Error in Pavement Condition Data on the Output of Network-Level Pavement Management Systems. Transp. Res. Rec. J. Transp. Res. Board 2013, 2366, 110–119. [Google Scholar] [CrossRef]
  18. Mikolaj, J.; Remek, Ľ.; Kozel, M. Optimization of Bituminous Road Surfacing Rehabilitations Based on Optimization of Road Asset Value. Appl. Sci. 2022, 12, 10466. [Google Scholar] [CrossRef]
  19. Juraszek, J.; Gwozdz-Lason, M.; Gago, F.; Bulko, R. FBG Monitoring of a Communication Paths and Roadways with a Geosynthetic Systems on Mining Heaps. Civ. Environ. Eng. 2023, 19, 414–425. [Google Scholar] [CrossRef]
  20. Petru, J.; Krivda, V. The Process of Setting the Parameters for Ensuring Passage of Oversized Cargos. Balt. J. Road Bridge Eng. 2019, 14, 425–442. [Google Scholar] [CrossRef] [Green Version]
  21. Guo, F.; Pei, J.; Huang, G.; Hu, Z.; Niu, Z.; Cannone Falchetto, A. Evolution of Tire-Pavement Friction with the Regular Surface Macro-Texture Characteristics and Environmental Factors Using Three-Dimensional (3D) Printing Technology. J. Clean. Prod. 2023, 382, 135293. [Google Scholar] [CrossRef]
  22. Rasol, M.; Schmidt, F.; Ientile, S. FriC-PM: Machine Learning-Based Road Surface Friction Coefficient Predictive Model Using Intelligent Sensor Data. Constr. Build. Mater. 2023, 370, 130567. [Google Scholar] [CrossRef]
  23. Henry, J.J. Evaluation of Pavement Friction Characteristics; National Academy Press: Washington, DC, USA, 2000. [Google Scholar]
  24. Ergun, M.; Iyinam, S.; Iyinam, A.F. Prediction of Road Surface Friction Coefficient Using Only Macro- and Microtexture Measurements. J. Transp. Eng. 2005, 131, 311–319. [Google Scholar] [CrossRef]
  25. Hall, J.W.; Smith, K.L.; Titus-Glover, L.; Wambold, J.C.; Yager, T.J.; Rado, Z. Guide for Pavement Friction; The National Academies Press: Washington, DC, USA, 2009. [Google Scholar]
  26. Noyce, D.A.; Yambó, J.M.; Kim, G.-H. Incorporating Road Safety into Pavement Management: Maximizing Asphalt Pavement Surface Friction for Road Safety Improvements; Draft Literature Review and State Surveys, Midwest Regional University Transportation Center (UMTRI): Madison, WI, USA, 2005. [Google Scholar]
  27. Deng, Q.; Zhan, Y.; Liu, C.; Qiu, Y.; Zhang, A. Multiscale Power Spectrum Analysis of 3D Surface Texture for Prediction of Asphalt Pavement Friction. Constr. Build. Mater. 2021, 293, 123506. [Google Scholar] [CrossRef]
  28. Khasawneh, M.A.; Alsheyab, M.A. Effect of Nominal Maximum Aggregate Size and Aggregate Gradation on the Surface Frictional Properties of Hot Mix Asphalt Mixtures. Constr. Build. Mater. 2020, 244, 118355. [Google Scholar] [CrossRef]
  29. Dahir, S.H. A Review of Aggregate Selection Criteria for Improved Wear Resistance and Skid Resistance of Bituminous Surfaces. ASTM J. Test. Eval. 1979, 7. [Google Scholar] [CrossRef]
  30. Fwa, T.F.; Ong, G.P. Wet-Pavement Hydroplaning Risk and Skid Resistance: Analysis. J. Transp. Eng. 2008, 134, 182–190. [Google Scholar] [CrossRef]
  31. Villani, M.M.; Artamendi, I.; Kane, M.; Scarpas, A. Contribution of Hysteresis Component of Tire Rubber Friction on Stone Surfaces. Transp. Res. Rec. J. Transp. Res. Board 2011, 2227, 153–162. [Google Scholar] [CrossRef]
  32. Chen, J.; Huang, X.; Zheng, B.; Zhao, R.; Liu, X.; Cao, Q.; Zhu, S. Real-Time Identification System of Asphalt Pavement Texture Based on the Close-Range Photogrammetry. Constr. Build. Mater. 2019, 226, 910–919. [Google Scholar] [CrossRef]
  33. Cui, X.; Zhou, X.; Lou, J.; Zhang, J.; Ran, M. Measurement Method of Asphalt Pavement Mean Texture Depth Based on Multi-Line Laser and Binocular Vision. Int. J. Pavement Eng. 2017, 18, 459–471. [Google Scholar] [CrossRef]
  34. Du, Y.; Weng, Z.; Li, F.; Ablat, G.; Wu, D.; Liu, C. A Novel Approach for Pavement Texture Characterisation Using 2D-Wavelet Decomposition. Int. J. Pavement Eng. 2022, 23, 1851–1866. [Google Scholar] [CrossRef]
  35. Kogbara, R.B.; Masad, E.A.; Woodward, D.; Millar, P. Relating Surface Texture Parameters from Close Range Photogrammetry to Grip-Tester Pavement Friction Measurements. Constr. Build. Mater. 2018, 166, 227–240. [Google Scholar] [CrossRef]
  36. Song, W. Correlation between Morphology Parameters and Skid Resistance of Asphalt Pavement. Transp. Saf. Environ. 2022, 4, tdac002. [Google Scholar] [CrossRef]
  37. Kane, M.; Artamendi, I.; Scarpas, T. Long-Term Skid Resistance of Asphalt Surfacings: Correlation between Wehner–Schulze Friction Values and the Mineralogical Composition of the Aggregates. Wear 2013, 303, 235–243. [Google Scholar] [CrossRef]
  38. Do, M.-T.; Tang, Z.; Kane, M.; de Larrard, F. Evolution of Road-Surface Skid-Resistance and Texture Due to Polishing. Wear 2009, 266, 574–577. [Google Scholar] [CrossRef]
  39. Ahammed, M.A.; Tighe, S.L. Pavement Surface Mixture, Texture, and Skid Resistance: A Factorial Analysis. In Airfield and Highway Pavements: Efficient Pavements Supporting Transportation’s Future, Proceedings of the 2008 Airfield and Highway Pavements Conference, Bellevue, WA, USA, 15–18 October 2008; American Society of Civil Engineers: Reston, VA, USA, 2018; pp. 370–384. [Google Scholar]
  40. STN EN 13036-4; Road and Airfield Surface Characteristics.Test Methods. Part 4: Method for Measurement of Slip/Skid Re-sistance of a Surface: The Pendulum Test. ISO: Geneva, Switzerland, 2011.
  41. STN EN ISO 4287; Geometrical Product Specifications (GPS). Surface Texture: Profile Method—Terms, Definitions and Surface Texture Parameters. ISO: Geneva, Switzerland, 1999.
  42. STN EN ISO 13473-1; Characterization of Pavement Texture by Use of Surface Profiles—Part 1: Determination of Mean Profile Depth. ISO: Geneva, Switzerland, 2021.
  43. ISO 16610-61:2015; Geometrical Product Specification (GPS)—Filtration—Part 61: Linear Areal Filters—Gaussian Filters. ISO: Geneva, Switzerland, 2015.
Figure 1. British Pendulum Tester (on the left) and Static Road Scanner (on the right).
Sustainability 15 12195 g001
Figure 2. Testing surfaces. (a) Reference surfaces; (b) specimens of aggregate; and (c) specimens of asphalt mixture.
Sustainability 15 12195 g002
Figure 3. Comparison of measured values; (a) grain size vs. arithmetical mean deviation (Ra); and (b) grain size vs. Mean Profile Depth (MPD).
Sustainability 15 12195 g003
Figure 4. Pendulum Test Value vs. grain size (a); and Mean Profile Depth (b).
Sustainability 15 12195 g004
Figure 5. The relationship of variables measured on sandpapers considering a limited size of surface irregularities; (a) PTV vs. grain size; and (b) PTV vs. MPD.
Sustainability 15 12195 g005
Figure 6. Examples of selected aggregate specimens and their 3D models.
Sustainability 15 12195 g006
Figure 7. Results of MPD value for individual aggregate specimens on surface macrotexture (a) and surface microtexture (b).
Sustainability 15 12195 g007
Figure 8. Pendulum test results for individual aggregate specimens.
Sustainability 15 12195 g008
Figure 9. Relationship of PTV vs. MPD values of (a) surface macrotexture; and (b) of surface microtexture.
Sustainability 15 12195 g009
Figure 10. Relationship between predicted and measured PTV values.
Sustainability 15 12195 g010
Figure 11. Ranges of macrotexture MPD values; (a) on surfaces with asphalt binder on the aggregate grains; and (b) on surfaces without a bitumen film.
Sustainability 15 12195 g011
Figure 12. Ranges of microtexture MPD values; (a) on surfaces with asphalt binder on the aggregate grains; and (b) on surfaces without a bitumen film.
Sustainability 15 12195 g012
Figure 13. The results of the measured values by the pendulum test; (a) on dry surfaces; and (b) on wet surfaces.
Sustainability 15 12195 g013
Figure 14. The increase or the decrease in coefficient of friction values after the asphalt binder removal on dry and wet surfaces.
Sustainability 15 12195 g014
Figure 15. The decrease of friction coefficient after surface wetting on both coated and revealed specimens.
Sustainability 15 12195 g015
Figure 16. The relationship—macrotexture MPD values vs. coefficient of friction; (a) on dry surfaces; and (b) on wet surfaces.
Sustainability 15 12195 g016
Figure 17. The relationship—microtexture MPD values vs. the Pendulum Test Values; (a) on dry surfaces; and (b) on wet surfaces.
Sustainability 15 12195 g017
Table 1. Results from measurements with the SRS device and the pendulum device.
No.SpecimenMPDmacroMPDmicroPTVWET
(mm)(mm)(-)
1.Dolomitic limestone1.4580.23219.70
2.Dolomitic limestone1.0380.16321.60
3.Dolomitic limestone1.3950.25721.20
4.Siliceous limestone0.8590.18322.80
5.Dolomites1.1300.21019.80
6.Andesite0.9850.15924.40
7.Andesite1.7740.26528.40
8.Andesite1.3550.22323.60
9.Granodiorite1.3840.22922.38
Table 2. Results from measurements with the SRS device and the pendulum tester.
MixtureCOATEDREVEALED
MPDmacroMPDmicroPTVDRYPTVWETMPDmacroMPDmicroPTVDRYPTVWET
(mm)(mm)(-)(-)(mm)(mm)(-)(-)
AC8-And0.850.09292611.700.0988166
AC8-Lim0.880.06692581.150.0778265
AC8-Gra1.230.07586601.350.1238366
AC11-And1.690.04488581.290.1148067
AC11-Lim1.580.05985581.220.0998462
AC11-Gra1.410.05588561.340.1128164
AC16-And1.860.10989701.380.1488368
AC16-Lim1.750.15587651.260.1508363
AC16-Gra1.620.14286671.330.1118468
SMA11-And2.800.10786631.550.1178168
SMA11-Lim2.100.09085651.410.1238264
SMA11-Gra1.800.09988661.420.1258468
Disclaimer/Publisher’s Note: The statements, opinions and data contained in all publications are solely those of the individual author(s) and contributor(s) and not of MDPI and/or the editor(s). MDPI and/or the editor(s) disclaim responsibility for any injury to people or property resulting from any ideas, methods, instructions or products referred to in the content.

