Article

Long-Term Dynamics of Ecosystem Services and Their Influencing Factors in Ecologically Fragile Southwest China

1
Chongqing Jinfo Mountain Karst Ecosystem National Observation and Research Station, School of Geographical Sciences, Southwest University, Chongqing 400715, China
2
Chongqing Engineering Research Center for Remote Sensing Big Data Application, School of Geographical Sciences, Southwest University, Chongqing 400715, China
3
School of Ecological and Environmental Sciences, East China Normal University, Shanghai 200241, China
4
The River Affairs Center of Chongqing, Chongqing 401147, China
*
Authors to whom correspondence should be addressed.
Sustainability 2023, 15(16), 12331; https://doi.org/10.3390/su151612331
Submission received: 2 July 2023 / Revised: 28 July 2023 / Accepted: 10 August 2023 / Published: 13 August 2023

Abstract

:
Southwest China has one of the largest karst landscapes on the Earth and an ecologically fragile environment. A better understanding of how ecosystem services function in karst areas helps ecological preservation and policy implementation. However, little effort has been made to evaluate the long-term dynamics of ecosystem services across Southwest China. This study systematically analyzed the spatio-temporal patterns and the values of three typical ecosystem service functions, including water conservation, carbon sequestration, and soil conservation, as well as the effects of precipitation and land use changes between 2000 and 2020. The results showed that water conservation exhibited an overall decrease from southeast to northwest, while soil conservation showed the opposite trend. The regions with an increasing trend in carbon sequestration were mainly distributed in Guizhou, Guangxi, and Sichuan. Compared to the year 2000, the percentage of water conservation and soil conservation decreased by 4.50% and 0.76%, respectively. However, carbon sequestration increased by 94.35%. The total value of ecosystem services in Southwest China showed a 90.00% increase in 2020 relative to 2000. Water conservation and carbon sequestration had a much closer correlation with precipitation. The impact of soil conservation was more significantly influenced by land use changes.

1. Introduction

Ecosystem functions provided for humans are called ecosystem services, and they include water conservation, carbon sequestration, and soil conservation, which are essential for human survival and development [1,2]. The entire ecosystem value is estimated to be about tens of trillions of yuan per year, far exceeding traditional economic values [3]. However, increasing conflicts between economic development and environmental protection, as well as population growth and urbanization, are placing ecosystems under immense pressure [2,4]. Therefore, it is imperative to evaluate the functions and values of ecosystem services in order to quantify the impact of ecological conditions on human habitats and societal benefits, as well as to implement appropriate strategies for ecosystem management and ecological policies [5].
The karst landform, which covers approximately 15% of the Earth’s surface, is predominantly utilized for agricultural and rural activities [6,7]. Southwest China is known as China’s ecological barrier, owing to its rich biodiversity and vital ecosystem services [8,9]. Southwest China also owns the largest continuous distribution of karst areas in the country. However, the region has experienced significant ecological degradation as a result of a combination of natural and anthropogenic disturbances which directly threaten the health of ecosystem service functions [8]. Research on ecosystem service functions in this region helps to enhance the sustainability of karst landscapes [10,11,12] and ensure the sustainable development of regional ecosystem services [13,14]. However, the majority of previous studies focused on non-karst regions or karst areas. Even though a few studies have focused on both areas, they were limited to a specific province [13] or city and county level [15]. The overall characteristics of ecosystem service functions in Southwest China remain unclear [16]. Therefore, further research is needed to expand the scope and deepen our comprehension of ecosystem service functions in Southwest China.
Various international service assessment systems were proposed to evaluate ecosystem service functions and values, such as the Millennium Ecosystem Assessment (MA) [17], the Economics of Ecosystems and Biodiversity (TEEB) [18], and the Intergovernmental Science-Policy Platform on Biodiversity and Ecosystem Services (IPBES) [19]. On 12 May 2021, China’s Ministry of Ecology and Environment (MOE) officially released the “Technical Specification for National Ecological Condition Survey and Assessment—Ecosystem Service Function Assessment”, which provides detailed regulations on the technical process, index system, and technical methods for ecosystem service function assessment in China. Water conservation, carbon sequestration, and soil conservation are of greater concern for ecosystem service functions in Southwest China [16]. Valuation methods suitable for Southwest China include value volume assessment and object quality assessment, etc. [20,21]. Current ecosystem services studies emphasize the importance of considering time and space perspectives [15,16].
Climate change and human activities could affect ecosystem patterns and functions, resulting in ecosystem service changes [22,23]. Previous researchers found that precipitation and land use changes are the most influential drivers of ecosystem service changes [24,25]. Precipitation impacts ecosystems by modifying their biophysical processes, which subsequently alters ecosystem services [26,27]. Over the past six decades, human activities have transformed 32% of the world’s land [28], imposing significant challenges to global ecosystems [15]. Moreover, global ecosystems continue to degrade due to increasing anthropogenic disturbances [5,18]. Many studies have demonstrated that the pattern, intensity, and type of land use changes can significantly affect ecosystem services [29,30]. However, the impact of climate change and human activities on ecosystem services such as water conservation, carbon sequestration, and soil conservation remain unclear.
Therefore, this study aimed: (i) to analyze the spatial and temporal changes in ecosystem service functions and their values in Southwest China between 2000 and 2020; (ii) to examine the long-term trends of ecosystem service functions; and (iii) to explore the effects of precipitation and land use changes on ecosystem services. All analyses have important implications for future ecosystem conservation and management.

2. Materials and Methods
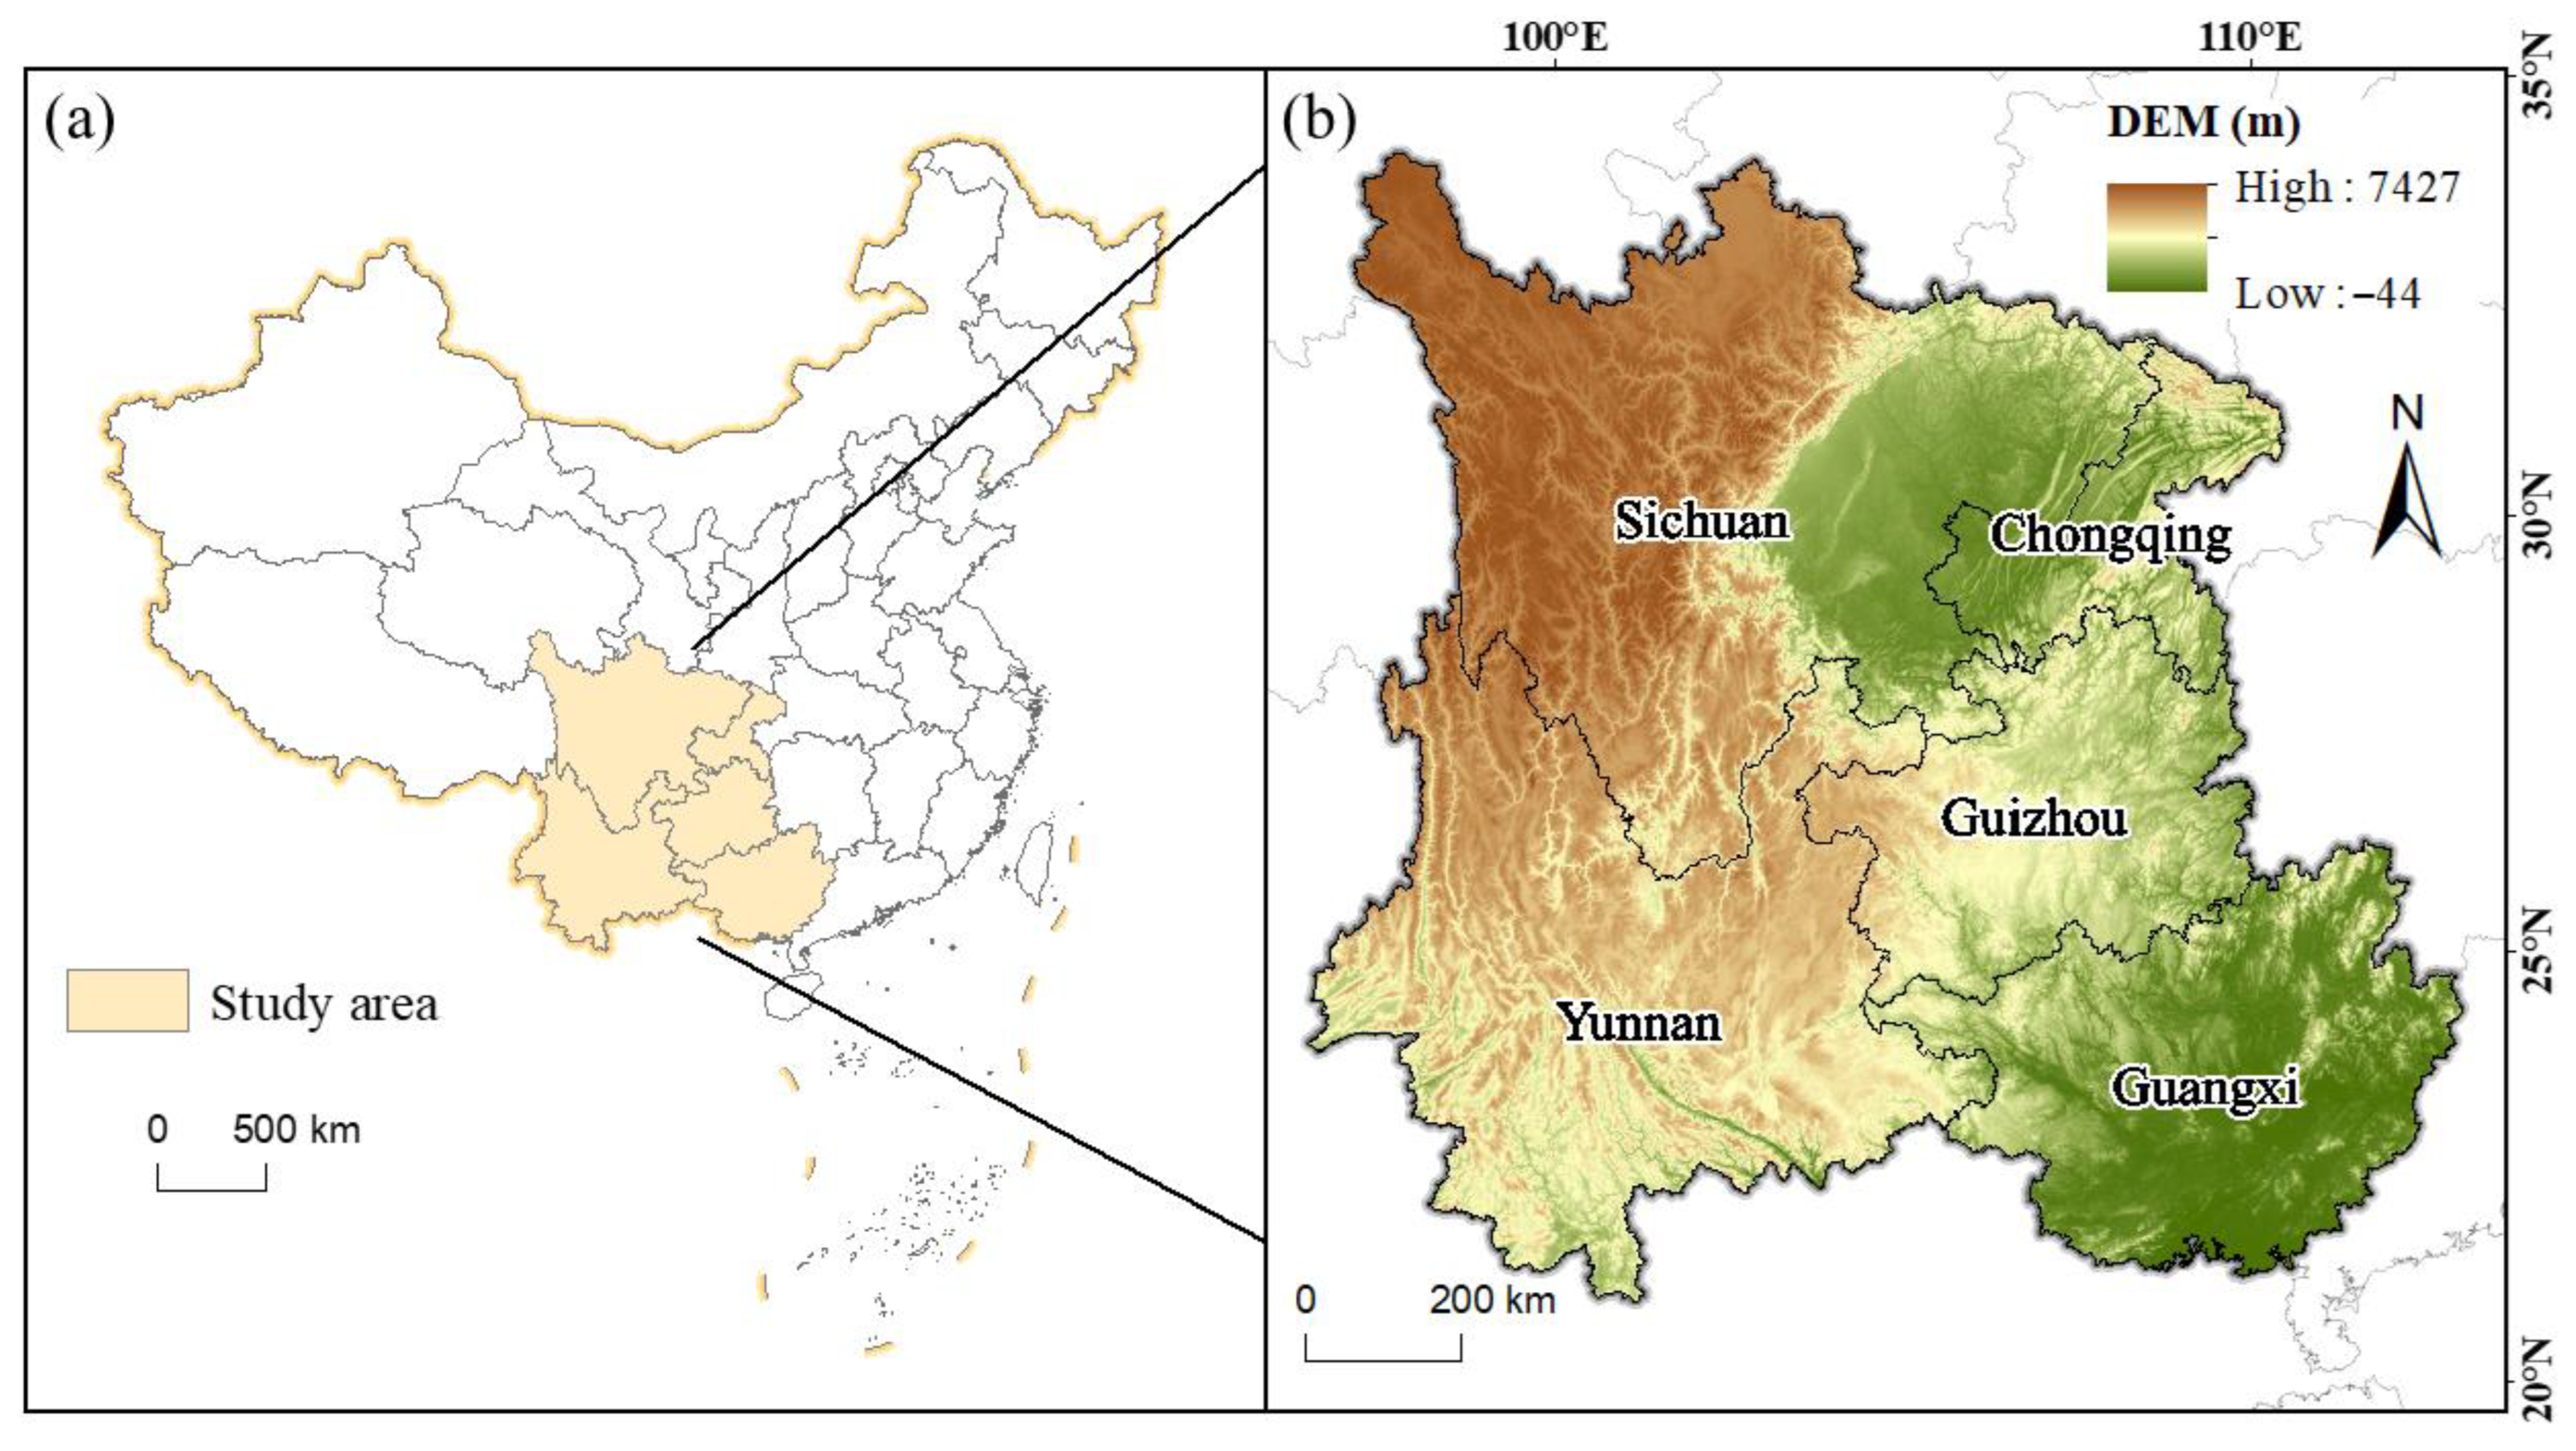
2.1. Study Area

The study area is located in southwestern China (91°21′~112°04′ E, 21°54′~34°19′ N), with a total area of about 1,364,400 km2, including Chongqing, Guangxi, Guizhou, Sichuan, and Yunnan provinces (Figure 1). The region is predominantly characterized by a subtropical monsoon climate, featuring favorable hydrothermal conditions. The multi-year mean annual precipitation generally exceeds 900 mm [31]. The region also boasts a remarkable wealth of biological species and diverse ecosystem types, making it one of the most affluent areas in China in terms of biodiversity [32]. The study area owns the world’s largest and most reactive karst landforms and is also one typical ecologically fragile region in China. The lithology in karst regions comprises dolomite, limestone, and their mixes, while clasolite is the major lithology in non-karst areas [33]. The study area is characterized by difficult topography and diverse geomorphology, encompassing Hengduan Shan, Yunnan-Kweichow Plateau, Sichuan Basin, etc. [34]. The terrain is undulating and complex, with a higher distribution in the west and lower in the east. The main soil types include red soil, purplish soil, and yellow soil [35].

2.2. Data Source and Processing

2.2.1. Precipitation Data

The precipitation data are a 1-km monthly precipitation dataset for China (1901–2021) and were obtained from the National Tibetan Plateau Data Center (http://data.tpdc.ac.cn, accessed on 6 August 2022). The coordination system of the data is WGS 84. This dataset was generally based on the 0.5° global climate dataset released by Climate Research Unit and the global high-resolution climate dataset released by WorldClim [36,37]. Additionally, 496 independent meteorological observation data points were utilized for verification, yielding reliable results [38,39]. The precipitation data were used to calculate water conservation and rainfall erosivity factor (R) in the Revised Universal Soil Loss Equation (RUSLE).

2.2.2. Soil Properties Data

The soil properties data, including sand, silt, clay, and organic carbon contents, were downloaded from National Tibetan Plateau Data Center (http://data.tpdc.ac.cn, accessed on 14 November 2022). The coordinate system of the data was WGS 84, with a spatial resolution of 30 arc seconds. In order to maintain the consistency of spatial resolution, the soil properties data were resampled to 1 km using ArcGIS 10.4.1. The source data for this dataset were obtained from 8595 soil profiles collected during the second soil census and 1:1 million Chinese soil maps [40]. The previous study demonstrated that this dataset was applied in Southwest China [41]. Therefore, we used soil properties data to calculate the soil erodibility factor (K) in the RUSLE.

2.2.3. Digital Elevation Model (DEM) Data

The DEM is produced by ALOS Global Digital Surface Model with a point spacing of 3pprox.. 30-m mesh and was downloaded from the Japan Aerospace Exploration Agency (https://earth.jaxa.jp/en/, accessed on 2 March 2023). The dataset has been collated with images acquired by the Advanced Land Observing Satellite (ALOS) called “DAICHI”. The DEM data were generated based on the digital surface model dataset with a 5-m mesh version of the “World 3D Topographic Data” dataset of the “World 3D Topographic Data”, which represented the most accurate global scale elevation data [42,43]. Its results in Southwest China are reliable [44]. In this study, the spatial resolution and coordinate system were adjusted to 1km and WGS 84, respectively. The DEM was applied to obtain the slope length and slope steepness factor (LS) in the RUSLE.

2.2.4. Land Use and Cover Data

The land use data were derived from China’s National Land Use and Cover Change (CNLUCC) dataset during 2000–2020. The CNLUCC dataset was developed by the Data Center for Resources and Environment Sciences (https://www.resdc.cn, accessed on 28 October 2022), Chinese Academy of Sciences. It was based on visual interpretation of Landsat TM/ETM images with a spatial resolution of 1 km × 1 km. The coordinate system is WGS 84. Many researchers have proven that classification techniques above 92% were achieved through random sampling verification of survey sites in the field and assessments of the accuracy of the Kappa coefficient, which were applied in Southwest China [45]. The original CNLUCC dataset comprised 23 land use classes, based on a well-established hierarchical land cover classification system [46]. To facilitate the calculation of ecosystem service functions in this study, the 23 land use classes were further consolidated into six aggregated land use categories, namely construction land, farmland, forestland, grassland, unused land, and water. The land use data were used to calculate the crop management factor (C) and conservation support practice factor (P) in the RUSLE.

2.2.5. Net Ecosystem Productivity (NEP) Data

The NEP data are provided by the National Ecosystem Science Data Center, National Science & Technology Infrastructure of China (http://www.nesdc.org.cn, accessed on 29 August 2022). The dataset comprises simulated daily net ecosystem productivity over the globe during 1981–2019, which has been verified in some previous studies to be applicable in Southwest China [47]. In particular, the data for 2020 were not publicly available and were obtained directly from the research team. The coordinate system is WGS 84, with a spatial resolution of 0.072727°, and was resampled to 1 km by ArcGIS 10.4.1. NEP was simulated using the process-based Boreal Ecosystem Productivity Simulator (BEPS) model, driven by meteorological data, remotely sensed vegetation parameters, nitrogen deposition atmospheric, and carbon dioxide (CO2) concentration [47,48]. The amount of annual carbon sequestration was represented by NEP in the study.

2.2.6. Evapotranspiration Data

The evapotranspiration data were derived from A Big Earth Data Platform for Three Poles (https://data.tpdc.ac.cn, accessed on 29 February 2023). The data have a spatial-temporal resolution of daily and 500 m from 26 February 2000 to 31 December 2020. They have been widely applied in ecology studies, especially in Southwest China [49]. In the study, the resolution was resampled to 1 km using ArcGIS 10.4.1 and the lacking parts of 2000 were replaced by contemporaneous data from 2001. The actual evapotranspiration was the sum of the five types of evapotranspiration listed earlier and was used to calculate the water yield.

2.3. Methods

2.3.1. Water Conservation

The water conservation was calculated using the InVEST (Integrated Valuation of Ecosystem Services and Tradeoffs) Water Yield model. The model is founded on the principle of water balance, utilizing the difference between the precipitation within the grid cells and the actual losses from evapotranspiration to determine the water yield [50,51]. The formula is as follows:
Y ( x ) = ( 1 A E T ( x )   P ( x ) )   ·   P ( x )
where Y(x) is the annual water yield of each image element x (mm); AET(x) is the annual actual evapotranspiration of each image element x (mm); P(x) is the annual precipitation of each image element x (mm).
The shadow engineering method and the market price in the direct market method are commonly employed to evaluate the value of water conservation services [52,53]. The market price method was used in this study as follows [53]:
V x = W R x   ×   P
where V x is the value of water yield (yuan); W R x is the amount of water yield in each raster (m3); P is the price of water resources (yuan·m−3). This study used the price of water supply for residential domestic water from the waterworks in that year (with adjacent years substituted for years in which the price was not acquired).

2.3.2. Carbon Sequestration

NEP was used as a proxy for the carbon sequestration in the study area, with positive values indicating carbon sinks and negative values indicating carbon sources. The value of carbon sequestration was calculated by the market value method, which multiplied the physical amount of carbon by the carbon trading price [54]. The formula is as follows:
V c f = Q C O 2   ×   C c
where V c f is the value of carbon sequestration (yuan);   Q C O 2 is the total amount of carbon sequestration (t);   C c is the average price of the national carbon trading market transaction each year and was 64.10 yuan·t−1 before 2013, 26.38 yuan·t−1 in 2015, and 29.19 yuan·t−1 in 2020.

2.3.3. Soil Conservation

The reduction in soil erosion in the presence of vegetation cover and land management is defined as soil conservation [55]. Soil erosion was calculated based on the RUSLE, which mainly considered the effects of rainfall, topography, and vegetation on soil erosion [56,57]. The formula is as follows:
Q s r = R   ×   K   ×   L S   ×   C   ×   P
where Q s r is soil erosion (t·hm−2·a−1); R is rainfall erosivity factor (MJ·mm·hm−2·a−1); K is soil erodibility factor (t·hm2·h·hm−2·MJ−1·mm−1); LS is the slope length and slope steepness factor (dimensionless); C is the crop management factor (dimensionless); P is the conservation support practice factor (dimensionless).
(1) The rainfall erosivity factor (R) reflects the magnitude of the potential erosive capacity of the soil caused by rainfall [58]. The formula is as follows:
E I 30 i = 73 . 989   ×   (   P i 2 P a   ) 0 . 7387
where E I 30 i   is the average monthly rainfall erosivity factor (MJ·mm·hm−2·h−1); P i is the rainfall in month i (mm); P a   is the average annual rainfall (mm); and the average annual rainfall erosivity factor is the sum of the average monthly rainfall erosivity force in a year.
(2) The soil erodibility factor (K) is an index to evaluate the sensitivity of soil erosion and is the amount of soil erosion per unit of rainfall erosion force [59]. The calculation was conducted in accordance with the “Technical Specification for Investigation and Assessment of National Ecological Status—Ecosystem Services Assessment” (HJ 1173-2021) issued by the Ministry of Ecology and Environment of the People’s Republic of China. The formula is as follows:
K = ( 0 . 01383 + 0 . 51575 K E P I C )   ×   0 . 1317
K E P I C = { 0 . 2 + 0 . 3 exp [ 0 . 0256 m s ( 1 m s i l t   100 ) ] } × [ m s i l t   ( m c + m s i l t   ) ] 0 . 3   × { 1     0 . 25   o r g C   [ o r g C + exp ( 3.72 2.95 o r g C ) ] }   × { 1 0 . 7 ( 1 m s 100 ) { ( 1 m s 100 ) + exp [ 5 . 51 + 22 . 9 ( 1 m s 100 ) ] } }
where K is the soil erodibility factor (t·hm2·h·hm−2·MJ−1·mm−1); K E P I C is the soil erodibility factor calculated using the erosion-productivity evaluation model (t·hm2·h·hm−2·MJ−1·mm−1); m s , m s i l t   ,   m c and o r g C is sand, silt, clay, and organic carbon contents, respectively (%).
(3) The slope length and slope steepness factor (LS) accounts for the effect of the topography of the site on erosion [60]. It was calculated by Tool LS factor in SAGA GI [61]. The formula is as follows:
L = ( λ 22.13 ) m
m = β 1 + β
β = sin θ 0 . 089 [ 3 . 0   ×   ( sin   θ ) 0 . 8 + 0 . 56 ]
  S = { 10 . 8 sin θ + 0 . 03 θ   <   5 . 14 16 . 8 sin θ   0 . 5 5 . 14     θ   <   10 . 20 21 . 9 sin θ   0 . 96 10 . 20   θ   <   28 . 81 9 . 5988 θ     28 . 81
where L is the slope length factor (dimensionless); S is the slope steepness factor (dimensionless); m is the slope length index (dimensionless); θ is the slope (°); λ is the slope length (m).
(4) Crop management factor (C) reflects the impact of cropping and management practices, as well as disturbances to the natural environment, including agriculture, productivity, crop rotation, growing season length, and sub-surface biomass, on soil erosion [60]. According to the relevant literature [62], it was classified into various land use types, as presented in Table 1.
(5) Conservation support practice factor (P) is the ratio of soil loss after specific practice measures to soil loss when planted downhill. It was assigned to different land use types based on the relevant literature [62], as shown in Table 1.
Soil erosion has two primary impacts on humans: soil fertility loss and sedimentation [63]. Therefore, this study estimated the amount of soil conservation by considering both soil fertility conservation and sedimentation reduction values. The formula is as follows:
E = E a + E b
where E is the value of soil conservation (yuan·hm−2);   E a is the value of soil fertility loss (yuan·hm−2);   E b is the value of reduced sedimentation (yuan·hm−2).
Soil fertility maintenance encompasses both nutrient and organic matter values [64]. The former is determined by the market prices of chemical fertilizers, soil conservation practices, and nutrient content. The latter is estimated by converting the organic matter value into an equivalent amount of fuelwood, based on market prices. The formula is as follows:
  E a = E 1 + E 2
E 1   = Q · i m i n i p i
  E 2 = Q · D i 100 · P S · S
where   E 1 is the nutrient value (yuan·hm−2);   E 2 is the organic matter value (yuan·hm−2); Q is the annual soil conservation (t·hm−2); i is nitrogen, phosphorus, and potassium, respectively; m i is the average percentage content of nitrogen, phosphorus, and potassium in the soil, taken as 0.06%, 0.06%, and 1.40%, respectively;   n i are the factors for converting alkaline nitrogen to urea, fast-acting phosphorus to calcium superphosphate, and fast-acting potassium to potassium chloride, taken as 2.16, 4.07, and 1.92, respectively; p i is the national average market price of urea, calcium superphosphate, and potassium chloride in 2000, 2005, 2010, 2015, and 2020 (with adjacent years substituted for years when the prices are not available);   D i is the soil organic carbon content (%); P S is the opportunity cost of fuelwood, which was taken as 195 yuan·t−1 in 2010 and before, 210 yuan·t−1 in 2015, and 140 yuan·t−1 in 2020 according to the average market price of fuelwood in that year; S is the coefficient of conversion of fuelwood into soil organic matter, which was taken as 0.5.
The shadow engineering method is used to estimate the value of sedimentation by the cost required to dig and transport a unit volume of earth, which is replaced by the reservoir construction cost [65]. The formula is as follows:
E b = 0.24   ·   Q   · C ρ
where Q is the annual soil conservation (t·hm−2); C is the construction cost per unit reservoir capacity (yuan·m−3), obtained by dividing the total reservoir investment (108 yuan) by the total reservoir construction capacity (108 cubic meters) for that year in the Statistic Bulletin on China Water Activities (https://slnj.digiwater.cn/index.jspx, accessed on 9 December 2022) issued by the Ministry of Water Resources of the People’s Republic of China and the China Water Statistical Yearbook (https://data.cnki.net/v3/trade/Yearbook/Single/N2006060157?zcode=Z011, accessed on 11 December 2022) published by China Water & Power Press; ρ is the soil capacity weight, taken as 1.29 t·m−3.

2.3.4. Statistical Analysis

The trend analysis method refers to analyzing the long-term sequence of relevant indicators to identify trends [66]. In this study, trend analysis was used to investigate the trends of three ecosystem service functions at both regional and pixel scales. The formula is as follows:
  θ slope = n · i = 1 n i y i   ( i = 1 n i ) ( i = 1 n y i ) n · i = 1 n i 2 ( i = 1 n i ) 2
where θ slope is the slope of the trend of a certain indicator; n is the total number of years of trend change, which was taken as 5; i is the year, and i took 1, 2, …, 5, representing 2000, 2005, …, 2020, respectively; y i is the value of the indicator in the year i. The larger the absolute value of θ slope , the more obvious the change of y i . The higher the absolute value of θ slope , the more obvious the change of y i . When θ slope   < 0, it indicates a decreasing trend of an ecosystem service indicator; when θ slope   > 0, it indicates an increasing trend of an ecosystem service indicator. If the regression coefficient passes the significance test (F test, p < 0.05), it indicates a significant ascending or descending trend [67].

2.3.5. Partial Correlation Analysis

Precipitation and land use changes have significant impacts on ecosystem service functions. However, linear correlation analysis may introduce bias when examining the relationship between influencing factors (precipitation and land use changes) and ecosystem service functions (water conservation, carbon sequestration, and soil conservation). Partial correlation analysis offers an advantage by excluding the impact of a third variable when two variables are simultaneously associated with it, allowing for the estimation of the correlation between the other two variables [66,68]. This method effectively overcomes the limitations of conventional correlation analysis. The formula for partial correlation analysis is as follows:
r x y · z = r x y   r x z r y z ( 1 r x z 2 ) ( 1 r y z 2 )
where r x y · z is the partial correlation coefficient between variables x and y after fixing variable z; and r x y ,   r x z , and r y z are the correlation coefficients between variables x and y, x and z, and y and z, respectively.
The correlation coefficient is calculated as follows:
r x y = t = 1 n ( x i   x ¯ ) ( y t y ¯ ) t = 1 n ( x i   x ¯ ) 2 t = 1 n ( y t y ¯ ) 2
where r x y is the correlation coefficient for x and y, whose value ranges from −1 to 1.
If one of the influencing factors passed the significance test (p < 0.05) but the other did not, the former was considered the dominant factor. If both factors passed the test, then both were considered dominant. However, if neither factor passed, it was assumed that these pixels were not influenced by either precipitation or land use changes.

3. Results

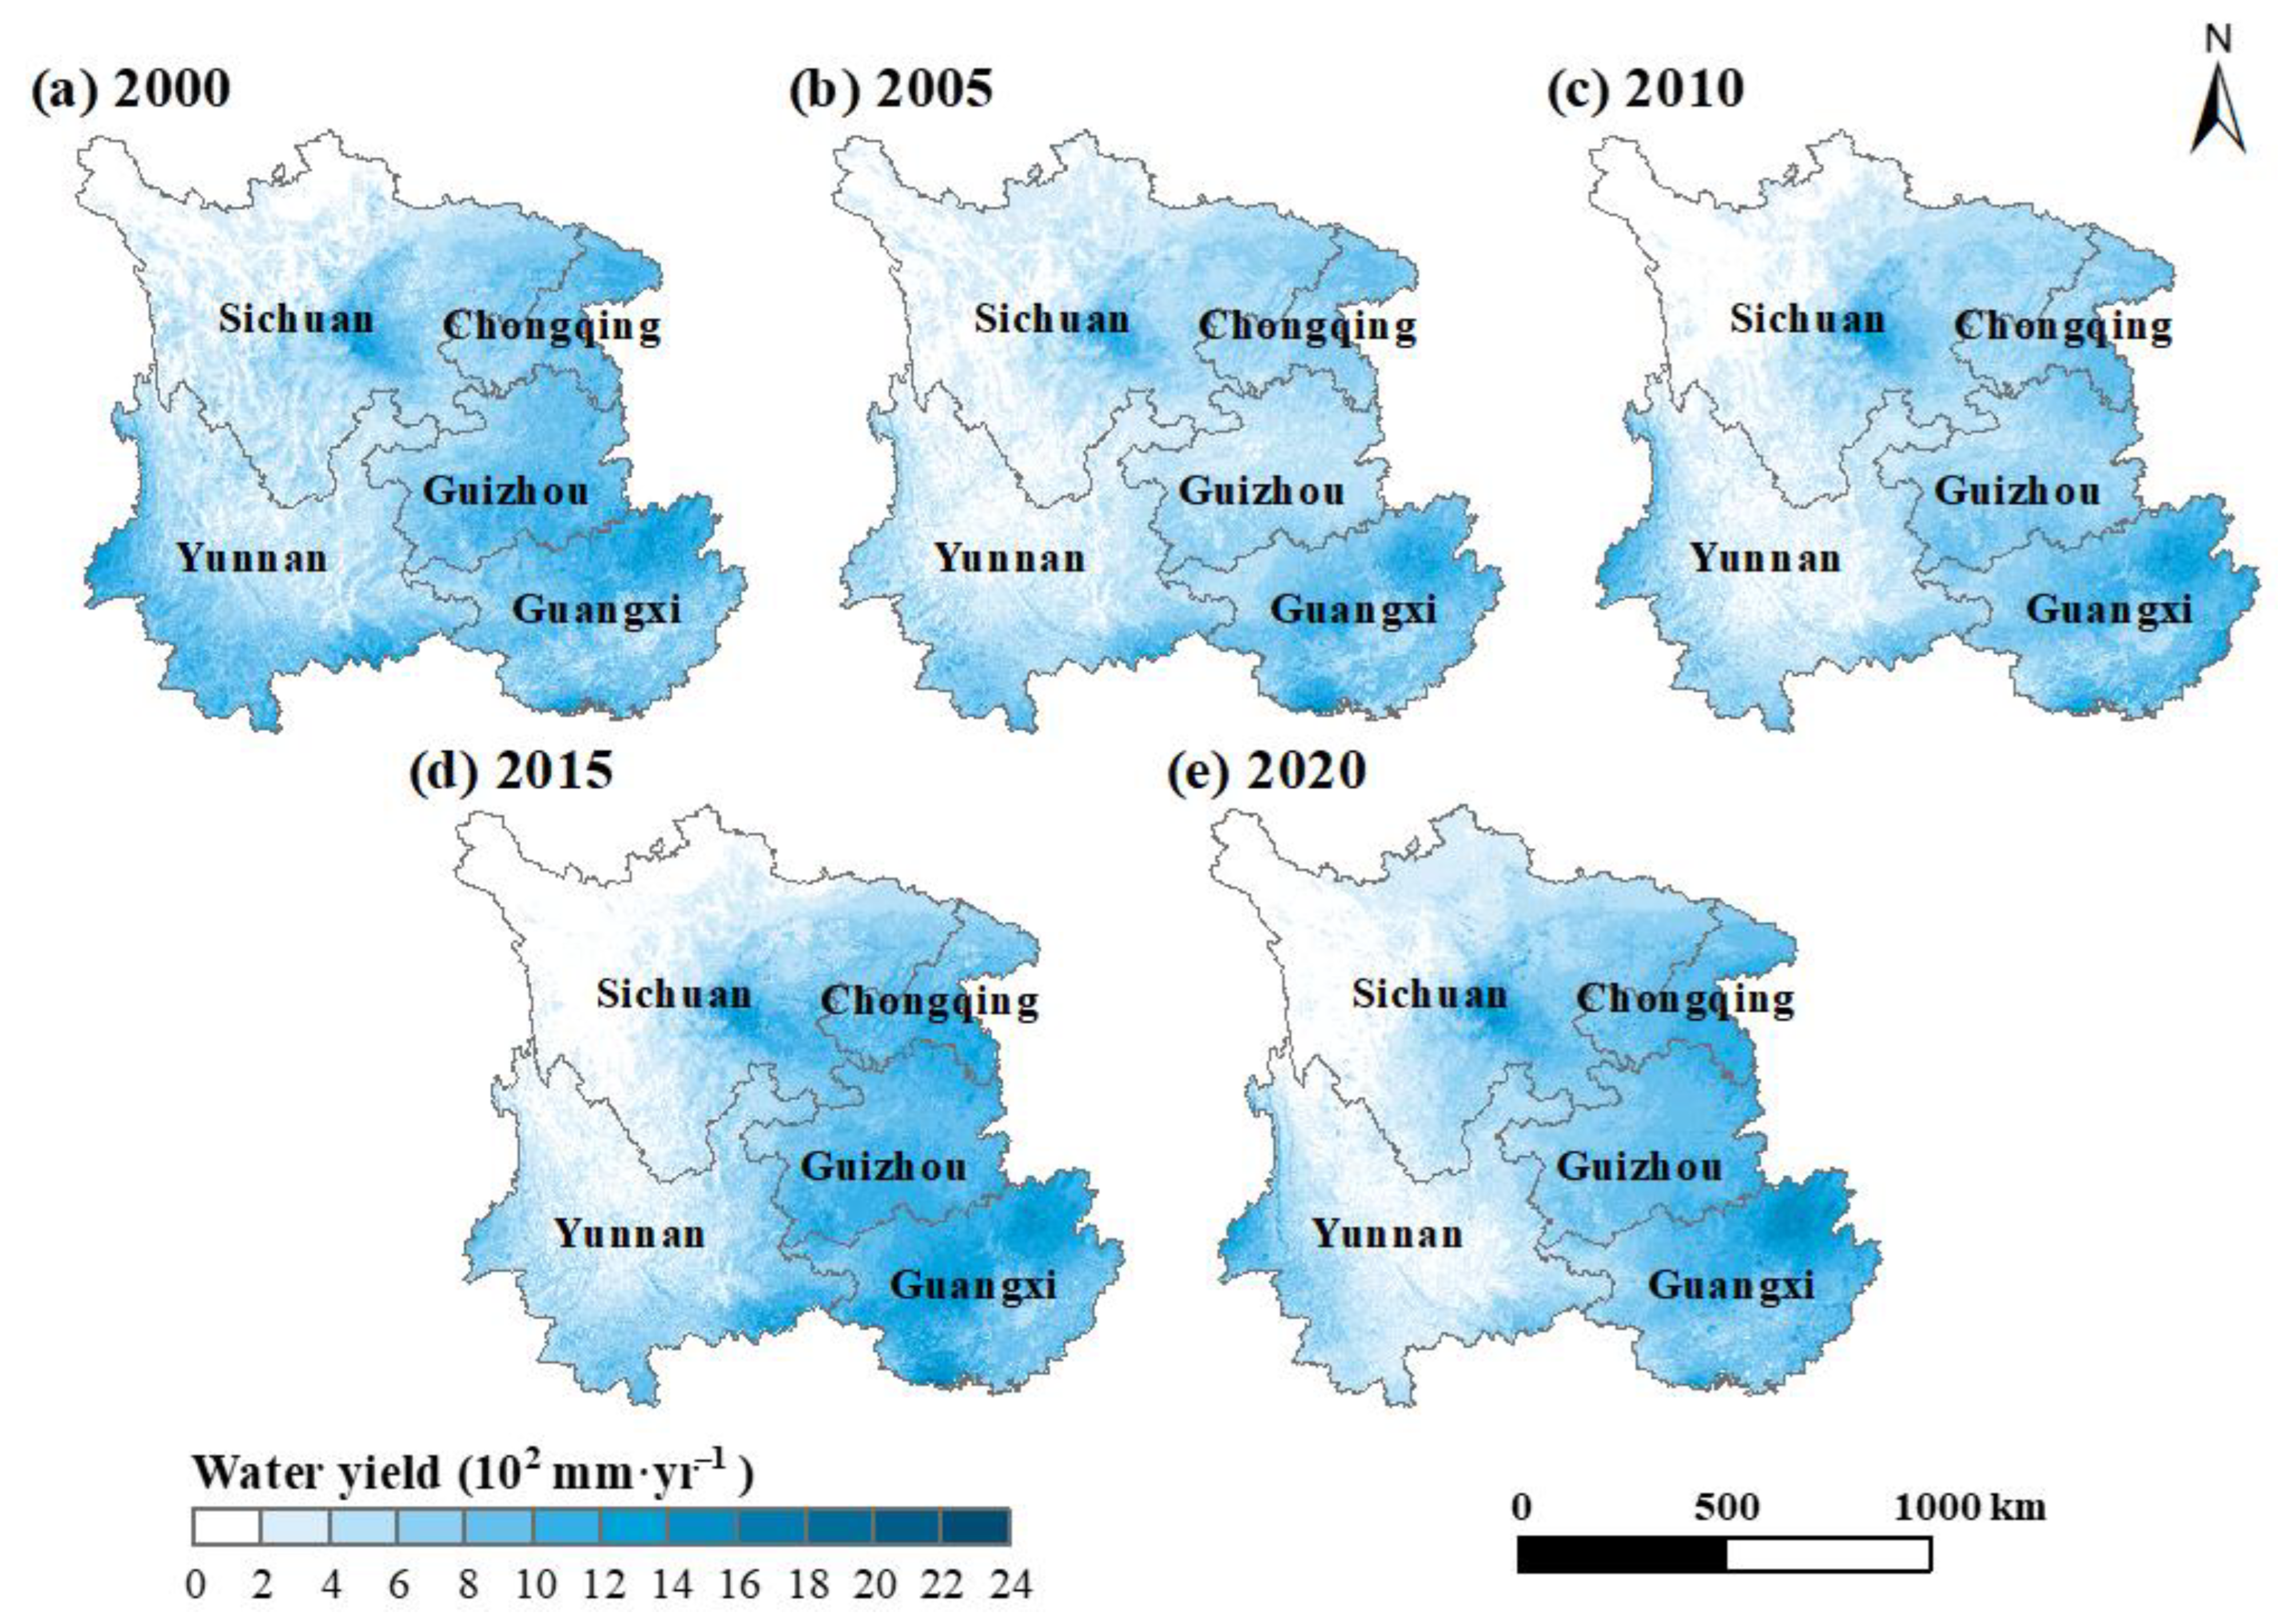
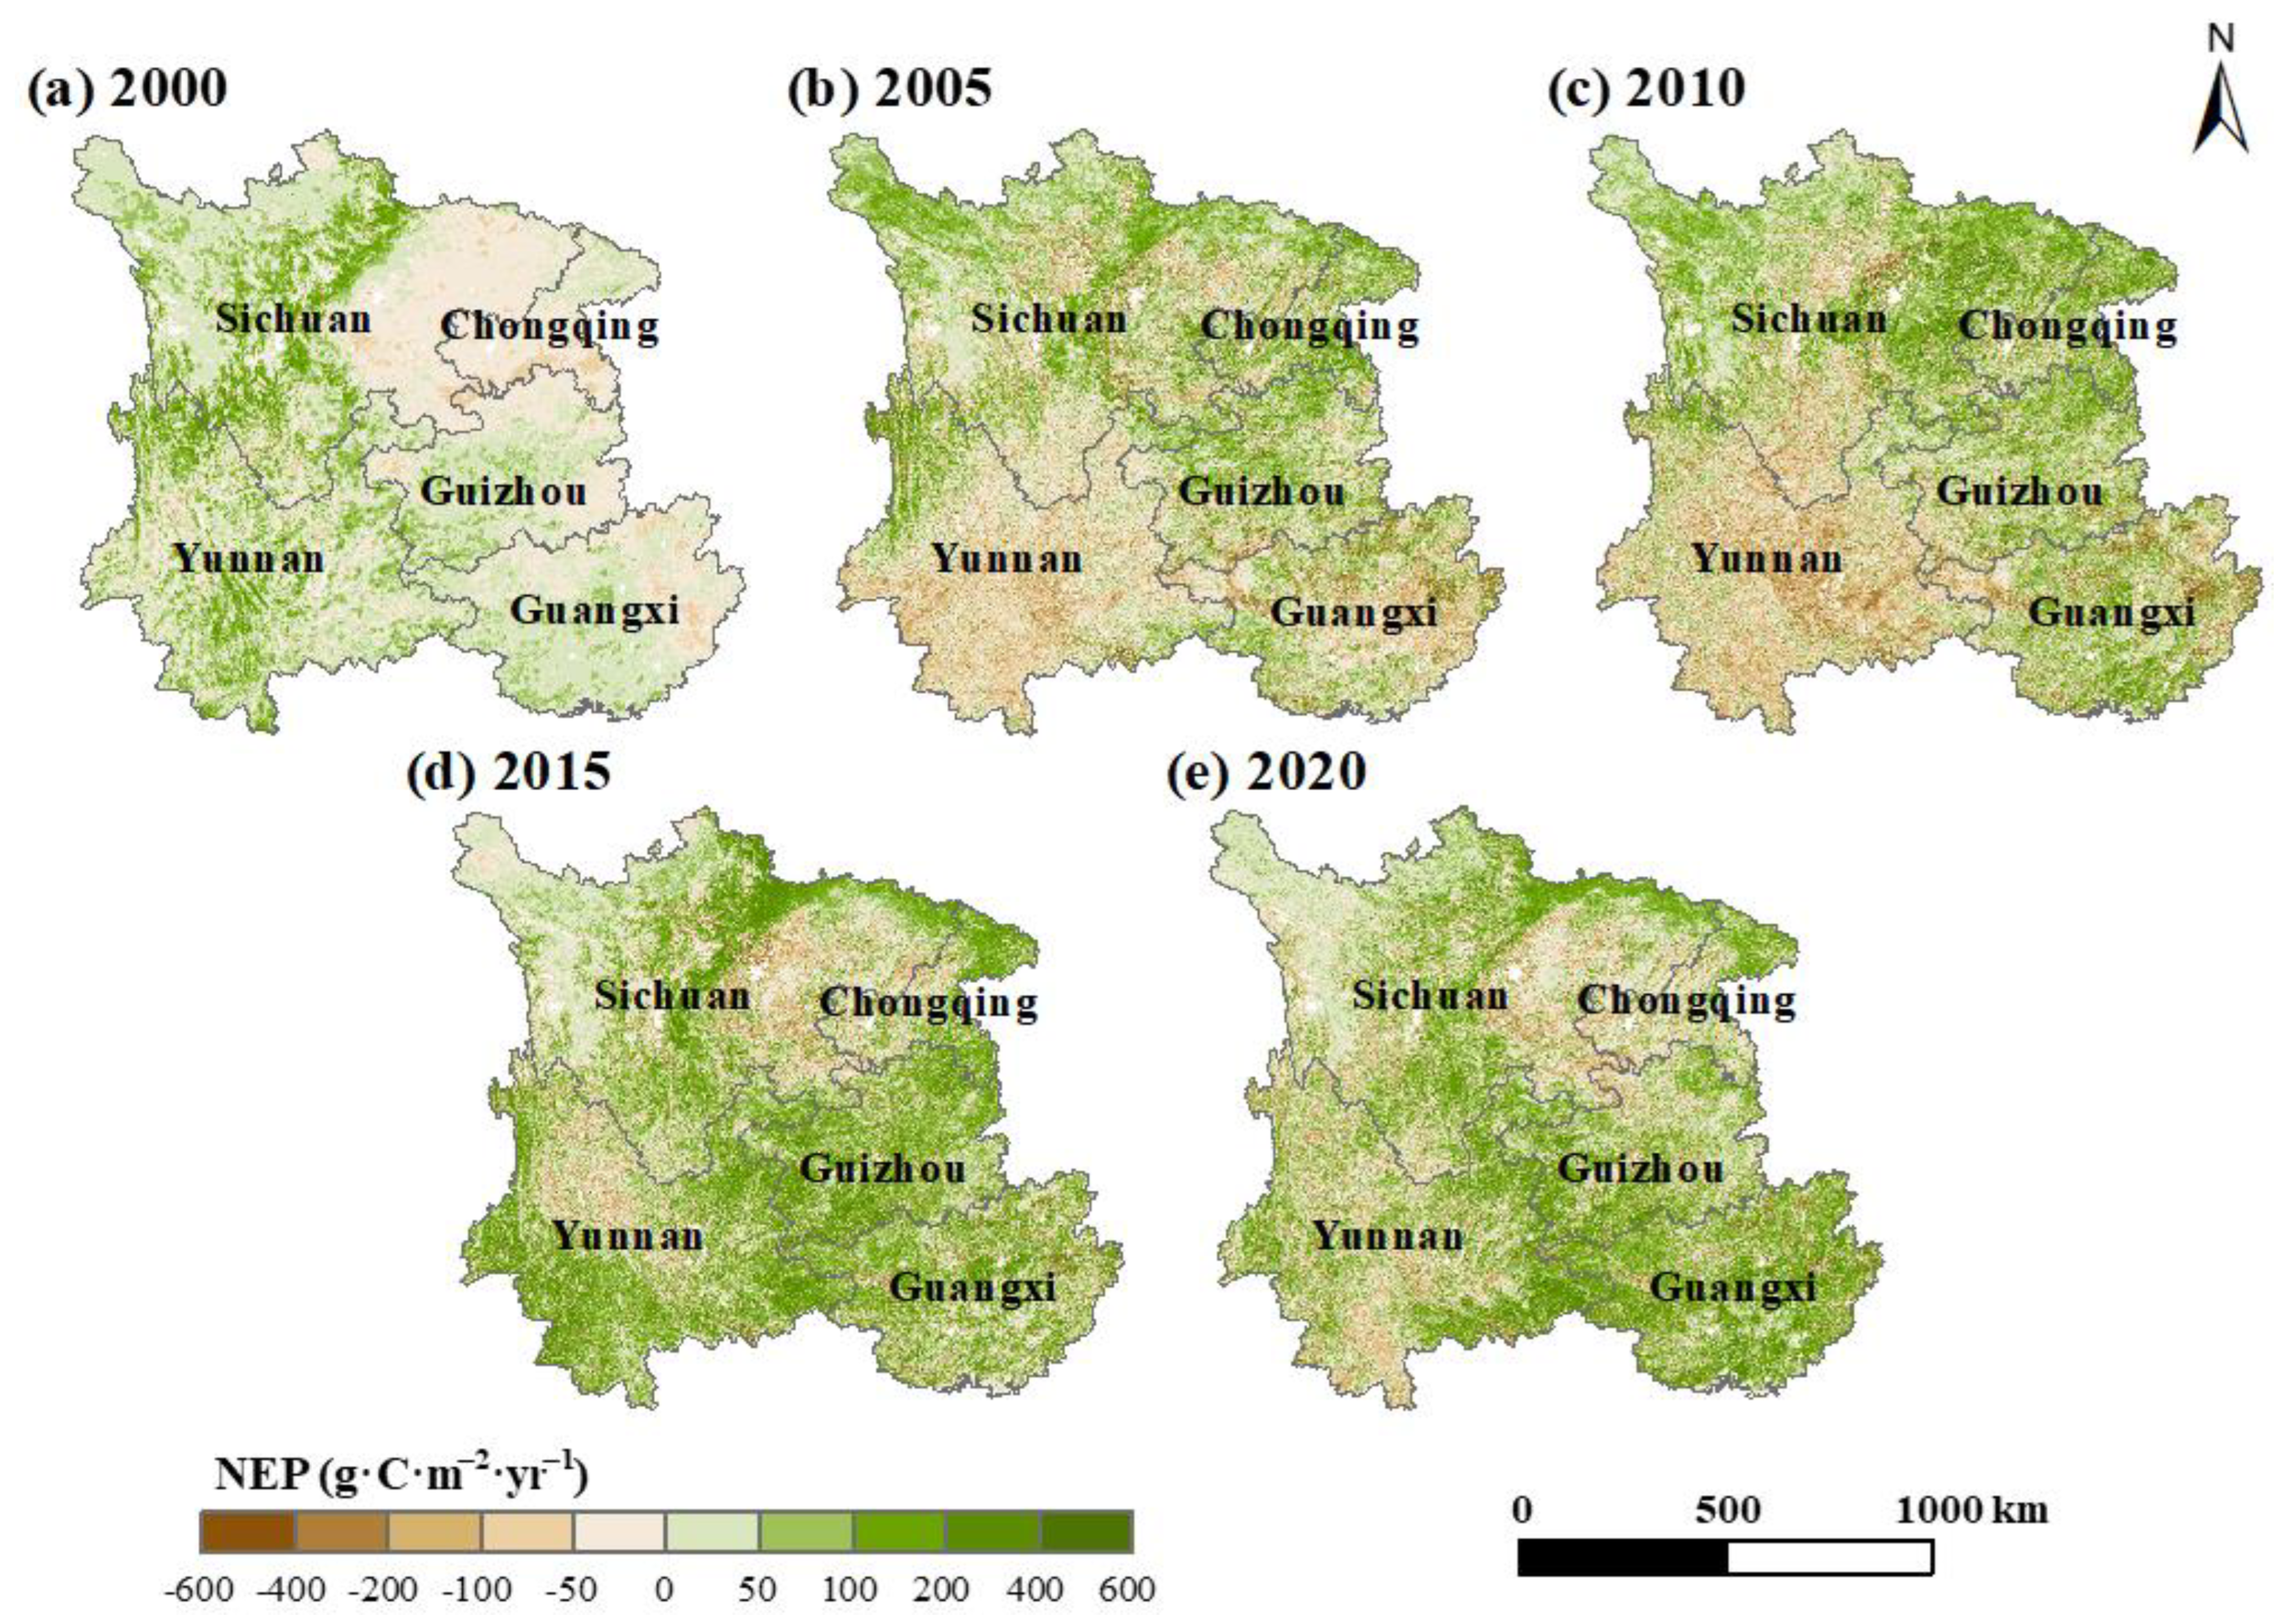
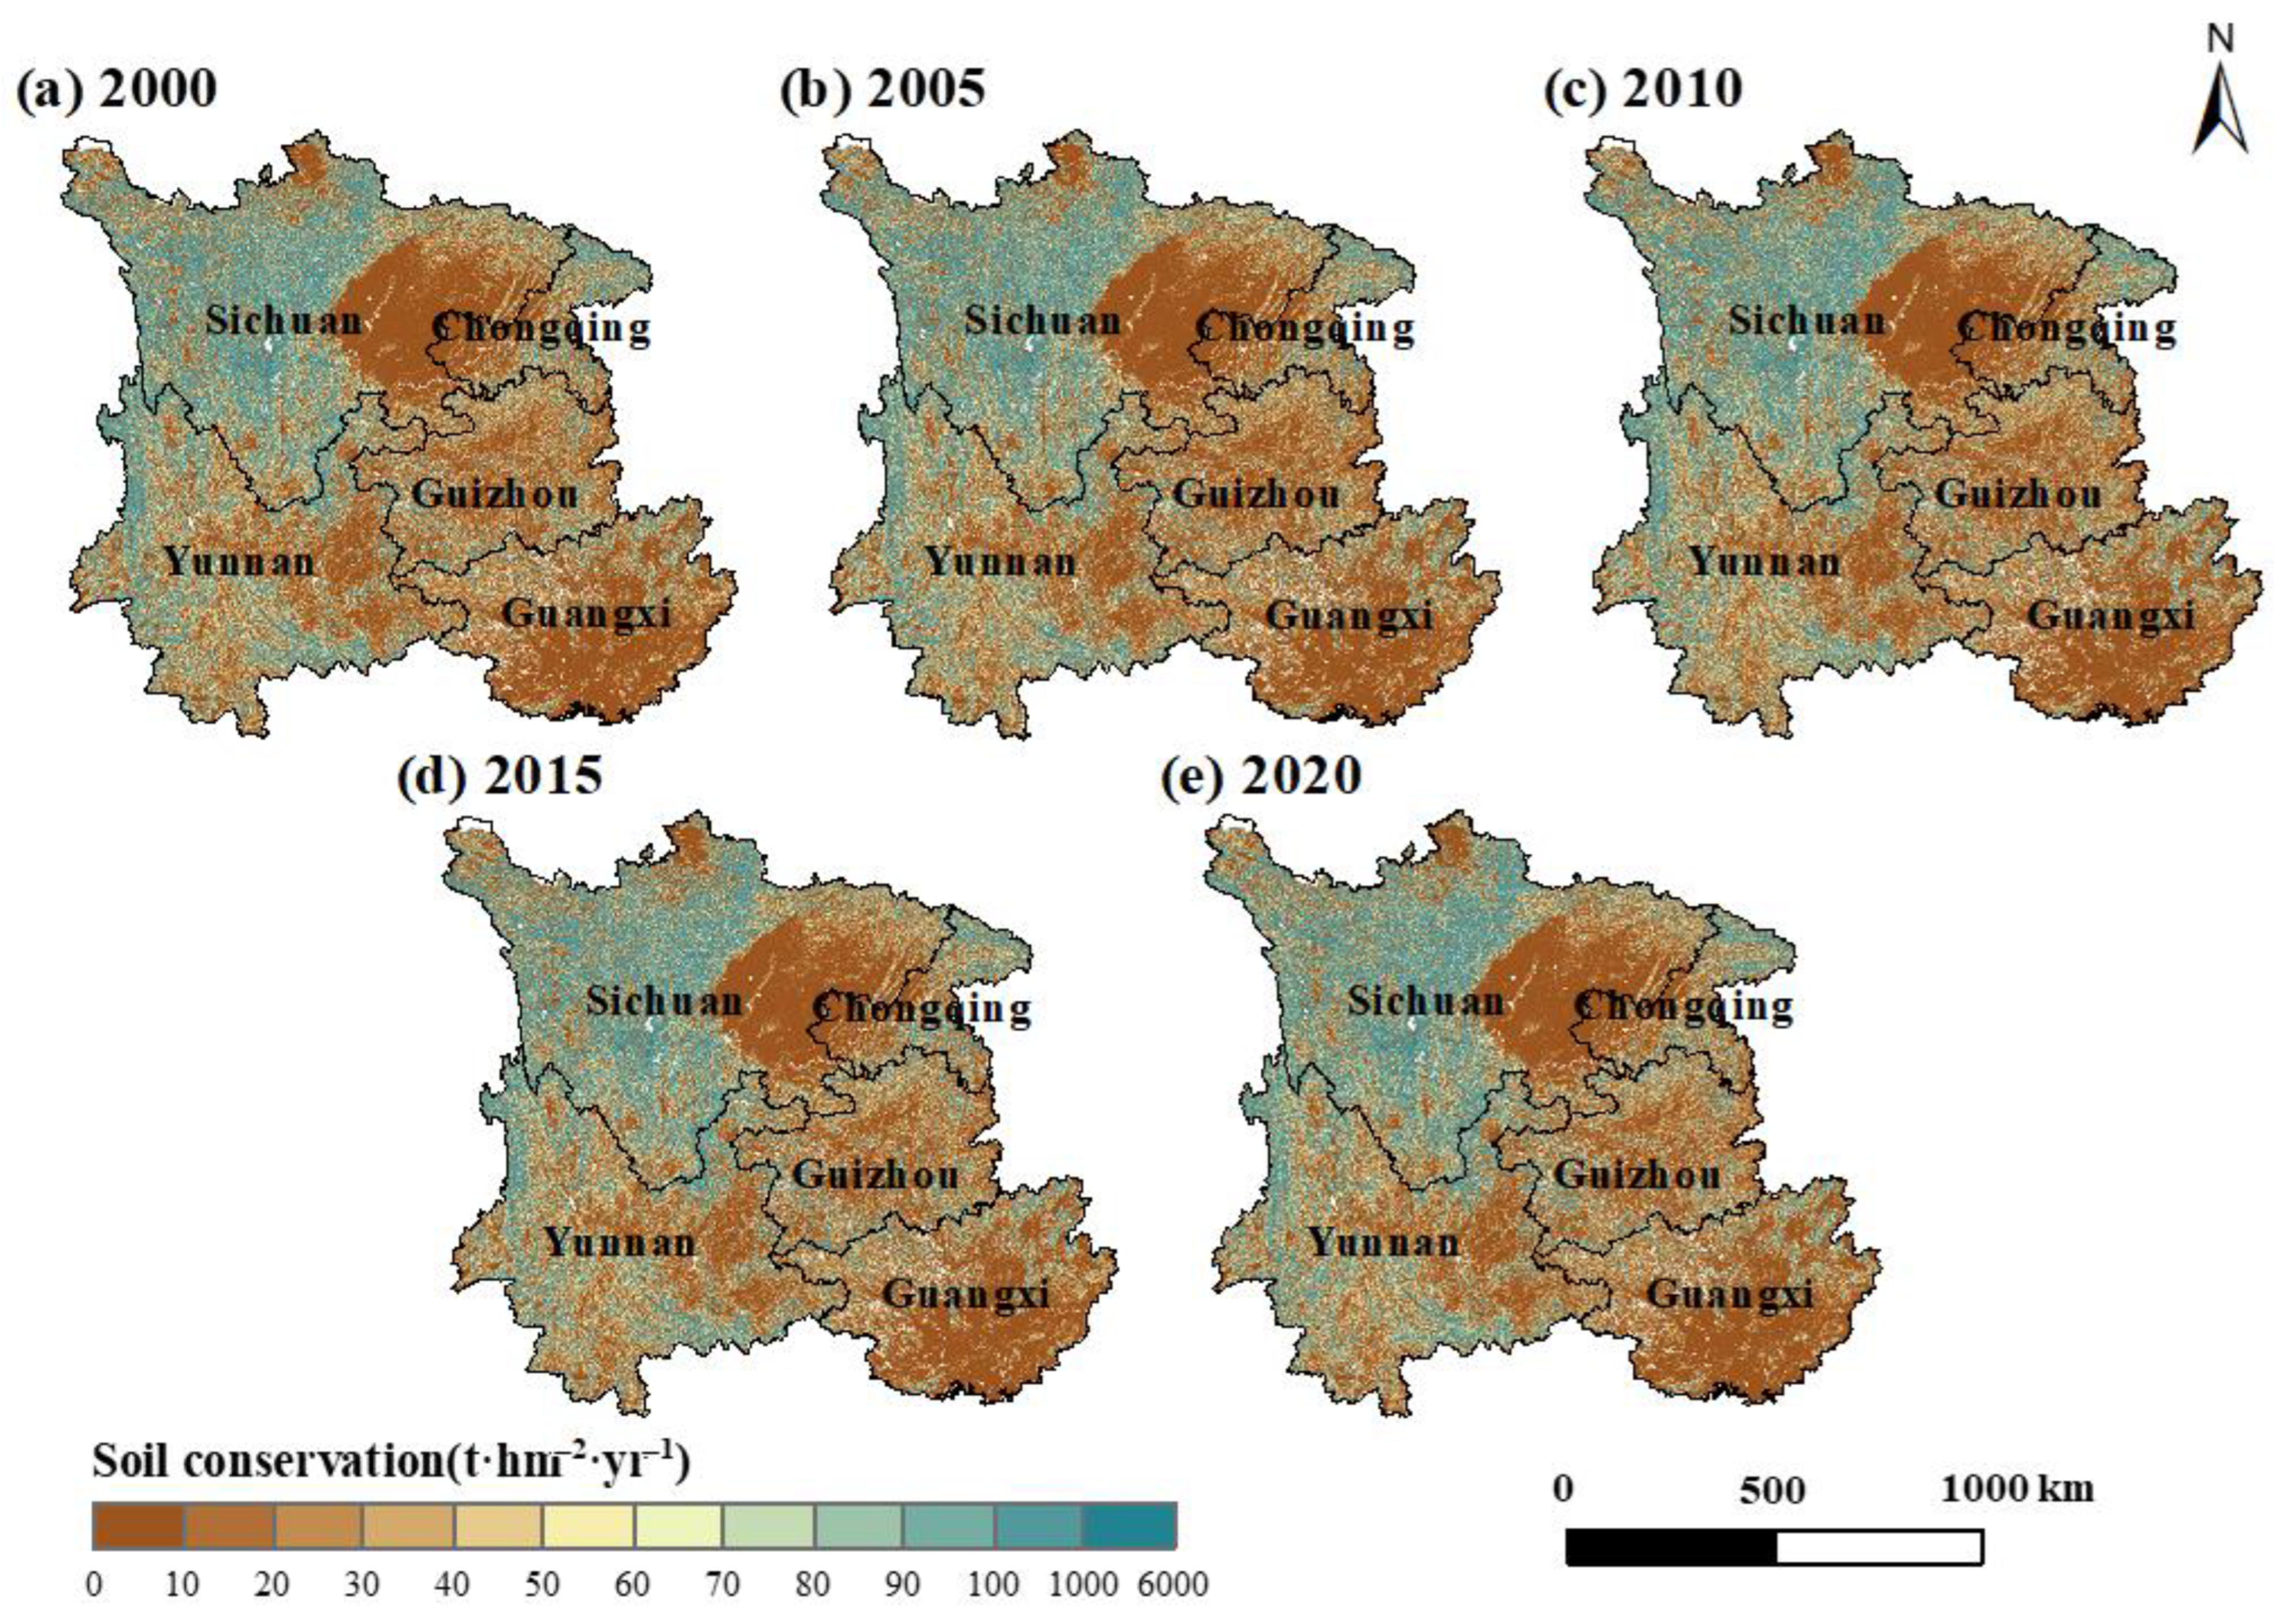
3.1. Spatio-Temporal Variability of Ecosystem Service Functions

As illustrated in Figure 2, water yield exhibited a decreasing trend along the direction of southeast to the northwest from 2000 to 2020. Meanwhile, this study found that the marginal region of Yunnan province was apparently larger than the central zone for water yield, and West Sichuan has the least water yield. Strong spatial-temporal heterogeneity can be found for carbon sequestration in this region (Figure 3). Overall, Guizhou, Guangxi, and Sichuan provinces showed a broad trend of rising carbon sequestration, whereas Chongqing and Yunnan provinces fluctuated throughout the study period. It was interesting to note that the spatial patterns of soil conservation contrasted with the water yield in Southwest China (Figure 4). Most areas had lower amounts of soil conservation, except the western part of Sichuan province.
Table 2 illustrates that the dynamic trends of water conservation and carbon sequestration were similar, exhibiting a decrease, followed by an increase, and then a subsequent decrease after 2015. The minimum and maximum levels were observed in 2005 and 2015, respectively. Notably, the water conservation level in 2020 decreased by 4.50% compared to 2000, while carbon sequestration increased by 94.35%. Although the amount of soil conservation continued to increase after reaching its minimum in 2005, it decreased by 0.76% in 2020 compared to 2000. Particularly, the values for water conservation and soil conservation no longer decreased as indicated by the rates of change presented in Table 2. Instead, they increased by 137.33% and 77.71%, respectively. Carbon sequestration changed from the only improved function (Table 2) to the lowest change rate of 6.95% (Table 3). These results suggest that the impact of economic factors on the values of ecosystem service functions should not be neglected. As a consequence, the total value of ecosystem service functions in Southwest China exhibited a 90.00% increase in 2020 in comparison with 2000.

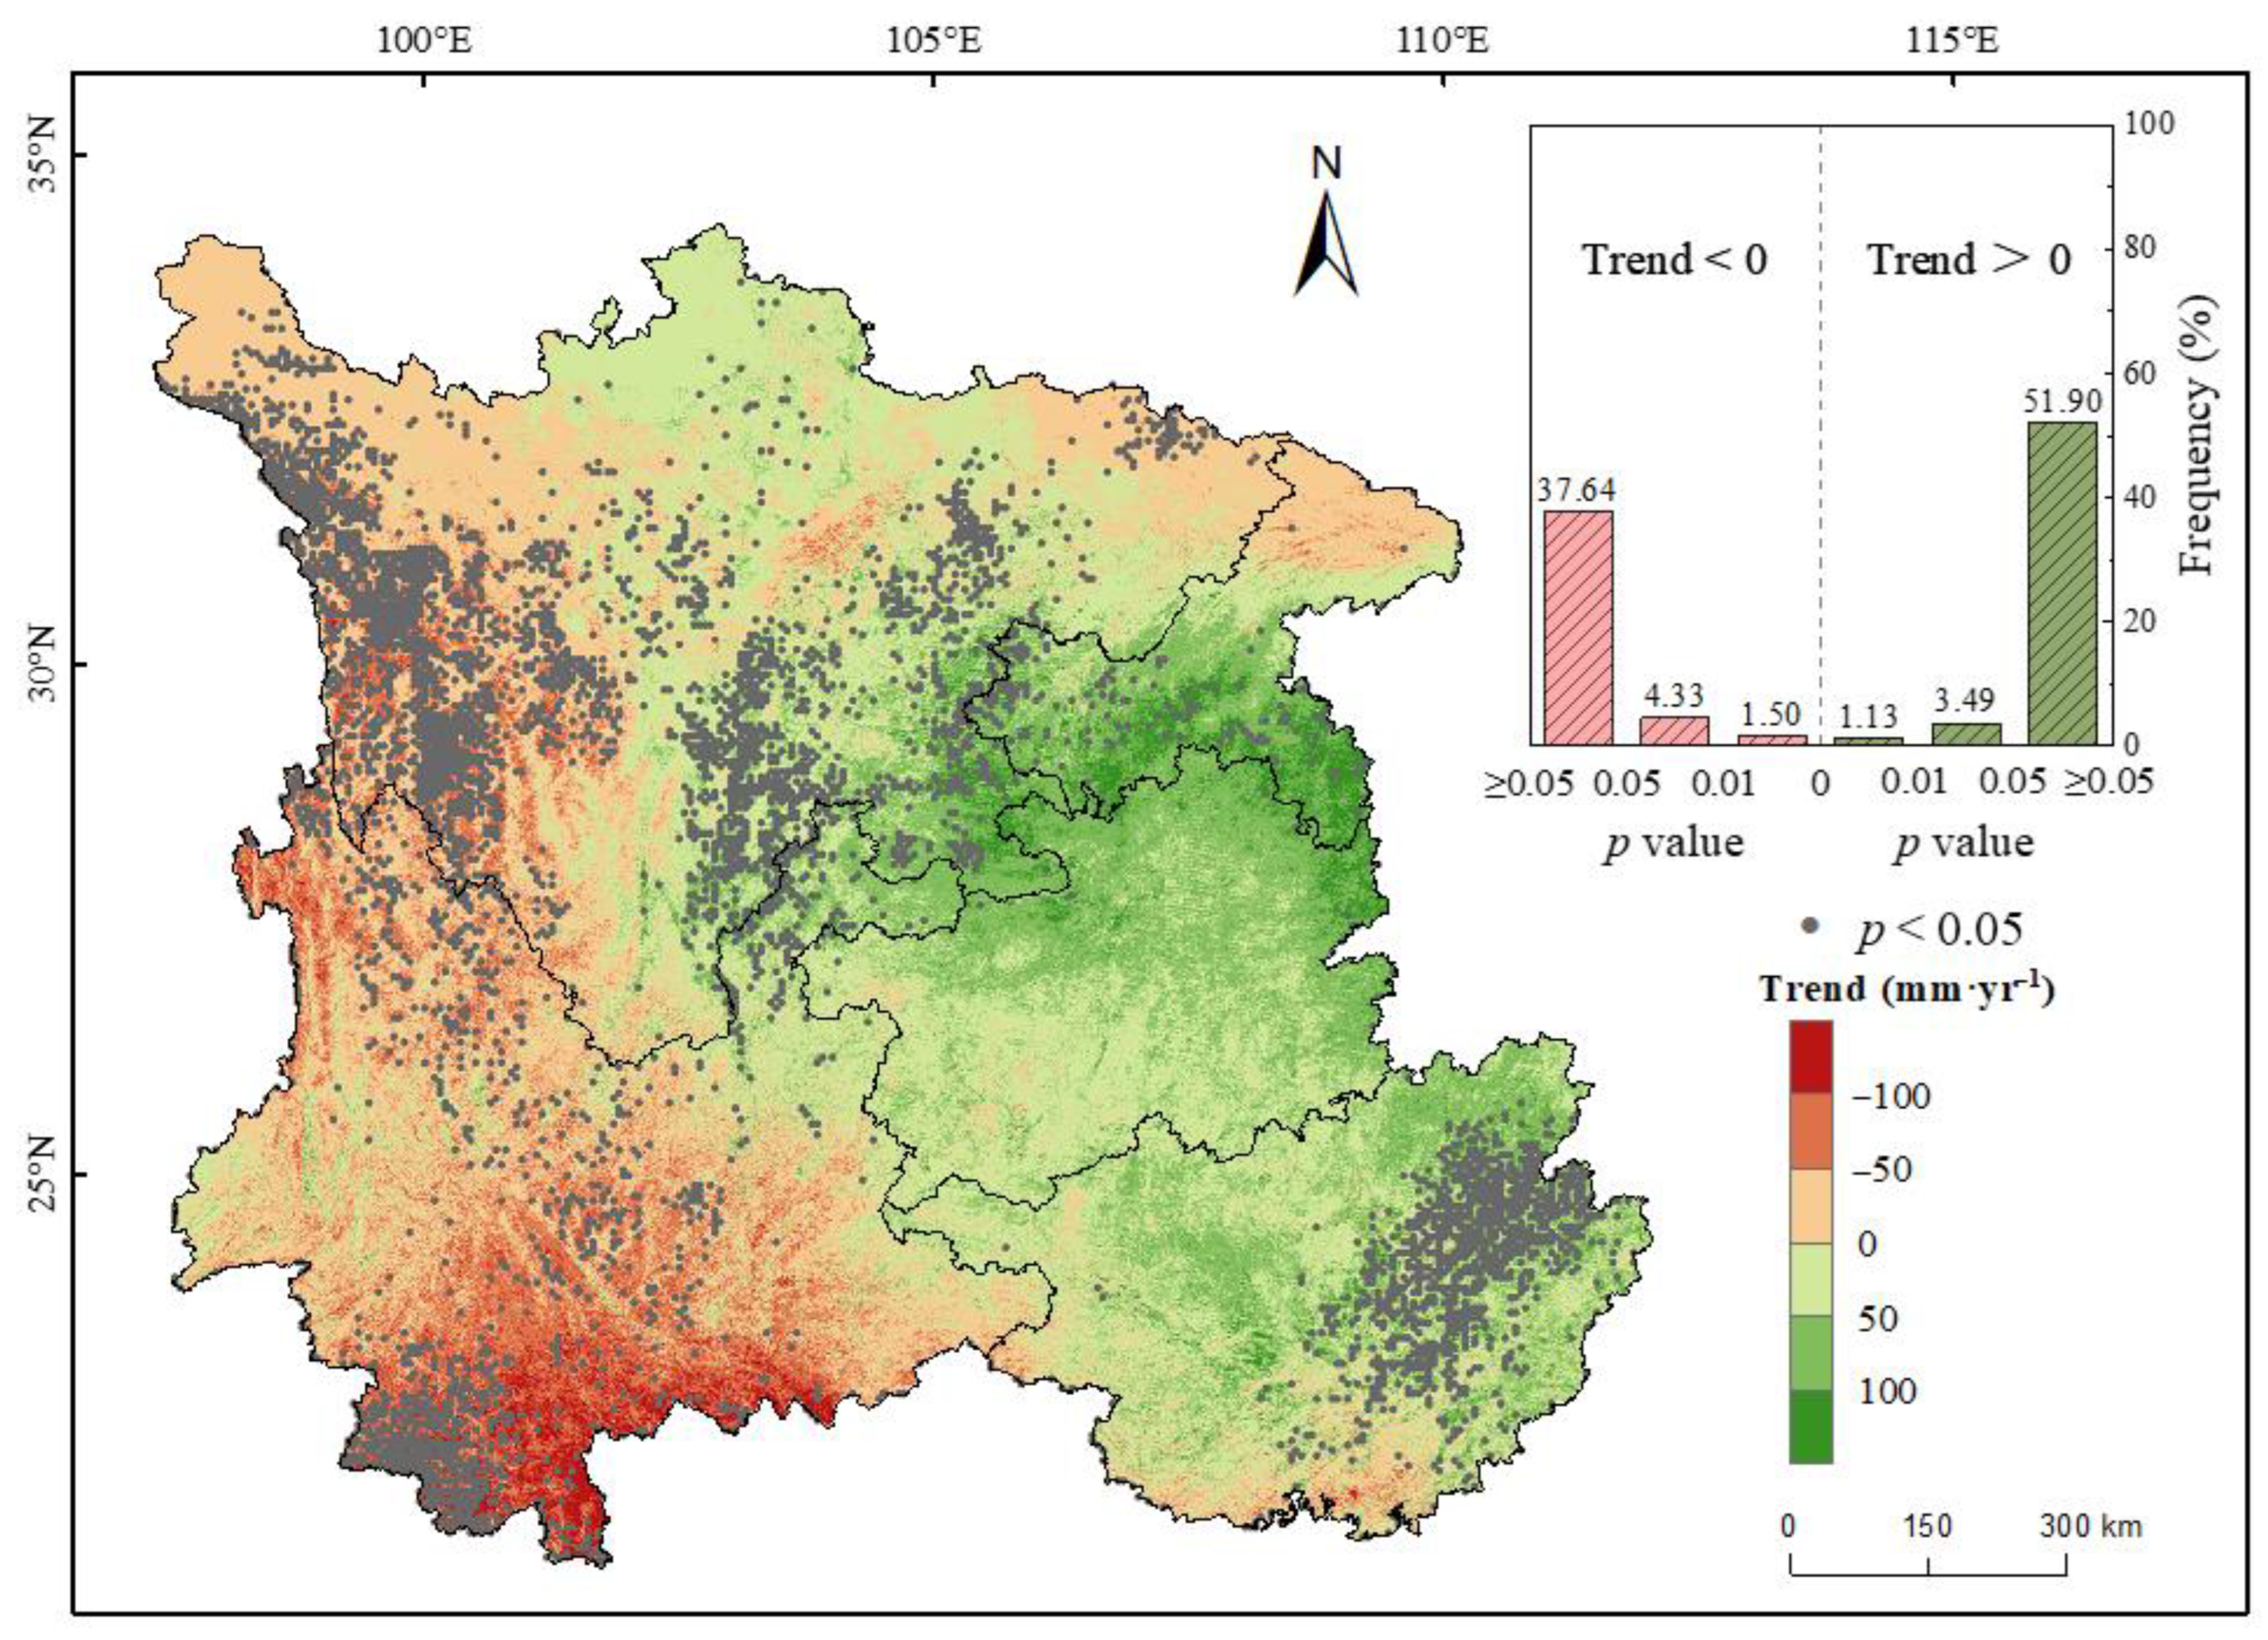
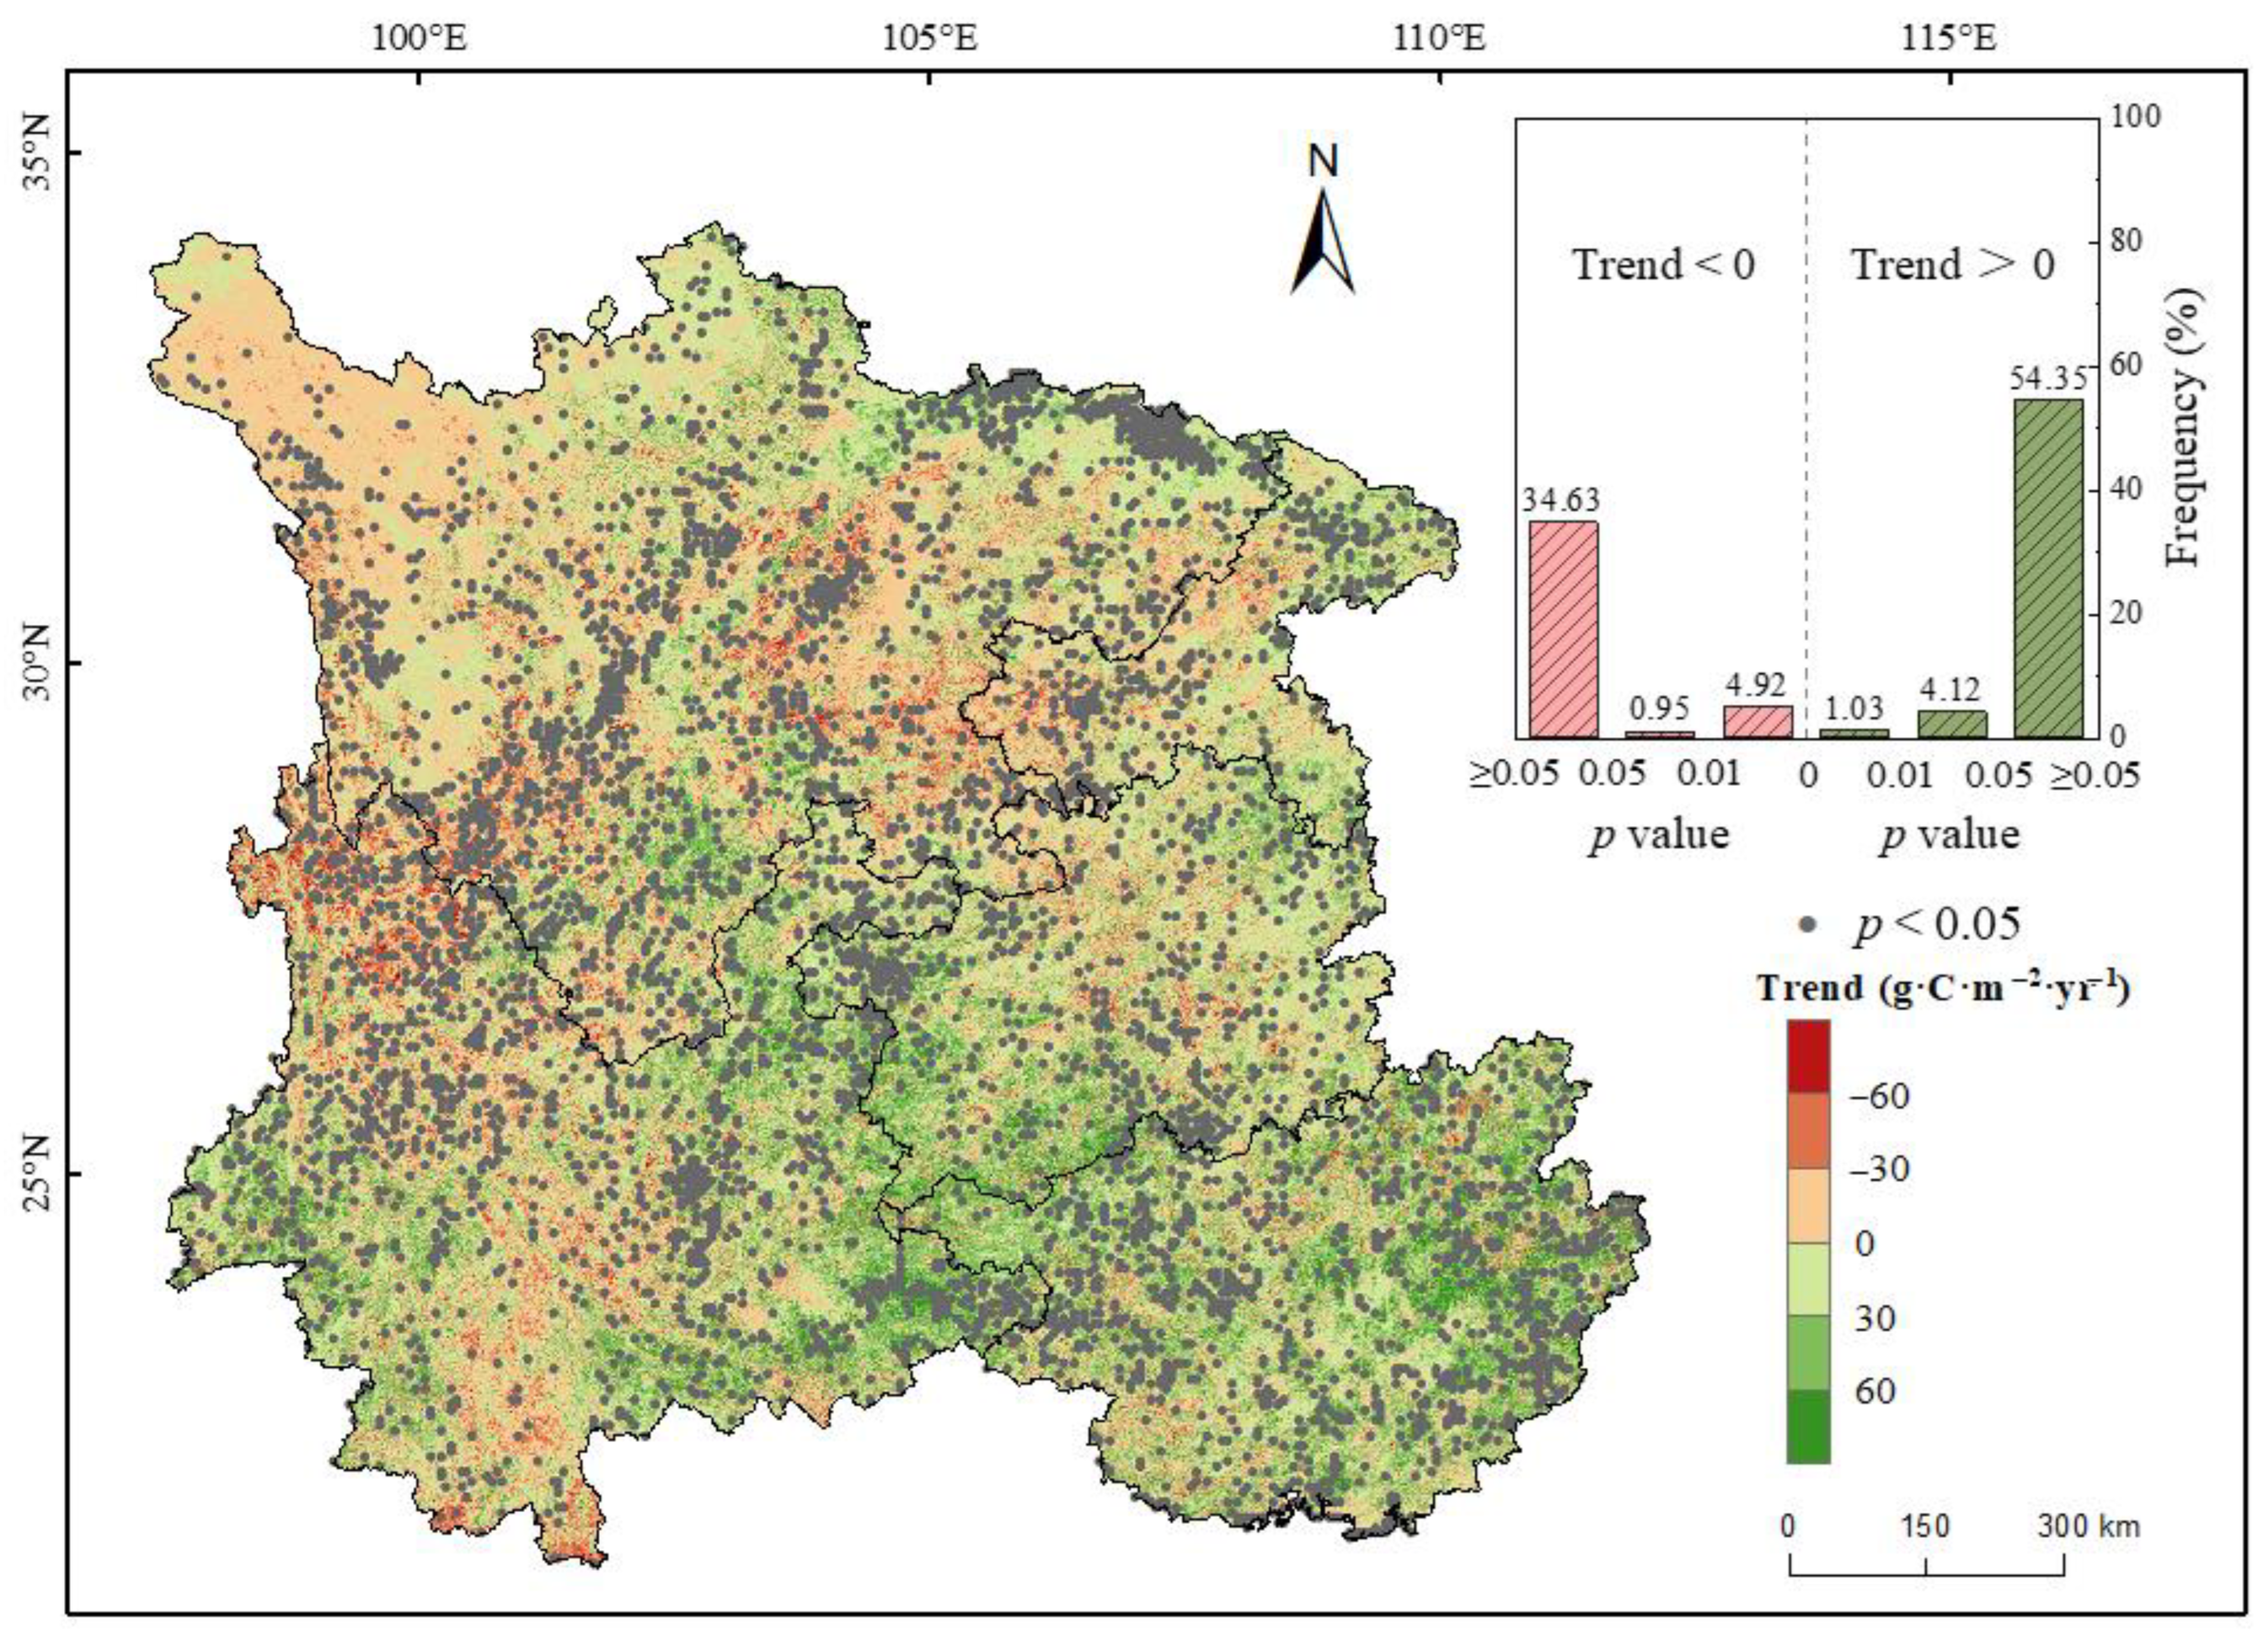
3.2. Long-Term Trend of Ecosystem Service Functions

Figure 5 reveals that the trend analysis indicates a declining trend in the annual water yield of approximately 43.47% in Southwest China, with these regions being widely distributed in the western and northeastern parts of Southwest China. The minimum of the trend was observed in the south of Yunnan, whereas the southern parts of Chongqing and Guizhou were the areas where the maximum was distributed. Approximately 5.83% of the entire region, mainly located in West Sichuan and Southwest Yunnan, exhibited a significant decreasing trend. Conversely, there was only 4.62% (p < 0.05) in Southwest China, primarily in southern Chongqing, eastern Guangxi, and eastern Sichuan. Upon comparison with Figure 2, it is apparent that the regions displaying growth and decline trends in Figure 5 are roughly associated with areas characterized by high and low amounts of water conservation, respectively.
During 2000–2020, around 40.50% of the study area exhibited a negative trend in carbon sequestration, with notable increases observed in the north and east of Southwest China (Figure 6). Meanwhile, approximately 59.50% of the area showed a positive trend, primarily in the southern region. Regions with significant trends were uniformly distributed, with 5.87% and 5.15% of the study area displaying a significant decreasing and increasing trend, respectively.
The soil conservation trend was concentrated within the range of −20 t·hm−2·yr−1 to 20 t·hm−2·yr−1, as shown in Figure 7. The areas exhibiting a declining trend were predominantly located in the west and south of the study area, covering roughly 44.21% of the overall area. Meanwhile, 55.79% of the study area demonstrated an increasing trend, with a highly significant increase (p < 0.05) observed in 7.52% of the region, mainly distributed in the central areas of Southwest China.

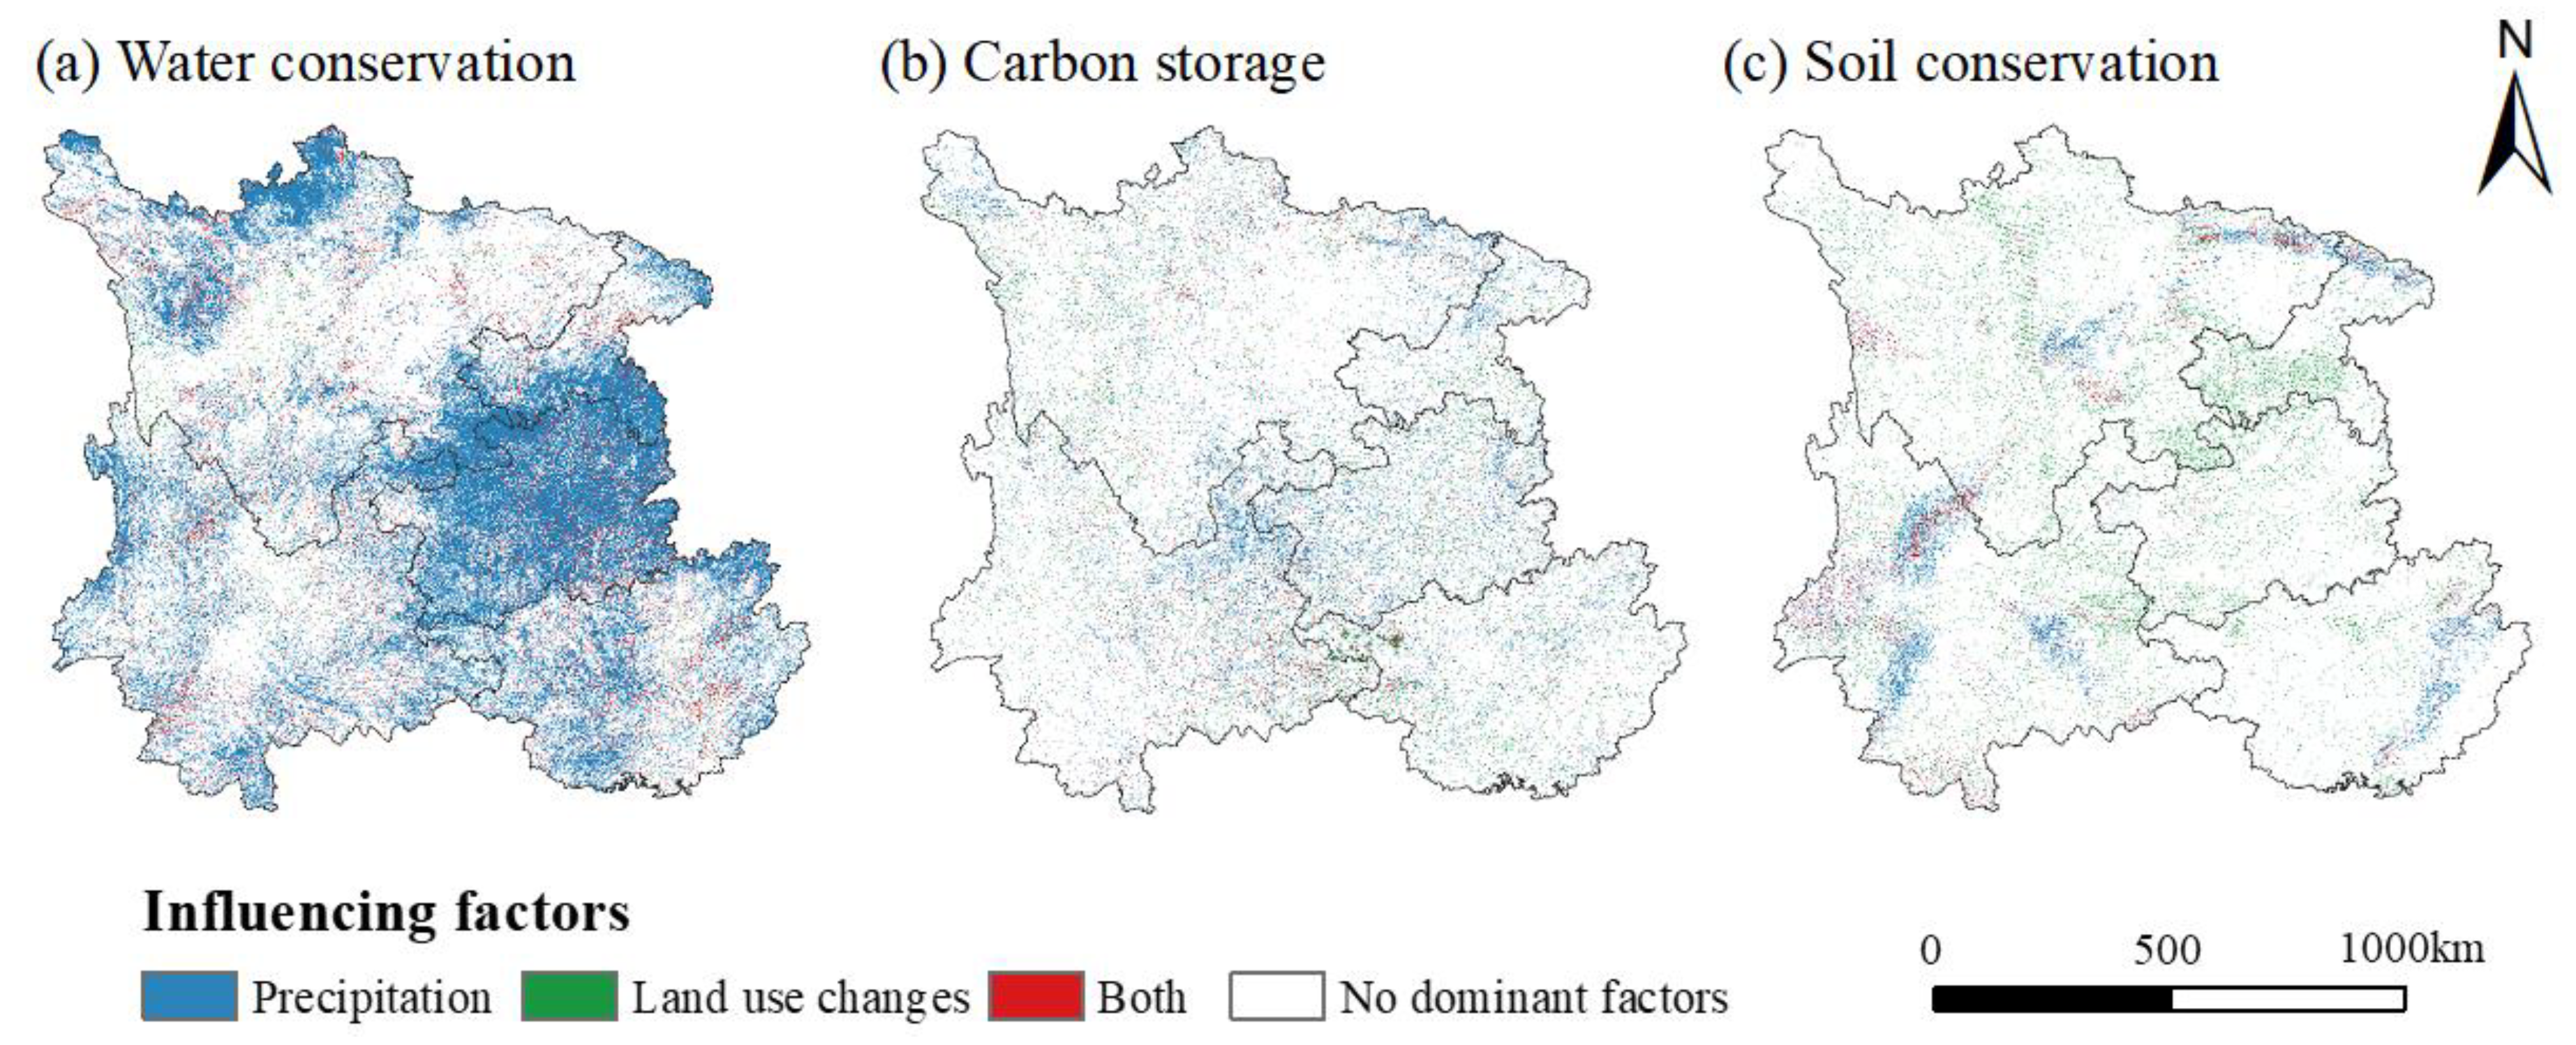
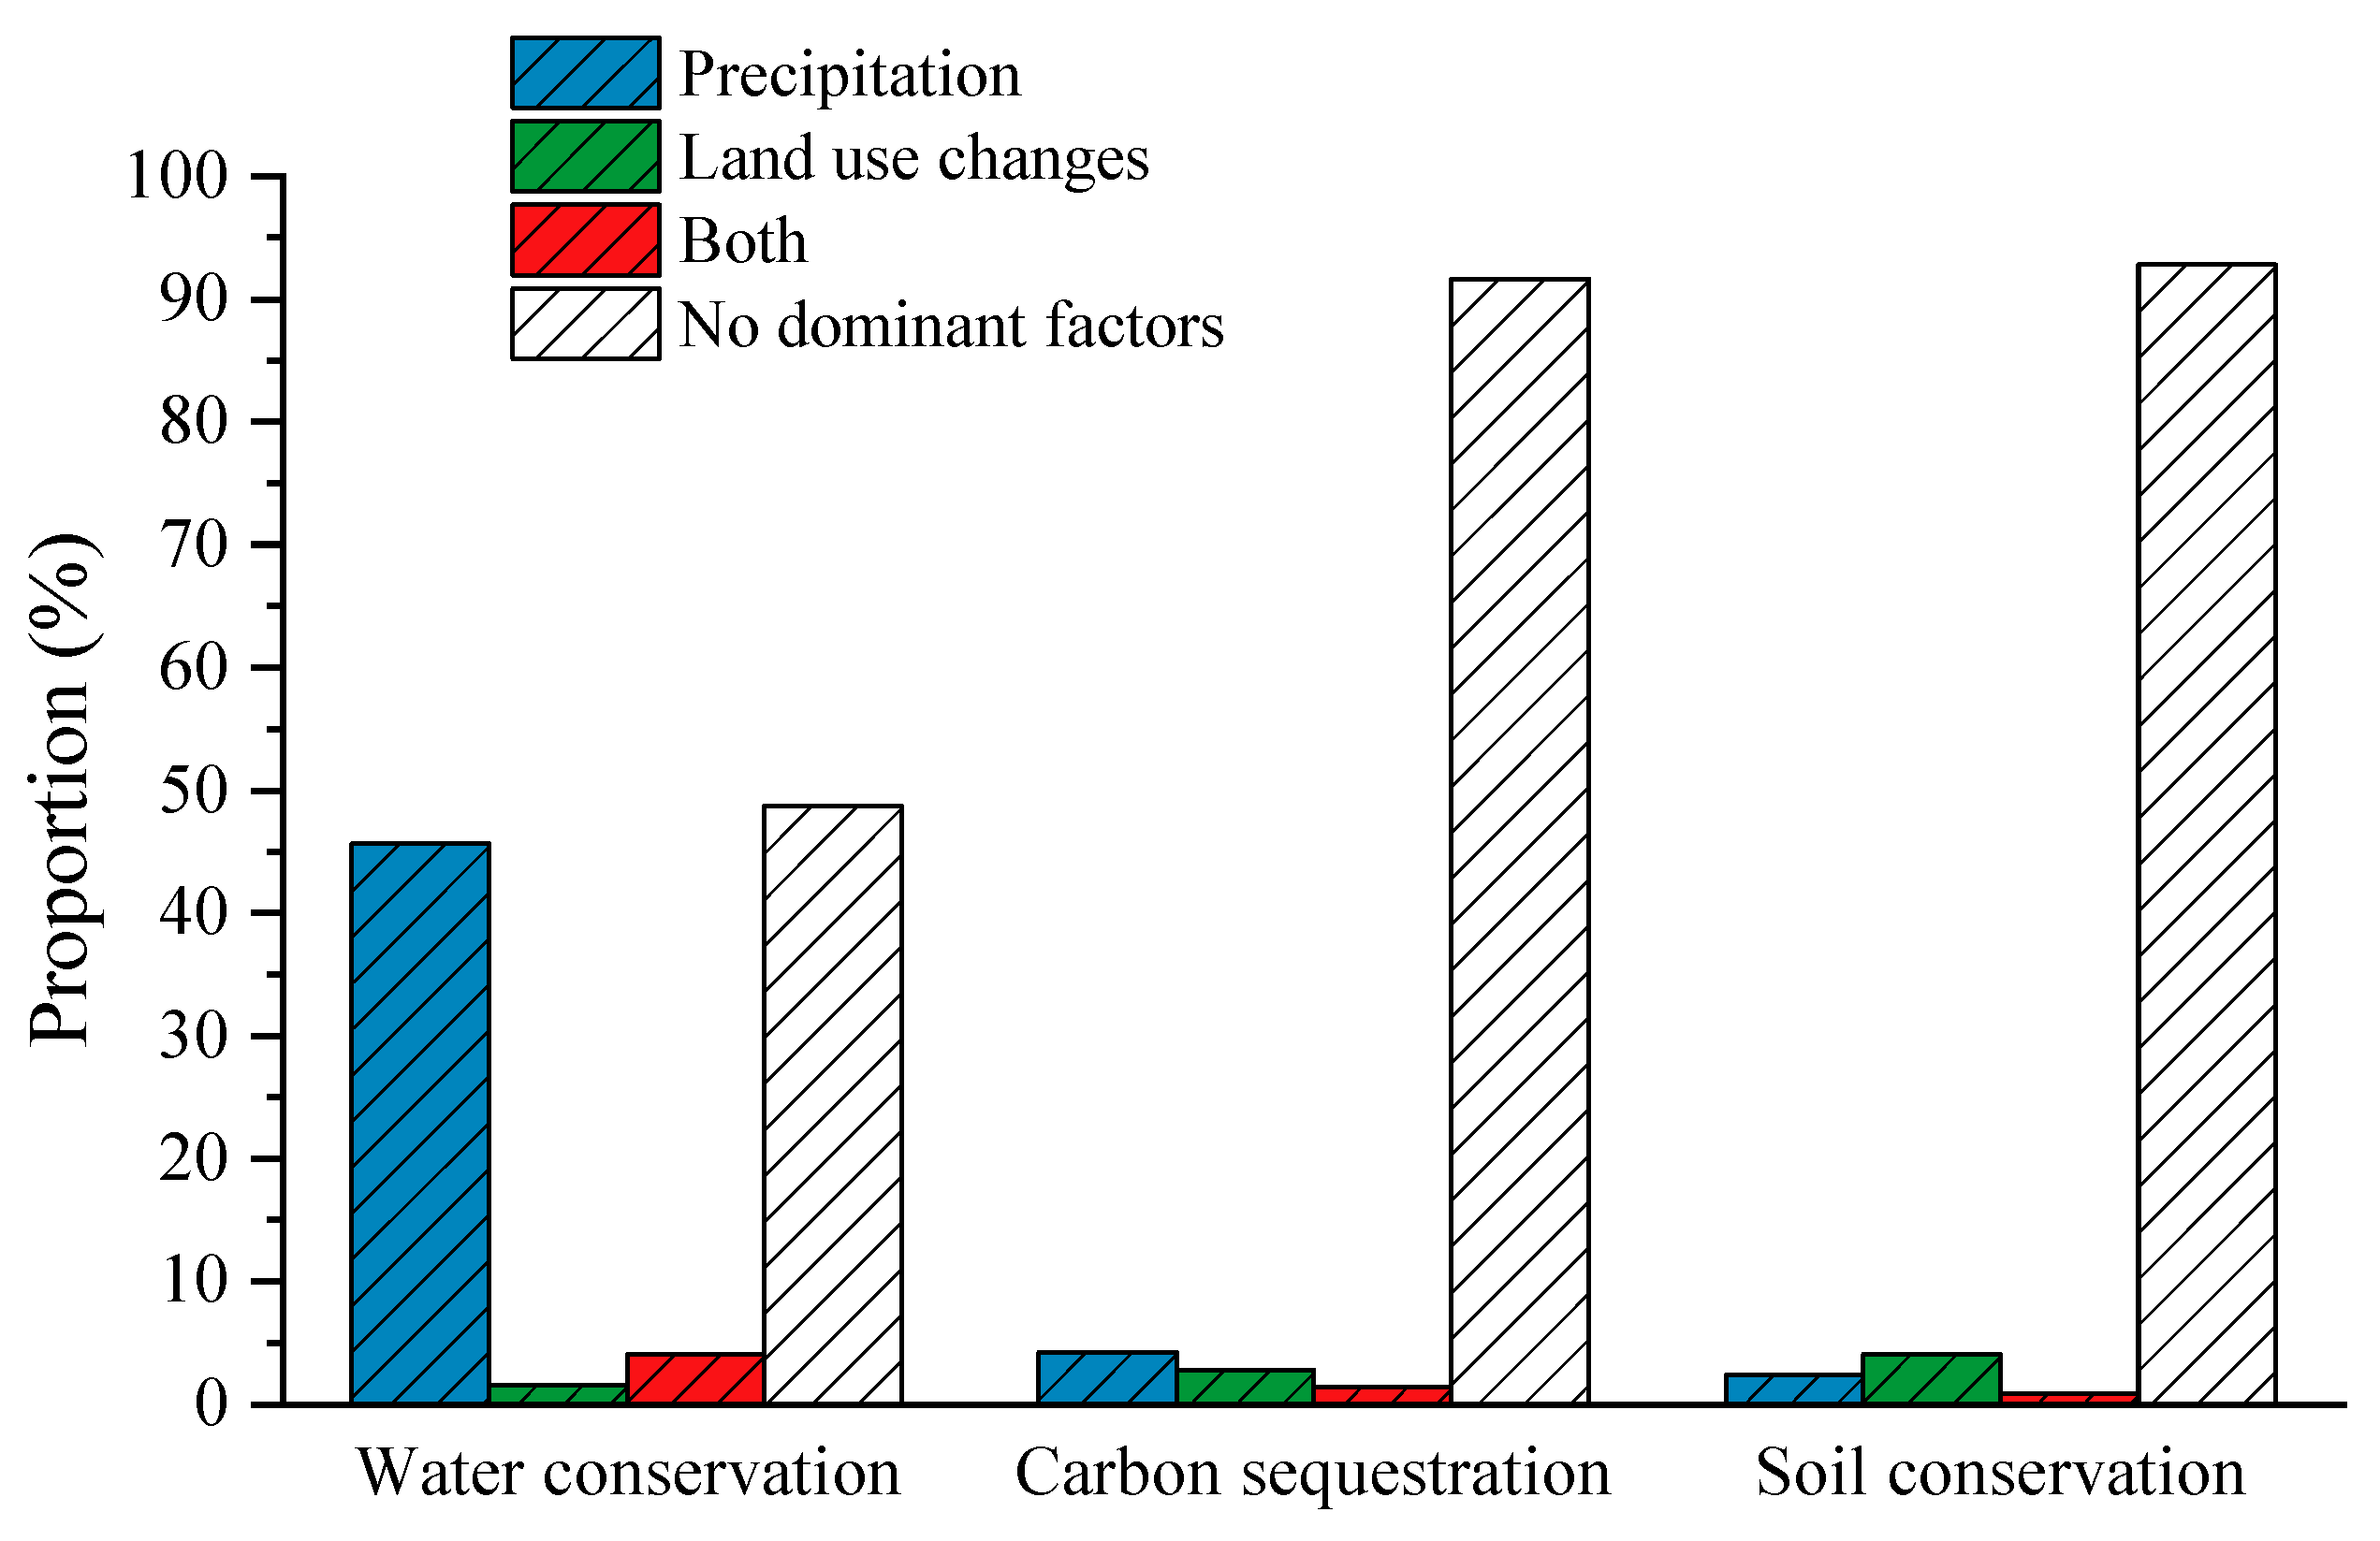
3.3. Effect of Environmental Factors

Spatial partial correlation analysis was utilized to investigate the response of three key ecosystem service functions to precipitation and land use changes (Figure 8 and Figure 9). The results showed that water conservation was mainly controlled by precipitation, accounting for approximately 45.71% (p < 0.05) of the total area, with the highest impact observed in Guizhou, southern Chongqing, and northern Sichuan. Land use changes had relatively little impact, accounting for only 1.50% (p < 0.05) of the total area, while the combined effect of precipitation and land use changes accounted for 4.06% (p < 0.05), and no dominant factors accounted for 48.73% (p < 0.05).
In addition, carbon sequestration and soil conservation were less affected by precipitation, with only 4.19% (p < 0.05) and 2.37% (p < 0.05) of the total area, respectively. Regarding the influencing factors of carbon sequestration, land use changes had less impact than precipitation. Spatial distribution controlled by precipitation was mainly concentrated in the northeast of Yunnan. Land use changes had the largest impact on soil conservation, particularly in southern Chongqing and eastern Yunnan, accounting for approximately 4.04% (p < 0.05) of the total area. The area controlled by precipitation in soil conservation was distributed in western Yunnan, eastern Guangxi, and northern Chongqing. However, for both carbon sequestration and soil conservation, approximately 91.67% (p < 0.05) and 92.79% (p < 0.05) of the study area, respectively, were not affected by either precipitation or land use changes over the past two decades (Figure 8 and Figure 9).

4. Discussion

4.1. Impact of Precipitation on Ecosystem Services

Figure 8 shows that precipitation was the dominant factor for water conservation, which indicates that precipitation effectively accounted for the spatial and temporal trends in water yield [27,69]. The increasing trends of water conservation in northern Sichuan, southern Chongqing, and Guizhou were mainly controlled by precipitation dynamics (Figure 5 and Figure 8). Furthermore, it was noteworthy that extreme precipitation due to climate change under human activities was closely related to water yield [26]. The spatial distribution of water yield during anomalous extreme precipitation years exhibited a similar pattern of variation to that of total extreme precipitation [26].
As shown in Table 2, NEP increased rapidly in the study area post-2010, consistent with the findings of Chen et al. [70], with more than 60% attributed to ecological engineering with significant results. However, the enhancement of ecosystem carbon uptake efficiency through ecological engineering was contingent upon the increases of precipitation and radiation [70]. It can be inferred that the significant increase in precipitation in the northeast of Yunnan and Sichuan during the last two decades was responsible for the significant increase in NEP (Figure 6 and Figure 8). In addition, as with most of the previous studies [71,72], carbon sequestration exhibited a significant increase but decreased during 2000–2010 (Table 2), probably due to drought and the reduction in solar radiation in Southwest China [73]. Drought can lead to decreased plant production, increased mortality, and reduced growth [74,75].
Overall, the annual precipitation and land use changes were not the predominant factors in soil conservation (Figure 8 and Figure 9). Areas of high amounts of soil conservation were primarily concentrated in regions with lower susceptibility to extreme precipitation and higher fractional vegetation cover [26]. Previous studies [76,77,78,79,80] showed that the spatial pattern of fractional vegetation coverage did not align well with that of soil conservation in the study area, except for Sichuan. Based on the research by Eekhout et al. [81], it can be inferred that soil conservation was more affected by extreme precipitation than vegetation in Southwest China. Extreme precipitation enhanced soil erosion through the impact of raindrops on soil particles [82] and the infiltration of excess surface runoff that can promote gully erosion [83]. It should be noted that karst areas in Southwest China are characterized by the special above-ground and underground dual structure and porous media. Therefore, a large amount of soil can be lost during rainfall through bedrock fissures, waterfall holes, and solution channels [84], which was also an important factor affecting the spatial and temporal distribution of soil conservation in Southwest China.

4.2. Impact of Land Use Changes on Ecosystem Services

Land use changes affected the structure and function of ecosystems, which influenced the supply of ecosystem services [85,86]. The expansion of farmland and grassland [87] can simplify ecosystems [86,88] and alter local environmental characteristics [89], thereby affecting the provision of ecosystem services. Xiong et al. [90] suggested that the conversion of large amounts of unused land into farmland and grassland with higher ecological value coefficients was the main reason for the improvement of the ecosystem service functions in karst regions. However, urbanization promoted the conversion of a large amount of farmland into construction land, resulting in the deterioration of ecosystem service functions [91].
The IPCC (Intergovernmental Panel on Climate Change) identified land use changes as a major factor contributing to alterations in carbon sequestration in terrestrial ecosystems [45], owing to the varying carbon sequestration capacities of different land use types [29]. Urbanization-induced shifts from high to low carbon density land use types were identified as the second largest cause of carbon sequestration increase after CO2 emissions from fossil fuel combustion [45]. Thus, it was plausible to hypothesize that the decline in carbon sequestration in the study area was linked to urbanization (Figure 6, Figure 8 and Figure 10). Moreover, land use can impact water conservation function, such as infiltration, runoff, and evapotranspiration, through the water cycle [92,93]. In the south of Chongqing, a significant decrease in soil conservation was observed (Figure 7), which was attributed to land use changes as the dominant factor (Figure 8). Li [94] reported that this region was one of the most economically developed areas in Southwest China, and the accelerated urbanization and relocation of villages and towns (Figure 10) caused a decrease in soil conservation functions [95]. Additionally, ecologically well-conditioned land with high biomass and production had strong soil respiration, which resulted in high CO2 concentrations [96]. In karst regions, the interaction among precipitation, soil CO2, and carbonate rocks led to dissolved inorganic carbon, which was one of the most crucial mechanisms of carbon sequestration [97].
Ecological policies can lead to land use changes. Since 2000, Southwest China has undertaken various ecological restoration projects such as the “Food for Green”, “Natural Forest Protection Project”, “Karst Rock Desertification Restoration Project”, and other ecological restoration projects [66]. In 2008, the Rock Desertification Control Project (RDCP) was started in Southwest China, which significantly improved carbon sequestration and soil conservation in the region [14]. Numerous studies have demonstrated that the afforestation and conservation projects implemented in Southwest China have a significant positive impact on fractional vegetation coverage [14,66]. The increase in fractional vegetation coverage led to significant increases in carbon sequestration and soil conservation, but water conservation did not change significantly or even decreased [25,98]. In karst areas, irrational land use and reduced surface vegetation cover had an amplifying effect on soil conservation [99].

4.3. Management Implications

Ecological restoration projects have made significant contributions to ecosystem services. Precipitation, as a representative of climatic conditions, is one of the most fundamental factors in enhancing ecosystem services [70]. Implementing ecological restoration projects in areas where the climate was predicted to be suitable for vegetation growth (such as due to precipitation) can reap half the benefits. Deforestation bans and afforestation were recognized as activities to mitigate climate change [70,100]. These measures led to an increase in forest cover, accelerated the accumulation of soil organic matter, improved soil biology, and reduced soil erosion [16]. However, they also brought a series of biophysical effects. The carbon cycle warming effects of deforestation were offset by net cooling associated with changes in albedo and evapotranspiration. Afforestation mitigates warming in the tropics, but probably not in subtropical, temperate, and boreal regions [101,102]. Planting large numbers of trees in non-forested areas might also not contribute to climate change mitigation [103]. Single-purpose land use and unrealistic land use policies often upset the balance between ecosystem services [5], resulting in reduced overall services [15]. Spatially oriented land use policies can serve to enhance the value of ecosystem services [5]. For example, after the 1998 floods in China, the overall ecosystem service functions were enhanced by 8.5% in the Poyang Lake area by implementing the project of returning fields to the lake for ecological restoration [104]. Local governments should take these into full consideration when formulating policies to mitigate climate change and tailor them to local conditions, rather than blindly pursuing the expansion of vegetation quantity and area.
However, compared to other studies, this study differs in the amounts and values of ecosystem service functions, probably due to the uncertainty of applied assessment datasets, models, and methods.

5. Conclusions

In this study, we quantified ecosystem services and their trends in Southwest China between 2000 and 2020. Further analysis was also conducted to explore the driving factors of ecosystem service changes. The main conclusions were as follows:
(1) Over the past two decades, the spatial distribution of water conservation showed a decrease from southeast to northwest, the opposite of soil conservation. The regions with an increasing trend in carbon sequestration were concentrated in Guizhou, Guangxi, and Sichuan.
(2) Compared to 2000, the carbon sequestration level in 2020 increased by 94.35%, while water conservation and soil conservation decreased by 4.50% and 0.76%, respectively. The total value of three ecosystem services in Southwest China in 2020 increased by 90.00% compared to 2000.
(3) Next, 4.62% of Southwest China showed a significant increase in water conservation, which was mainly distributed in southern Chongqing, eastern Guangxi, and eastern Sichuan. For carbon storage, 5.83% and 5.15% of the study area showed significant downward and upward trends, respectively. Meanwhile, the trend of soil conservation exhibited a significant increase of 7.52%, which was primarily concentrated in the central areas of Southwest China.
(4) Water conservation was mainly controlled by precipitation, accounting for 45.71% of the total area. Extreme precipitation was also an important factor affecting water yield. Among the factors studied in this study, precipitation had a greater contribution to carbon sequestration (accounting for 4.19%). Annual precipitation only had a low impact (2.37%) on soil conservation. We suggested that extreme precipitation might have a greater impact on it through the impact of raindrops on soil particles.
(5) Land use changes contributed only 1.50% to water conservation functions through the water cycle. It contributed 2.78% to carbon storage, with the increase due to the expansion of vegetation area and its decrease related to urbanization. Moreover, land use changes had a tight negative impact (4.04%) on soil conservation due to accelerated urbanization and village relocation.
(6) We suggested that appropriate ecological restoration projects should be projected based on climate predictions and that ecological policies should be tailored to local conditions, rather than blindly pursuing the expansion of vegetation quantity and area.

Author Contributions

Conceptualization, M.C. and L.Y. (Lu Ye); methodology, M.C., L.Y. (Lu Ye), L.Y. (Li Yao), Z.T. and Q.X.; data collection, M.C. and L.Y. (Lu Ye); analysis and writing, M.C. and C.L.; review, editing, X.T. and Z.D.; supervision and funding acquisition, X.T. All authors have read and agreed to the published version of the manuscript.

Funding

The study was jointly supported by the Special Project on National Science and Technology Basic Resources Investigation of China (Grant No. 2021FY100701) and Fundamental Research Funds for the Central Universities (Grant No. SWU2209225).

Data Availability Statement

All data can be accessed through the provided website.

Conflicts of Interest

The authors declare no conflict of interest.

References

  1. Braat, L.C.; de Groot, R. The ecosystem services agenda: Bridging the worlds of natural science and economics, conservation and development, and public and private policy. Ecosyst. Serv. 2012, 1, 4–15. [Google Scholar] [CrossRef] [Green Version]
  2. Xie, G.; Zhang, C.; Zhen, L.; Zhang, L. Dynamic changes in the value of China’s ecosystem services. Ecosyst. Serv. 2017, 26, 146–154. [Google Scholar] [CrossRef]
  3. Costanza, R.; d’Arge, R.; de Groot, R.; Farber, S.; Grasso, M.; Hannon, B.; Limburg, K.; Naeem, S.; O’Neill, R.V.; Paruelo, J.; et al. The value of the world’s ecosystem services and natural capital. Nature 1997, 387, 253–260. [Google Scholar] [CrossRef]
  4. Zheng, D.; Wang, Y.; Hao, S.; Xu, W.; Lv, L.; Yu, S. Spatial-temporal variation and tradeoffs/synergies analysis on multiple ecosystem services: A case study in the Three-River Headwaters Region of China. Ecol. Indic. 2020, 116, 106494. [Google Scholar] [CrossRef]
  5. Bateman, I.J.; Harwood, A.R.; Mace, G.M.; Watson, R.T.; Abson, D.J.; Andrews, B.; Binner, A.; Crowe, A.; Day, B.H.; Dugdale, S.; et al. Bringing ecosystem services into economic decision-making: Land use in the United Kingdom. Science 2013, 341, 45–50. [Google Scholar] [CrossRef] [PubMed]
  6. Goldscheider, N.; Chen, Z.; Auler, A.S.; Bakalowicz, M.; Broda, S.; Drew, D.; Hartmann, J.; Jiang, G.; Moosdorf, N.; Stevanovic, Z.; et al. Global distribution of carbonate rocks and karst water resources. Hydrogeol. J. 2020, 28, 1661–1677. [Google Scholar] [CrossRef] [Green Version]
  7. Medici, G.; Lorenzi, V.; Sbarbati, C.; Manetta, M.; Petitta, M. Structural Classification, Discharge Statistics, and Recession Analysis from the Springs of the Gran Sasso (Italy) Carbonate Aquifer; Comparison with Selected Analogues Worldwide. Sustainability 2023, 15, 10125. [Google Scholar] [CrossRef]
  8. Sun, M.Y.; Yang, R.J.; Li, X.H.; Zhang, L.; Liu, Q. Designing a path for the sustainable development of key ecological function zones: A case study of southwest China. Glob. Ecol. Conserv. 2021, 31, e01840. [Google Scholar] [CrossRef]
  9. Su, X.; Shen, Y.; Xiao, Y.; Liu, Y.; Cheng, H.; Wan, L.; Zhou, S.; Yang, M.; Wang, Q.; Liu, G. Identifying Ecological Security Patterns Based on Ecosystem Services Is a Significative Practice for Sustainable Development in Southwest China. Front. Ecol. Evol. 2022, 9, 1020. [Google Scholar] [CrossRef]
  10. Banks, D.; Odling, N.E.; Skarphagen, H.; Rohr-Torp, E. Permeability and stress in crystalline rocks. Terra Nova 1996, 8, 223–235. [Google Scholar] [CrossRef]
  11. Manoutsoglou, E.; Lazos, I.; Steiakakis, E.; Vafeidis, A. The Geomorphological and Geological Structure of the Samaria Gorge, Crete, Greece—Geological Models Comprehensive Review and the Link with the Geomorphological Evolution. Appl. Sci. 2022, 12, 10670. [Google Scholar] [CrossRef]
  12. Stober, I.; Bucher, K. Origin of salinity of deep groundwater in crystalline rocks. Terra Nova 1999, 11, 181–185. [Google Scholar] [CrossRef]
  13. Qiu, S.; Peng, J.; Dong, J.; Wang, X.; Ding, Z.; Zhang, H.; Mao, Q.; Liu, H.; Quine, A.T.; Meersmans, J. Understanding the relationships between ecosystem services and associated social-ecological drivers in a karst region: A case study of Guizhou Province, China. Prog. Phys. Geogr. Earth Environ. 2021, 45, 98–114. [Google Scholar] [CrossRef]
  14. Tong, X.; Brandt, M.; Yue, Y.; Horion, S.; Wang, K.; Keersmaecker, W.D.; Tian, F.; Schurgers, G.; Xiao, X.; Luo, Y. Increased vegetation growth and carbon stock in China karst via ecological engineering. Nat. Sustain. 2018, 1, 44–50. [Google Scholar] [CrossRef]
  15. Wang, Q.; Xiong, K.; Zhou, J.; Xiao, H.; Song, S. Impact of land use and land cover change on the landscape pattern and service value of the village ecosystem in the karst desertification control. Front. Environ. Sci. 2023, 11, 1020331. [Google Scholar] [CrossRef]
  16. Han, H.; Su, Z. Research progress and prospects of karst ecosystem services. Carsologica Sin. 2017, 36, 352–358. (In Chinese) [Google Scholar]
  17. Hou, L.; Wu, F.; Xie, X. The spatial characteristics and relationships between landscape pattern and ecosystem service value along an urban-rural gradient in Xi’an City, China. Ecol. Indic. 2020, 108, 105720. [Google Scholar] [CrossRef]
  18. De Groot, R.S.; Fisher, B.; Christie, M.; Aronson, J.; Braat, L.; Haines-Young, R.; Gowdy, J.; Maltby, E.; Neuville, A.; Polasky, S. Integrating the ecological and economic dimensions in biodiversity and ecosystem service valuation. In The Economics of Ecosystems and Biodiversity Ecological and Economic Foundations; Kumar, P., Ed.; Earthscan: London, UK, 2010; pp. 9–40. [Google Scholar]
  19. Schmeller, D.S.; Niemelä, J.; Bridgewater, P. The Intergovernmental Science-Policy Platform on Biodiversity and Ecosystem Services (IPBES): Getting involved. Biodivers. Conserv. 2017, 26, 2271–2275. [Google Scholar] [CrossRef] [Green Version]
  20. Gao, J.; Xiong, K. Ecosystem service value responses to ecological control in Karst region-A case study of Huajiang Gorge Demonstration Area of rocky desertification control in Guizhou. Chin. J. Eco Agric. 2015, 23, 775–784. (In Chinese) [Google Scholar]
  21. Luo, G.; Wang, S.; Li, Y.; Bai, X. Spatio-temporal dynamics and ecological service function assessment of slope farmland in Karst areas of Guizhou province, China. Trans. Chin. Soc. Agric. Eng. 2014, 30, 233–243. (In Chinese) [Google Scholar]
  22. Başkent, E.Z. Assessment and valuation of key ecosystem services provided by two forest ecosystems in Turkey. J. Environ. Manag. 2021, 285, 112135. [Google Scholar] [CrossRef]
  23. Liu, G.; Shao, Q.; Fan, J.; Ning, J.; Huang, H.; Liu, S.; Zhang, X.; Niu, L.; Liu, J. Spatio-temporal changes, trade-offs and synergies of major ecosystem services in the Three-River Headwaters Region from 2000 to 2019. Remote Sens. 2022, 14, 5349. [Google Scholar] [CrossRef]
  24. Mendoza-Ponce, A.; Corona-Nunez, R.; Kraxner, F.; Leduc, S.; Patrizio, P. Identifying effects of land use cover changes and climate change on terrestrial ecosystems and carbon stocks in Mexico. Glob. Environ. Chang. 2018, 53, 12–23. [Google Scholar] [CrossRef] [Green Version]
  25. Peng, J.; Tian, L.; Zhang, Z.; Zhao, Y.; Green, S.M.; Quine, T.A.; Liu, H.; Meersmans, J. Distinguishing the impacts of land use and climate change on ecosystem services in a karst landscape in China. Ecosyst. Serv. 2020, 46, 101199. [Google Scholar] [CrossRef]
  26. Dai, X.; Wang, L.; Li, X.; Gong, J.; Cao, Q. Characteristics of the extreme precipitation and its impacts on ecosystem services in the Wuhan Urban Agglomeration. Sci. Total Environ. 2023, 864, 161045. [Google Scholar] [CrossRef]
  27. Guo, Q.; Yu, C.; Xu, Z.; Yang, Y.; Wang, X. Impacts of climate and land-use changes on water yields: Similarities and differences among typical watersheds distributed throughout China. J. Hydrol. Reg. Stud. 2023, 45, 101294. [Google Scholar] [CrossRef]
  28. Winkler, K.; Fuchs, R.; Rounsevell, M.; Herold, M. Global land use changes are four times greater than previously estimated. Nat. Commun. 2021, 12, 2501. [Google Scholar] [CrossRef] [PubMed]
  29. Wang, Y.; Liang, D.; Wang, J.; Zhang, Y.; Chen, F.; Ma, X. An analysis of regional carbon stock response under land use structure change and multi-scenario prediction, a case study of Hefei, China. Ecol. Indic. 2023, 151, 110293. [Google Scholar] [CrossRef]
  30. Yang, S.; Zhao, W.; Liu, Y.; Wang, S.; Wang, J.; Zhai, R. Influence of land use change on the ecosystem service trade-offs in the ecological restoration area: Dynamics and scenarios in the Yanhe watershed, China. Sci. Total Environ. 2018, 644, 556–566. [Google Scholar] [CrossRef]
  31. Nie, Y.P.; Chen, H.S.; Wang, K.L.; Yang, J. Water source utilization by woody plants growing on dolomite outcrops and nearby soils during dry seasons in karst region of Southwest China. J. Hydrol. 2012, 420, 264–274. [Google Scholar] [CrossRef]
  32. Zhao, Z.; Wu, X.; Li, G.; Li, J. Drought in southwestern China and its impact on the net primary productivity of vegetation from 2009–2011. Acta Ecol. Sin. 2015, 35, 350–360. (In Chinese) [Google Scholar]
  33. Sun, M.M.; Yang, R.; Tang, Y.X.; Xiao, D.; Zhang, W.; Xu, Z.H.; Shi, Z.H.; Hu, P.L.; Wu, H.Q.; Wang, K.L. Lithologic Control of Soil C:N:P Stoichiometry across a Climatic Gradient in Southwest China. J. Soils Sediments 2023, 23, 1662–1673. [Google Scholar] [CrossRef]
  34. Jing, J.; Deng, Q.; He, C.; Wang, Y.; Ma, B. Spatiotemporal evolution of NDVI and its climate driving factors in the Southwest karst area from 1999 to 2019. Soil Water Conserv. China 2023, 30, 232–239. (In Chinese) [Google Scholar]
  35. Shi, X.; Yu, D.; Warner, E.; Sun, W.; Petersen, G.; Gong, Z.; Lin, H. Cross-Reference System for Translating Between Soil Classification of China and Soil Taxonomy. Soil Sci. Soc. Am. J. 2006, 70, 78–83. [Google Scholar] [CrossRef] [Green Version]
  36. Peng, S.; Ding, Y.; Wen, Z.; Chen, Y.; Cao, Y.; Ren, J. Spatiotemporal change and trend analysis of potential evapotranspiration over the Loess Plateau of China during 2011–2100. Agric. For. Meteorol. 2017, 233, 183–194. [Google Scholar] [CrossRef] [Green Version]
  37. Ding, Y.; Peng, S. Spatiotemporal Trends and Attribution of Drought across China from 1901–2100. Sustainability 2020, 12, 477. [Google Scholar] [CrossRef] [Green Version]
  38. Peng, S.; Ding, Y.; Liu, W.; Li, Z. 1 km monthly temperature and precipitation dataset for China from 1901 to 2017. Earth Syst. Sci. Data 2019, 11, 1931–1946. [Google Scholar] [CrossRef] [Green Version]
  39. Peng, S.; Gang, C.; Cao, Y.; Chen, Y. Assessment of climate change trends over the Loess Plateau in China from 1901 to 2100. Int. J. Climatol. 2018, 38, 2250–2264. [Google Scholar] [CrossRef]
  40. Shangguan, W.Y.; Dai, B.; Liu, A.; Zhu, Q.; Duan, L.; Wu, D.; Ji, A.; Ye, H.; Yuan, Q.; Zhang, D.; et al. A China Dataset of Soil Properties for Land Surface Modeling. J. Adv. Model. Earth Syst. 2013, 5, 212–224. [Google Scholar] [CrossRef]
  41. Chen, M.; Lin, Z.; Zhou, Z.; Zhou, X.; Wu, B.; Wang, Z. An evaluation of karst mountainous ecosystem services based on InVEST model in Guiyang. Guizhou For. Sci. Technol. 2022, 50, 56–61. (In Chinese) [Google Scholar]
  42. Takaku, J.; Tadono, T. Quality Updates of ‘AW3D’ Global DSM Generated from ALOS PRISM. In Proceedings of the 2017 IEEE International Geoscience and Remote Sensing Symposium (IGARSS), Fort Worth, TX, USA, 23–28 July 2017; pp. 5666–5669. [Google Scholar]
  43. Nikolakopoulos, K.G. Accuracy assessment of ALOS AW3D30 DSM and comparison to ALOSPRISM DSM create with classical photogrammetric techniques. Eur. J. Remote Sens. 2020, 53, 39–52. [Google Scholar] [CrossRef]
  44. Ran, P.; Li, S.; Zhuo, G.; Wang, X.; Meng, M.; Liu, L.; Chen, Y.; Huang, H.; Ye, Y.; Lei, X. Early Identification and Influencing Factors Analysis of Active Landslides in Mountainous Areas of Southwest China Using SBAS−InSAR. Sustainability 2023, 15, 4366. [Google Scholar] [CrossRef]
  45. Chang, X.; Xing, Y.; Wang, J.; Yang, H.; Gong, W. Effects of land use and cover change (LUCC) on terrestrial carbon stocks in China between 2000 and 2018. Resour. Conserv. Recycl. 2022, 182, 106333. [Google Scholar] [CrossRef]
  46. Liu, J.; Tian, H.; Liu, M.; Zhuang, D.; Melillo, J.M.; Zhang, Z. China’s changing landscape during the 1990s: Large-scale land transformations estimated with satellite data. Geophys. Res. Lett. 2005, 2, 32. [Google Scholar] [CrossRef] [Green Version]
  47. Chen, J.M.; Ju, W.; Ciais, P.; Viovy, N.; Liu, R.; Liu, Y.; Lu, X. Vegetation structural change since 1981 significantly enhanced the terrestrial carbon sink. Nat. Commun. 2019, 10, 4259. [Google Scholar] [CrossRef] [Green Version]
  48. He, Q.; Ju, W.; Dai, S.; He, W.; Song, L.; Wang, S.; Li, X.; Mao, G. Drought risk of global terrestrial gross primary productivity over the last 40 years detected by a remote sensing-drivenprocess model. J. Geophys. Res. Biogeosci. 2021, 126, e2020JG005944. [Google Scholar] [CrossRef]
  49. Zhang, J.; Yang, S.; Yang, S.; Fan, L.; Zhou, X. Spatio-Temporal Variations of Ecosystem Water Use Efficiency and Its Drivers in Southwest China. Land 2023, 12, 397. [Google Scholar] [CrossRef]
  50. Zhang, W.; Arteaga, J.; Cashion, D.K.; Chen, G.; Gangadharmath, U.; Gomez, L.F.; Kasi, D.; Lam, C.; Liang, Q.; Liu, C.; et al. A highly selective and specific PET tracer for imaging of taupathologies. J. Alzheimer’s Dis. 2012, 31, 601–612. [Google Scholar] [CrossRef]
  51. Sharp, R.; Tallis, H.T.; Ricketts, T.; Guerry, A.D.; Wood, S.A.; Chaplin-Kramer, R.; Nelson, E.; Ennaanay, D.; Wolny, S.; Olwero, N.; et al. InVEST 3.2.0 User’s Guide; Stanford Woods Institute for the Environment: Stanford, CA, USA, 2015. [Google Scholar]
  52. Liu, S.; Chen, J.; Guan, S.; Cui, J. Influence of land use change on water conservation function in Yangxi River Basin based on InVEST model. Sci. Technol. Eng. 2022, 22, 4746–4751. (In Chinese) [Google Scholar]
  53. Liu, J.; Fu, B.; Zhang, C.; Hu, Z.; Wang, Y. Assessment of ecosystem water retention and its value in the upper reaches of Minjiang River based on InVEST model. Res. Environ. Yangtze Basin 2019, 28, 577–585. (In Chinese) [Google Scholar]
  54. Song, Y.; Wei, K.; Guo, R. Assessment of ecosystem services of urban green space in Mengzi City. For. Inv. Plan. 2022, 47, 191–195. (In Chinese) [Google Scholar]
  55. Koirala, P.; Thakuri, S.; Joshi, S.; Chauhan, R. Estimation of soil erosion in Nepal using a RUSLE modeling and geospatial tool. Geosciences 2019, 9, 147. [Google Scholar] [CrossRef] [Green Version]
  56. Zhuang, Y. An Estimation of Soil Loss Based on RS and GIS in China. Master’s Thesis, Nanjing Forestry University, Nanjing, China, 2018. (In Chinese). [Google Scholar]
  57. Renard, K.G.; Foster, G.R.; Weesies, G.A. Predicting soil erosion by water: A guide to conservation planning with the revised universal soil loss equation (RUSLE). In Agriculture Handbook Number 703; USDA-ARS: Washington, DC, USA, 1997; p. 404. [Google Scholar]
  58. De Almeida, A.Q.; Souza, R.M.S.; Loureiro, D.C.; Pereira, D.D.; Cruz, M.A.S.; Vieira, J.S. Modelling the spatial dependence of the rainfall erosivity index in the Brazilian semiarid region. Pesq. Agropec. Bras. 2017, 52, 371–379. [Google Scholar] [CrossRef] [Green Version]
  59. Sun, Y.; Li, N.; Huang, B.; Zhao, X.; Yan, H.; Cao, Y. Analysis of temporal and spatial changes and influencing factors of soil conservation in the Loess Plateau from 2000 to 2019. Res. Soil Water Conserv. 2022, 29, 290–297. (In Chinese) [Google Scholar]
  60. Sujatha, E.R.; Sridhar, V. Spatial Prediction of Erosion Risk of a small mountainous watershed using RUSLE: A case-study of the Palar sub-watershed in Kodaikanal, South India. Water 2018, 10, 1608. [Google Scholar] [CrossRef] [Green Version]
  61. Zhang, H.; Yang, Q.; Li, R.; Liu, Q.; Moore, D.; He, P.; Ritsema, C.J.; Geissen, V. Extension of a GIS procedure for calculating the RUSLE equation LS factor. Comput. Geosci. 2013, 52, 177–188. [Google Scholar] [CrossRef]
  62. Huang, X. Study on Land Use Change and Ecosystem Services Trade-off in Karst-coastal Zone of Southwest Guangxi. Master’s Thesis, Nanning Normal University, Nanning, China, 2021. (In Chinese). [Google Scholar]
  63. Wang, Q. Research on the Evaluation of Ecosystem Services in the Yangtze River Delta and Its Value Realization Mechanism. Master’s Thesis, Nanjing Forestry University, Nanjing, China, 2022. (In Chinese). [Google Scholar]
  64. Wu, N.; Song, X.; Kang, W.; Deng, X.; Hu, X.; Shi, P.; Liu, Y. Standard of payment for ecosystem services in a watershed based on InVEST model under different standpoints: A case study of the Weihe River in Gansu Province. Acta Ecol. Sin. 2018, 38, 2512–2522. (In Chinese) [Google Scholar]
  65. Qiu, C.; Mao, Q.; Dong, Q. Estimation of Soil Conservation Ecological services function value and its temporal and spatial changes in the Loess Plateau. J. Anhui Agric. Sci. 2018, 46, 104–107. (In Chinese) [Google Scholar]
  66. Duan, C.; Li, J.; Chen, Y.; Ding, Z.; Ma, M.; Xie, J.; Yao, L.; Tang, X. Spatiotemporal dynamics of terrestrial vegetation and its driver analysis over southwest China from 1982 to 2015. Remote Sens. 2022, 14, 2497. [Google Scholar] [CrossRef]
  67. Yin, L.; Feng, X.; Fu, B.; Chen, Y.; Wang, X.; Tao, F. Irrigation water consumption of irrigated cropland and its dominant factor in China from 1982 to 2015. Adv. Water Resour. 2020, 143, 103661. [Google Scholar] [CrossRef]
  68. Liu, X.; Zhu, X.; Li, S.; Liu, Y.; Pan, Y. Changes in growing season vegetation and their associated driving forces in China during 2001–2012. Remote Sens. 2015, 7, 15517–15535. [Google Scholar] [CrossRef] [Green Version]
  69. Zhang, M.; Zhang, C.; Wang, K.; Yue, Y.; Qi, X.; Fan, F. Spatiotemporal variation of karst ecosystem service values and its correlation with environmental factors in northwest Guangxi, China. Environ. Manag. 2011, 48, 933–944. [Google Scholar] [CrossRef]
  70. Chen, Y.; Feng, X.; Tian, H.; Wu, X.; Gao, Z.; Feng, Y.; Piao, S.; Lv, N.; Pan, N.; Fu, B. Accelerated increase in vegetation carbon sequestration in China after 2010: A turning point resulting from climate and human interaction. Glob. Chang. Biol. 2021, 27, 5848–5864. [Google Scholar] [CrossRef]
  71. Liang, W.; Yang, Y.; Fan, D.; Guan, H.; Zhang, T.; Long, D.; Zhou, Y.; Bai, D. Analysis of spatial and temporal patterns of net primary production and their climate controls in China from 1982 to 2010. Agric. For. Meteorol. 2015, 204, 22–36. [Google Scholar] [CrossRef]
  72. Wang, J.; Dong, J.; Yi, Y.; Lu, G.; Oyler, J.; Smith, W.K.; Zhao, M.; Liu, J.; Running, S. Decreasing net primary production due to drought and slight decreases in solar radiation in China from 2000 to 2012. J. Geophys. Res-Biogeo. 2017, 122, 261–278. [Google Scholar] [CrossRef] [Green Version]
  73. Ji, Y.; Zhou, G.; Luo, T.; Dan, Y.; Zhou, L.; Lv, X. Variation of net primary productivity and its drivers in China’s forests during 2000–2018. For. Ecosyst. 2020, 7, 15. [Google Scholar] [CrossRef] [Green Version]
  74. Yuan, W.; Cai, W.; Chen, Y.; Liu, S.; Dong, W.; Zhang, H.; Yu, G.; Chen, Z.; He, H.; Guo, W. Severe summer heatwave and drought strongly reduced carbon uptake in Southern China. Sci. Rep. 2016, 6, 18813. [Google Scholar] [CrossRef] [Green Version]
  75. Phillips, O.L.; Aragão, L.E.O.C.; Lewis, S.L.; Fisher, J.B.; Lloyd, J.; López-González, G.; Malhi, Y.; Monteagudo, A.; Peacock, J.; Quesada, C.A. Drought sensitivity of the Amazon rainforest. Science 2009, 323, 1344–1347. [Google Scholar] [CrossRef] [Green Version]
  76. Cheng, D.; Li, X. Vegetation coverage change in a karst area and effects of terrain and population. J. Geo-Inf. Sci. 2019, 21, 1227–1239. (In Chinese) [Google Scholar]
  77. Feng, B.; Dong, Y. Spatial-temporal changes of vegetation coverage and topographic effect in Yunnan Province from 2010 to 2020. J. Zhejiang For. Sci. Technol. 2022, 42, 23–32. (In Chinese) [Google Scholar]
  78. He, L.; Jian, J. Remote sensing dynamic monitoring on temporal and spatial changes of vegetation coverage in Sichuan Province from 2009 to 2020. Bull. Soil Water Conserv. 2022, 42, 203–209. (In Chinese) [Google Scholar]
  79. He, Q.; Mu, F.; Li, Q.; Yang, M. Geography Study on spatiotemporal evolution of fractional vegetation coverage and the driving forces in Chongqing. Sci. Technol. Eng. 2021, 21, 11955–11962. (In Chinese) [Google Scholar]
  80. Yang, J.; Di, G. Analysis on the temporal and spatial variation and diversification factors of vegetation coverage in Guangxi Zhuang Autonomous Region. Fujian Agric. 2023, 54, 58–65. (In Chinese) [Google Scholar]
  81. Eekhout, J.P.C.; de Vente, J. Global impact of climate change on soil erosion and potential for adaptation through soil conservation. Earth Sci. Rev. 2022, 226, 103921. [Google Scholar] [CrossRef]
  82. Morgan, R.P.C.; Nearing, M. Handbook of Erosion Modelling; John Wiley & Sons: Hoboken, NJ, USA, 2016. [Google Scholar]
  83. Eekhout, J.P.C.; Hunink, J.E.; Terink, W.; de Vente, J. Why increased extreme precipitation under climate change negatively affects water security. Hydrol. Earth Syst. Sci. 2018, 22, 5935–5946. [Google Scholar] [CrossRef] [Green Version]
  84. Wang, K.; Zhang, C.; Chen, H.; Yue, Y.; Zhang, W.; Zhang, M.; Qi, X.; Fu, Z. Karst landscapes of China: Patterns, ecosystem processes and services. Landsc. Ecol. 2019, 34, 2743–2763. [Google Scholar] [CrossRef] [Green Version]
  85. Li, Z.; Xia, J.; Deng, X.; Yan, H. Multilevel modelling of impacts of human and natural factors on ecosystem services change in an oasis, Northwest China. Resour. Conserv. Recycl. 2021, 169, 105474. [Google Scholar] [CrossRef]
  86. Watanabe, M.D.B.; Ortega, E. Dynamic emergy accounting of water and carbon ecosystem services: A model to simulate the impacts of land-use change. Ecol. Modell. 2014, 271, 113–131. [Google Scholar] [CrossRef]
  87. Lambin, E.F.; Meyfroidt, P. Global land use change, economic globalization, and the looming land scarcity. Proc. Natl. Acad. Sci. USA 2011, 108, 3465–3472. [Google Scholar] [CrossRef]
  88. Altieri, M.A. The ecological role of biodiversity in agro-ecosystems. In Practical Use of Invertebrates to Assess Sustainable Land Use; Elsevier: Amsterdam, The Netherlands, 1999; Volume 74, pp. 19–31. [Google Scholar]
  89. Matson, P.A.; Parton, W.J.; Power, A.G.; Swift, M.J. Agricultural intensification and ecosystem properties. Science 1997, 277, 504–509. [Google Scholar] [CrossRef] [Green Version]
  90. Xiong, Y.; Xie, G.; Zeng, G.; Wang, K.; Yang, C. Influence of Karst emigration region land use change on ecosystem service value-using Guangxi Huanjiang County as example. Chin. Environ. Sci. 2008, 3, 210–214. (In Chinese) [Google Scholar]
  91. Ma, F.; Liu, J.; Eneji, A.E. A review of ecosystem services and research perspectives. Acta Ecol. Sin. 2013, 33, 5963–5972. (In Chinese) [Google Scholar]
  92. Farley, K.A.; Jobbágy, E.G.; Jackson, R.B. Effects of afforestation on water yield: A global synthesis with implications for policy. Glob. Chang. Biol. 2005, 11, 1565–1576. [Google Scholar] [CrossRef]
  93. Guo, X.; Zhang, Y.; Guo, D.; Lu, W.; Xu, H. How does ecological protection redline policy affect regional land use and ecosystem services? Environ. Impact Assess. Rev. 2023, 100, 107062. [Google Scholar] [CrossRef]
  94. Li, X. 20 Years of Western Development: A comparison within the southwest region. Econ. Res. Guide 2022, 18, 35–37. (In Chinese) [Google Scholar]
  95. Li, S.; Bing, Z.; Jin, G. Spatially explicit mapping of soil conservation service in monetary units due to land use/cover change for the Three Gorges Reservoir Area, China. Remote Sens. 2019, 11, 468. [Google Scholar] [CrossRef] [Green Version]
  96. Frank, A.B.; Liebig, M.A.; Tanaka, D.L. Management effects on soil CO2 efflux in northern Semiarid grassland and cropland. Soil Tillage Res. 2006, 89, 78–85. [Google Scholar] [CrossRef]
  97. Chen, L.; Tan, L.; Zhao, M.; Sinha, A.; Wang, T.; Gao, Y. Karst carbon sink processes and effects: A review. Quat. Int. 2023, 652, 63–73. [Google Scholar] [CrossRef]
  98. Peng, L.; Chen, T.; Deng, W.; Liu, Y. Exploring ecosystem services trade-offs using the Bayesian belief network model for ecological restoration decision-making: A case study in Guizhou Province, China. Ecol. Indic. 2022, 135, 108569. [Google Scholar] [CrossRef]
  99. Yang, C. Research progress on soil erosion in karst areas. Soil Water Conserv. China 2012, 3, 15–17+34. (In Chinese) [Google Scholar]
  100. Teng, X.; Liu, F.-P.; Chiu, Y.-H. The change in energy and carbon emissions efficiency after afforestation in China by applying a modified dynamic SBM model. Energy 2021, 216, 119301. [Google Scholar] [CrossRef]
  101. Bala, G.; Caldeira, K.; Wickett, M.; Phillips, T.J.; Lobell, D.B.; Delire, C.; Mirin, A. Combined climate and carbon-cycle effects of large-scale deforestation. Proc. Natl. Acad. Sci. USA 2007, 104, 6550–6555. [Google Scholar] [CrossRef] [PubMed]
  102. Li, G.; Wu, C.; Chen, Y.; Huang, C.; Zhao, Y.; Wang, Y.; Ma, M.; Ding, Z.; Yu, P.; Tang, X. Increasing temperature regulates the advance of peak photosynthesis timing in the boreal ecosystem. Sci. Total Environ. 2023, 882, 163587. [Google Scholar] [CrossRef] [PubMed]
  103. Arora, V.K.; Montenegro, A. Small temperature benefits provided by realistic afforestation efforts. Nat. Geosci. 2011, 4, 514–518. [Google Scholar] [CrossRef]
  104. Long, X.; Zhan, L.; Cheng, S.; Yan, B.; Ma, L.; Pan, Y.; Jiang, L.; Yang, L.; Cao, X. Impact of the 1998 flood on ecosystem services in the Poyang Lake Region, China. Resour. Sci. 2012, 34, 220–228. (In Chinese) [Google Scholar]
Figure 1. (a) Location of Southwest China and its five provinces, including Chongqing, Guangxi, Guizhou, Sichuan, and Yunnan. (b) Digital elevation model in Southwest China, ranging from a minimum elevation of −44 m to a maximum of 7427 m, displays a declining trend from west to east.
Sustainability 15 12331 g001
Figure 2. Distribution of water yield in Southwest China.
Sustainability 15 12331 g002
Figure 3. Distribution of carbon sequestration in Southwest China.
Sustainability 15 12331 g003
Figure 4. Distribution of soil conservation in Southwest China.
Sustainability 15 12331 g004
Figure 5. Spatial trend analysis and associated significant level of water yield in Southwest China from 2000 to 2020. Gray dots indicate areas that passed the significance test (p < 0.05). The bar graphs represent the frequency of the p value in the study area.
Sustainability 15 12331 g005
Figure 6. Spatial trend analysis and associated significant level of carbon sequestration in Southwest China from 2000 to 2020. Gray dots indicate areas that passed the significance test (p < 0.05). The bar graphs represent the frequency of the p value in the study area.
Sustainability 15 12331 g006
Figure 7. Spatial trend analysis and associated significant level of soil conservation in Southwest China from 2000 to 2020. Gray dots indicate areas that passed the significance test (p < 0.05). The bar graphs represent the frequency of the p value in the study area.
Sustainability 15 12331 g007
Figure 8. Spatial distribution of factors influencing ecosystem service functions over Southwest China during 2000–2020. Precipitation, land use changes, both and no dominant factors, regulating water conservation (a), carbon sequestration (b), and soil conservation (c) are represented by blue, green, red, and hollow portions, respectively.
Sustainability 15 12331 g008
Figure 9. Proportion of factors influencing ecosystem service functions over Southwest China during 2000–2020. The bar graphs represent the proportion of precipitation, land use changes, and both and no dominant factors controlling three ecosystem service functions at p < 0.05. Except for no dominant factors, precipitation had the most influence on water conservation and soil conservation, while land use changes had the most influence on carbon sequestration.
Sustainability 15 12331 g009
Figure 10. Distribution of land use in the study area.
Sustainability 15 12331 g010
Table 1. Crop management factor (C) and conservation support practice factor (P) of different types of land use.
Land UseCP
Construction land01
Farmland0.30.2
Forestland0.051
Grassland0.31
Unused land11
Waters00
Table 2. The amount of ecosystem service functions in Southwest China from 2000 to 2020.
Ecosystem Service Functions 200020052010201520202000–2020 Change Rate
water conservation (m3)1.11 × 10128.69 × 10119.30 × 10111.12 × 10121.06 × 1012−4.50%
carbon sequestration (t)3.01 × 1076.31 × 1061.34 × 1077.66 × 1075.85 × 10794.35%
soil conservation (t)1.31 × 10101.28 × 10101.28 × 10101.29 × 10101.30 × 1010−0.76%
Table 3. The values of ecosystem service functions in Southwest China from 2000 to 2020.
Ecosystem Service Functions (Billion Yuan)200020052010201520202000–2020 Change Rate
water conservation1350.461599.582020.442784.323205.01137.33%
carbon sequestration4.177.258.664.284.466.95%
soil conservation5172.637974.9010,564.1210,079.589192.0877.71%
total6527.269581.7412,593.2212,868.1912,401.5590.00%
Disclaimer/Publisher’s Note: The statements, opinions and data contained in all publications are solely those of the individual author(s) and contributor(s) and not of MDPI and/or the editor(s). MDPI and/or the editor(s) disclaim responsibility for any injury to people or property resulting from any ideas, methods, instructions or products referred to in the content.

