Abstract
Controlled-release fertilizer is one of the best fertilizer management strategies for improving the yield and nitrogen use efficiency of transplanted seedling rice. Wet direct-seeded rice has gradually replaced transplanted seedling rice since it saves labor. In addition, it is conducive to mechanization promotion. However, the effects of controlled-release fertilizers on wet direct-seeded rice remain largely unknown. A two-year field experiment aimed to compare the effects of controlled-release blended fertilizer at two rates (basal N to tiller N ratio = 7:3 (CRBF+U), CRBF alone), urea at two rates (basal–tiller ratio of 4:6 (U40), 6:4 (U60)) and a control (no N fertilizer) on the ammonia volatilization (AV) loss, nitrogen runoff loss, accumulation, transport, utilization and yield of rice. The nitrogen runoff loss in wet direct-seeded rice paddy fields was concentrated from sowing to the three-leaf and one-leaflet stage, and the loss rat was lowest after CRBF+U (11.41–12.94%). AV loss rate was lowest after CRBF (3.41%), followed by CRBF+U (3.55–3.89%). CRBF+U increased nitrogen accumulation by extending the duration of rapid nitrogen growth and accelerating maximum nitrogen growth. CRBF+U also increased the nitrogen transport rate of stems, sheaths and leaves from full heading to maturity, and intensified the increase in nitrogen in panicles, increasing the harvest index, agronomy utilization rate and apparent utilization rate of nitrogen. Finally, the grain number per panicle, seed-setting rate and actual yield of rice were significantly improved. In conclusion, CRBF+U can reduce nitrogen runoff loss and AV loss and can improve the yield and nitrogen use efficiency of wet direct-seeded rice.
1. Introduction
China’s rice planting area and grain yield in 2019 were 29,960 million hm2 and 211.405 million tons, respectively, accounting for about 18.48% and 27.98% of the world’s area and yield, respectively [1]. Fertilizer application is greatly increased to achieve high yield. In the middle and lower reaches of the Yangtze River in China, the fertilizer application reaches or even exceeds 300 kg·ha−1 [2,3,4], which is far above the regional average nitrogen application rate of 190–200 kg·hm−2 under the large area rice yield level [5]. Excessive fertilizer application leads to low fertilizer use efficiency. For instance, the nitrogen use efficiency of rice in China is only 39.0% [6], which is lower than the world average of 46% [7]. In the Taihu Basin of China, the ammonia volatilization loss, nitrogen runoff loss, nitrogen leakage loss and nitrogen fertilizer loss to the surrounding water during the rice season account for 20–40% [8], 3.3–5% [9], 2.1–3.2% [10] and 30–50% [9], respectively, resulting in serious non-point source pollution. Therefore, reducing fertilizer loss and improving nutrient nitrogen use efficiency while ensuring high yield and sustainability of rice are among the technical means to prevent and control agricultural non-point source pollution. The application of controlled-release fertilizer can optimize the population structure [11], improve the production capacity of photosynthetic substances [12], and increase yield [13,14,15]. This application can also significantly reduce nitrogen loss, improve the nitrogen utilization rate [16,17,18] and decrease the risk of agricultural non-point source pollution in paddy fields.
The use of direct-seeded rice, which is labor saving, cost saving and conducive to mechanized promotion, has gradually increased in southern China since the 1990s. The proportion of direct-seeded rice planting area rose to 83.18% in Shanghai in 2008, to 40% in Jiangsu Province in 2012 and to 37% in Zhejiang Province in 2013 and exceeded 50% in Hubei Province in 2018 according to incomplete statistics. The planting area of mechanized direct-seeded rice in China exceeded 30% in 2015 and was still increasing [19]. Direct-seeded rice, as a special rice farming method, has a short growth period, slow dry matter accumulation in the early stage and large growth in the middle and late stages [20,21]. Nitrogen control in the early stage can reasonably coordinate population growth, and nitrogen increase in the later stage can improve individual quality, which can realize the coordination between population and individual; this is an effective measure to increase yield for wet direct-seeded rice [22]. Therefore, under the condition of applying controlled-release fertilizers, how to rationally combine them with urea to promote the coordinated development of the population and individual is the key to improving the yield of wet direct-seeded rice. At the same time, the water management of wet direct-seeded rice is a particular problem. The field should be maintained in a moist and anhydrous layer state from sowing to the three-leaf stage (about 20 days), so as to ensure the normal germination and seedling of the seeds and to promote root growth. For these reasons, the accumulated water in the field must be eliminated promptly upon moderate and heavy rain [23], which otherwise will significantly increase the risk of nitrogen and phosphorus loss. The runoff of wet direct-seeded rice compared with manually transplanted seedling rice increased by 26–30%, and the nitrogen runoff loss rose by 143–169% in 2013–2014 in southeast China, mainly due to the increases in runoff and nitrogen concentration in runoff water at the early growth stage of direct-seeded rice [23].
Wet direct-seeded rice’s uniqueness in nitrogen uptake and utilization, and the high risk of nitrogen runoff loss in the early stage of its cultivation determine that the nitrogen management of direct-seeded rice is different from manually or mechanically transplanted seedling rice. The advantages of the slow nutrient release of controlled-release fertilizer can effectively reduce the risk of nitrogen loss in the early stage of wet direct-seeded rice cultivation. Controlled-release fertilizer combined with conventional nitrogen fertilizer can meet the nitrogen demand in the middle and late growth stages of wet direct-seeded rice. However, there are few reports on the application effects of controlled-release blended fertilizer combined with urea in wet direct-seeded rice. Given the nitrogen management characteristics of wet direct-seeded rice, the objectives of this study were as follows: to evaluate the performances of two types of nitrogen management strategies (controlled-release blended fertilizer and conventional urea); to influence rice yield and nitrogen utilization and loss in Jianghan Plain, middle reaches of the Yangtze River and to elucidate the causes of possible differences. We hypothesized that the new developed nitrogen management strategy (controlled-release blended fertilizer combined with urea) improves nitrogen utilization, reduces the nitrogen loss and thus increases grain yield in wet direct-seeded rice and we expected to provide a practical basis for the nitrogen management of wet direct-seeded rice in central China.
2. Materials and Methods
2.1. Study Site and Materials
Field experiments were conducted from 2019 to 2020 at Yangtze University, which is located in the hinterland of Jianghan Plain, China (30°21′ N, 112°09′ E, altitude 32 m), and belongs to the eastern monsoon climate zone and the northern subtropical agricultural climate zone. The precipitation and runoff during the experiment are shown in Figure 1. The precipitation during the rice growth stage was 333.5 mm (2019) and 800.2 mm (2020). The soil was loam with pH 7.15, 28.25 g·kg−1 organic matter, 2.13 g·kg−1 total N, 1.15 g·kg−1 total P, 15.41 g·kg−1 total K, 113.05 mg·kg−1 alkali hydrolysable N, 12.89 mg·kg−1 available P, and 219.65 mg·kg−1 available K. The indica hybrid rice cultivar ‘Shenliangyou 332’ tested here was cultivated as one-season mid-season rice in Hubei Province, China, and the whole growth period was about 114 days.
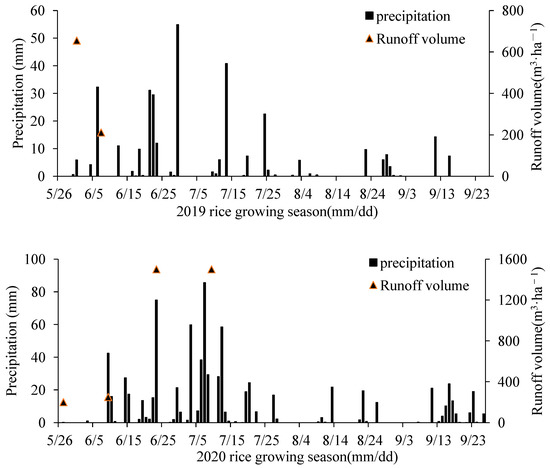
Figure 1.
The precipitation and runoff volume during the experimental period in 2019 and 2020.
2.2. Experimental Design
According to different nitrogen sources and basal–tiller ratios, two nitrogen management strategies were set in 2019: conventional urea with a basal–tiller ratio of 4:6 (U40, the optimum conventional fertilizing method for wet direct-seeded rice [24]) and the controlled-release blended fertilizer (basal N) to conventional urea (tiller N) at 7:3 (CRBF+U, the optimum ratio of the controlled-release blended fertilizer and conventional urea for transplanted seedling rice [25]). On this basis, two nitrogen management strategies were added in 2020: conventional urea with a basal–tiller ratio of 6:4 (U60, local farmers’ N fertilization for transplanted seedling rice) and the controlled-release blended fertilizer as a single basal application (CRBF). Treatment with no-nitrogen fertilizer was set as control for both of the 2 years of study (N0, CK). The controlled-release blended fertilizer (24% N, 12% P2O5, and 12 K2O, the nutrient release period was 60 days when the average soil temperature was 25 °C) was produced by Sinofert Holding Limited (Beijing, China). All treatments also received the same amounts of P and K. P was used as superphosphate with 12% P2O5 at 75 kg P2O5 ha−1, and K as potassium chloride with 60% K2O at 105 kg K2O ha−1. P and K fertilizers were applied as basal fertilizers. Three replicates were set for each nitrogen management, and the specific fertilization scheme is shown in Table 1.

Table 1.
Fertilization scheme for wet direct-seeded rice under different nitrogen fertilizer treatments.
The experiments were carried out in field plots that each had an area of 20 m × 3.5 m = 70 m2. The plots were separated by 0.15 m high soil banks, which were covered with plastic films to prevent water and fertilizer channeling between plots. Each plot had an independent irrigation system and a runoff pond. According to the local farming habits of paddy fields—ploughing before winter, soaking and rotary tillage before rice sowing—the plots were built after two rotary tillage applications as per the test requirements. After that, basal fertilizer was applied to the shallow water layer of the plots. Then, the plots were manually raked, and each turned into a ditch-box pattern (ditch in the middle of each plot), with each having a box width of 1.5 m, a ditch width of 0.3 m and a ditch depth of 0.1–0.2 m. Water was drained before sowing to ensure that the field was moist and waterless. Manual row was used to sow evenly, and the sowing amount was 22.5 kg/hm2 per dry seed. The seeds were soaked before sowing to accelerate germination. The buds, which were about 3 mm long, were spread out and dried properly. The seeds were sown on 30 May 2019 and 26 May 2020, and chemically weeded within 3 days after sowing. The water management mode was water in a no-water compartment ditch on the compartment surface during sowing in the three-leaf and one-heart period. In case of heavy rainfall, the surface water of the field was drained in time. The paddy fields were irrigated with a 2–3 cm shallow water layer on 11 June 2019 and 8 June 2020, and the management of the shallow water layer was maintained thereafter. Tiller fertilizer was applied on 13 June 2019 and 10 June 2020, and the rice was harvested on 24 September 2019 and 25 September 2020.
2.3. Sampling and Measurements
2.3.1. Runoff Water
The runoff of each plot was collected by an overflow bucket with a lid and measured. After the runoff water was mixed evenly, the mixed sample was put into a polyethylene bottle and brought back to the laboratory. The contents of total nitrogen (TN), ammonia nitrogen (NH4+-N) and nitrate nitrogen (NO3−-N) in the runoff water were detected using an Alliance continuous flow analyzer (Futura II, France), the NH4+-N was detected by continuous flow analysis (CFA) and salicylic acid spectrophotometry and the NO3−-N was detected by continuous flow analysis (CFA) and N(1-naphthly)ethylene diamine dihydrochloride spectrophotometry. Runoff was generated on 30 May and 6 June 2019, and 26 May, 8 June, 22 June and 9 July 2020.
2.3.2. Ammonia Volatilization
AV flux was monitored by a venting method [26]. The aeration device was made using bottomless poly (vinyl chloride) (PVC) pipes, which had an outer diameter of 20 cm, an inner diameter of 19 cm and a height of 50 cm. The upper part was connected with an elbow to prevent the rainwater from affecting the collection of volatile ammonia gas. In the measurement, two 2 cm thick sponges with a diameter of 20 cm were evenly dipped in 15 mL of a glycerol phosphate solution, and then two layers of sponges were placed in a PVC pipe. The sponge in the lower layer was 15 cm away from the ground, and the sponge in the upper layer was level with the pipe top. The lower layer sponge absorbed the ammonia volatilized from the soil, and the upper layer sponge prevented the air ammonia and dust from entering. The soil AV was captured from the day after fertilization onwards. Two capture devices were placed at different locations in each plot. During sampling at 10:00, the lower layer sponge of the aeration device was taken out, quickly put into a sealed bag for storage and replaced with another sponge just soaked in a glycerol phosphate solution. The upper sponge was replaced once every 3–7 days depending on the dry or wet conditions. After changing the placement position, the device was put back in place before the next field absorption started. The sampling frequency was once a day in the first week after fertilization and changed to every 3 days in the second week. In the third week, the sampling frequency was once every 3–5 days depending on the measured amount of AV, and then the sampling interval was extended to 7–10 days until no AV was detected. After that, the sponges in the sealed bags were taken back to the laboratory and put into 500 mL plastic bottles. Then, 200 mL of a 1 mol·L−1 potassium chloride solution was added to soak the sponges completely. After shaking for 1 h, the ammonium nitrogen content of the leaching solution was measured using the continuous flow analysis (CFA) and salicylic acid spectrophotometry and an Alliance continuous flow analyzer (Futura II, France). Relevant equations are as follows:
Daily AV flux (kg·hm−2) = average daily ammonia quantity in a single device (mg)/cross-sectional area of the capture device (m2)/each continuous capture time × 10−2
AV loss (kg·hm−2) = sum of AV fluxes collected during each measurement period
AV loss rate (%) = (AV loss in fertilization treatment − AV loss in control)/nitrogen application × 100%
2.3.3. Dry Matter and N Accumulation
Representative samples were collected at the three-leaf, tiller, jointing, booting, full heading and maturity stages, according to stem-sheath, leaf and panicle parts, respectively. The samples were oven-dried at 105 °C for 30 min at 80 °C until they reached constant weights. Then, the dry matter of each part was weighed. Dry plant samples were crushed and digested with H2SO4-H2O2. Nitrogen content in each part was detected by the continuous flow analyzer.
According to the methods of Huang et al. [27] and Liu et al. [28], a logistic function was used to determine the relationship between N accumulation of rice shoots and the days after sowing (DAS) as follows:
where y is the N uptake of shoots at DAS; constant k is the asymptotic maximum N uptake; a and b are constants; t1 and t2 are the starting and terminating dates of the rapid nitrogen accumulation period, respectively; t0 is the maximization time of nitrogen accumulation rate; T is the lasting period for rapid N accumulation and Vm is the maximal speed of N accumulation.
2.3.4. Yield and Yield Components
At the maturity stage, 3 m2 harvest area was selected for each plot, and the actual measured yield area was recorded. Impurities and shriveled grains were removed by threshing, drying and winnowing, and then the total mass of air-dried grains was weighed. The average number of effective panicles per plot was calculated by investigating the number of effective panicles in the field at the mature stage. Five hills were sampled in each plot according to the average number of effective panicles, and the number of effective panicles and tillers per hill were recorded. The seed-setting rate was determined using a water selection method after threshing.
2.3.5. Nitrogen Use Efficiency
The parameters related to nitrogen transport were nitrogen transport amount (NT, kg/kg), nitrogen transport rate (NTR, %) and nitrogen contribution rate (NCR, %). The parameters related to nitrogen efficiency were nitrogen harvest index (NHI, %), nitrogen grain production efficiency (NGPE, kg/kg), nitrogen agronomic efficiency (NAE, kg/kg) and nitrogen apparent use efficiency (NAUE, %). The calculation equations are as follows:
NT (kg·hm−2) = nitrogen accumulation in stem-sheath (leaf) at full-heading stage − nitrogen accumulation in stem-sheath (leaf) at maturity stage
NTR (%) = NT/nitrogen accumulation in stem-sheath (leaf) at full-heading stage × 100
NCR (%) = NT/nitrogen accumulation in grains at maturity stage
NHI (%) = N accumulation of panicle/total N accumulation in aboveground part
NGPE (kg·kg−1) = grain yield/nitrogen accumulation in aboveground part at maturity stage
NAE (kg·kg−1) = (grain yield in N fertilized plots − grain yield in control plots)/N fertilizer application
NAUE (%) = (aboveground nitrogen accumulation in nitrogen fertilized plot at maturity stage − aboveground nitrogen accumulation in control plot at maturity stage)/nitrogen application amount × 100%
2.4. Data Analyses
Plotting, analysis of variance (ANOVA) and regression analysis were finished on Microsoft Excel 2016. Logistic equation fitting was performed in a DPS data processing system (DPS 18.10). Multiple comparative analysis was conducted using the least significant difference method (LSD).
3. Results
3.1. Nitrogen Runoff Losses
Two runoff events occurred during the whole growth period of the wet direct-seeded rice in 2019: the drainage for sowing on 30 May and the drainage after rainfall on 6 June, which was conducive to seed germination (rainfall was 32.3 mm). The average drainage quantities were 655 and 211 m3·hm−2, respectively (Figure 1). Four runoff events happened in 2020: runoff on 26 May and drainage after rainfall on 6 June, 22 June and 9 July. The average runoffs were 200, 250, 1500 and 1500 m3·hm−2, respectively. Drainage before or after sowing is inevitable in wet direct-seeded rice fields and will cause an objective risk of nutrient loss.
During the whole growth period of the wet direct-seeded rice, the nitrogen runoff loss was the lowest after CRBF+U (11.41–12.94%), followed by U40 (13.31%), and was significantly lower than the 17.58% recorded after U60 (Table 2). The amount of NH4+-N in runoff water was much higher than that of NO3−-N, and ammonium nitrogen was the main form of nitrogen loss in the runoff (Table 2). The nitrogen runoff loss before sowing accounted for 96.28–99.27% (2019) and 65.57–75.71% (2020) of the whole growth period, and the nitrogen runoff loss from sowing to the three-leaf and one-leaflet stage accounted for 100% (2019) and 73.08–80.59% (2020). These results indicate that the duration from sowing to the three-leaf and one-leaflet stage is the main risk period for nitrogen runoff loss in wet direct-seeded rice fields. Meanwhile, the drainage-caused nitrogen runoff loss after CRBF+U was significantly lower than that of U40 (2019) and U60 before sowing. The nitrogen runoff loss was not significantly different between fertilization treatments after the three-leaf and one-leaflet stage (Table 3). The results indicated that CRBF can significantly reduce the nitrogen content in drainage before sowing in wet direct-seeded rice fields, thus reducing nitrogen runoff loss.
Table 2.
Seasonal total nitrogen (TN), NH4+-N and NO3−-N runoff losses from different N fertilizer management strategies in 2019 and 2020.
Table 3.
Total nitrogen (TN) runoff losses from different N fertilizer management strategies in each surface runoff event in the 2019 and 2020 rice seasons (kg N·ha−1).
For the sake of reducing nitrogen runoff loss, the nitrogen fertilizer management strategy for wet direct-seeded rice should involve a combination of CRBF and conventional nitrogen fertilizer (urea), and the ratio of CRBF to urea should be 7:3. If the common compound fertilizer is used, the amount of base fertilizer used for wet direct-seeded rice should be reduced to about 40%.
3.2. AV Loss
The AV flux of wet direct-seeded rice increased rapidly after basal fertilizer application and reached its peak at 3 days after basal fertilizer application. Specifically, the flux maximized to 2.57 kg·hm−2·d−1 after U60, followed by U40 (1.58–1.65 kg·hm−2·d−1), and minimized to 1.05 kg·hm−2·d−1 after CRBF+U in two years and then decreased rapidly and almost disappeared on the 10th day after basal fertilizer application (Figure 2). The AV flux of wet direct-seeded rice reached its peak at 2 days after tiller fertilizer application and maximized to 2.49–3.27 kg·hm−2·d−1 after U40. The flux was the lowest after pure CRBF, and then gradually decreased to a plateau, and AV almost disappeared on the 10th day after tiller fertilizer application (Figure 2).
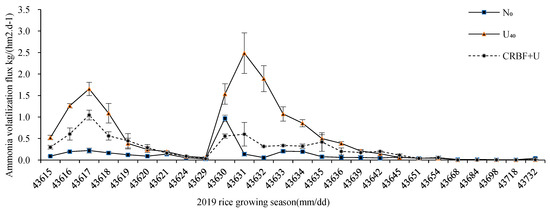
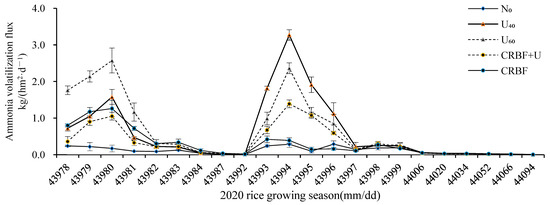
Figure 2.
Dynamics of AV flux in wet direct-seeded paddy fields under different nitrogen treatments. The different nitrogen treatments were described in Table 1.
Before tiller fertilizer application, the AV loss of CRBF+U was the lowest (3.36–3.64 kg·hm−2), and that of U60 was the highest (1.92 times that of U40) (2020). Although CRBF was applied with over 60% more N in basal fertilizer than that of U40, the AV loss was only 0.55 kg·hm−2 more than U40; further, over 40% more N than that of U60 (2020) was applied, with the AV loss being 3.46 kg·hm−2 (2020) less than that of U60. Clearly, the application of CRBF in basal fertilizer helps to reduce the AV loss of wet direct-seeded rice from sowing up until the three-leaf and one-leaflet stage. During the whole growth period of the wet direct-seeded rice, the AV loss rate was the lowest after CRBF (3.41%) and was not significantly different after CRBF+U; however, it was significantly lower compared with U40 (7.21–7.81%) and U60 (7.98%) (Table 4). Therefore, to reduce AV, it is suggested that CRBF should be applied to wet direct-seeded rice, which can be used as the basal fertilizer at one time. If the common compound fertilizer is used, the amount of basal fertilizer used should be reduced to about 40%.
Table 4.
AV loss of wet direct-seeded paddy fields under different nitrogen treatments in different periods.
3.3. Nitrogen Accumulation
Table 5 shows the shoot nitrogen accumulation of the wet direct-seeded rice under different nitrogen application treatments. Before the use of tiller fertilizer, the shoot nitrogen accumulation was significantly higher after U60 compared with after U40, and was higher after CRBF than after CRBF+U. The results indicated that the more basal fertilizer that is applied with the same fertilizer, the more favorable the conditions are for nitrogen accumulation in the seedling stage of wet direct-seeded rice. At the same time, the shoot nitrogen accumulation of U60 was significantly higher compared with that of CRBF and CRBF+U. These results suggest that the available nitrogen fertilizer is helpful for the nitrogen accumulation of wet direct-seeded rice at the seedling stage. From the use of tiller fertilizer to the jointing stage, the shoot nitrogen accumulation ranked as CRBF+U > CRBF > U60 > U40, indicating that CRBF+U is beneficial to nitrogen accumulation in rice from the tiller stage to the jointing stage. Moreover, when the fertilization mode is common compound fertilizer combined with urea, the use of more basal fertilizer is beneficial to nitrogen accumulation in rice from the tiller stage to the jointing stage. From the jointing stage to harvest, the shoot nitrogen accumulation ranked as CRBF+U > U40 > CRBF > U60, and was not significantly different among CRBF+U, U40 and CRBF, but was significantly higher after CRBF+U than after U60. When the ratio of CRBF to urea was 7:3 and the basal-tiller ratio of urea was 4:6, the shoot nitrogen accumulation increased after the jointing stage, which ensured that the nitrogen demand for the reproductive growth of the wet direct-seeded rice was met.
Table 5.
Effects of nitrogen fertilizer treatments on N accumulation at the main growth stage of wet direct-seeded rice (kg·hm−2).
Logistic equations were used to fit the shoot nitrogen accumulation of the wet direct-seeded rice. The fitting equations, determination coefficients (R2) and characteristic parameters are shown in Table 6. Clearly, the R2 of each fitting equation was greater than 0.97, thereby reaching the extremely significant level (p < 0.01) (Table 6). These results indicate that it is appropriate to use logistic equations to simulate the shoot nitrogen accumulation process of wet direct-seeded rice. According to the characteristic parameters, the lasting period for rapid N accumulation (T) of CRBF was significantly higher than that in the treatment of common compound fertilizer combined with urea; of particular note is that it was longest after CRBF+U, which was 3.59–6.92 d, and was 4.35 d longer than U40 and U60, respectively. The maximal N accumulation speed (Vm) was the fastest after CRBF+U, which was 1.10–1.27 and 1.36 times significantly higher compared with U40 and U60, respectively. The results indicated that CRBF+U can prolong the lasting period for rapid N accumulation and accelerate the maximal N accumulation speed, thereby increasing the nitrogen accumulation.
Table 6.
Eigen values of wet direct-seeded rice nitrogen accumulation dynamics under different nitrogen fertilizer treatments.
3.4. Nitrogen Transport
The NTR and NCR of stem sheaths or leaves and the N increase in panicles from the full heading stage to the maturity stage of the wet direct-seeded rice in 2020 were highest in CRBF+U (except N0), followed by U40. These indices were not significantly different between CRBF+U and U40, but were significantly higher compared with CRBF and U60 (Table 7). The application ratio of CRBF to urea at 7:3 and the basal–topdressing ratio of conventional urea at 4:6 were helpful for nitrogen transfer to panicles after the heading stage of the wet direct-seeded rice, thereby meeting the nitrogen demand of grain filling and ensuring yields.
Table 7.
Effects of nitrogen fertilizer treatments on N translocation in stem sheaths and leaves from full-heading stage to maturity stage in wet direct-seeded rice.
3.5. Nitrogen Utilization
The NHI, NAE and NAUE in 2019 were all highest after CRBF+U, and significantly increased by 6.96%, 17.38% and 34.56% compared with U40, respectively (Table 8). The orders of NHI and NAUE in 2020 were both CRBF+U > U40 > CRBF > U60, while NAE ranked as CRBF+U> CRBF > U40 > U60. Compared with U40, U60 and CRBF, the NAUE of CRBF+U significantly increased by 30.34%, 53.97% and 39.25%, respectively, while the NAUE of U40 significantly increased by 18.13% compared with U60. These results suggest that the application ratio of CRBF to conventional urea at 7:3 can improve the nitrogen use efficiency of wet direct-seeded rice and guarantee rice yield.
Table 8.
Effects of nitrogen fertilizer treatments on N use efficiency in wet direct-seeded rice.
3.6. Yield and Yield Components
The effects of rice yield and its components under different nitrogen management strategies are shown in Table 9. The actual rice yield of CRBF+U was the highest in both of the two years, which significantly increased by 9.25% (2019) and 10.24% (2020) compared with U40, and by 18.65% (2020) compared with U60. In terms of yield components, the grain number per panicle and the seed-setting rate of CRBF+U were significantly higher than those of U40, while neither the effective panicle number per unit area nor the 1000 grain weight was significantly different compared with those of U40. Therefore, the significant increase in the yield of CRBF+U was due to the significant increase in the grain number per panicle and the seed-setting rate.
Table 9.
Grain yield and yield components under different nitrogen management strategies.
4. Discussion
4.1. CRBF+U Reduced Nitrogen Loss by Runoff in Wet Direct-Seeded Paddy Fields
Wet direct-seeded rice fields should be kept wet for about 20 days from sowing to the three-leaf and one-leaflet stage; soaking water discharge is common after basal fertilizer application. When heavy rainfall occurs in this period, the field water must be removed in time; otherwise, it will raise the risk of nitrogen and phosphorus loss much higher than that for mechanically transplanted rice. In this study, the nitrogen runoff losses of the wet direct-seeded rice in the first two weeks accounted for 100% and 73.08–80.59% of the total annual losses, respectively. The nitrogen runoff losses of the conventional urea were 23.96–25.87 kg·N·ha−1 (U40) and 31.65 kg·N·ha−1 (U60), which are much higher compared with those of mechanically transplanted rice (4.90–12.7 kg·N·ha−1) [29,30]. One of the main reasons for this is that there must be water in paddy fields before sowing on account of soaking, so the surface water must be discharged before or after sowing, which otherwise will induce certain surface runoff. In this study, the drainage volumes before sowing were 655 and 200 m3·hm−2, respectively. Secondly, the nitrogen concentrations in the drainage runoff before or after sowing were very high: the concentrations of various forms of nitrogen in the surface water of the rice fields in Jianghan Plain peaked at 1–2 days after fertilization and decreased to near the level without nitrogen fertilizer at 5 days after basal and tiller fertilizer applications [31]. In the 2-year experiment, the TN concentrations in runoff by conventional urea were 56.75–78.75 mg/L (U40) and 121.30 mg/L (U60). Therefore, reducing the amount of runoff before or after sowing, and reducing the TN concentration in runoff are two key ways to control nitrogen runoff loss in wet direct-seeded rice. The first specific measure is that water-saving measures should be taken to prevent the field from being soaked before or after sowing. The second measure is to improve the fertilization technology. The application of controlled-release fertilizers can effectively reduce the nitrogen concentration in surface water [32], thereby lowering the risk of nitrogen loss. In this study, the TN concentrations in runoff water before and after the sowing of CRBF in the two years were 30.74–76.35 mg·L−1 (CRBF+U) and 109.25 mg·L−1 (CRBF), which is the main reason for our recommendation of the use of controlled-release fertilizers to reduce the nitrogen runoff loss of wet direct-seeded rice.
4.2. CRBF Reduced AV Loss in Wet Direct-Seeded Paddy Fields
AV refers to the process of ammonia diffusion from soil or surface water to the atmosphere, which is the main pathway of nitrogen loss in paddy fields [33,34], and accounts for 70% of total reactive nitrogen loss in paddy fields [35]. In this study, when the common urea was nitrogen fertilizer, the AV flux peaked at 3 days after the basal fertilizer application and 2 days after the use of tiller fertilizer in the wet direct-seeded rice fields, and then decreased rapidly to a low level at 7–10 days, which is consistent with other studies [36,37]. The peak AV fluxes were 1.58 and 2.36 kg·hm−2·d−1 (2020), respectively, when basal fertilizer and tiller fertilizer were applied at 72 kg·hm−2 urea and were 2.57 and 3.27 kg·hm−2·d−1 (2020), respectively, when the applied doses were both 108 kg·hm−2 urea. These results indicate that the main period of AV loss was 2–3 days after the basal and tiller fertilizer applications, with the amount of AV loss after the tiller fertilizer application being larger, which is consistent with the results of Yao et al. [38] and He et al. [39]. A possible reason for this could be that the temperature in tiller fertilizer is higher than that in basal fertilizer, which could increase the AV loss [40]. Slow/controlled-release fertilizer coating can slow down the hydrolysis of nitrogen fertilizer, and coordinate the nitrogen supply and rice nitrogen demand, thus increasing rice yield and reducing ammonia emission [35,41]. This study showed that controlled-release blended fertilizer can significantly reduce the AV in wet direct-seeded rice fields, with the AV loss rate of CRBF being the slowest (3.41%), 0.48% slower than CRBF+U, which ranked second. The main reason for this was that the AV loss of CRBF before tiller fertilizer application was 1.55 kg·hm−2 higher than that of CRBF+U, and the loss of CRBF+U was 2.41 kg·hm−2 higher than that of CRBF after tiller fertilizer application (urea). The AV loss of CRBF+U mainly occurred after the tiller fertilizer application, accounting for 66.83% of the total growth period. Under the same nitrogen application rate, the AV loss after tiller fertilizer was significantly increased by CRBF+U compared with all basal applications. These results are consistent with the research of Hou et al. [42].
4.3. CRBF+U Improved Nitrogen Utilization and Yield in Wet Direct-Seeded Paddy Fields
Nitrogen is one of the key factors in rice production, and the application of controlled-release fertilizer can optimize the population structure of rice [11] and improve the photosynthetic material production capacity [12] and yield components, thereby significantly increasing yield [13,14,15]. The material accumulation of wet direct-seeded rice is relatively low in the early and middle stages, and the growth is intense in the middle and late stages. Wet direct-seeded rice’s demand for nitrogen nutrition differs from that of mechanically transplanted rice [22]. In this study, the nitrogen accumulation of wet direct-seeded rice from tiller fertilizer to the jointing stage ranked as CRBF+U > CRBF > U60 > U40, and from the jointing stage to harvest ranked as CRBF+U > U40 > CRBF > U60 (Table 5). Moreover, the basal application of CRBF met the nitrogen demand in the early stage of wet direct-seeded rice cultivation, but the nitrogen supply was insufficient in the later growth stage, which can be effectively solved by the use of CRBF combined with urea.
The CRBF+U treatment obtained the largest leaf nitrogen transport amount, transport rate, and panicle increase from full heading to maturity (Table 6). At the same time, the NAE and NAUE were optimized when the ratio of CRBF to urea was 7:3 (Table 7), which is consistent with the work of Wang et al. [11]. These results indicate that CRBF+U not only meets the nitrogen demand of wet direct-seeded rice during the whole growth period, but also helps to transport nitrogen to grains and meets the nitrogen demand of grain filling, thereby improving the nitrogen utilization rate.
The release pattern of controlled-release nitrogen fertilizer is an important factor affecting rice yield [43]. Controlled-release fertilizer can adjust the nutrient release pattern to achieve a dynamic balance of nitrogen nutrients in rice [44]. Compared with conventional fertilization, controlled-release fertilizer combined with available nitrogen fertilizer can delay the senescence of rice roots and leaves [45,46], which improves the nitrogen uptake of rice and nitrogen use efficiency and thereby increases the yield of mechanically transplanted rice [47]. The results of our two-year experiments showed that the actual yield of wet direct-seeded rice was the highest in CRBF+U, which was 9.25% (2019) and 10.24% (2020) higher compared with that in U40. The reason for this remarkable increase in yield can be attributed to the significant rise in grain number per panicle and seed-setting rate, which is consistent with the results of Sun et al. [14,15]. CRBF+U solves the balance problem between early and late fertilizer supplies, and the urea can enhance the fertilizer supply of wet direct-seeded rice at its early growth stage, which are both beneficial to the formation of effective tiller at the early tiller stage and underlie the formation of effective panicles. Moreover, CRBF can meet the nitrogen demand of wet direct-seeded rice at the late growth stage, and it contributes to increases in the number of grains per panicle and to ensuring yield.
5. Conclusions
The controlled-release blended fertilizer (basal N) to conventional urea (tiller N) at 7:3 (CRBF+U) produced high nitrogen accumulation, nitrogen translocation rate in stems, sheaths, and leaves from full heading to maturity, and nitrogen harvest index, nitrogen agronomic efficiency and nitrogen apparent utilization rate while reducing the nitrogen runoff loss from sowing to the three-leaf and one-center stage and AV loss in the direct-seeded rice fields, and resulted in a greater grain number per panicle, greater seed-setting rate and obtained a relatively high grain yield in the Jianghan Plain, China. The CRBF+U can reduce agricultural non-point source pollution in the wet direct-seeded rice field and contribute to sustainable development of wet direct-seeded rice.
Author Contributions
Q.W. and G.W., conceptualization; Q.W. and J.C., methodology; Q.W. and J.C., formal analysis; Q.W., investigation/writing—original draft/supervision; Y.Q. and Q.Z., visualization; Y.Q. and Q.Z., data curation; Q.W., and G.W., writing—review and editing and G.W., project administration. All authors have read and agreed to the published version of the manuscript.
Funding
This research was funded by the National Natural Science Foundation of China (U21A2039), the Open Project of the National Agricultural Experimental Station for Agricutural Envirnment (SQZ-2023-03), and the Innovation System Found Project of Ecological and Circular Agriculture in Hubei Province (2018skjcx01).
Data Availability Statement
Data is contained within the article.
Conflicts of Interest
The authors declare no conflict of interest.
Abbreviations
| N | nitrogen |
| CRBF+U | controlled-release blended fertilizer (basal N) to conventional urea (tiller N) at 7:3 |
| CRBF | controlled-release blended fertilizer as single basal application |
| U60 | conventional urea with a basal–tiller ratio of 6:4 |
| U40 | conventional urea with a basal–tiller ratio of 4:6 |
| NT | nitrogen transport amount |
| NTR | nitrogen transport rate |
| NCR | nitrogen contribution rate |
| NHI | nitrogen harvest index |
| NGPE | nitrogen grain production efficiency |
| NAE | nitrogen agronomic efficiency |
| NAUE | nitrogen apparent use efficiency |
| AV | ammonia volatilization |
| T | lasting period for rapid N accumulation |
| Vm | maximal speed of N accumulation |
References
- FAO (Food and Agriculture Organization). FAOSTAT Database; Food and Agriculture Organization: Rome, Italy, 2019; Available online: https://www.fao.org/faostat/en/#data/QCL/visualize (accessed on 18 February 2022).
- Lin, D.-X.; Fan, X.-H.; Hu, F.; Zhao, H.-T.; Luo, J.-F. Ammonia Volatilization and Nitrogen Utilization Efficiency in Response to Urea Application in Rice Fields of the Taihu Lake Region, China. Pedosphere 2007, 17, 639–645. [Google Scholar] [CrossRef]
- Peng, S.B.; Buresh, R.J.; Huang, J.L.; Yang, J.C.; Zou, Y.B.; Zhong, X.H.; Wang, G.H.; Zhang, F.S. Strategies for overcoming low agronomic nitrogen use efficiency in irrigated rice systems in China. Field Crops Res. 2006, 96, 37–47. [Google Scholar] [CrossRef]
- Wang, H.; Xi, Y.G.; Chen, R.B.; Xu, X.; Wei, Q.; Li, J.Y. Investigation on excessive application of fertilizer and pesticides in Taihu Lake region. J. Agric. Resour. Environ. 2009, 26, 10–15. [Google Scholar]
- Zhang, F.S. Basic Research on Nitrogen Behaviors and High Nitrogen Fertilizer Use Efficiency in Chinese Main Intensive Agricultural Ecosystems; Science Press: Beijing, China, 2010; pp. 1–27. (In Chinese) [Google Scholar]
- Yu, F.; Shi, W.M. Nitrogen use efficiencies of major grain crops in china in recent 10 years. Acta Pedol. Sin. 2015, 52, 1311–1324. [Google Scholar] [CrossRef]
- Ladha, J.K.; Pathak, H.; Krupnik, T.J.; Six, J.J.; Kessel, C.V. Efficiency of fertilizer nitrogen in cereal production: Retrospects and prospects. Adv. Agron. 2005, 87, 86–156. [Google Scholar] [CrossRef]
- Yu, Y.L.; Xue, L.H.; Yang, L.Z. Ammonia volatilization from paddy fields under different nitrogen schemes in Taihu Lake region. J. Agro-Environ. Sci. 2013, 32, 1682–1689. [Google Scholar] [CrossRef]
- Xue, L.H.; Yu, Y.L.; Yang, L.Z. Nitrogen balance and environmental impact of paddy field under different N management methods in Taihu Lake region. Environ. Sci. 2011, 32, 222–227. [Google Scholar] [CrossRef]
- Yu, Y.L.; Xue, L.H.; Yang, L.Z. Effects of nitrogen management on nitrogen leaching of paddy soil in Taihu Lake region. Acta Ecol. Sin. 2011, 48, 988–995. [Google Scholar] [CrossRef]
- Wang, H.; Li, Y.; Sun, Y.; Jiang, M.; Ma, J. Effects of slow-release urea on nitrogen utilization and yield in mechanically-trans-planted rice under different nitrogen application rates. Chin. J. Rice Sci. 2017, 31, 50–64. [Google Scholar] [CrossRef]
- Li, M.; Guo, X.S.; Ye, S.Y.; Liu, F.; Huang, Y.D. Effects of sulfur-and polymer-coated controlled release urea on yield, photosynthetic characteristics and nitrogen fertilizer efficiency of rice. J. Plant Nutr. Fertil. 2013, 19, 808–815. [Google Scholar] [CrossRef]
- Ye, Y.; Liang, X.Y.; Chen, X.; Liu, J.; Gu, J.; Guo, R.; Li, L. Alternate wetting and drying irrigation and controlled-release nitrogen fertilizer in late-season rice. Effects on dry matter accumulation, yield, water and nitrogen use. Field Crops Res. 2013, 144, 212–224. [Google Scholar] [CrossRef]
- Sun, Y.; Mi, W.H.; Su, L.J.; Shan, Y.Y.; Wu, L.H. Controlled-release fertilizer enhances rice grain yield and N recovery efficiency in continuous non-flooding plastic film mulching cultivation system. Field Crops Res. 2019, 231, 122–129. [Google Scholar] [CrossRef]
- Sun, H.; Zhou, S.; Zhang, J.; Zhang, X.; Wang, C. Effects of controlled-release fertilizer on rice grain yield, nitrogen use efficiency, and greenhouse gas emissions in a paddy field with straw incorporation. Field Crops Res. 2020, 253, 107814. [Google Scholar] [CrossRef]
- Wang, S.; Zhao, X.; Xing, G.; Yang, Y.; Zhang, M.; Chen, H. Improving grain yield and reducing N loss using polymer-coated urea in southeast China. Agron. Sustain. Dev. 2015, 35, 1103–1115. [Google Scholar] [CrossRef]
- Zhang, S.G.; Shen, T.L.; Yang, Y.C.; Li, Y.C.; Wan, Y.S.; Zhang, M.; Tang, Y.F.; Allenc Samuel, C. Controlled-release urea reduced nitrogen leaching and improved nitrogen use efficiency and yield of direct-seeded rice. J. Environ. Manag. 2018, 220, 191–197. [Google Scholar] [CrossRef] [PubMed]
- Li, P.F.; Lu, J.W.; Wang, Y.; Wang, S.; Hussain Saddam Ren, T.; Cong, R.H.; Li, X.K. Nitrogen losses, use efficiency, and productivity of early rice under controlled-release urea. Agric. Ecosyst. Environ. 2018, 251, 78–87. [Google Scholar] [CrossRef]
- Luo, X.W.; Liao, J.; Hu, L.; Zang, Y.; Zhou, Z.Y. Improving agricultural mechanization level to promote agricultural sustainable development. Trans. Chin. Soc. Agric. Eng. 2016, 32, 1–11. [Google Scholar] [CrossRef]
- Liu, H.J.; Zheng, J.C.; Chen, L.G.; Zhou, W. Effects of different planting modes on the growth and development characteristics of rice. Chin. J. Ecol. 2013, 32, 2326–2331. [Google Scholar] [CrossRef]
- Tian, Q.L.; Liu, B.; Zhong, X.Y.; Zhao, M.; Sun, H.; Ren, W.J. Relationship of NSC with the formation of branches and spikelets and the yield traits of indica hybrid rice in different planting methods. Sci. Agric. Sin. 2016, 49, 35–53. [Google Scholar] [CrossRef]
- Yan, T.R.; He, Y.; Tang, Y.; Peng, Z.Y.; Ma, P.; Yu, H.Q.; Ding, F.; Wang, C.Y.; Sun, Y.J.; Yang, Z.Y.; et al. Effects of slow-release urea combined with conventional urea on leaf growth and yield formation of indica hybrid rice under direct seeding cultivation. J. Plant Nutr. Fertil. 2019, 25, 729–740. [Google Scholar] [CrossRef]
- Zhang, Y.; Liu, H.; Guo, Z.; Zhang, C.; Sheng, J.; Chen, L.; Luo, Y.; Zheng, J. Direct-seeded rice increases nitrogen runoff losses in southeastern China. Agric. Ecosyst. Environ. 2018, 251, 149–157. [Google Scholar] [CrossRef]
- Yan, J.; Wu, Q.X.; Qi, D.L.; Zhu, J.Q. Rice yield, water productivity, and nitrogen use efficiency responses to nitrogen management strategies under supplementary irrigation for rain-fed rice cultivation. Agric. Water Manag. 2022, 263, 107486. [Google Scholar] [CrossRef]
- Zhou, Q.S.; Wu, Q.X.; Zhu, J.Q.; Qiao, Y.; Peng, R.X.; Fan, C.J. Effects of different basal-topdressing ratios of nitrogen fertilizer on nitrogen absorption, transportation and utilization of direct-seeding rice. Jiangsu J. Agric. Sci. 2022, 38, 915–923. [Google Scholar] [CrossRef]
- Wang, Z.H.; Liu, X.J.; Ju, X.T.; Zhang, F.S. Field in situ determination of ammonia volatilization from soil: Venting method. Plant Nutr. Fertil. Sci. 2002, 8, 205–209. [Google Scholar] [CrossRef]
- Huang, M.; Yang, C.L.; Ji, Q.M.; Jiang, L.G.; Tan, J.L.; Li, Y.Q. Tillering responses of rice to plant density and nitrogen rate in a subtropical environment of southern China. Field Crops Res. 2013, 149, 187–192. [Google Scholar] [CrossRef]
- Liu, Y.L.; Li, Y.; Bai, Y.J.; Huang, X.C.; Zhang, Y.R.; Zhang, M.; Zhang, W.A.; Jiang, T.M. Effect of long-term fertilization patterns on dry matter and phosphorus accumulation and translocation in rice. J. Plant Nutr. Fertil. 2019, 25, 1146–1156. [Google Scholar] [CrossRef]
- Zhao, X.; Zhou, Y.; Min, J.; Wang, S.Q.; Shi, W.M.; Xing, G.X. Nitrogen runoff dominates water nitrogen pollution from rice-wheat rotation in the Taihu Lake region of China. Agric. Ecosyst. Environ. 2012, 156, 1–11. [Google Scholar] [CrossRef]
- Zhao, Z.; Yue, Y.B.; Sha, Z.M.; Li, C.S.; Deng, J.; Zhang, H.L.; Gao, M.F.; Cao, L.K. Assessing impacts of alternative fertilizer management practices on both nitrogen loading and greenhouse gas emissions in rice cultivation. Atmos. Environ. 2015, 119, 393–401. [Google Scholar] [CrossRef]
- Zhang, F.L.; Wu, M.Q.; Xia, Y.; Zhai, L.M.; Duan, X.L.; Fan, X.P.; Xiong, G.Y.; Liu, D.B.; Gao, L. Changes in nitrogen and phosphorus in surface water of paddy field in Jianghan Plain. Acta Pedol. Sin. 2019, 56, 1190–1200. [Google Scholar] [CrossRef]
- Ye, Y.S.; Liang, X.Q.; Jin, Y.; Zhao, Y.; Fu, C.D. Dynamic variation and runoff loss of nitrogen in surface water of paddy field as affected by water-saving irrigation and controlled-release fertilizer application. J. Soil Water Conserv. 2014, 28, 105–118. [Google Scholar] [CrossRef]
- Yang, Y.; Li, N.; Ni, X.; Yu, L.; Yang, Y.; Wang, Q.; Liu, J.; Ye, Y.; Tao, L.; Liu, B.; et al. Combining deep flooding and slow-release urea to reduce ammonia emission from rice fields. J. Clean. Prod. 2019, 244, 118745. [Google Scholar] [CrossRef]
- Yang, W.L.; Que, H.L.; Wang, S.W.; Zhu, A.N.; Zhang, Y.J.; He, Y.; Xin, X.L.; Zhang, X.F.; Ding, S.J. High temporal resolution measurements of ammonia emissions following different nitrogen application rates from a rice field in the Taihu Lake Region of China. Environ. Pollut. 2020, 257, 113489. [Google Scholar] [CrossRef] [PubMed]
- Ding, W.; He, P.; Zhang, J.J.; Liu, Y.; Zhou, W. Optimizing rates and sources of nutrient input to mitigate nitrogen, phosphorus, and carbon losses from rice paddies. J. Clean. Prod. 2020, 256, 120603. [Google Scholar] [CrossRef]
- Sun, L.; Wu, Z.; Ma, Y.; Liu, Y.; Xiong, Z. Ammonia volatilization and atmospheric N deposition following straw and urea application from a rice-wheat rotation in southeastern China. Atmos. Environ. 2018, 181, 97–105. [Google Scholar] [CrossRef]
- Dong, Y.; Wu, Z.; Zhang, X.; Feng, L.; Xiong, Z. Dynamic responses of ammonia volatilization to different rates of fresh and field-aged biochar in a rice-wheat rotation system. Field Crops Res. 2019, 241, 107568. [Google Scholar] [CrossRef]
- Yao, Y.; Zhang, M.; Tian, Y.; Zhao, M.; Zhang, B.; Zhao, M.; Zeng, K.; Yin, B. Urea deep placement for minimizing NH3 loss in an intensive rice cropping system. Field Crops Res. 2018, 218, 254–266. [Google Scholar] [CrossRef]
- He, T.; Liu, D.; Yuan, J.; Ni, K.; Zaman, M.; Luo, J.; Lindsey, S.; Ding, W. A two year study on the combined effects of biochar and inhibitors on ammonia volatilization in an intensively managed rice field. Agric. Ecosyst. Environ. 2018, 264, 44–53. [Google Scholar] [CrossRef]
- Zhou, F.; Ciais, P.; Hayashi, K.; Galloway, J.N.; Kim, D.-G.; Yang, C.; Li, S.; Liu, B.; Shang, Z.; Gao, S. Re-estimating NH3 Emissions from Chinese Cropland by a New Nonlinear Model. Environ. Sci. Technol. 2016, 50, 564–572. [Google Scholar] [CrossRef]
- Liu, X.; Chen, L.; Hua, Z.; Mei, S.; Wang, P.; Wang, S. Comparing ammonia volatilization between conventional and slow-release nitrogen fertilizers in paddy fields in the Taihu Lake region. Environ. Sci. Pollut. Res. 2020, 27, 8386–8394. [Google Scholar] [CrossRef]
- Hou, P.F.; Xue, L.X.; Yu, Y.L.; Xue, L.H.; Fan, L.H.; Yang, L.Z. Control Effect of Side Deep Fertilization with Slow-release Fertilizer on Ammonia Volatilization from Paddy Fields. Environ. Sci. 2017, 38, 5326–5332. [Google Scholar] [CrossRef]
- Xiao, X.Y.; Zhu, W.B.; Yang, D.; Yan, Y.; He, N.; Liu, M.D.; Xie, G.X. Effects of controlled release nitrogen fertilizer on nitrogen dynamic characteristics in surface water and yield in early paddy field. Ecol. Environ. Sci. 2018, 27, 2252–2257. [Google Scholar] [CrossRef]
- Lin, Q.H.; Liu, H.L.; Huang, Y.Y.; Luo, W.; Jiang, X.J. Release characteristics and fertilizer efficiency of coated controlled-release nitrogen for rice. Chin. J. Trop. Crops 2018, 39, 1718–1723. [Google Scholar] [CrossRef]
- Zheng, S.X.; Nie, J.; Dai, P.A.; Zheng, Y.J. Effect of controlled release nitrogen fertilizer on the morphological and physiological characteristics and senescence of root system during late growth stages of hybrid rice. Plant Nutr. Fertil. Sci. 2006, 12, 188–194. [Google Scholar] [CrossRef]
- Liu, R.L.; Li, Y.H.; Wang, F.; Zhao, T.C.; Chen, C.; Hong, Y.; Zhou, L.N. Effect of slow-release fertilizer side bar fertilization technology on rice yield and nitrogen use efficiency. J. Agric. Resour. Environ. 2014, 31, 45–49. [Google Scholar] [CrossRef]
- Wei, H.Y.; Chen, Z.F.; Xing, Z.P.; Zhou, L.; Liu, Q.Y.; Zhang, Z.Z.; Jiang, Y.; Hu, Y.J.; Zhu, J.Y.; Cui, P.Y.; et al. Effects of slow or controlled release fertilizer types and fertilization modes on yield and quality of rice. J. Integr. Agric. 2018, 17, 2222–2234. [Google Scholar] [CrossRef]


Disclaimer/Publisher’s Note: The statements, opinions and data contained in all publications are solely those of the individual author(s) and contributor(s) and not of MDPI and/or the editor(s). MDPI and/or the editor(s) disclaim responsibility for any injury to people or property resulting from any ideas, methods, instructions or products referred to in the content. |
© 2023 by the authors. Licensee MDPI, Basel, Switzerland. This article is an open access article distributed under the terms and conditions of the Creative Commons Attribution (CC BY) license (https://creativecommons.org/licenses/by/4.0/).