Article

Three-Dimensional Numerical Modeling and Analysis for the Municipal Solid-Waste Incineration of the Grate Furnace for Particulate-Matter Generation

1
Faculty of Information Technology, Beijing University of Technology, Beijing 100124, China
2
Beijing Laboratory of Smart Environmental Protection, Beijing 100124, China
3
Key Laboratory of Organic Industries, Department of Chemistry, Faculty of Sciences, Damascus University, Damascus P.O. Box 30621, Syria
4
Beijing GaoAnTun Waste to Energy Co., Ltd., Beijing 100024, China
5
Department of Chemistry, College of Natural and Computational Sciences, University of Gondar, Gondar P.O. Box 196, Ethiopia
6
School of Chemistry, Faculty of Sciences, The University of Melbourne, Victoria 3010, Australia
*
Author to whom correspondence should be addressed.
These authors contributed equally to this work.
Sustainability 2023, 15(16), 12337; https://doi.org/10.3390/su151612337
Submission received: 18 July 2023 / Revised: 31 July 2023 / Accepted: 2 August 2023 / Published: 14 August 2023
(This article belongs to the Special Issue Editorial Board Members’ Collection Series: From Waste to Energy)

Abstract

:
A 3D numerical model of the municipal solid waste incineration (MSWI) process was constructed based on a grate furnace with a daily processing capacity of 800 tons. Fluent was used for analyzing key factors affecting the concentration and diffusion level of particulate matter (PM). According to the actual MSWI plant working condition, a 3D model of the incinerator and the waste heat boiler has been constructed under benchmarks. Key factors affecting PM generation were determined by combining mechanistic knowledge and experts’ experience. They were the combustion temperature of solid phase municipal solid waste (MSW), the wall’s PM collision mode, and the second baffle length. Subsequently, the process of resolving the 3D numerical model was delineated. Then, a univariate analysis of the aforementioned 3D model was conducted for the three pivotal factors mentioned above. Conclusively, the effect of the important factors on the number of particles at the outflow of the incinerator was analyzed via orthogonal experiments to obtain the optimal combination. PM concentration initially diminished and then rose with the increased combustion temperature of the solid-phase MSW. Furthermore, a noteworthy reduction in PM concentration was observed when the second baffle length was 12.45–12.95 m. The greatest influence on the PM concentration of the outlet was posed by the wall’s PM collision mode, followed by the second baffle length. The appropriate adjustment of the combustion temperature of the solid-phase MSW, selection of wall materials, and design of the second baffle length were beneficial for diminishing PM concentration and ensuring long-term stable operation of the MSWI process. The combinative optimality of the three key factors was acquired via orthogonal experiments, which proved the subsequent optimal control of PM concentration at the outlet.

1. Introduction

Municipal solid wastes (MSWs) refer to items and substances with/without their original value that have been abandoned in production, habitation, and other activities [1]. Increased MSW generation has caused negative impacts on daily lives and socio-economic development, which causes environmental issues like Garbage Siege [2,3]. MSW incineration (MSWI) is an effective solution for environmental issues because of its high capacity reduction rate, fast processing speed [4]. The grate-type incinerator is widely used due to its reliable technology, large capacity, strong adaptability, convenient operation, and easy maintenance [5]. Adjusting the parameters to improve control can be inconvenient in practice due to equipment safety and pollution emission [6]. Meanwhile, the high cost of experimental research and the complexity of large incinerators also promote the control of incinerators via numerical modeling [7].
Previous investigations into the application of numerical modeling for MSW processes from a control perspective are as follows. Zhuang et al. [8] constructed a 2D model to determine the effects of grate speed and primary/secondary air distribution ratio on the combustion process. Tang et al. [9] analyzed the influence of primary air oxygen content and secondary air velocity on the temperature and concentration fields within the furnace with a 2D numerical simulation model. Nevertheless, the aforementioned 2D numerical simulation models do not fulfill the criteria for accurately computing the velocity, pressure, and concentration fields within the incinerator. Moreover, they do not take into account the 3D effect of the actual process.
The following studies offer insights into the 3D model of the MSWI process. Luo et al. [10] investigated the correlation between the mean temperature and the number of grids present in various height sections within the incinerator. Hu et al. [11] analyzed the variance of the temperature distribution, flow rate, and O2 concentration distribution of the furnace under SNCR positions. Gu et al. [12] analyzed the impacts of feedstock variation, air supply, and heat input on the combustion conditions of the incinerator. Yan et al. [13] leveraged a coupled Flic-Fluent simulation to evaluate the effect of primary air preheating on the combustion characteristics of the MSW in a grate-type incinerator. Yang et al. [14] studied the effect of different air supply methods and primary/secondary air ratios on NOX. Xia et al. [15] proposed a method combining a two-dimensional bed model with a three-dimensional stabilized furnace model. The three-dimensional steady-state simulation of turbulent gas combustion in the whole furnace was carried out. Hu et al. [16] investigated the effects of the primary NOX control (e.g., different loads, overfire air, and the ratio of overfire air and secondary air) and the secondary NOX control on NOX emissions and combustion characteristics.
Based on the aforementioned studies, the 3D simulation model mainly evaluates the combustion of the incinerator or the impact of a parameter on the MSWI process. However, there is a lack of numerical simulation and analysis of PM as well as an insufficient investigation into the factors influencing its concentration characteristics. Consequently, there is no study on the 3D numerical modeling and assessment of PM in the incinerator.
This study took the solid waste combustion and waste heat exchange stage of an MSWI plant with a daily treatment capacity of 800 t/d in Beijing as its research object. The above analysis was used to simulate the dispersion process of PM. As one of the main pollutants of waste incineration, PM was toxic and adsorbable. Therefore, a 3D simulation was performed for PM concentration and diffusion in the MSWI process. Feasible suggestions were provided for controlling PM concentration and improving particle-capturing equipment to reduce PM content.
Notwithstanding the certain merits of the MSWI technology, numerous air pollutants are additionally created, including PM (PM 2.5 and 10), acid gases (NOX, SO2, HCl, etc.), heavy metals and their derivatives, and trace organic compounds (dioxins, furans, etc.) [17,18,19]. Refs. [20,21] show that the fly ash (FA) produced via the MSWI process is toxic with a large yield. Fine PM, constituting the primary component of the FA produced via MSWI processing, is one of the leading sources of PM 2.5 in the atmosphere [22,23]. The composition structure of the incineration FA has obvious variability, with more irregular agglomerated structures, uneven PM surfaces, and dispersive PM distribution [24].
The smaller the PM size, the smaller the corresponding inter-PM pore space, and the more closely distributed PM [25]. The fine particles of the FA possess a high adsorption affinity, and the concentration of heavy metals embedded within it increases as the particle size of FA diminishes [26]. These heavy metals are non-degradable, toxic, and biologically effective [27,28], and they pose a serious threat to human health by potentially causing various diseases and even death [29,30]. Dioxins (DXN), heavy metals, and furans are carried on the surface of the particles. When these substances are discharged into the air, a series of reactions will occur and spread widely in a variety of ways, resulting in more pollutants. Dioxins can be transported and deposited in areas far away from their emission sites through air, water, and migratory species and products. Furan floats in the air during transportation and disposal with fly ash and is absorbed by the human body. It pollutes water and soil through rainfall. It can also be accumulated in animals and plants and absorbed by the human body through plant chains. These will cause serious harm to human health and the environment. Reducing particulate matter emissions from the source is conducive to the sustainable development of the environment.
A 3D numerical model of the MSWI process based on a grate-type furnace with a daily processing capacity of 800 tons was constructed using Fluent to analyze the key factors affecting the concentration and diffusion level of PM. Firstly, 3D models of the incinerator and waste heat boiler were created following the actual design. Benchmark-operating conditions were established, and benchmark experiments were performed. Subsequently, a single-factor analysis was conducted for the principal determinants of PM concentration at the outlet: the combustion temperature of solid-phase MSW, the wall’s PM collision pattern, and the second baffle length. Finally, based on the results of the orthogonal experiment, the impact of the aforementioned three key factors was analyzed, and the anticipated optimal combination of key factors was identified. This work has the following contributions in terms of directly being useful and applicable: (1) Data support for reducing PM concentration was provided from the perspective of process improvement and optimal control. (2) PM and its carrying pollutants were reduced from the source. (3) The suitable combustion temperature of solid-phase MSW was studied to inhibit the generation of PM. (4) The appropriate wall particle collision mode and the length of the second baffle were studied to improve the trapping effect in the particle diffusion process. (5) The PM capture technology has been improved, and the MSWI particulate matter simulation experience has been accumulated, which has promoted the sustainable development of domestic waste incineration technology.

2. Description of Municipal Solid-Waste Incineration Process with Regard to PM Generation

2.1. Process Description

Figure 1 shows the process flow of a mechanical grate-type MSWI process in Beijing.
The MSW is poured into the feed hopper and pushed into the grate furnace with the feeder carried by the movement of the grate. The combustion of the MSW on the grate consists of four stages: drying section, combustion section I, combustion section II, and combustion section. After fracturing, pyrolysis, and oxidation in the furnace, the MSW gradually decreases in volume and particle size and eventually forms PM. Particles float in the furnace air and their movements are susceptible to the solid-phase combustion temperature, secondary air inlet temperature, and wall temperature.
As the PM flows in the flue–gas fluid, interaction forces (e.g., trapping force, thermophoretic force, and Saffman lift force) affect the accumulation and dispersion of PM. This affects particle concentration distribution. Hot gases from combustion up the flue. The flow rate and pressure change significantly through the second and third flue. Particle concentration is significantly reduced by the second baffle. The flue gas passes through the waste heat boiler and then through the superheater, evaporator, and coal saver. It is sent to the reactor and baghouse (containing activated carbon and lime to adsorb dioxins, large PM, and heavy metals) to purify the flue gas.

2.2. Analysis of Influencing Factors of Particle Concentration

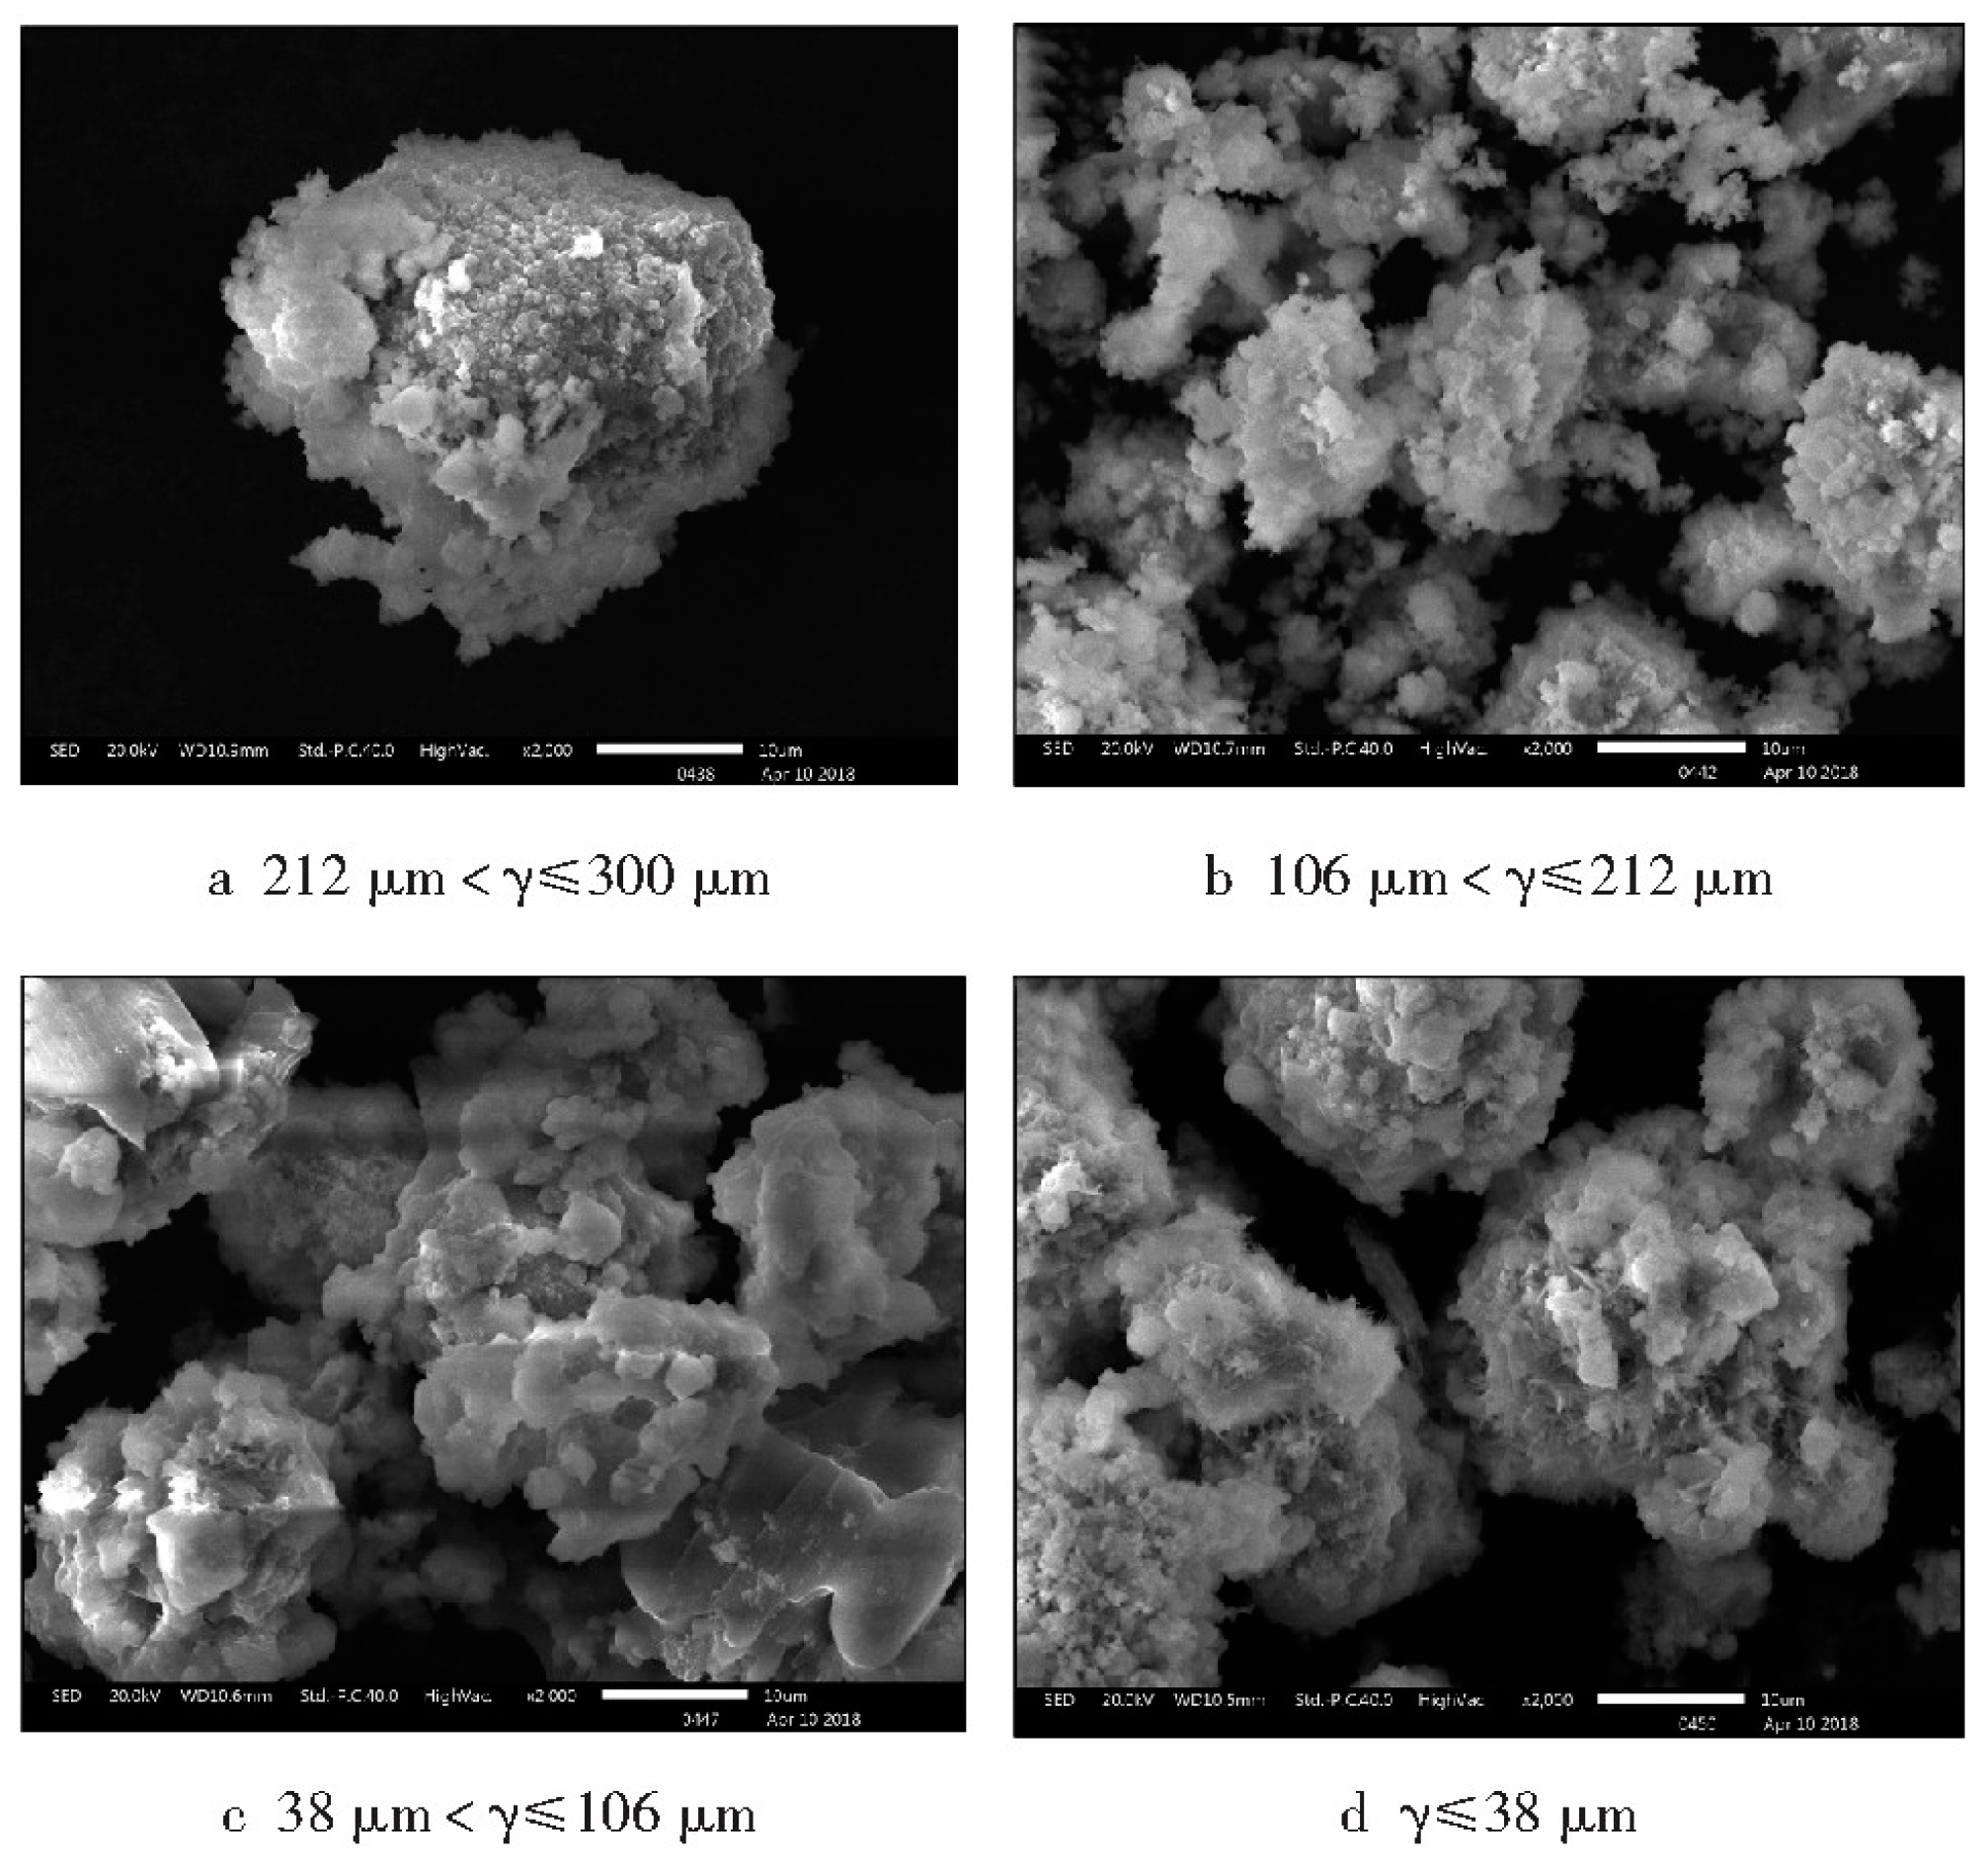
Despite the significant features of MSWI technology in terms of non-hazardousness, minimization, and resource utilization, the process still emits various pollutants [31]. The MSW with complex compositions gradually decreases in size, and eventually forms PM after fracture, pyrolysis, and oxidation in the furnace [32,33]. PM is mostly irregularly shaped aggregates, with relatively few spherical bodies, rod-like aggregates, and flocculent aggregates. The field measurement data of an MSWI plant in Beijing show that the size of flue-gas PM presents normal distribution. In total, 70% are concentrated at 38.5–75 μm, and the FA with a PM size less than 38.5 μm and more than 450 μm accounts for 6.3 and 2.9%, respectively. Figure 2 illustrates the microscopic morphology of FA’s PM with different sizes.
The combustion temperature of solid MSW will affect the generation of particles due to the difference in MSW components. The PM will be suspended in the furnace air under the high-temperature flue gas. Meanwhile, different solid MSW combustion temperatures affect the movement of particles in the furnace.
MSW combustion forms black smoke under incomplete combustion. A large number of carbon particles attached to black smoke exist in the form of solid particles. Most of the non-combustibles in the furnace are retained on the grate and discharged in the form of slag. Some small and light materials and high-temperature gas form flue gas flow containing PM in the furnace. PM collides with the wall of the incinerator in the process of PM flowing with airflow in the incinerator due to the turbulent gas.
Different wall materials affect the collision mode of particles, which results in the adhesion, erosion, and deposition of particles on the wall. Therefore, particle concentration is reduced. When the flue gas flows through the second/third flue, the process design will add a particle capture device (second baffle) in the incinerator flue to reduce particle concentration. That is, the length of the second baffle directly affects the PM-capturing effect and reduces PM concentration.
In summary, the combustion temperature of the solid MSW, the collision mode of wall particles, and the length of the second baffle affect particle concentration at the outlet of the incinerator. The wall particle collision mode included reflection, trap, and wall jet. This work simulated the above three factors (i.e., the combustion temperature of solid phase MSW, the collision mode of wall particles, and the length of the second baffle) on particle concentration at the outlet of the incinerator.

3. Material and Methods

3.1. Material

Data are derived from an MSWI plant site in Beijing. The calorific value of solid phase MSW is 8350 kJ/kg, and the elemental composition of MSW is shown in Table 1. Fluent is used to simulate the PM flow in the incinerator. The continuous phase is calculated using the coupled method, and the velocities of the primary air inlet, secondary air inlet, and outlet are 2.4, 0.4, and 13.4 m/s. The discrete phase is calculated using two-phase coupling. PM is sprayed upwards from the primary air outlet into furnace chamber at 2.4 m/s for 1000 iterations. The exit velocity uses the entrance boundary condition; turbulence intensity at the inlet and outlet is 5%; the turbulent viscosity ratio is 10. Moreover, the surrounding walls are set to be adiabatic. Table 2, Table 3 and Table 4 list the temperature and material of each wall, the discrete phase parameters, the point attributes, and physical model settings, respectively.

3.2. Methods

Combined with the MSWI process and PM formation mechanism, the numerical modeling and analysis method (Figure 3) is proposed for the three key factors affecting PM concentration, namely, the combustion temperature of solid phase MSW, the wall’s PM collision mode, and the second baffle length. It includes a 3D modeling module for the incinerator and waste heat boiler, a 3D model-solving module, a single factor analysis module, and an orthogonal experiment analysis module.
As shown in Figure 3, firstly, according to the MSWI process and the formation mechanism of particulate matter, three factors affecting the concentration of particulate matter at the outlet of the incinerator are determined. The three factors are solid combustion temperature, wall particle collision mode, and the length of the second baffle. Then, according to the actual structure of the incinerator, this paper uses spaceclaim to establish the 3D model of the incinerator and waste heat boiler and uses ICEM-CFD to divide the grid. Then, Fluent is used for numerical simulation to obtain a benchmark experiment that meets the field conditions. On the basis of the benchmark experiment, the single-factor experiment was carried out to analyze the influence of single factor on the concentration of particulate matter at the outlet of incinerator. On the basis of single factor experiment, orthogonal experiment was carried out to analyze the influence of comprehensive factors on the concentration of particulate matter at the outlet of incinerator and the optimal combination parameters were obtained.

3.2.1. 3D Modeling Module for Incinerator and Waste Heat Boiler

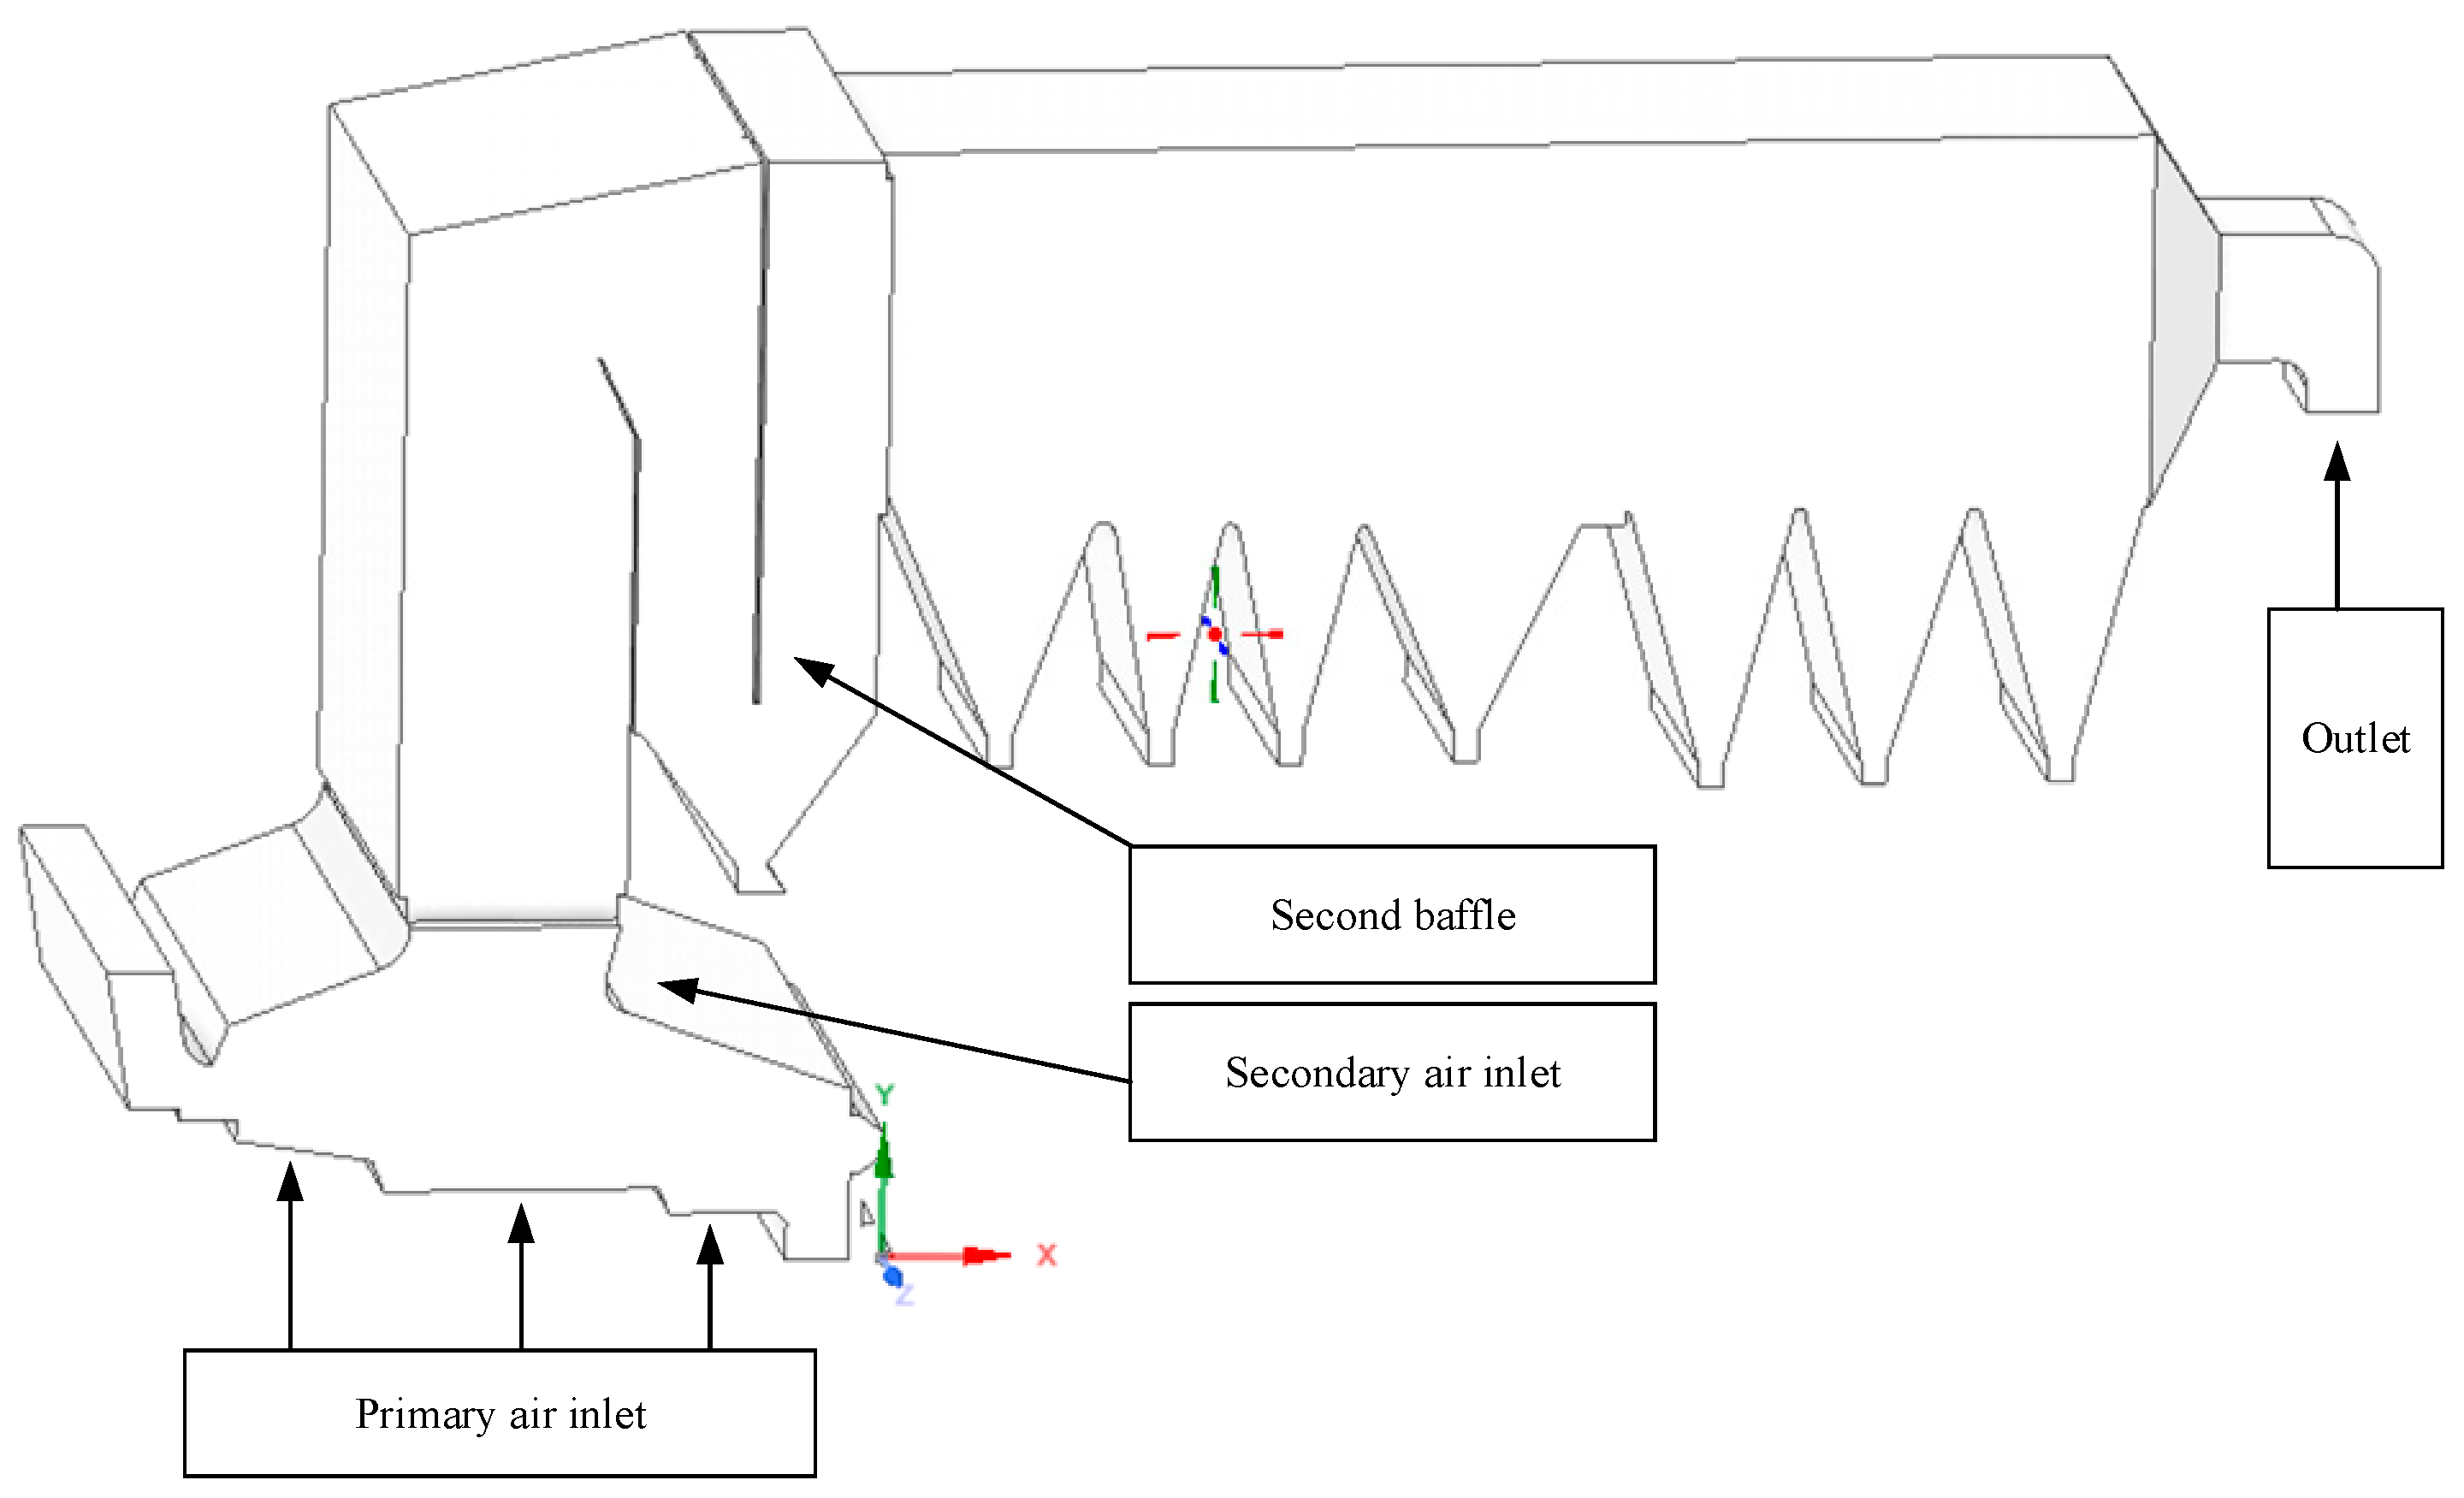
Figure 4 shows the structure of the 3D model of the incinerator and waste heat boiler.
The widths of the grate and flue are 12.9 and 11.622 m, respectively. The grate is divided into the drying section, burning section, and combustion section with lengths of 2.81, 5.57, and 2.14 m, respectively. The 3 flue lengths of the incinerator from left to right are 4.68, 2.423, and 2.4 m, respectively. The height of the incinerator is 22.5 m. The length of the waste heat boiler is 25.975 m, and its height and width are 6.795 and 7.1 m, respectively.
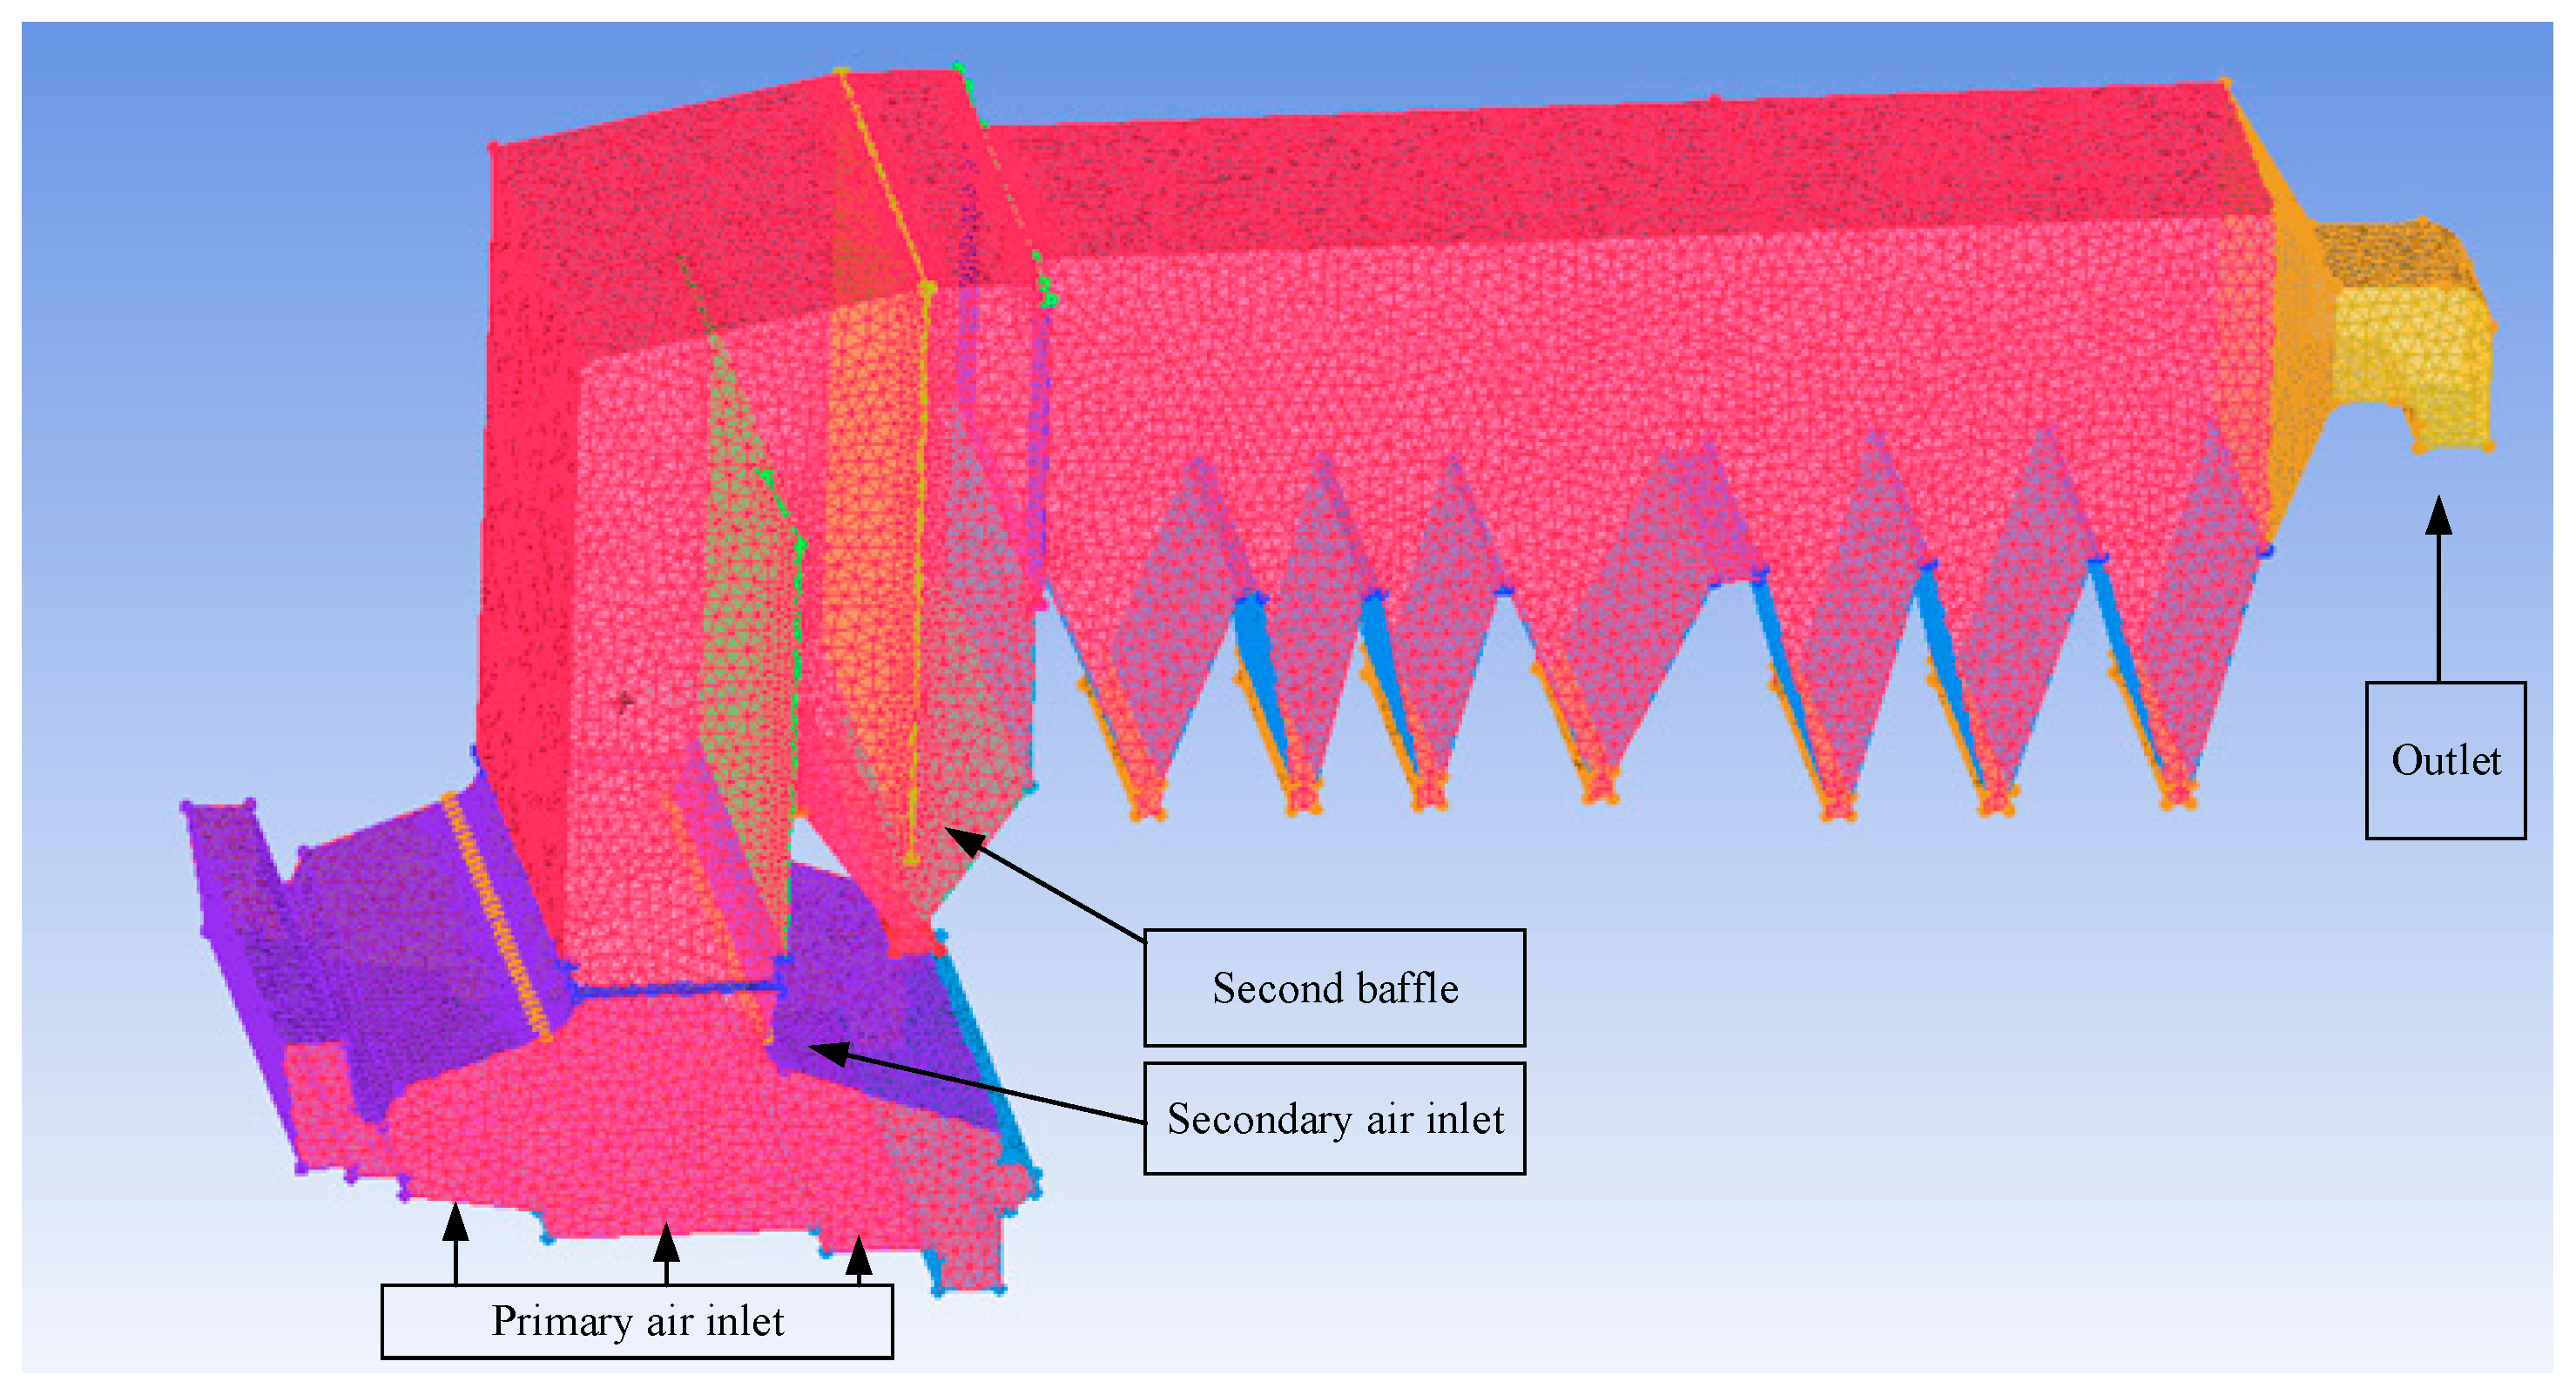
The parts such as the coal saver and the ash hopper of the waste heat boiler are simplified when modeled with SpaceClaim due to the complex structure of the incinerator. When ICEM CFD is used for meshing, the main setting is Tetra/Mixed, a body mesh type for unstructured meshing. The grid of the furnace part is encrypted, and overall mesh number is 880,000 (Figure 5).

3.2.2. Three-Dimensional Model Solver Module

A third-order discrete format is used for the numerical modeling study. Fluent is used to simulate the gas-phase heat and mass transfer process above the bed. The discrete phase model (DPM) is used to solve the PM diffusion process. Moreover, the coupled algorithm (Coupled) is used to solve the steady-state control equations. The simulation process converges by increasing iteration number and decreasing the relaxation factor.
The gas phase conservation equation, turbulence model, and discrete phase model involved in the 3D model modeling are shown below.
Gas phase conservation equations, including continuity, momentum, and energy equations, are shown below.
(1) Gas phase conservation equation
Continuity equation is expressed as follows:
( φ ρ g ) t + ( φ ρ g U g ) x + ( φ ρ g V g ) y = S sg
where ρ g is the gas density; U g and V g are the velocity in the a and b directions; source item S sg is the conversion rate of the MSW to the gas; p g is the gas pressure.
Momentum equation is expressed as follows:
( φ ρ g U g ) t + ( φ ρ g U g U g ) x + ( φ ρ g V g U g ) y = p g x + F ( U g )
( φ ρ g V g ) t + ( φ ρ g U g V g ) x + ( φ ρ g V g V g ) y = p g y + F ( V g )
where F ( U g ) and F ( V g ) are the resistance of the bed to gas flow, which can be calculated using the Ergun equation.
Energy equation is expressed as follows:
( φ ρ g H g ) t + ( φ ρ g U g H g ) x + ( φ ρ g V g H g ) y = x ( λ g T g x ) + y ( λ g T g y ) + Q h
where H g is the enthalpy of the gas; λ g is the thermal diffusion coefficient consisting of diffusion and turbulence; Q h indicates the heat gained by the gas phase due to incineration.
(2) Turbulence model
The flow of turbulent gases in the incinerator is solved using the standard K-Omega model. The model is constructed based on the turbulent energy equation and the diffusion rate equation, which takes into account the Reynolds number, compressibility, and shear flow propagation. It is suitable for handling numerical calculations with low Reynolds numbers. This simulation uses the K-Omega SST model to calculate the turbulent motion, and the others use k and omega equations.
ρ k t + ρ U j k x j x j [ ( μ + σ k μ T ) k x j ) ] = τ i j U i x i β ρ k ω ρ ω t + ρ U j ω x j x j [ ( μ + σ ω μ T ) ω x j ) ] = γ ν T τ i j U i x i β ω 2 + 2 ρ ( 1 F 1 ) σ ω 2 ω k ω x j x j
where U i and U j are the i and j components of the velocity, respectively; x i is the Cartesian coordinate; ρ is the fluid density; μ is viscosity; σ k , β , σ ω , γ , β , and σ ω 2 are the model coefficients; F 1 is a mixing function.
k and ω are turbulent kinetic energy and specific turbulent dissipation rate, respectively (Equation (6)).
k = 3 2 ( u a v g I ) 2 ω = k 1 / 2 C μ 1 / 4 l
where u a v g is the average speed; I is turbulence intensity; C μ is the empirical constant of the K-Omega model, with a value that is 0.09 usually; l is the characteristic length of the obstacle.
τ i j is Reynolds stress, which is calculated as follows:
τ i j = μ T ( U i x j + U j x i ) 2 3 ρ δ i j
where δ i j is the Kronecker function; ν T = μ T / ρ is the dynamic eddy viscosity; μ T is the eddy viscosity.
(3) Discrete phase model (DPM)
The solution steps of the DPM model in the simulation are as follows. We solve the Navier–Stokes equation for the continuous-phase fluid under the Euler framework and set the DPM before the continuous-phase calculation. When the initial value of the continuous phase calculation results is obtained, PM is injected into the flow field. That is, PM is sprayed into the flow field in the form of a surface. The DPM model uses the PM trajectory equation in the Lagrangian framework. Meanwhile, the PM mass loading affects the gas-phase flow field. When the calculation converges again (the residual threshold is set to 0.0001 in the simulation), the calculated results expressed as PM trajectories are obtained. The motion equation of PM is established based on Newton’s second law. The equation of trajectory can be obtained using the equilibrium equation of external force on PM as follows:
d U p d t = U U p τ r + g ( ρ p ρ ) ρ p + F p
τ r = ρ p d p 2 18 μ 24 C D R e
where U is the fluid-phase velocity, m/s; U p is the PM velocity, m/s; subscript p indicates PM; F p considers Saffman lift and virtual mass force; ρ p is the PM density; d p is the PM size; μ is the viscosity coefficient; C d is the correction factor.
The concentration distribution of PM is obtained using the log-normal distribution method, and the distribution of random variable x is as follows.
f ( x ) = 1 2 π σ exp [ ( ln x θ ) 2 2 σ 2 ]
θ = ln m g = 2 ln M 1 1 2 ln M 2 , σ = S g = ln M 2 2 ln M 1
M 1 = 1 n i = 1 n x i , M 2 = 1 n i = 1 n x i 2
where θ and σ are parameters; m g and S g are the geometric mean and standard deviation, respectively; x i is the concentration value of PM; n is the number of concentration values.
The percentage concentration of PM is calculated as follows:
x i q i = m g s g z i
where q i is the percentile; z i is the number of deviations of the percentile from the median.
As PM reflects off the walls, the model in this work adopts the normal- and tangential-reflect recovery coefficients of the FA proposed by Grant and Tabakoff. Its calculation is as follows:
e n = 0.993 1.76 θ + 1.56 θ 2 0.49 θ 3 e τ = 0.998 1.16 θ + 2.11 θ 2 0.67 θ 3
where e n is the normal reflect coefficient, and e τ is the tangential reflect coefficient.
(4) Analysis of force on PM in the furnace
PM is defined as ash solid, and the shape is spherical in the DPM model settings. In addition to gravity and buoyancy, PM is subjected to various forces in the gas-phase flow field during motions. There is variability in the role of different forces on PM motions. Inertial force exerted by PM in motions can be expressed as follows:
F i = π 6 d p 3 ρ p d U p d t
Pressure gradient force is induced on PM by the pressure gradient in the gas-phase flow field (Equation (16)).
F pre = V P P x
where V P is the solid phase velocity.
Spurious mass force resulting from the apparent mass effect can be expressed as follows:
F vm = ρ g 2 V P ( d U d t d V p d t )
Magnus lift is lift force due to the rotation of PM. It has the same order of magnitude as gravity and can be expressed as follows:
F Mag = π 8 d P 3 ρ g ω p × ( U V p )
where ω p is the angular velocity of the PM rotation.
The equilibrium equation for force acting on PM in the DPM model is as follows:
d U p d t = F D ( u u p ) + g ( ρ p ρ ) / ρ p
F D = 18 μ ρ p d p 2 C D R e 24
where F D ( u u p ) is traction force per unit mass of PM; R e is the relative Reynolds number (Reynolds) defined as follows:
R e = ρ d p μ | U U p |
The expression for traction coefficient C D is as follows:
C D = α 1 + α 2 R e + α 3 R e
For spherical PM, α 1 , α 2 , and α 3 are constant over a range of the Reynolds number.
Gravitational force on PM is defined via the following equation:
F g = m p g = 1 6 π d p 3 ρ p g
where m p is PM mass; g is the acceleration of gravity.

3.2.3. Single-Factor Analysis Module

Single-factor analysis is performed to analyze the effects of the combustion temperature of the solid-phase MSW, wall’s PM collision mode, and second baffle length on PM concentration at the incinerator outlet.
The expression for the relationship between PM concentration at the outlet of the incinerator and the three factors mentioned is as follows
y = f model ( x T , x W , x G )
where x T , x W , and x G denote the combustion temperature of the solid-phase MSW, wall’s PM collision mode, and second baffle length, respectively.

3.2.4. Orthogonal-Experiment Analysis Module

The single-factor variable analysis of the combustion temperature of the solid-phase MSW, the wall’s PM collision mode, and the second baffle length can only obtain the influence of one of the three factors on PM concentration at the outlet. However, PM concentration at the outlet is affected by at least the above three factors in practical engineering. A multi-level integrated analysis of the above three factors is now conducted using orthogonal experiments. It examines the combined effect of these three factors on PM concentration at the outlet, which can obtain the optimal combination of parameters.
The output can be expressed as follows for the orthogonal experiment:
y d esign = f model ( x T design , x W design , x G design )
where x T design , x W design , and x G design denote the level values when orthogonal experiments are performed for x T , x W , and x G , respectively.
The importance of each factor is analyzed using the extremum difference analysis as follows.
R q = f max ( y ¯ q 1 , y ¯ q 2 , , y ¯ q v ) f min ( y ¯ q 1 , y ¯ q 2 , , y ¯ q v )
where q denotes the q th factor in the orthogonal experiment; v denotes the v th level of the q th factor; y ¯ q v = n = 1 r y n design r denotes the mean of r experimental data { y n design } n = 1 r at the v th level of the q th factor; r denotes the number of times the level appears in the experiment.
q = 1, 2, and 3 correspond to the combustion temperature of solid phase MSW, the wall’s PM collision mode, and the second baffle length, respectively.

4. Experimental Results

4.1. 3D Modeling Results under Benchmark Working Conditions of an Actual MSWI Plant

PM concentration at the outlet of an industrial on-site incinerator is used to validate the 3D numerical model. The actual PM concentration at the outlet of the waste heat exchange was tested by a professional testing company. Then, some operating parameters were used in the Fluent-based 3D numerical model. Finally, some simulation parameters were set based on experience to reach a near-real detection value in the actual MSWI plants. That is to say, the simulation experiment, consistent with the actual PM concentration at the outlet of the waste heat exchange, is used as the benchmark working condition.
Therefore, the relevant numerical model in terms of working conditions is set as follows. The discrete phase is calculated in a bidirectional coupling mode; the PM injection velocity at the primary air inlet is 0.7 m/s; the PM diameter adopts Rosin–Rammler distribution; the average PM size is 45; the combustion temperature of solid-phase MSW is 1080 K; the PM collision mode at the wall is reflect; the second baffle length is 11.2 m.
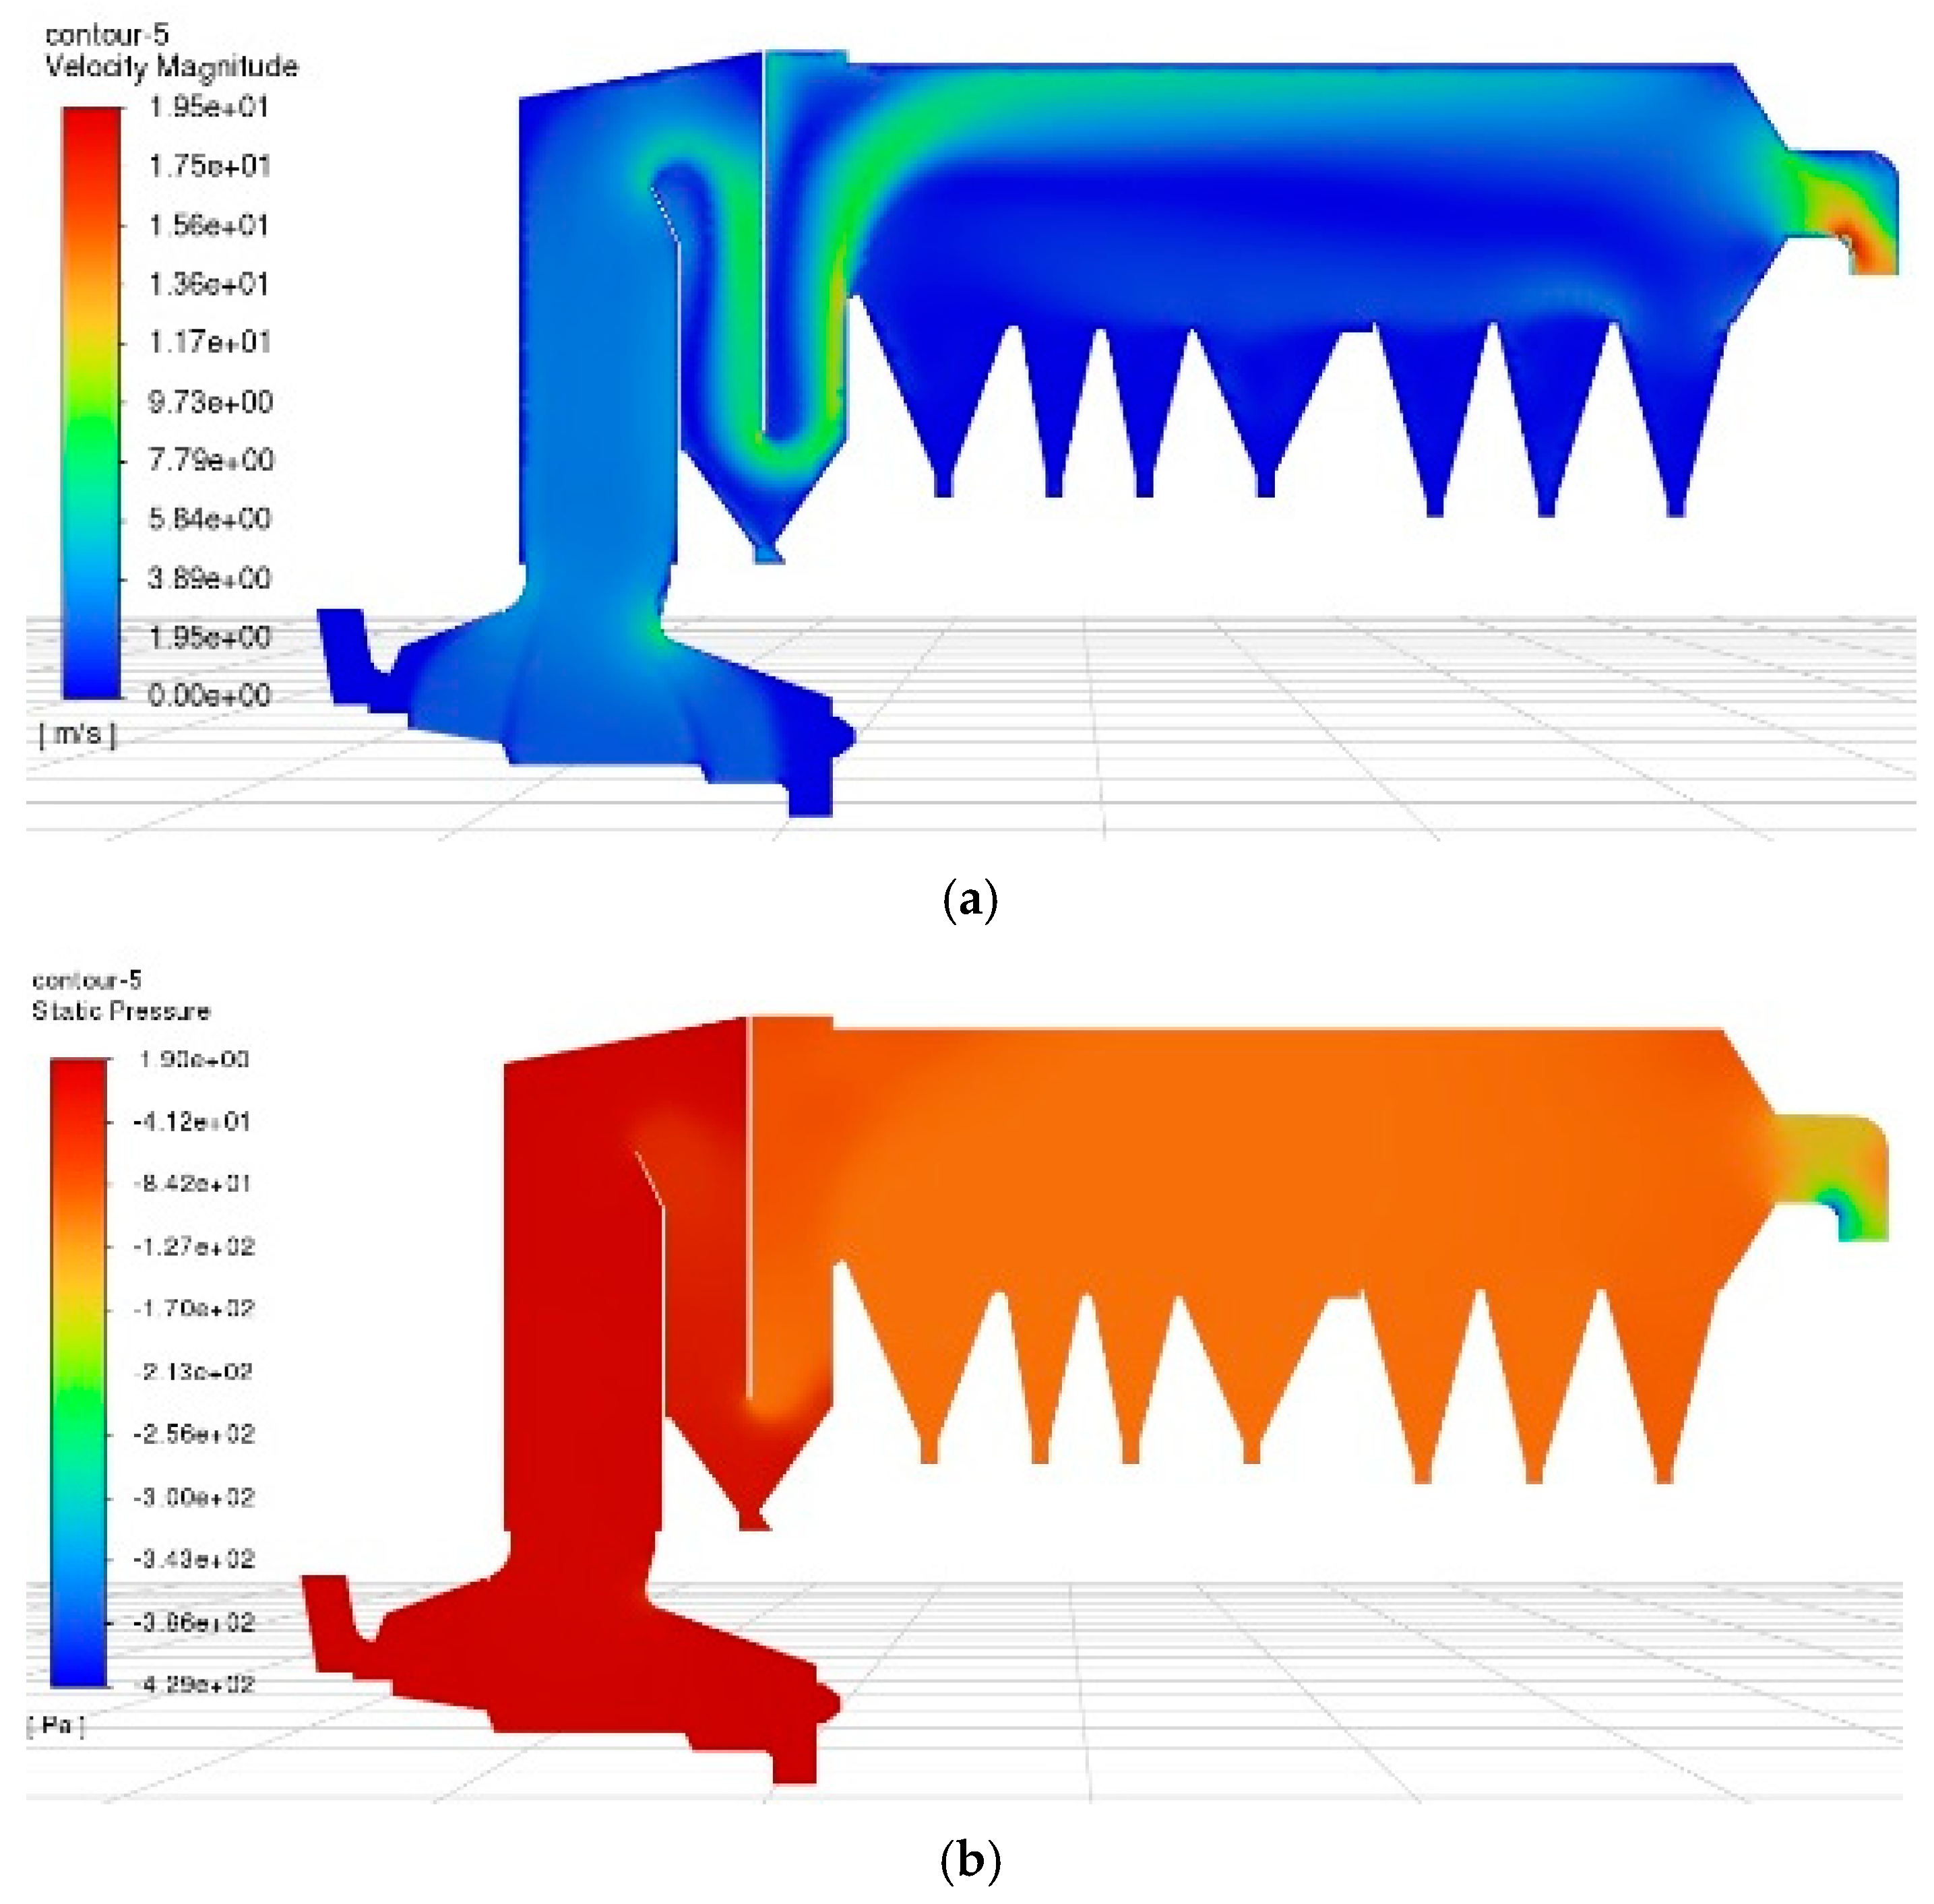
The velocity cloud and dynamic pressure vector diagram of the X-Y cross-section are used as a reference to visually observe the flow field variation in the incinerator (Figure 6).
Fluid flow in the incinerator is roughly divided into five stages, i.e., furnace chamber, first flue, second flue, third flue, and waste heat boiler (Figure 6a). The fluid velocity is significantly higher at the second and third flue and reaches the maximum at the third flue. The main reason is that there is turbulence when the fluid flows in the incinerator. The flue–gas velocity increases when it enters the second flue from the first one, and it increases further in the third flue.
There is a strong correlation between the distribution of the dynamic pressure and the distribution of the velocity (Figure 6b). The dynamic pressure gradually decreases in the complete process of fluid flowing through the flue from the furnace chamber through the waste heat boiler. The pressure decreases when the velocity of the fluid inside the furnace increases.
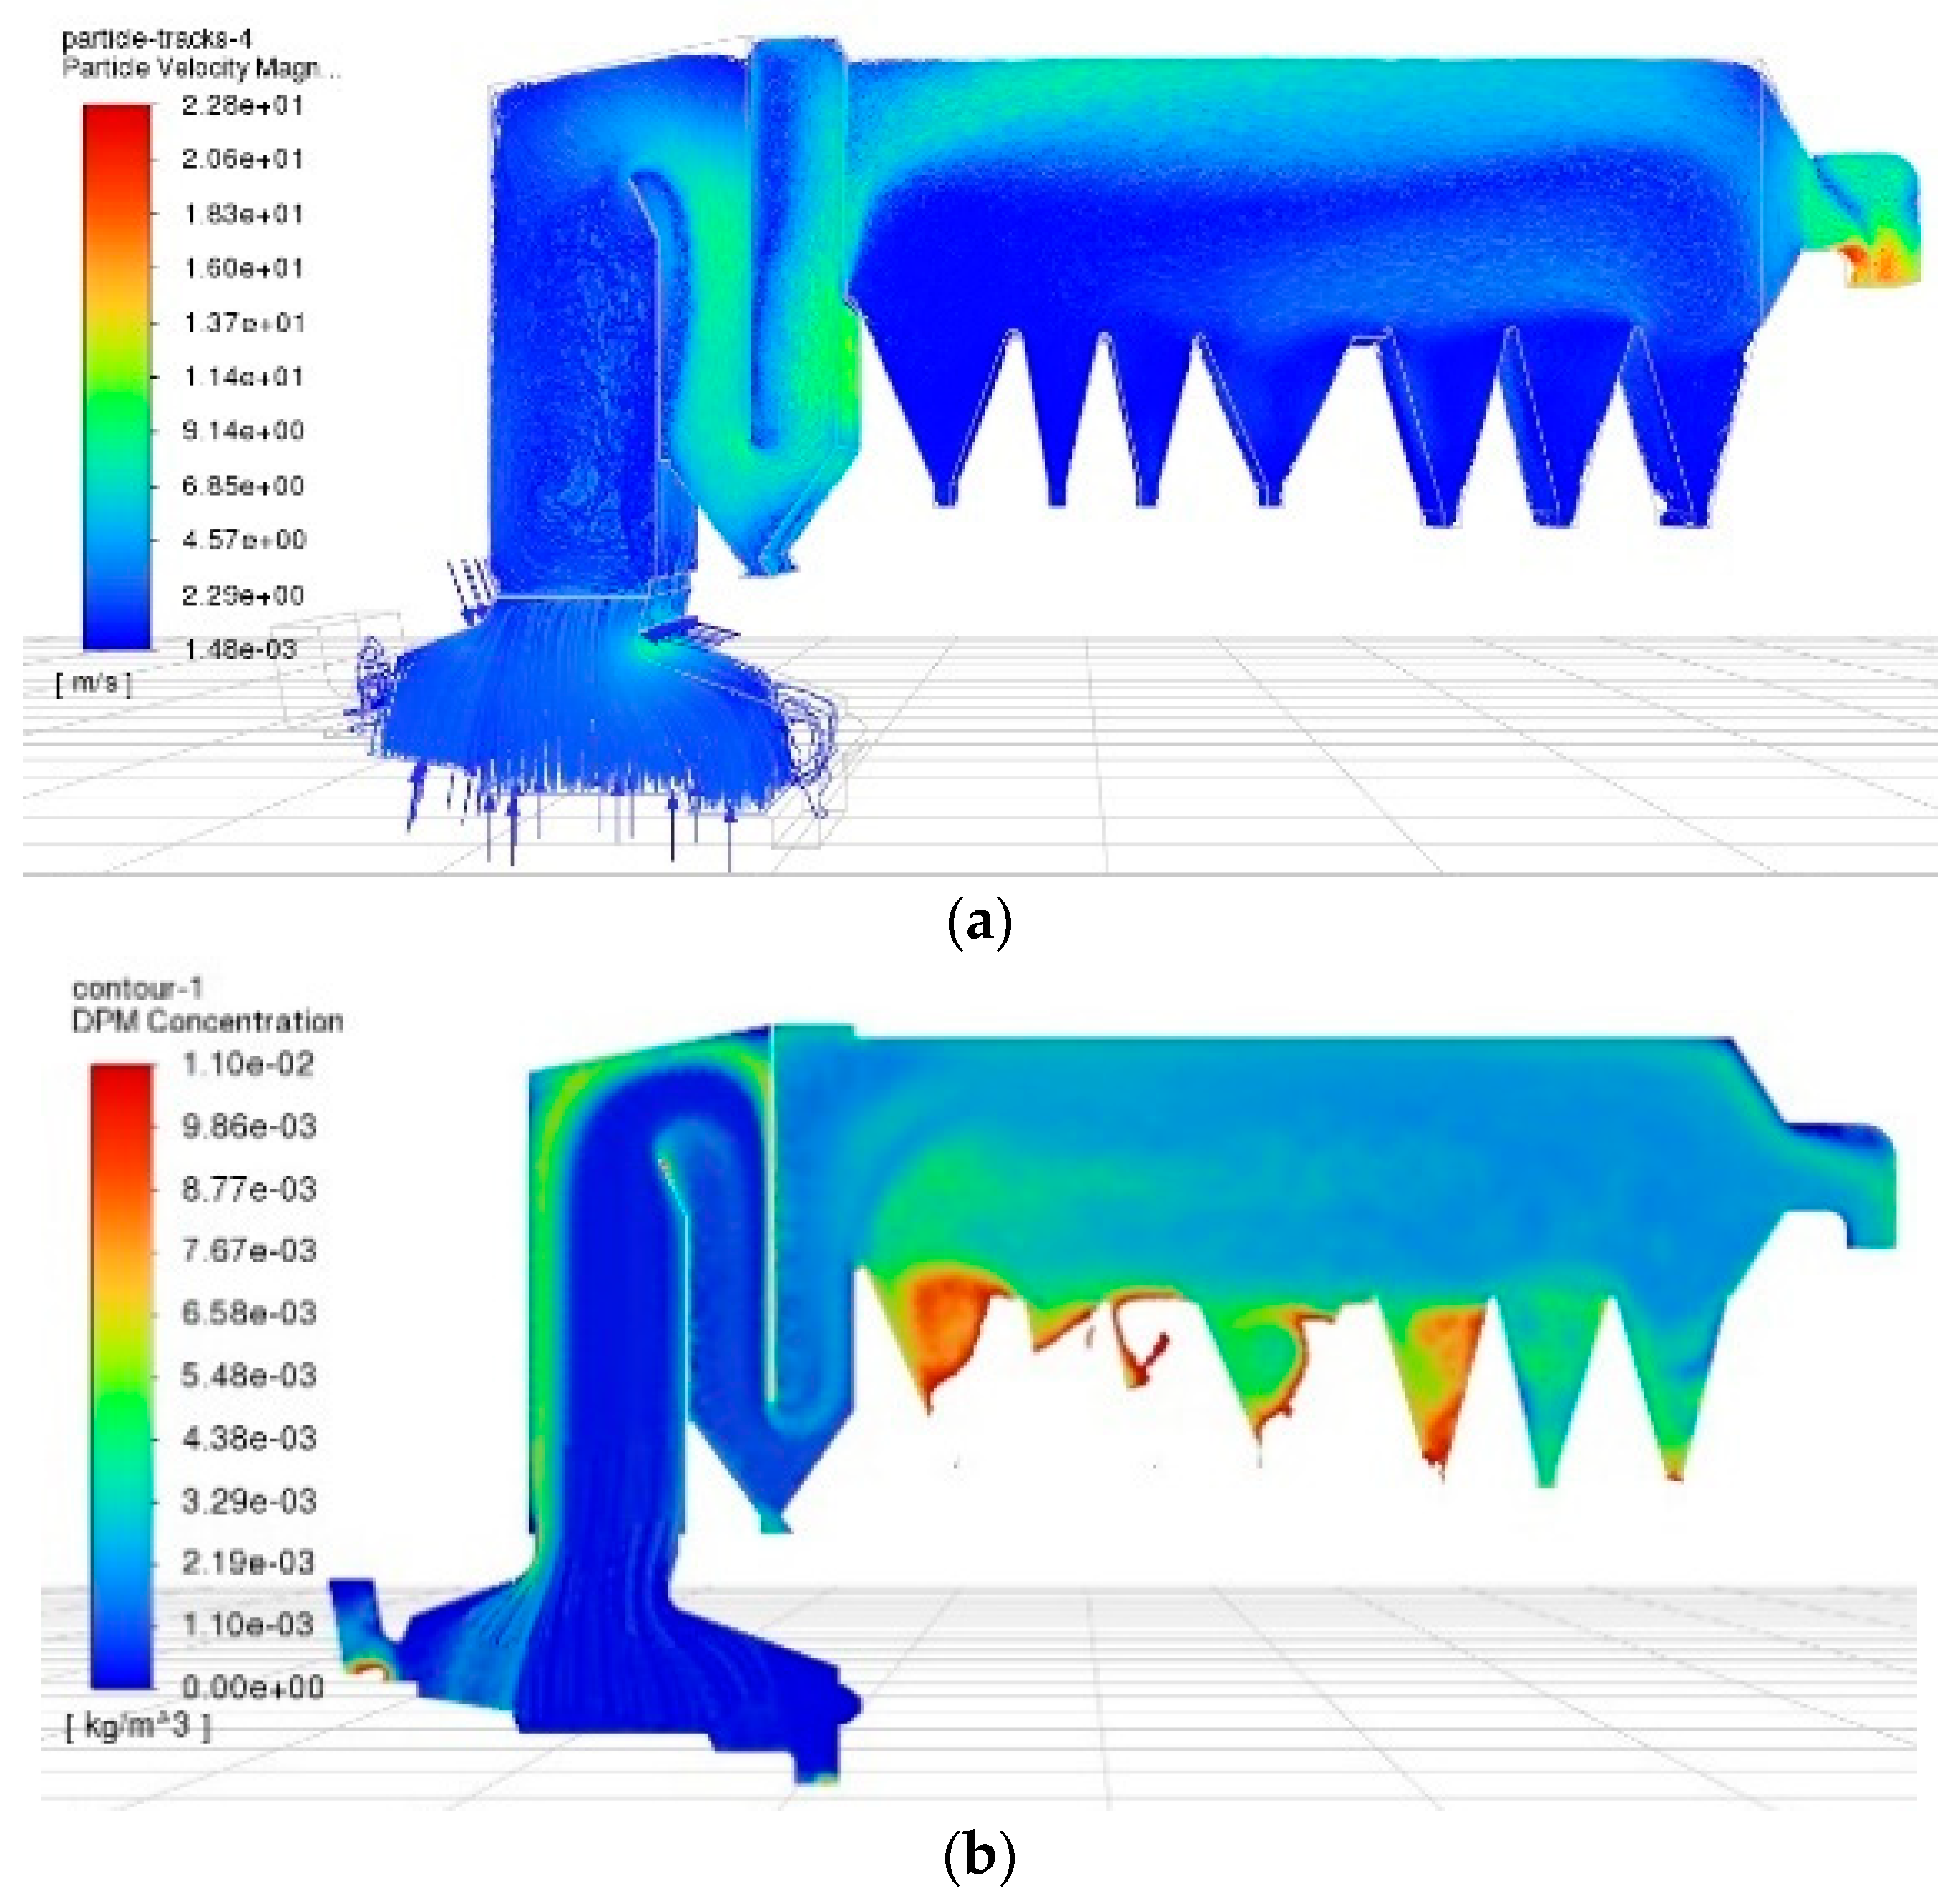
Figure 7 presents the cloud plots of PM from the incinerator and the waste heat boiler.
The velocity distribution of PM is close to fluid velocity distribution inside the incinerator (Figure 7a). PM does not participate in the reaction process of the internal gas. Thus, the interaction force with the fluid inside the furnace is small or nearly negligible. So, the flow velocity of PM only varies with the fluid–flow velocity inside the furnace.
The PM concentration is larger at the top of the corner flowing from the first flue to the second flue (Figure 7b). PM concentration in the waste heat boiler is slightly higher than that at the flue. PM concentration reaches the maximum at the funnel of the waste heat boiler.

4.2. Results of the Single Factor Analysis and Discussion

4.2.1. Analysis of the Effect of the Combustion Temperature of Solid-Phase MSW on PM Concentration at the Outlet

The combustion temperature of solid-phase MSW affects PM concentration distribution at the outlet by influencing the changes in pressure. The close relationship between PM concentration and temperature at the incinerator outlet is analyzed via PM simulation experiments at different combustion temperatures of solid-phase MSWs. (Note: the article only sets the combustion temperature of solid MSW for the experiment and does not simulate the MSW combustion process.) Figure 8 illustrates the change curve of PM concentration at different combustion temperatures of solid phase MSWs when the collision mode of the wall’s PM is set as reflection.
When the wall’s PM collision mode is reflection, PM concentration is affected by changing the combustion temperature of the solid-phase MSW and the temperature inside the entire incinerator. Once the temperature is 850–875 K, PM concentration decreases significantly. When the temperature is 875–950 K, PM concentration remains almost near 1.5 g/m3. When the temperature is 950–975 K, PM concentration increases rapidly. When the temperature is between 975 and 1100 K, PM concentration increases gradually with the increased temperature; however, the growth trend is slow. PM concentration reaches a minimum of 925 K with the increased temperature. When the temperature is 850–975 K, combustion is not sufficient, and the corresponding PM is less. The MSW burns more fully at 975 K, which produces a large amount of particulate pollutants (with a concentration of 3 g/m3). When the wall’s PM collision mode is reflection, the PM will reflect after contacting the wall. Therefore, PM concentration at the outlet varies with the temperature change.
Based on the above analysis, there is no effect on normal operation on the premise of ensuring stable combustion. Therefore, maintaining the combustion temperature of the solid-phase MSW between 875 and 950 K can reduce the generation of PM.
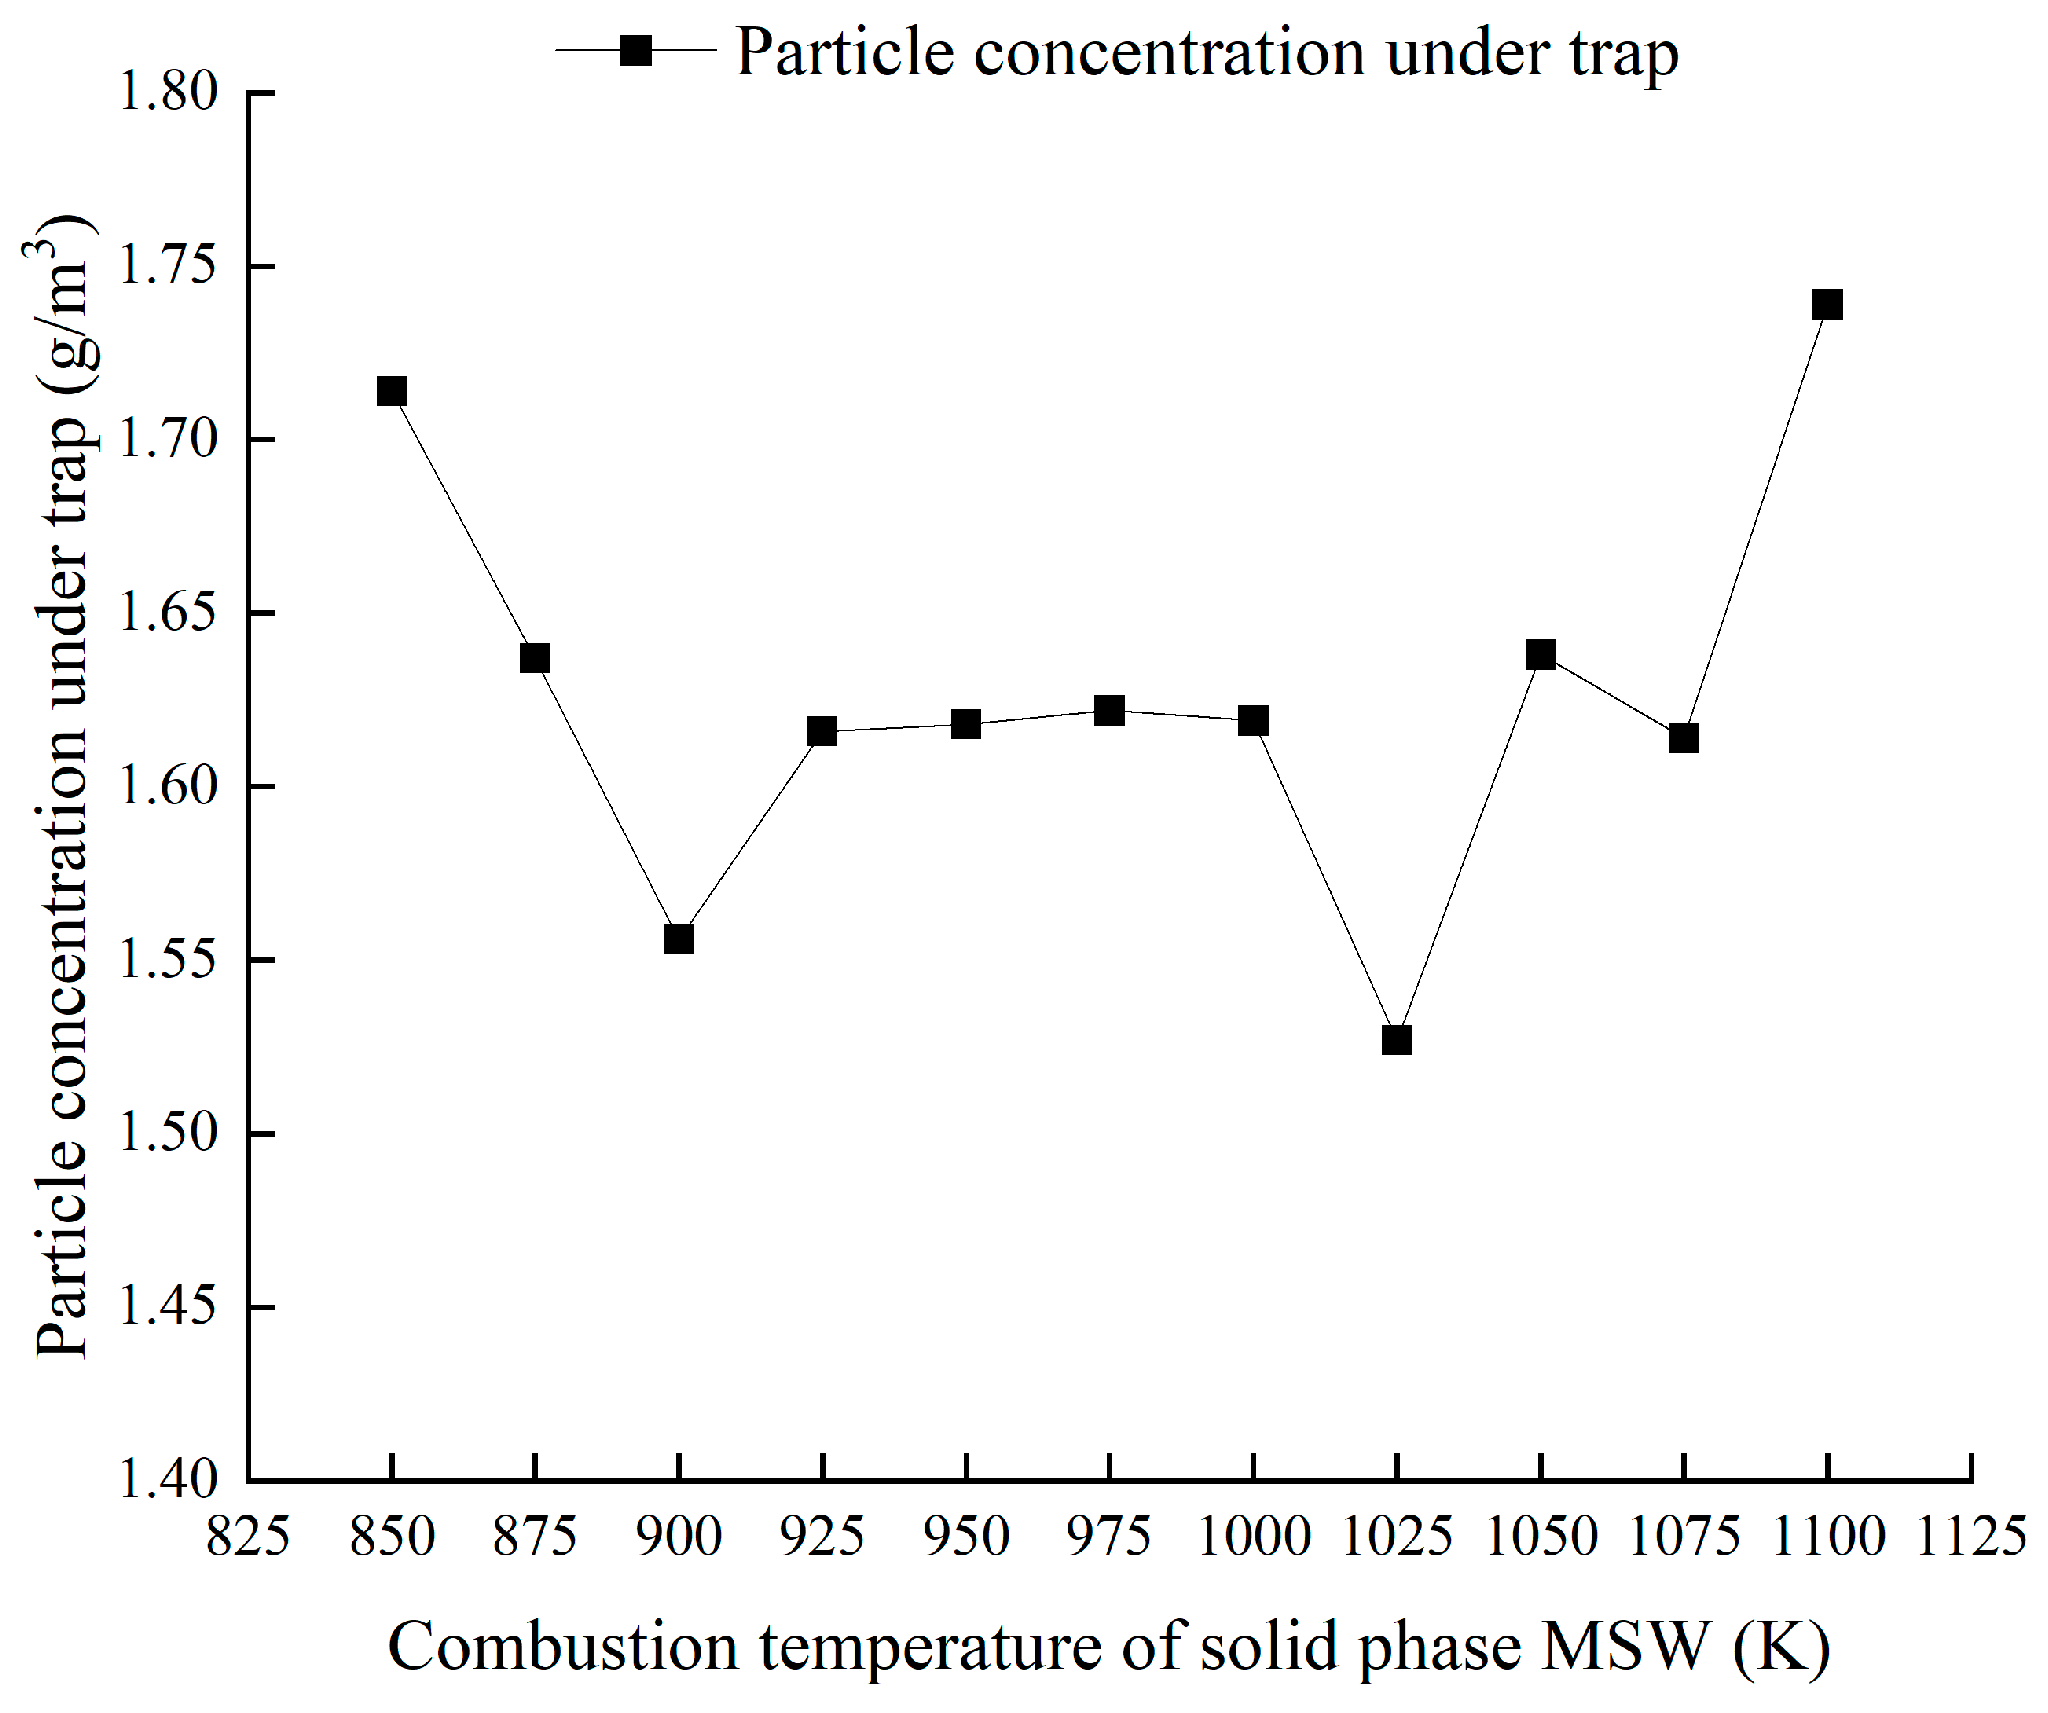
Figure 9 presents the variation in PM concentration at different combustion temperatures of solid-phase MSWs when the wall’s PM collision is the trapping form.
When the wall’s PM collision mode is trap, the combustion temperature of the solid-phase MSW is between 850 and 900 K (Figure 9). PM concentration decreases with the increased temperature. MSW combustion at this stage is not sufficient, and PM concentration gradually decreases. When the temperature is between 900 and 1025 K, PM concentration increases first and then decreases. When the temperature is between 925 and 1000 K, PM concentration is almost maintained at 1.61 g/m3. When the temperature is between 1025 and 1100 K, PM concentration increases with the increased temperature. The MSW is fully burned at this time, which results in a large amount of PM. PM concentration at the outlet of the economizer decreases and then increases with the increased internal temperature of the incinerator. Therefore, when the on-site wall has a strong adsorption capacity for PM, keeping the combustion temperature of the solid-phase MSW between 925 and 1000 K can reduce PM concentration. Moreover, MSW combustion can meet the process requirements.
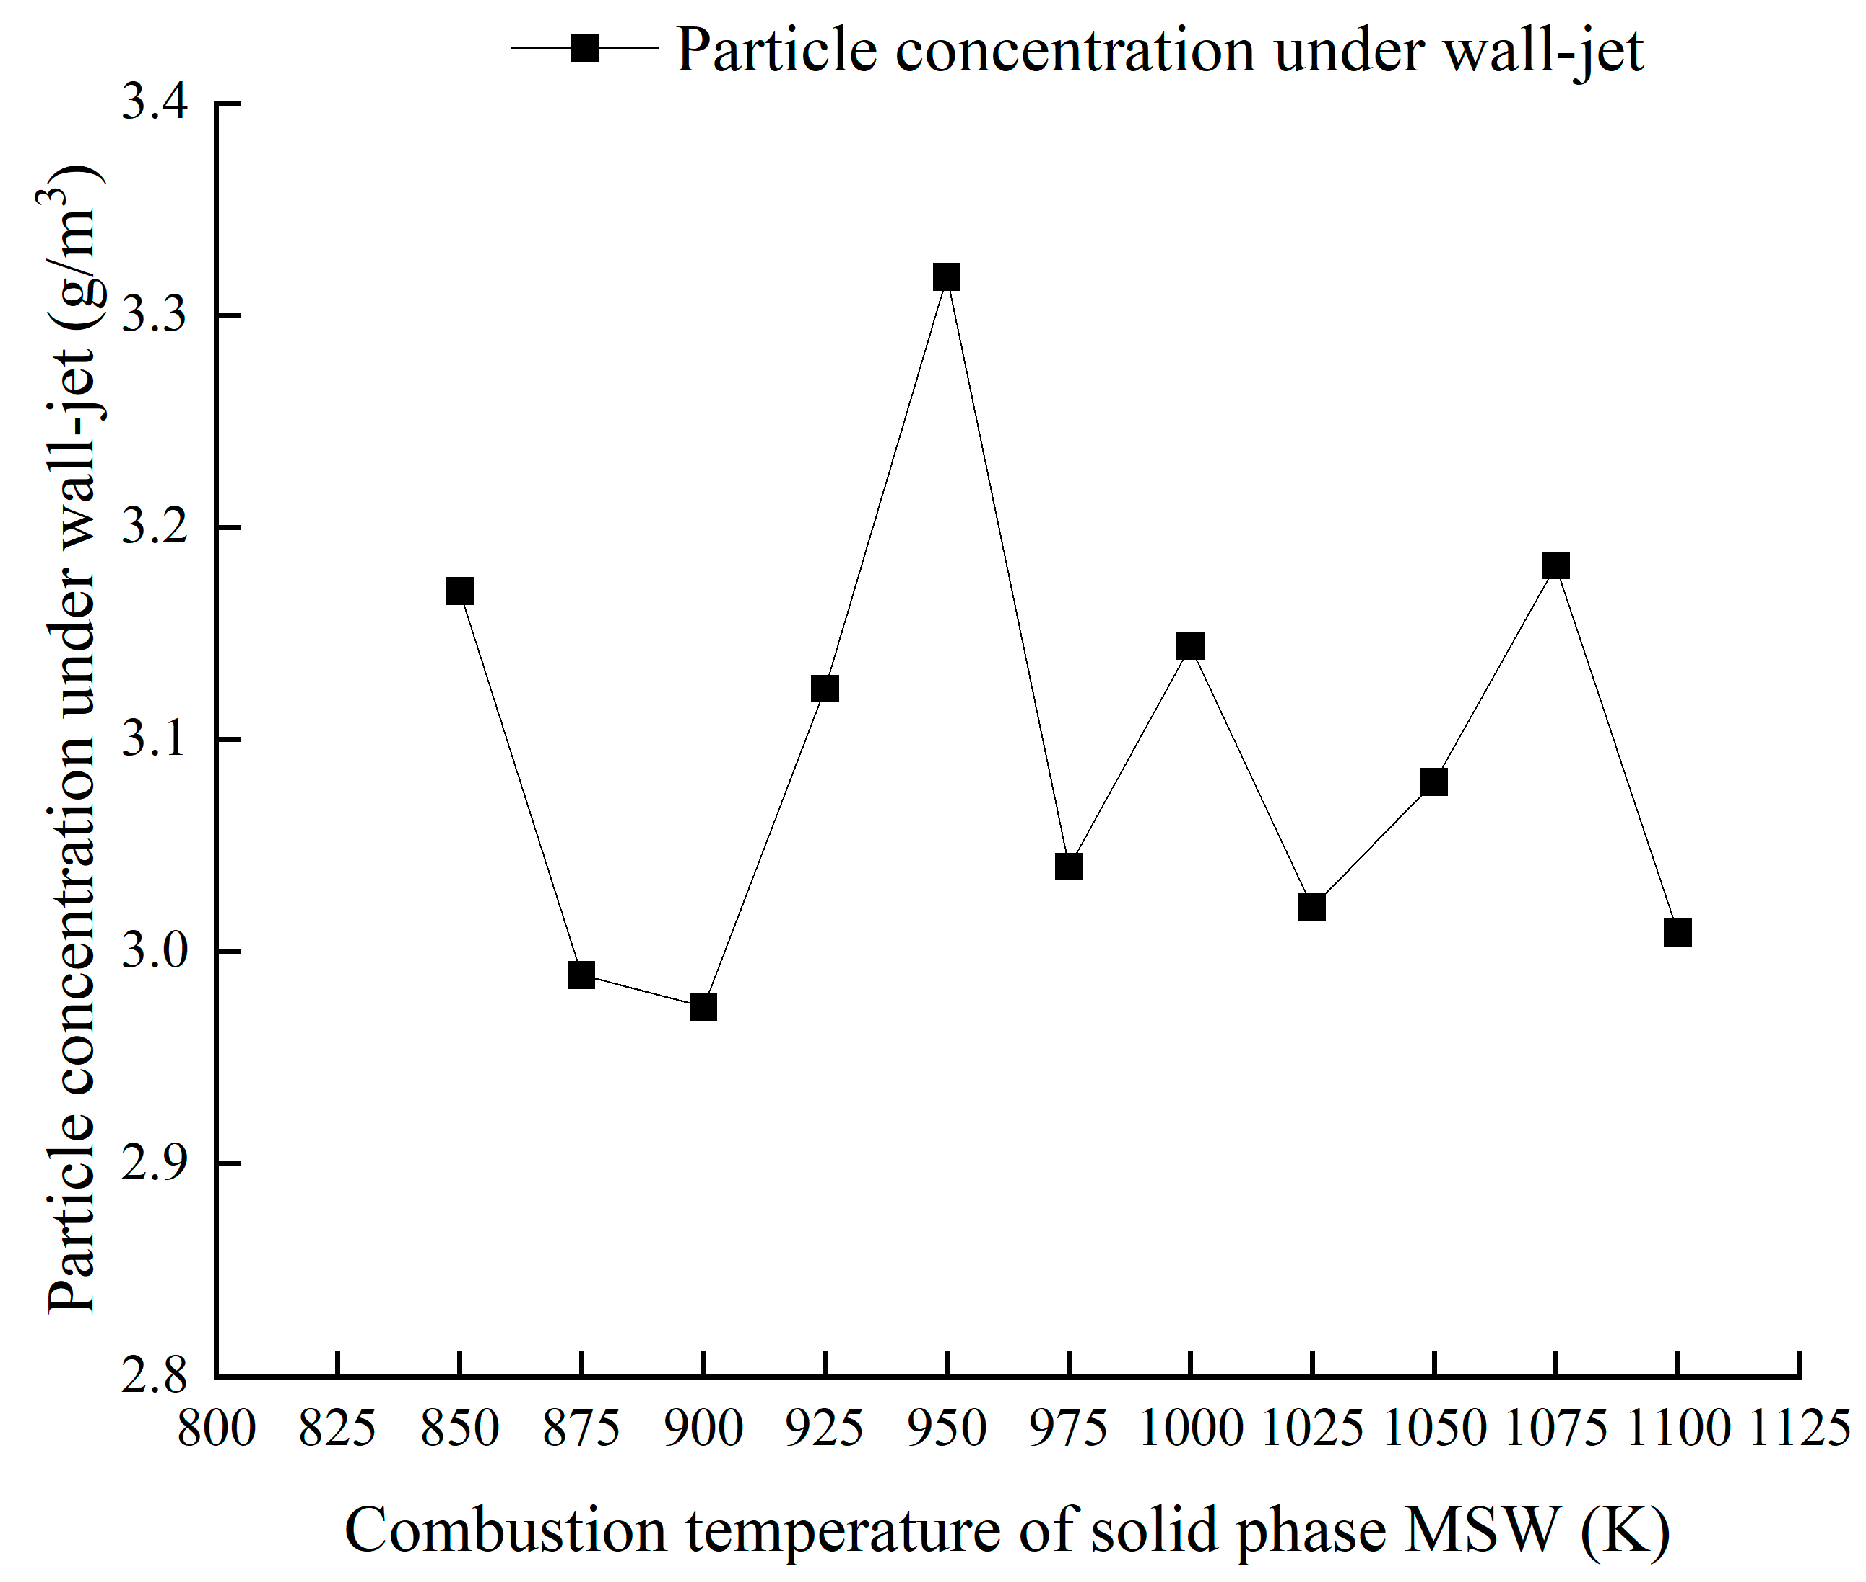
Figure 10 presents the variation in PM concentration for different combustion temperatures of solid-phase MSWs when the wall’s PM collision is a wall jet.
When the temperature is increased, the PM concentration decreases significantly at 850–900 K; PM concentration increases with the increased temperature at 900–950 K; PM concentration decreases gradually at 950–975 K; PM concentration increases first and then decreases at 975–1100 K. In general, PM concentration shows a sawtooth variation with the increased temperature, decreasing first and then increasing. Therefore, when the field-wall PM collision is in a wall-jet mode, the constant temperature can be maintained as much as possible to facilitate the stable detection of PM concentration.
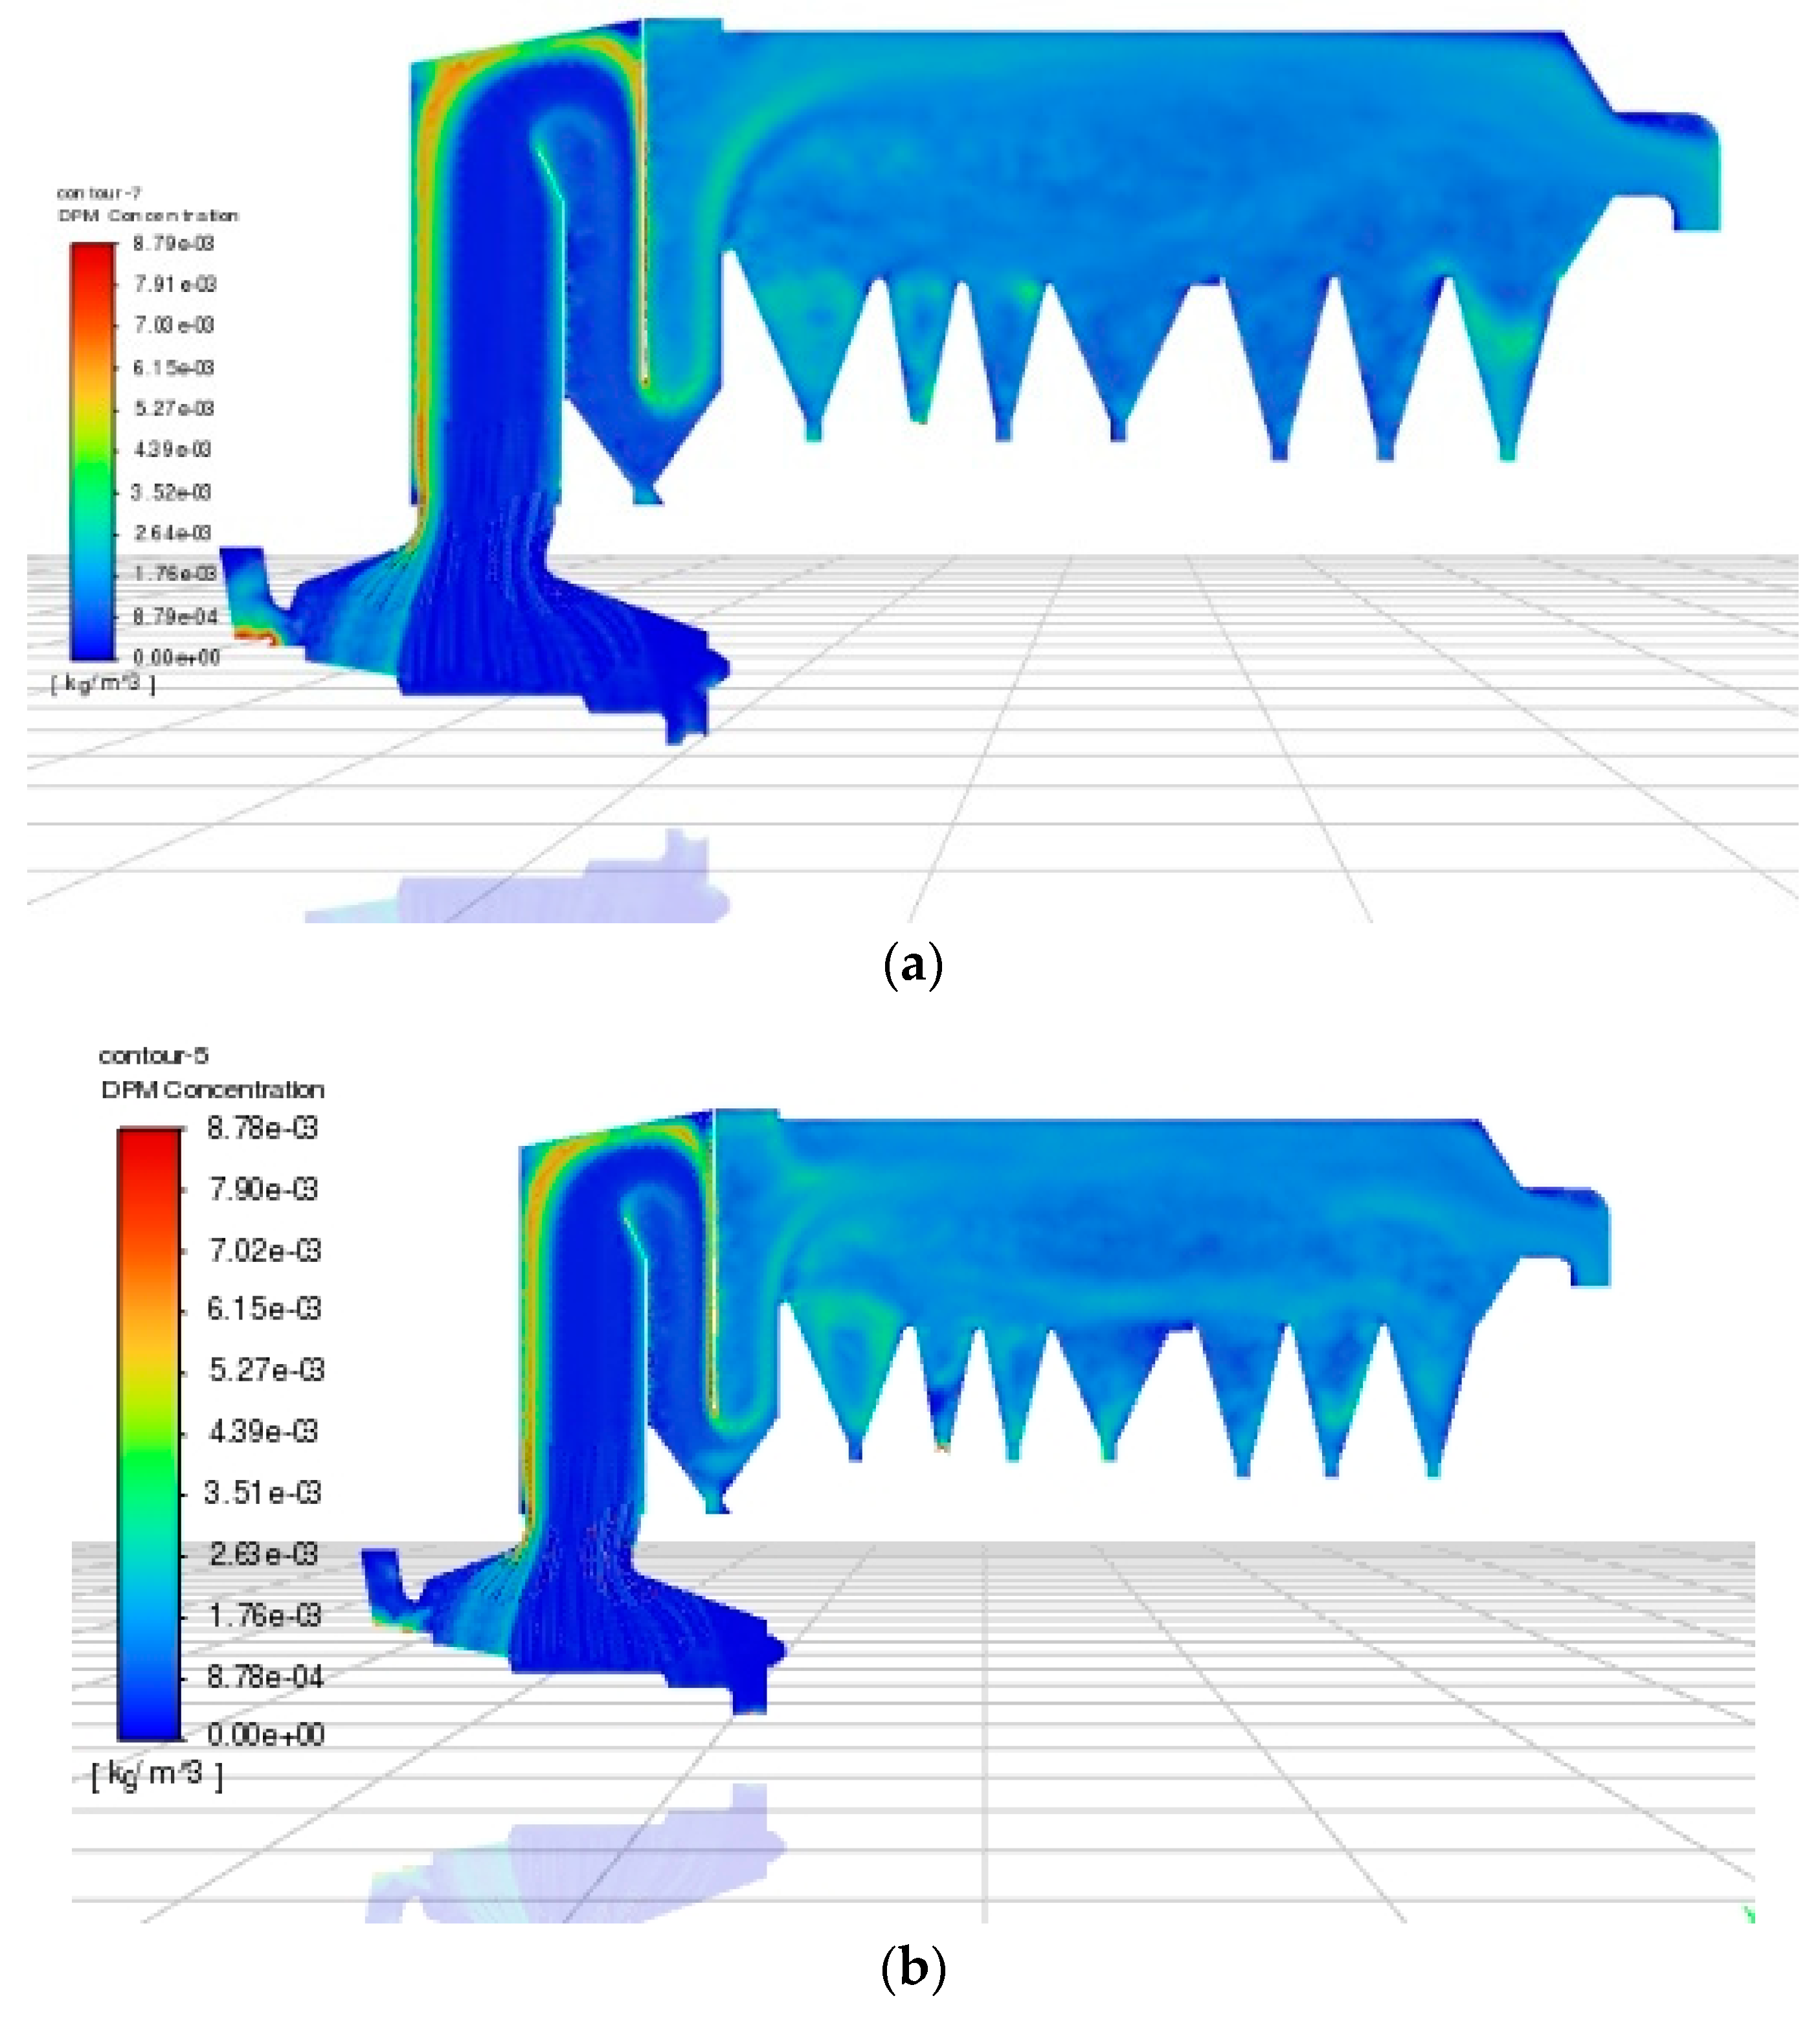
Figure 11 shows the PM concentration distribution of the incinerator and the waste heat boiler when the wall’s PM collision mode is trap, and the combustion temperatures of the solid-phase MSW are 850 and 965 K.
Variability in PM concentration distributes at different temperatures (Figure 11). The distribution in the furnace is nearly identical to that in the first flue. There is a difference between the funnel at the funnel and the waste heat boiler, with a more uniform PM concentration distribution at 965 K and a lower concentration at the outlet.

4.2.2. Analysis of the Effect of Different Wall’s PM Collision Methods on the PM Concentration Analysis at the Outlet

The numerical simulations are conducted under the same temperature and utilize the wall’s PM collision that incorporates reflection, trapping, and wall-jet modes (Figure 12).
The effect of wall PM collision on PM concentration follows a descending order of reflection, wall-jet, and trapping modes at the same combustion temperature of the solid-phase MSW. The collision form is close to the PM concentration under reflection and trapping modes at 875–950 K. When the temperature inside the incinerator is 975–1100 K, the collision form is similar to PM concentration under the wall-jet and reflection modes.
PM concentration first decreases and then increases with temperature under different wall’s PM collision modes, which verifies the accuracy of the experimental results. With the above analysis, it is possible to reduce PM concentration by changing the wall material according to the temperature in the incinerator. Based on the on-site wall’s PM collision mode, the combustion temperature of the solid-phase MSW can be adjusted to reduce PM concentration.

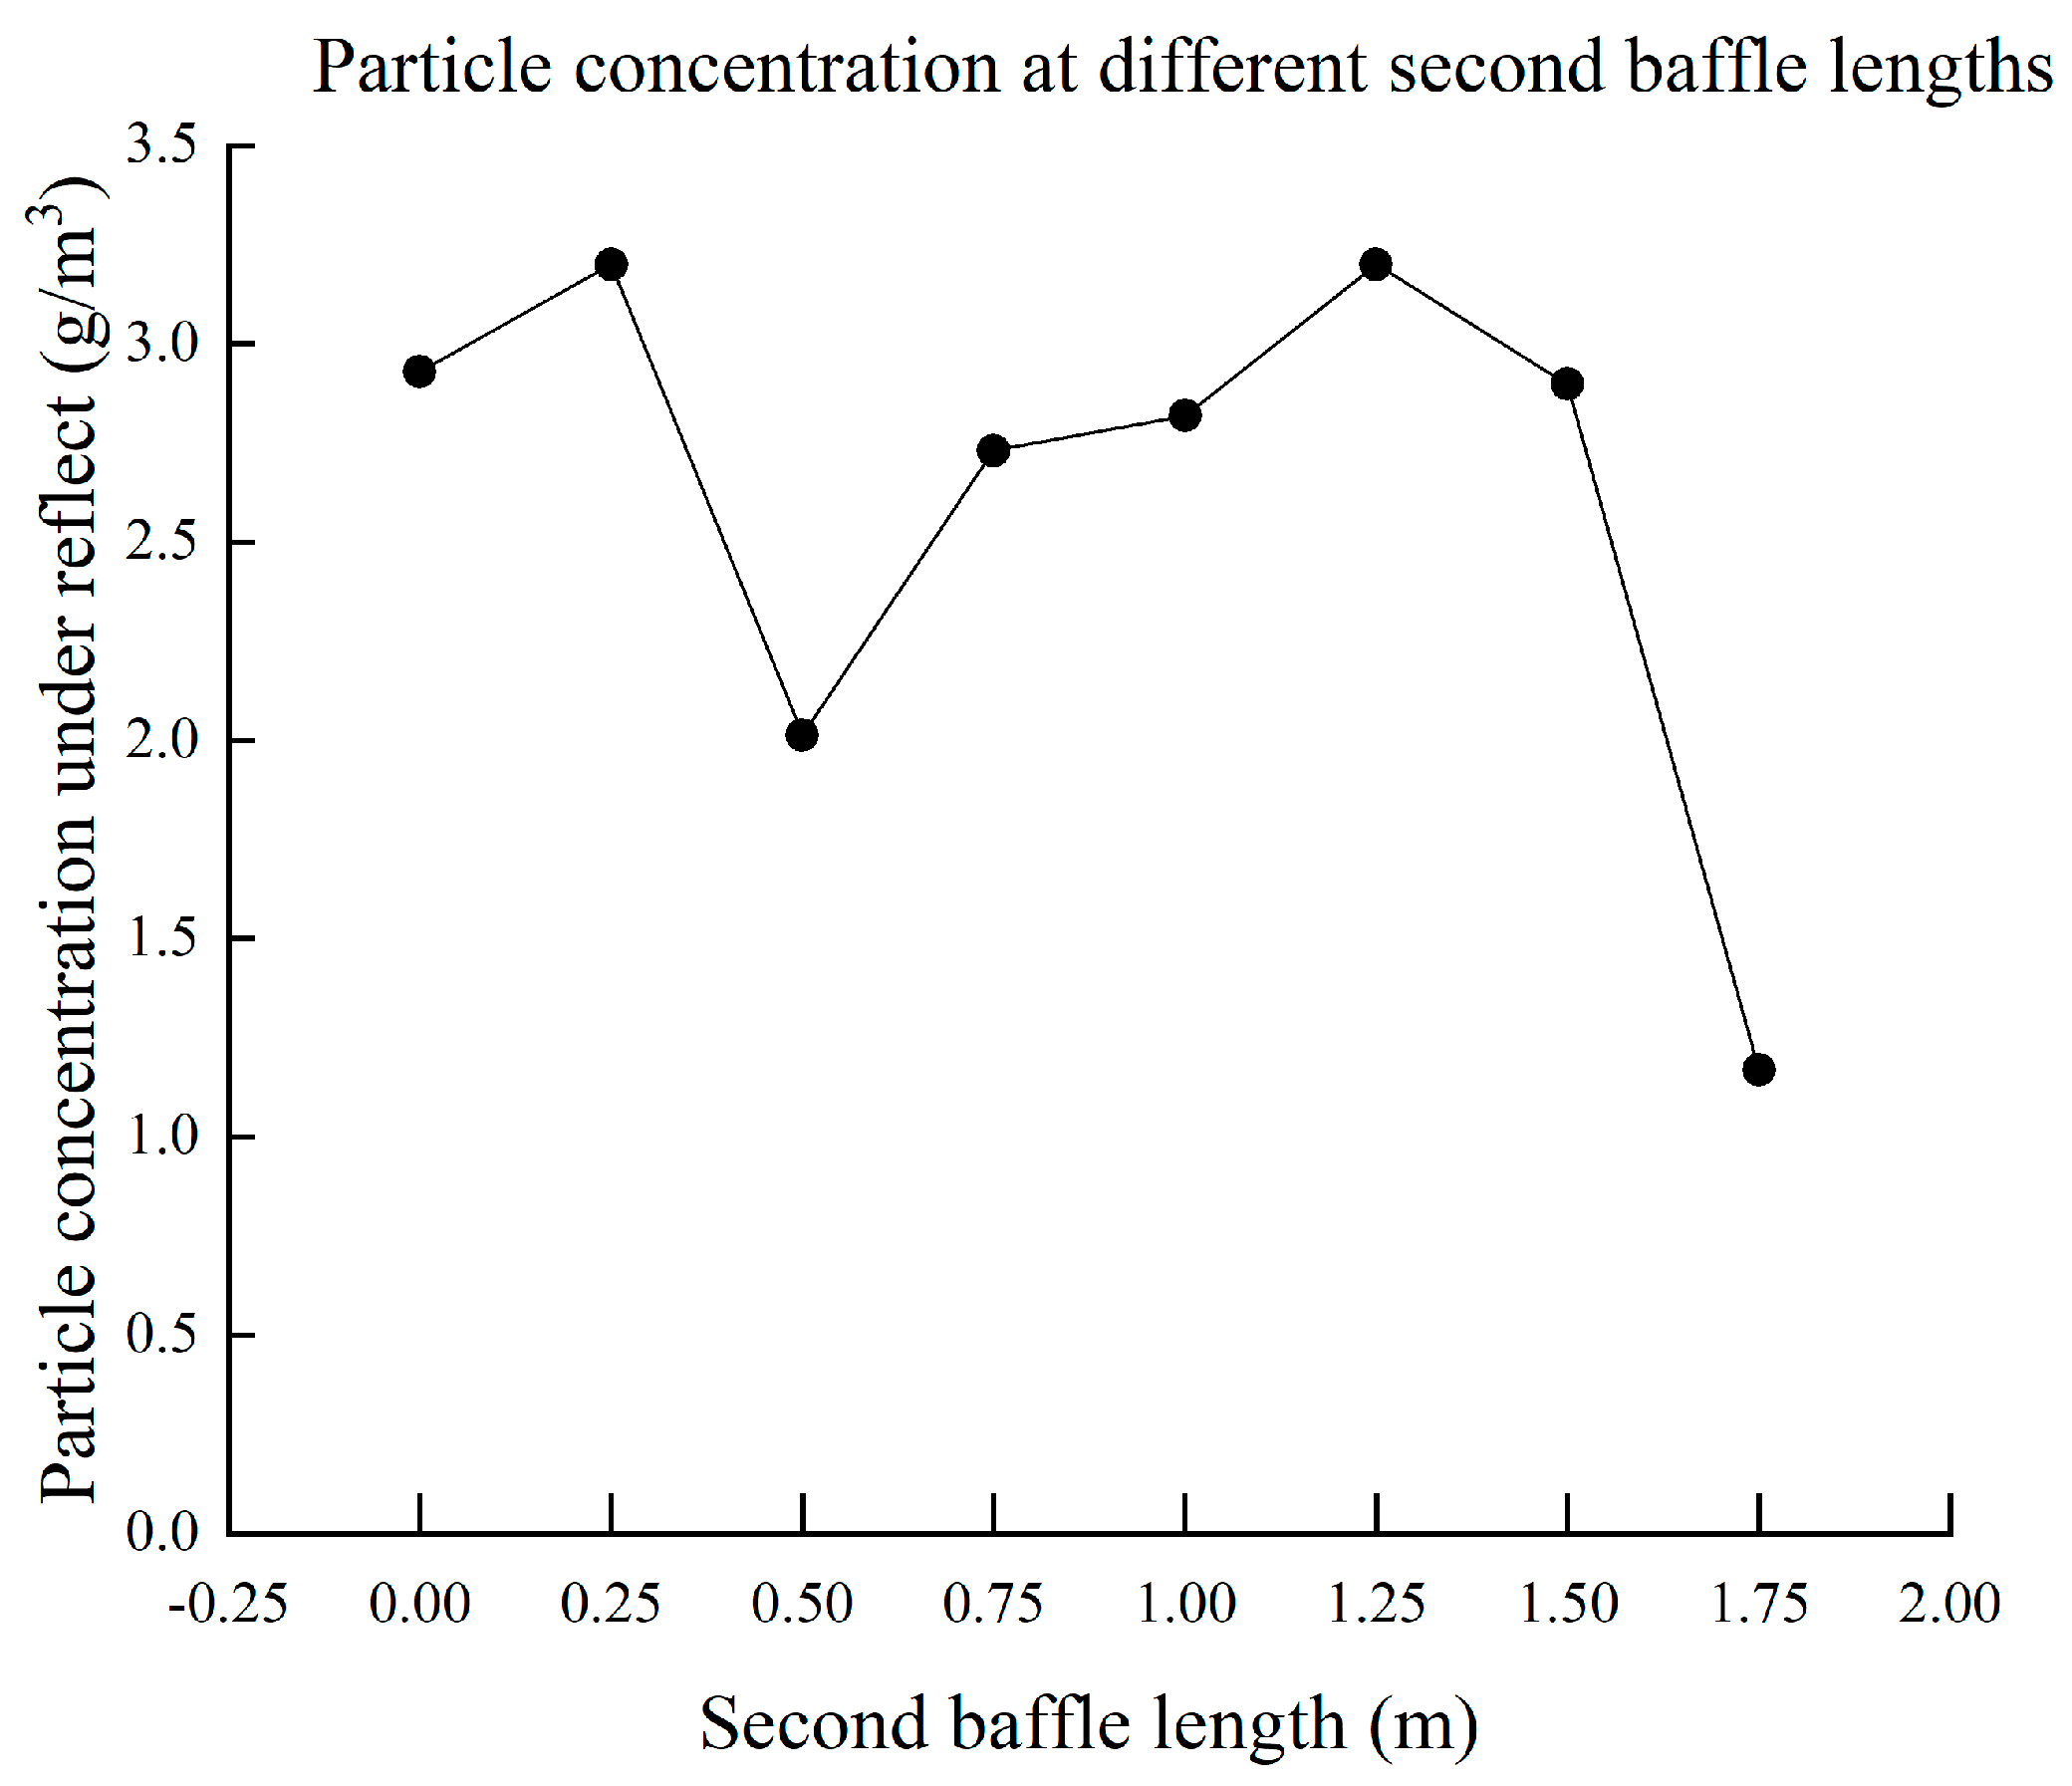
4.2.3. Effect of the Second Baffle Length on the Concentration of Exported PM

Since the second baffle between the second and third flue can play a role in trapping PM, increasing the second-baffle length can significantly reduce PM concentration (Figure 13). When the PM size is in the Rosin–Rammler distribution and the baffle length is increased from 11.2 to 12.45 m, PM concentration first decreases and then increases. It reaches the minimum value when the baffle length is 11.7 m. The particles are affected by turbulence when passing through the second baffle with the flue gas. The speed will change significantly, and the high speed will make the particles easier to pass through the baffle. When the length of the second baffle is between 11.7 m and 12.45 m, the speed at the end of the second baffle is not large. At the same time, the blocking effect of the baffle is limited by the length, so it does not play a significant role in reducing the concentration of particulate matter. When the baffle length is 12.45–12.95 m, the length of the second baffle is long enough to play a significant shielding effect. The potential energy of particulate matter decreases, the velocity decreases, and the concentration of particulate matter decreases significantly under the combined action. The simulation results show that lengthening the second baffle length can reduce PM concentration at the outlet of the coal economizer. The results also provide data support for the process design from PM-capturing equipment.

4.3. Results of Orthogonal Experiments and Discussion

An orthogonal experiment was conducted to analyze the effects of the combustion temperature of solid phase MSW (A), wall collision mode (B), and second baffle length (C) on PM concentration at the incinerator outlet for the optimal combination. Table 5 lists the number of factor levels for the above three factors. Table 6 presents the orthogonal experimental protocol and results.
The results of the orthogonal experiments are analyzed via the extreme difference analysis (Table 7).
Factor A has the greatest influence on PM concentration at the outlet. PM collides with the wall surface due to the turbulence of the high-temperature flue gas in the furnace during flowing. The wall material determines how PM on the wall collides, which directly determines whether the PMs continue to flow. It significantly affects PM concentration in turn at the outlet of the incinerator.
The effects of factors C and B on PM concentration at the outlet occupy the second and third positions, respectively. The effect of factor C is much greater than that of factor B. The second baffle, as a particle capture device, blocks the flowing particles at the second to third flue to collect the particles into the ash hopper. That is, particle concentration at the outlet is reduced under physical action.
Factor B has the least effect on PM concentration at the outlet. The combustion temperature of solid-phase MSW affects the initial concentration of PM produced by MSW combustion. However, PM flows through the flue and the waste heat boiler. The wall collision mode and the length of the second baffle have a significant impact on it, while temperature has the least influence.
In practice, a reasonable process design is required, and the wall material used can make the PM collision in a wall-jet mode. The second baffle length should be as long as possible without affecting flue gas flow. The combustion temperature of the solid-phase MSW is raised as much as possible to further reduce PM concentration at the outlet. From the above, the optimal combination in this orthogonal experiment is A 2 B 6 C 6 with the corresponding value (wall-jet, 1000, 12.95) and the PM concentration of 1.214 g / m 3 .

5. Conclusions

PM concentration at the outlet of the incinerator was reduced from the perspective of process and control optimizations. In this paper, the flow process of particles in the incinerator is simulated, and the gas phase combustion process is not involved. Based on real data from an MSWI plant in Beijing, the validity of the constructed numerical model was verified.
The main contributions were as follows: (1) Combined with the actual process flow and PM formation mechanism of an MSWI plant in Beijing, three key factors affecting PM concentration at the outlet of the incinerator were determined to be the combustion temperature of the solid-phase MSW, the collision mode of wall’s PM, and the second baffle length. (2) Based on the actual relevant data and parameters provided by the MSWI plant, the validity of the 3D numerical model of the MSWI process was verified. It provided a basis for subsequent analysis of PM concentration. (3) The influence of single-factor change and orthogonal experiments on PM concentration at the incinerator outlet was analyzed.
The conclusions included the following items: (1) PM concentration decreases first and then increases with the increased temperature under different wall’s PM collision modes. When the second baffle length is 12.45–12.95 m, PM concentration was significantly reduced. Lu et al. [34] also verified that temperature has a significant effect on the adhesion ability of particulate matter. (2) Based on the extreme difference analysis, the effect of the combined effect of three factors on the PM concentration at the incinerator outlet was determined. The influence of the wall’s PM collision mode was the greatest, followed by the second baffle length and the combustion temperature of the solid-phase MSW. N. Almohammed et al. [35] also studied that the particle-wall adhesion model (approximate to the wall particle collision mode) has a significant effect on particle deposition, which confirms the correctness of the conclusion. The optimal combination of parameters obtained by combining the above three factors was taken as (wall-jet, 1000, 12.95).

Author Contributions

Y.L.: conceptualization, methodology, data curation, writing—original draft, writing, and visualization; J.T.: conceptualization, methodology, formal analysis, writing—review and editing, visualization, and supervision; H.X.: conceptualization, investigation, data curation, writing—review and editing, and visualization; L.A.: methodology, writing—review and editing, and supervision. B.G.: conceptualization, investigation, and data curation; M.L.A.: conceptualization, investigation. All authors have read and agreed to the published version of the manuscript.

Funding

This research received no external funding.

Institutional Review Board Statement

Not applicable.

Informed Consent Statement

Not applicable.

Data Availability Statement

The data presented in this study are available on request from the corresponding author.

Conflicts of Interest

The authors declare that they have no known competing financial interest or personal relationships that could have appeared to influence the work reported in this paper.

Abbreviations

OrderSymbolsMeaning
1 ρ g Gas density
2 U g Velocity in the X -direction
3 V g Velocity in the Y -direction
4 S sg Rate of conversion of the MSW to the gas
5 p g Gas pressure
6 F ( U g ) Resistance of the bed to gas flow
7 F ( V g ) Resistance of the bed to gas flow
8 H g Gas enthalpy
9 λ g Thermal diffusion coefficient
10 Q h Heat gain in the gas phase due to combustion
11 U i The i th component of the velocity
12 U j The j th component of the velocity
13 x i Cartesian coordinates
14 ρ Fluid density
15 μ Viscosity
16 σ k Model coefficient
17 β Model coefficient
18 σ ω Model coefficient
19 γ Model coefficient
20 β Model coefficient
21 σ ω 2 Model coefficient
22 F 1 Hybrid function
23 k Turbulent kinetic energy
24 ω Specific turbulence dissipation rate
25 u a v g Average speed
26 I Turbulence intensity
27 C μ Empirical constants of the K-Omega model
28 l Characteristic length of the obstacle
29 τ i j Reynolds stress
30 δ i j Kronecker function
31 ν T Power vortex viscosity
32 μ T Vortex viscosity
33 U Fluid phase velocity
34 U p PM velocity
35 R e Reynolds number
36 p Particulate matter
37 F p Saffman lift and virtual mass force
38 ρ p Particulate-matter density
39 d p Particulate-matter size
40 μ Viscosity coefficient
41 C d Correction factor
42 θ Parameter
43 σ Parameter
44 m g Geometric mean
45 S g Standard deviation
46 x i Particulate-matter concentration value
47 n Number of concentration values
48 q i Percentile
49 z i Number of deviations of percentile from the median
50 e n Normal reflect coefficient
51 e τ Tangential reflect factor
52 F i Inertia force
53 F pre Pressure gradient force
54 F vm False quality force
55 V P Solid phase speed
56 F Mag Magnus lift
57 ω p Angular velocity of the particulate-matter rotation
58 C D Traction coefficient
59 α 1 Constant
60 α 2 Constant
61 α 3 Constant
62 m p Particulate-matter quality
63 g Gravitational acceleration
64 y Particulate-matter concentration at the incinerator outlet
65 x T Combustion temperature of the solid-phase MSW
66 x W Wall’s particulate-matter collision mode
67 x G Length of the second baffle
68 y d esign Orthogonal-experiment particulate-matter concentration value
69 x T design Design value x T of the orthogonal experiment
70 x W design Design value x W of the orthogonal experiment
71 x G design Design value x G of the orthogonal experiment
72 R i Range
73 q Factor q in orthogonal experiment
74 v Level v of factor q
75 y ¯ q v The average value of experimental data r  { y n design } n = 1 r at level v of factor q
76 r Number of times this level occurs in the experiment

References

  1. Chhay, L.; Reyad, M.A.H.; Suy, R.; Islam, M.R.; Mian, M.M. Municipal solid waste generation in China: Influencing factor analysis and multi-model forecasting. J. Mater. Cycles Waste Manag. 2018, 20, 1761–1770. [Google Scholar] [CrossRef]
  2. Li, Y.; Zhang, J.L.; Liu, Z.J.; Chen, L.Z.; Wang, Y.Z. Harmless treatment of municipal solid waste incinerator fly ash through shaft furnace. Waste Manag. 2021, 124, 110–117. [Google Scholar] [CrossRef]
  3. Liu, Q.; Xu, Q.; Shen, X.; Chen, B.; Esfahani, S.S. The Mechanism of Household Waste Sorting Behaviour-A Study of Jiaxing, China. Int. J. Environ. Res. Public Health 2022, 19, 2447. [Google Scholar] [CrossRef] [PubMed]
  4. Khan, S.; Anjum, R.; Raza, S.T.; Bazai, N.A.; Ihtisham, M. Technologies for municipal solid waste management: Current status, challenges, and future perspectives. Chemosphere 2022, 288, 132403. [Google Scholar] [CrossRef] [PubMed]
  5. Yan, M.; Tian, X.; Antoni; Yu, C.; Zhou, Z.; Hantoko, D.; Kanchanatip, E.; Khan, M.S. Influence of multi-temperature primary air on the characteristics of MSW combustion in a moving grate incinerator. J. Environ. Chem. Eng. 2021, 9, 106690. [Google Scholar] [CrossRef]
  6. Xia, H.; Tang, J.; Yu, W.; Qiao, J. Online Measurement of Dioxin Emission in Solid Waste Incineration Using Fuzzy Broad Learning. IEEE Trans. Ind. Inform. 2023, 1–11. [Google Scholar] [CrossRef]
  7. Zhuang, J.; Tang, J.; Aljerf, L. Comprehensive review on mechanism analysis and numerical simulation of municipal solid waste incineration process based on mechanical grate. Fuel 2022, 320, 123826. [Google Scholar] [CrossRef]
  8. Zhuang, J.; Tang, J.; Xia, H.; Qiao, J.; Ihtisham, M. MSWI Process Simulation Based on Coupling Combustion of Solid Phase on Grate and Gas Phase in Furnace. Proc. CSEE 2022, 42, 8961–8972. [Google Scholar]
  9. Tang, J.; Zhuang, J.; Qiao, J. Numerical Simulation and Analysis for Incineration Process Inside the Grate Furnace for Municipal Solid Waste. Control Eng. China 2022, 29, 1921–1927. [Google Scholar]
  10. Luo, Z.; Chen, W.; Wang, Y.; Cheng, Q.; Yuan, X.; Li, Z.; Yang, J. Numerical Simulation of Combustion and Characteristics of Fly Ash and Slag in a “V-type” Waste Incinerator. Energies 2021, 14, 7518. [Google Scholar] [CrossRef]
  11. Hu, Z.; Jiang, E.; Ma, X. Numerical simulation on operating parameters of SNCR process in a municipal solid waste incinerator. Fuel 2019, 245, 160–173. [Google Scholar] [CrossRef]
  12. Gu, T.; Ma, W.; Berning, T.; Guo, Z.; Andersson, R.; Yin, C. Advanced simulation of a 750 t/d municipal solid waste grate boiler to better accommodate feedstock changes due to waste classification. Energy 2022, 254, 124338. [Google Scholar] [CrossRef]
  13. Yan, M.; Antoni; Wang, J.; Hantoko, D.; Kanchanatip, E. Numerical investigation of MSW combustion influenced by air preheating in a full-scale moving grate incinerator. Fuel 2021, 285, 119193. [Google Scholar] [CrossRef]
  14. Yang, X.; Liao, Y.; Ma, X.; Zhou, J. Effects of air supply optimization on NOx reduction in a structurally modified municipal solid waste incinerator. Appl. Therm. Eng. 2022, 201, 117706. [Google Scholar] [CrossRef]
  15. Xia, Z.; Long, J.; Yan, S.; Bai, L.; Du, H.; Chen, C. Two-fluid simulation of moving grate waste incinerator: Comparison of 2D and 3D bed models. Energy 2021, 216, 119257. [Google Scholar] [CrossRef]
  16. Hu, Z.; Jiang, E.; Ma, X. Numerical simulation on NOX emissions in a municipal solid waste incinerator. J. Clean. Prod. 2019, 233, 650–664. [Google Scholar] [CrossRef]
  17. Ogawa, N.; Amano, T.; Nagai, Y.; Hagiwara, K.; Honda, T.; Koike, Y. Water repellents for the leaching control of heavy metals in municipal solid waste incineration fly ash. Waste Manag. 2021, 124, 154–159. [Google Scholar] [CrossRef] [PubMed]
  18. Shunda, L.; Jiang, X.; Zhao, Y.; Yan, J. Disposal technology and new progress for dioxins and heavy metals in fly ash from municipal solid waste incineration: A critical review. Environ. Pollut. 2022, 311, 119878. [Google Scholar] [CrossRef] [PubMed]
  19. Yu, Z.; Wu, J.; Zhang, Y.; Zhang, J.; Feng, Y.; Li, P. Characteristics of Component Particle Size Distributions of Particulate Matter Emitted from a Waste Incineration Plant. Environ. Sci. 2019, 40, 2533–2539. [Google Scholar]
  20. Xia, H.; Tang, J.; Aljerf, L.; Wang, T.; Qiao, J.; Xu, Q.; Wang, Q.; Ukaogo, P. Investigation on dioxins emission characteristic during complete maintenance operating period of municipal solid waste incineration. Environ. Pollut. 2023, 318, 120949. [Google Scholar] [CrossRef]
  21. Xia, H.; Tang, J.; Aljerf, L.; Wang, T.; Gao, B.; Xu, Q.; Wang, Q.; Ukaogo, P. Assessment of PCDD/Fs formation and emission characteristics at a municipal solid waste incinerator for one year. Sci. Total Environ. 2023, 883, 163705. [Google Scholar] [CrossRef] [PubMed]
  22. Nguyen, T.H.; Pham, Q.V.; Nguyen, T.P.M.; Vu, V.T.; Do, T.H.; Hoang, M.T.; Thu Thuy Thi, N.; Minh, T.B. Distribution characteristics and ecological risks of heavy metals in bottom ash, fly ash, and particulate matter released from municipal solid waste incinerators in northern Vietnam. Environ. Geochem. Health 2022, 45, 2579–2590. [Google Scholar] [CrossRef] [PubMed]
  23. Wang, W.; Yu, J.; Cui, Y.; He, J.; Xue, P.; Cao, W.; Ying, H.; Gao, W.; Yan, Y.; Hu, B.; et al. Characteristics of fine particulate matter and its sources in an industrialized coastal city, Ningbo, Yangtze River Delta, China. Atmos. Res. 2018, 203, 105–117. [Google Scholar] [CrossRef]
  24. Kitamura, H.; Dahlan, A.V.; Tian, Y.; Shimaoka, T.; Yamamoto, T.; Takahashi, F. Intra- and inter-particle heterogeneity of municipal solid waste incineration fly ash particles. J. Mater. Cycles Waste Manag. 2019, 21, 925–941. [Google Scholar] [CrossRef]
  25. Lu, H.; Zhang, X.; Liu, X. Pollution and Risk Assessment of Heavy Metals in Fine Slag Particles from Waste Incineration. Environ. Impact Assess. 2022, 44, 60–65+70. [Google Scholar]
  26. Bernasconi, D.; Caviglia, C.; Destefanis, E.; Agostino, A.; Boero, R.; Marinoni, N.; Bonadiman, C.; Pavese, A. Influence of speciation distribution and particle size on heavy metal leaching from MSWI fly ash. Waste Manag. 2022, 138, 318–327. [Google Scholar] [CrossRef]
  27. Zhang, R.; Wei, X.; Hao, Q.; Si, R. Bioleaching of Heavy Metals from Municipal Solid Waste Incineration Fly Ash: Availability of Recoverable Sulfur Prills and Form Transformation of Heavy Metals. Metals 2020, 10, 815. [Google Scholar] [CrossRef]
  28. Zhao, H.; Tian, Y.; Wang, R.; Wang, R.; Zeng, X.; Yang, F.; Wang, Z.; Chen, M.; Shu, J. Seasonal Variation of the Mobility and Toxicity of Metals in Beijing’s Municipal Solid Waste Incineration Fly Ash. Sustainability 2021, 13, 6532. [Google Scholar] [CrossRef]
  29. Wei, X.; Shao, N.; Yan, F.; Wang, P.; Xie, F.; Zhang, Z. Safe disposal and recyclability of MSWI fly ash via mold-pressing and alkali-activation technology: Promotion of metakaolin and mechanism. J. Environ. Chem. Eng. 2022, 10, 107166. [Google Scholar] [CrossRef]
  30. Paithankar, J.G.; Saini, S.; Dwivedi, S.; Sharma, A.; Chowdhuri, D.K. Heavy metal associated health hazards: An interplay of oxidative stress and signal transduction. Chemosphere 2021, 262, 128350. [Google Scholar] [CrossRef]
  31. Xue, Y.; Liu, X. Detoxification, solidification and recycling of municipal solid waste incineration fly ash: A review. Chem. Eng. J. 2021, 420, 130349. [Google Scholar] [CrossRef]
  32. Yang, W.; Pudasainee, D.; Gupta, R.; Li, W.; Wang, B.; Sun, L. Particulate matter emission during municipal solid waste combustion: Submicron particulates formation mechanism. Fuel 2022, 310, 122271. [Google Scholar] [CrossRef]
  33. Dahlan, A.V.; Kitamura, H.; Tian, Y.; Sakanakura, H.; Shimaoka, T.; Yamamoto, T.; Takahashi, F. Heterogeneities of fly ash particles generated from a fluidized bed combustor of municipal solid waste incineration. J. Mater. Cycles Waste Manag. 2020, 22, 836–850. [Google Scholar] [CrossRef]
  34. Yan, L.; Sun, F.; Zheng, P. Research on adhesion mechanism of ash particles and ammonium bisulfate on the metal wall in coal-fired boilers. Fuel 2020, 277, 118021. [Google Scholar] [CrossRef]
  35. Heinl, E.; Bohnet, M. Calculation of particle–wall adhesion in horizontal gas–solids flow using CFD. Powder Technol. 2005, 159, 95–104. [Google Scholar] [CrossRef]
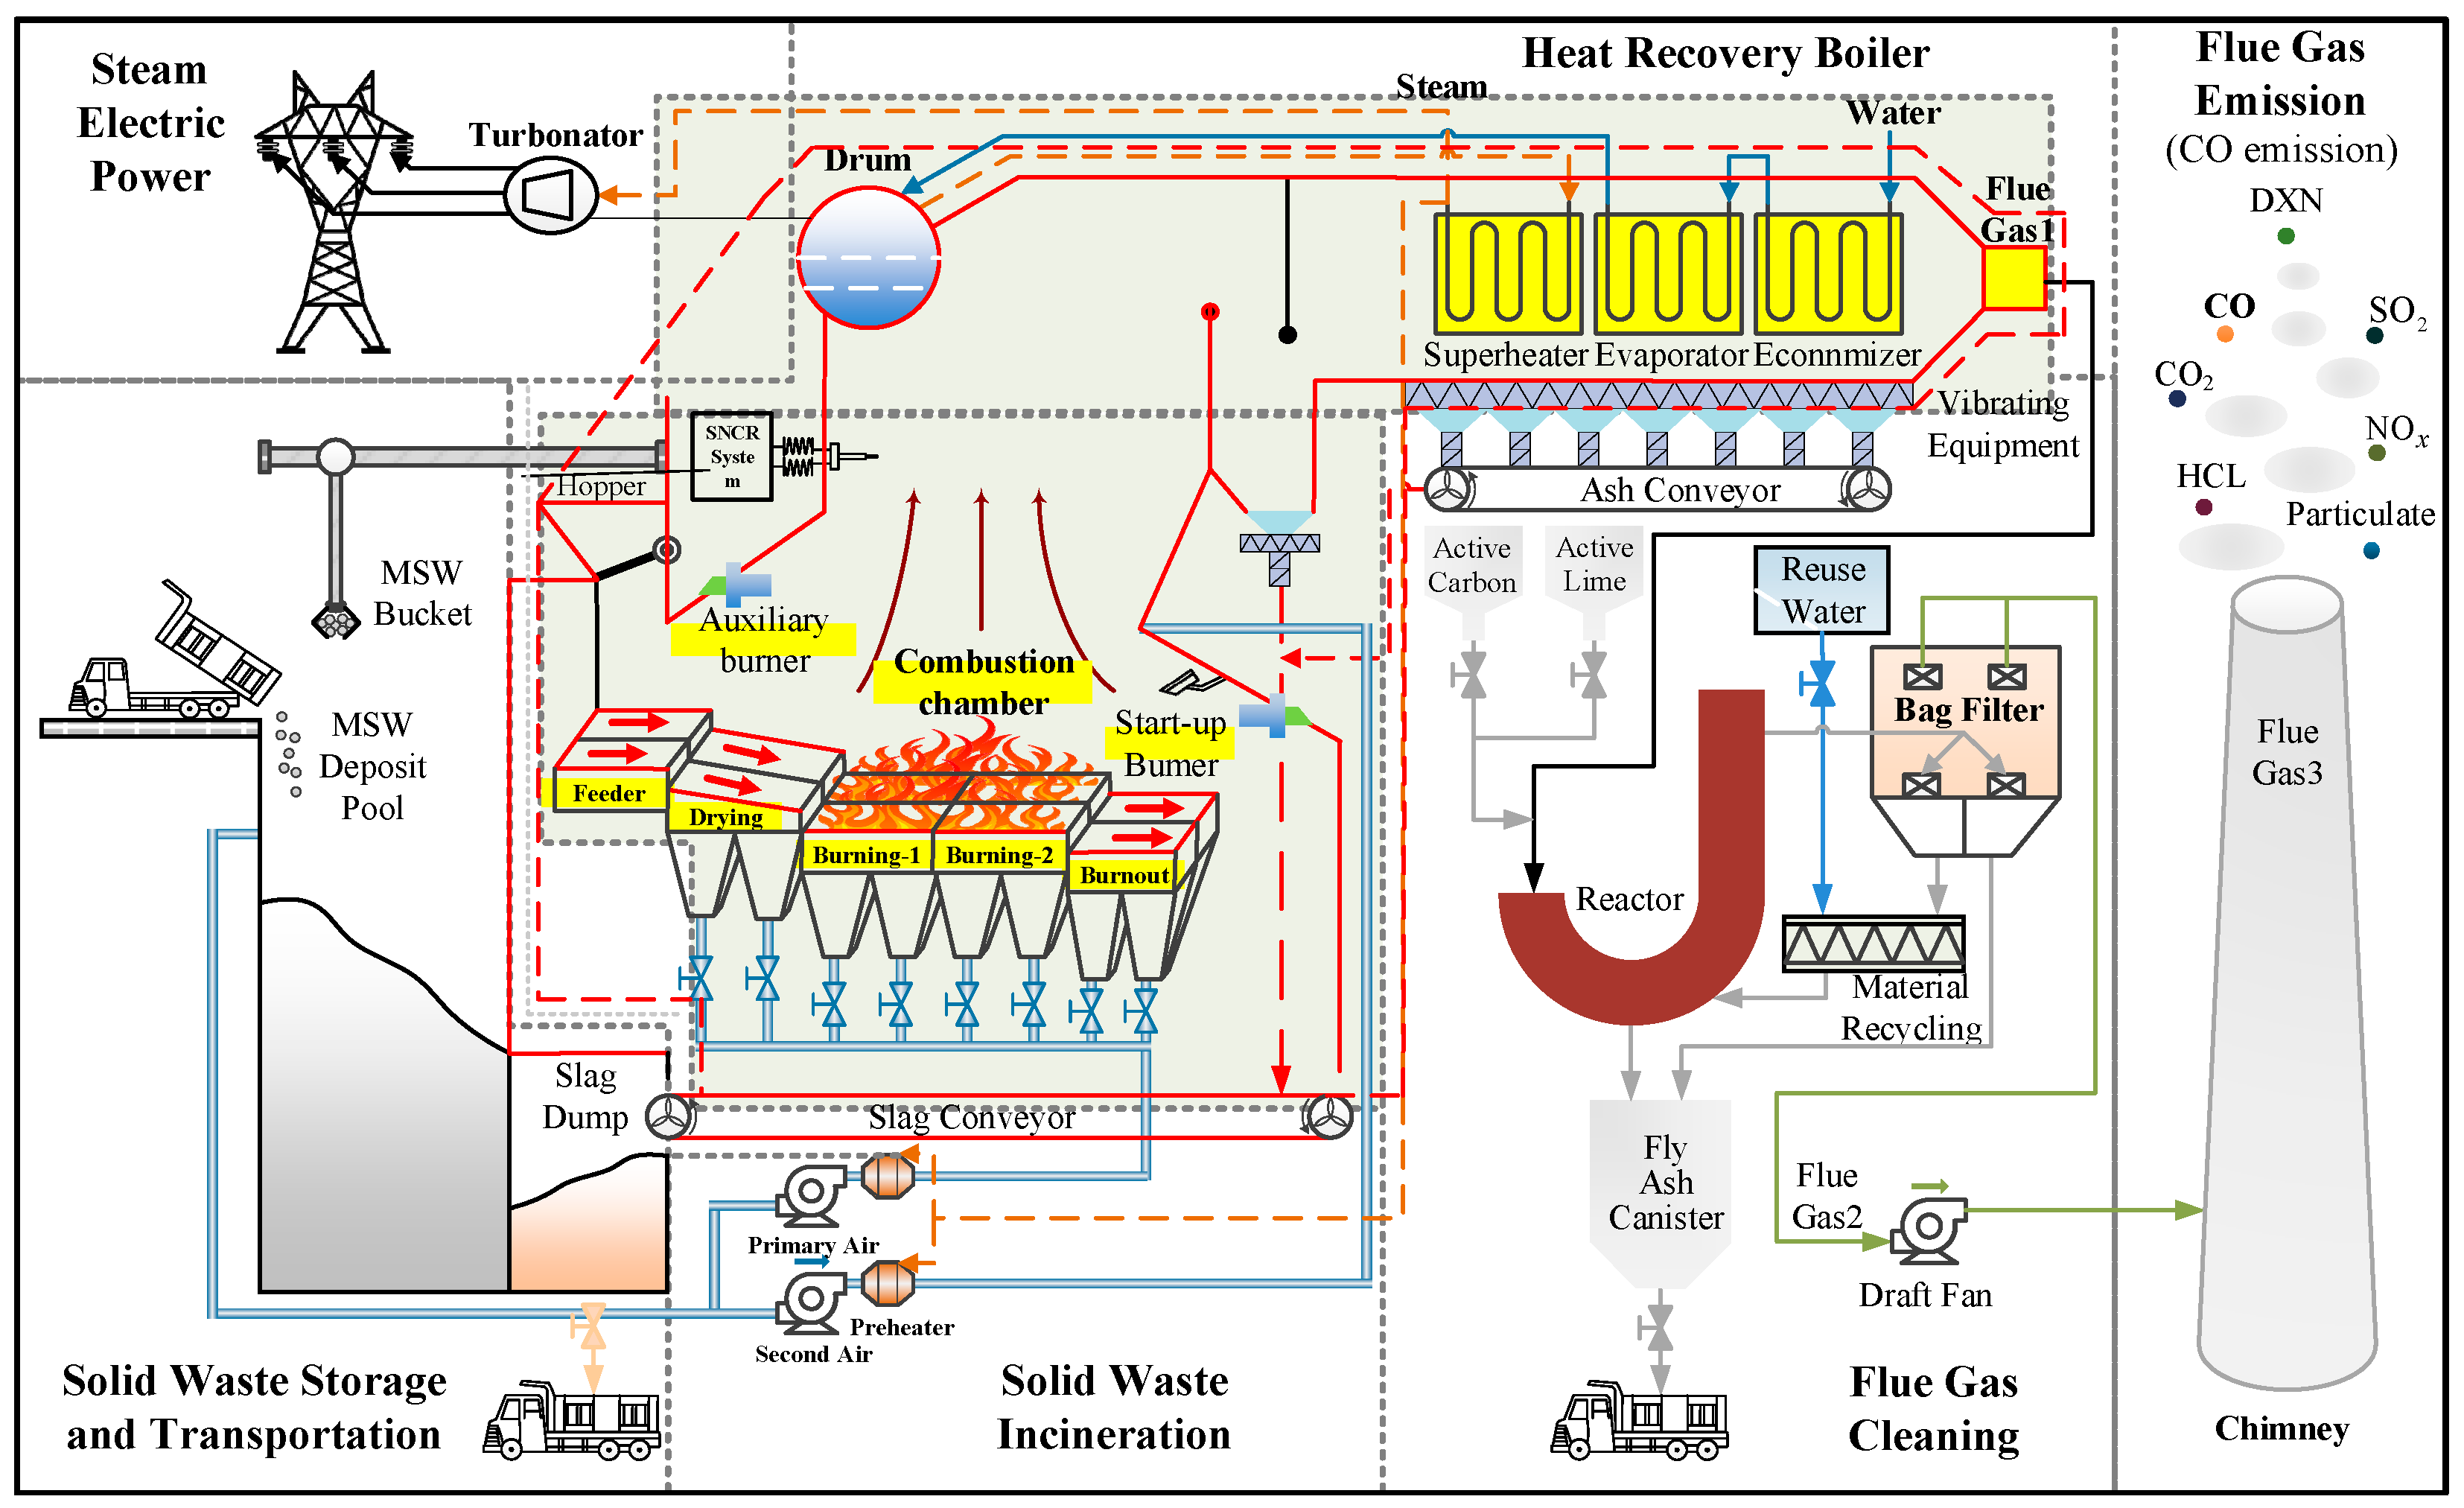
Figure 1. MSWI process flow.
Sustainability 15 12337 g001
Figure 2. Scan and size characteristics of incineration fly ash’s PM (×2000).
Sustainability 15 12337 g002
Figure 3. 3D numerical modeling and analysis method for PM concentration of the MSWI process.
Sustainability 15 12337 g003
Figure 4. Three-dimensional model of the incinerator and waste heat boiler.
Sustainability 15 12337 g004
Figure 5. Three-dimensional model mesh of the incinerator and waste heat boiler.
Sustainability 15 12337 g005
Figure 6. Flow field clouds of the incinerator and waste heat boiler. (a) Speed cloud map. (b) Static pressure cloud map.
Sustainability 15 12337 g006
Figure 7. Particulate-matter clouds from incinerators and waste heat boilers. (a) Particulate-matter velocity cloud. (b) Particulate-matter concentration cloud map.
Sustainability 15 12337 g007
Figure 8. Relationship between different combustion temperatures of solid-phase MSWs and PM concentration in the reflection mode.
Sustainability 15 12337 g008
Figure 9. Relationship between different combustion temperatures of solid-phase MSWs and particulate-matter concentration in the trapping mode.
Sustainability 15 12337 g009
Figure 10. Relationship between different combustion temperatures of solid-phase MSWs and changes in PM concentration in a wall-jet mode.
Sustainability 15 12337 g010
Figure 11. Particulate-matter concentration distribution at the combustion temperature of the solid-phase MSW of 850 and 965 K in reflection mode. (a) Particulate-matter concentration distribution at 850 K. (b) Particulate-matter concentration distribution at 965 K.
Sustainability 15 12337 g011
Figure 12. Relationship between the PM collision mode and PM concentration of 3 types of wall surfaces at the same combustion temperature of the solid-phase MSW.
Sustainability 15 12337 g012
Figure 13. Variation in PM concentration at different baffle lengths.
Sustainability 15 12337 g013
Table 1. Industrial and elemental analysis of MSW.
Industrial AnalysisElementary Analysis
Moisture (ar)Fixed
Carbon (d)
Volatile (d)Ash (d)C (d)H (d)N (d)Cl (d)S (d)O (d)
36.314.1660.0825.7647.666.170.330.880.1719.03
Notes: (ar) is the receiving base, that is, based on the received state sample; (d) is the dry base, that is, the sample in the hypothetical anhydrous state is used as the reference.
Table 2. Temperature and material settings of boundary.
Setting ParametersPrimary Air InletSecondary Air InletOutletWall
Temperature (K)10801080473Thermal insulation
MaterialAirAirAirAluminium
Table 3. Base settings of the DPM model.
Serial NumberSetting ParametersSet Value
1Injection sourceSurface
2Spraying surfacePrimary air inlet
3MaterialsAsh-solid
4Diameter DistributionRosin-Rammler
5Jet TypeFace normal direction injection
Table 4. Point properties and physical model settings.
Serial NumberSetting ParametersSet Value
1Temperature (K)300
2Speed size (m/s)0.7
3Total flow (kg/s)0.22
4Minimum diameter (μm)30
5Maximum diameter (μm)75
6Average diameter (μm)45
7Dispersion coefficient3.5
8Number of diameters10
9Drag force criterionGrace
10Rotating drag force criterionDennis-et-al
11Magnus’ Law of LiftoffOesterle-Bui-Dinh
12Rough wall modelOpen
13Discrete random trajectory modelOpen
14Number of attempts3
15Time scale constants0.15
Table 5. Mixed orthogonal experiment.
LevelAB (K)C (m)
1Reflect87511.70
2Wall-jet90011.95
3Trap92512.20
4-95012.45
5-97512.70
6-100012.95
Table 6. Orthogonal experimental protocol and results.
CasesABCPM Concentration
g/m3
11112.372
22122.744
33130.276
343620.252
351633.249
362642.960
Table 7. Analysis results of extreme differences.
IndicatorsABC
Range2.39670.65691.7442
Primary and secondary order A > C > B
Optimal level A 2 B 6 C 6
Disclaimer/Publisher’s Note: The statements, opinions and data contained in all publications are solely those of the individual author(s) and contributor(s) and not of MDPI and/or the editor(s). MDPI and/or the editor(s) disclaim responsibility for any injury to people or property resulting from any ideas, methods, instructions or products referred to in the content.