Article

Construction of an Ecological Security Pattern in Yangtze River Delta Based on Circuit Theory

College of Environmental and Geographic Sciences, Shanghai Normal University, Shanghai 200234, China
*
Author to whom correspondence should be addressed.
Sustainability 2023, 15(16), 12374; https://doi.org/10.3390/su151612374
Submission received: 17 June 2023 / Revised: 10 August 2023 / Accepted: 11 August 2023 / Published: 15 August 2023

Abstract

:
Ecological corridors can improve the connectivity between different habitat regions, ultimately halting the loss of biodiversity and habitat fragmentation. Building ecological corridors is a crucial step in protecting biodiversity. Ecological corridors had previously been built primarily on nature reserves, ignoring ecosystem services. In this study, a novel approach to building ecological corridors is put forth that takes into account a variety of ecosystem services, morphological spatial pattern analysis (MSPA), and connectivity methodologies to identify significant ecological sources. Ecological corridors and significant strategic nodes are created based on the minimum cumulative resistance model (MCR) and circuit theory in order to construct the Yangtze River Delta’s ecological security pattern. The research found that: (1) the identified ecological sources are 90,821.84 km2, and the total length of ecological corridors is 4704.03 km. (2) In total, 141 ecological restoration areas are identified, with a total area of 2302.77 km2; 151 ecological protection areas are identified, with a total area of 5303.43 km2. This study can provide valuable insights into the establishment of ecological patterns and the construction of priority restoration and protection areas in the ecological restoration of the Yangtze River Delta.

1. Introduction

Regional ecological security and restoration have come to the attention of scholars all over the world due to the rapid population growth and increasing rate of urbanization [1]. The state of stability and security within the local ecosystem is known as regional ecological security [2,3]. Ecological restoration is the process of restoring degraded, damaged, or destroyed ecosystems that have been or are being degraded under the guidance of ecological principles [4,5]. The Chinese government places a growing emphasis on ecological environment protection [6], particularly in light of the ongoing work for territorial ecological restoration planning. While addressing these new requirements and tasks in ecological environment protection and territorial ecological restoration planning, numerous problems have emerged. How can we effectively ensure regional ecological security? Where is the site for ecological restoration located? These are pressing issues that must be resolved [7].
In order to build and guarantee regional ecological security, some scholars put forward the concept of regional ecological security pattern (ESP) to serve the construction of regional ecological security [8]. The ecological security pattern is the potential spatial pattern of the ecosystem in the landscape, which consists of local ecological key areas and their connections [7,8]. Similar concepts include green infrastructure (GI) and ecological networks (ENs), and some researchers use ENs and GI as the research framework, focusing on the protection of organisms and the layout of urban infrastructure [9,10,11,12]. For example, the method of establishing ENs has been proposed by Hofman et al. EN provides an effective reference for biodiversity conservation [13,14]. The concept of GI was proposed in America [11], the purpose of which is to adapt to climate change [15], improve air quality [16], increase public interest and participation, and so on [17,18]. ESP, EN, and GI relate to the territorial system of ecological stability (TSES). The TSES represents the integration of landscape ecology principles, policy, and spatial planning. The territorial system of ecological stability was used by Western scientists, while the ecological security pattern was promoted by Chinese scholars. The ESP was first proposed by Yu’s team [7] and gradually improved, forming the basic research paradigm of the “source-corridor” ecological security pattern [2]. Ecological sources are patches within a region that play a crucial role in providing important ecosystem services [2,19]. These patches exhibit high connectivity and hold great significance for the overall ecological well-being of the entire region [20]. Ecological sources can be extracted by land use/cover [21], ecosystem service functions [22,23,24,25,26,27], landscape connectivity [10,28], and nature reserves [29]. The majority of earlier studies were based on nature reserves and ecosystem services, while few investigations determined ecological sources based on both ecosystem services and connectivity. Areas with high value to the regional ecological security can be identified using an extraction method based on ecosystem services. However, if connectivity is not considered, the built ecological corridor is likely to face the risk of damage, and it is also difficult to be effectively used for subsequent construction.
Belt-shaped ecosystems, known as ecological corridors, serve a variety of ecosystem services, including preserving biodiversity, filtering pollutants, and reducing soil erosion [30], as well as providing vital animal migration routes. Ecological corridor identification methods include the minimum cumulative resistance model (MCR) [31], circuit theory [19], ant colony algorithm [32], and other methods [33,34]. Among them, the MCR model, founded on the “source-sink” theory, has gained widespread recognition as a predominant assessment approach owing to its adaptable additive attribute [28]. Building a resistant surface is an important step in creating an ecological corridor. The value of ecological resistance is primarily influenced by land use types and human activities [14]. The design of the regional ecological security pattern should include ecological restoration. Researchers primarily adopt the ecological security pattern as the fundamental research framework and utilize circuit theory and other techniques to identify ecological nodes systematically. This approach allows for the identification of priority areas for ecological restoration and protection within the territorial land space [19,35,36]. However, few studies have been conducted across administrative regions, and the designation of priority areas is largely dependent on administrative regions. In 2008, the Chinese government aimed to achieve coordinated development in the Yangtze River Delta (YRD). Ecological integration is as necessary as economic integration. However, the cross-administrative ecological security pattern and the YRD’s priority areas for ecological restoration and protection were not identified in earlier investigations.
To bridge the existing research gap, this study identifies ecological corridors and key areas for ecological restoration and protection by employing the “source-corridor” ecological security pattern paradigm. The study analyzes ecosystem services and connectivity in the YRD and use the MCR model and circuit theory to construct ecological security pattern. The following problems are to be solved: (1) analysis of the four types of ecosystem service patterns in the YRD; (2) how to identify regions across administrative regions, the priority areas for ecological restoration and ecological protection in the YRD.

2. Materials and Methods

2.1. Study Area

The YRD, which includes Jiangsu Province, Zhejiang Province, Anhui Province, and Shanghai City, is situated between 114°50′ E–122°30′ E and 27°10′ N–35°10′ N. It is the most economically active region in China, covering a total area of 358,000 square kilometers. In the research region, low mountains and hills are prevalent south of the Yangtze River, and agricultural plains are present north of the Yangtze River. The YRD is the most populated and a core area of economic importance in China. However, the YRD’s ecological environment is suffering significant difficulties as a result of economic expansion. To ensure sustainable development, it is imperative to strike a balance between the ecological environment and economic growth in the YRD. The creation of a cross-regional and cross-basin ecological security pattern is one of the main objectives of the integrated development of the ecological environment, and the YRD is a demonstration area of regional integrated development in China (Figure 1).

2.2. Data Source

The digital elevation model (DEM) is based on the National Aeronautics and Space Administration’s (NASA) worldwide basic geographic data DEM. Elevation data are processed on the GEE platform and output 30 m DEM data; precipitation data, evapotranspiration data, and runoff data come from the TerraClimate dataset. Available online: https://www.climatologylab.org/ (accessed on 20 October 2022); soil data come from the global soil grid information (SoilGrids, https://www.isric.org/explore/soilgrids, accessed on 20 October 2022) provided by the World Soil Information Center; normalized difference vegetation index data (Normalized Difference Vegetation Index, NDVI) come from the MOD13Q1 V6 product; net primary productivity data (NPP) come from MODIS MOD17A3HGF V6 products. Reclassify data raster data into 1 km for analysis.

2.3. Identification of Ecological Security Pattern

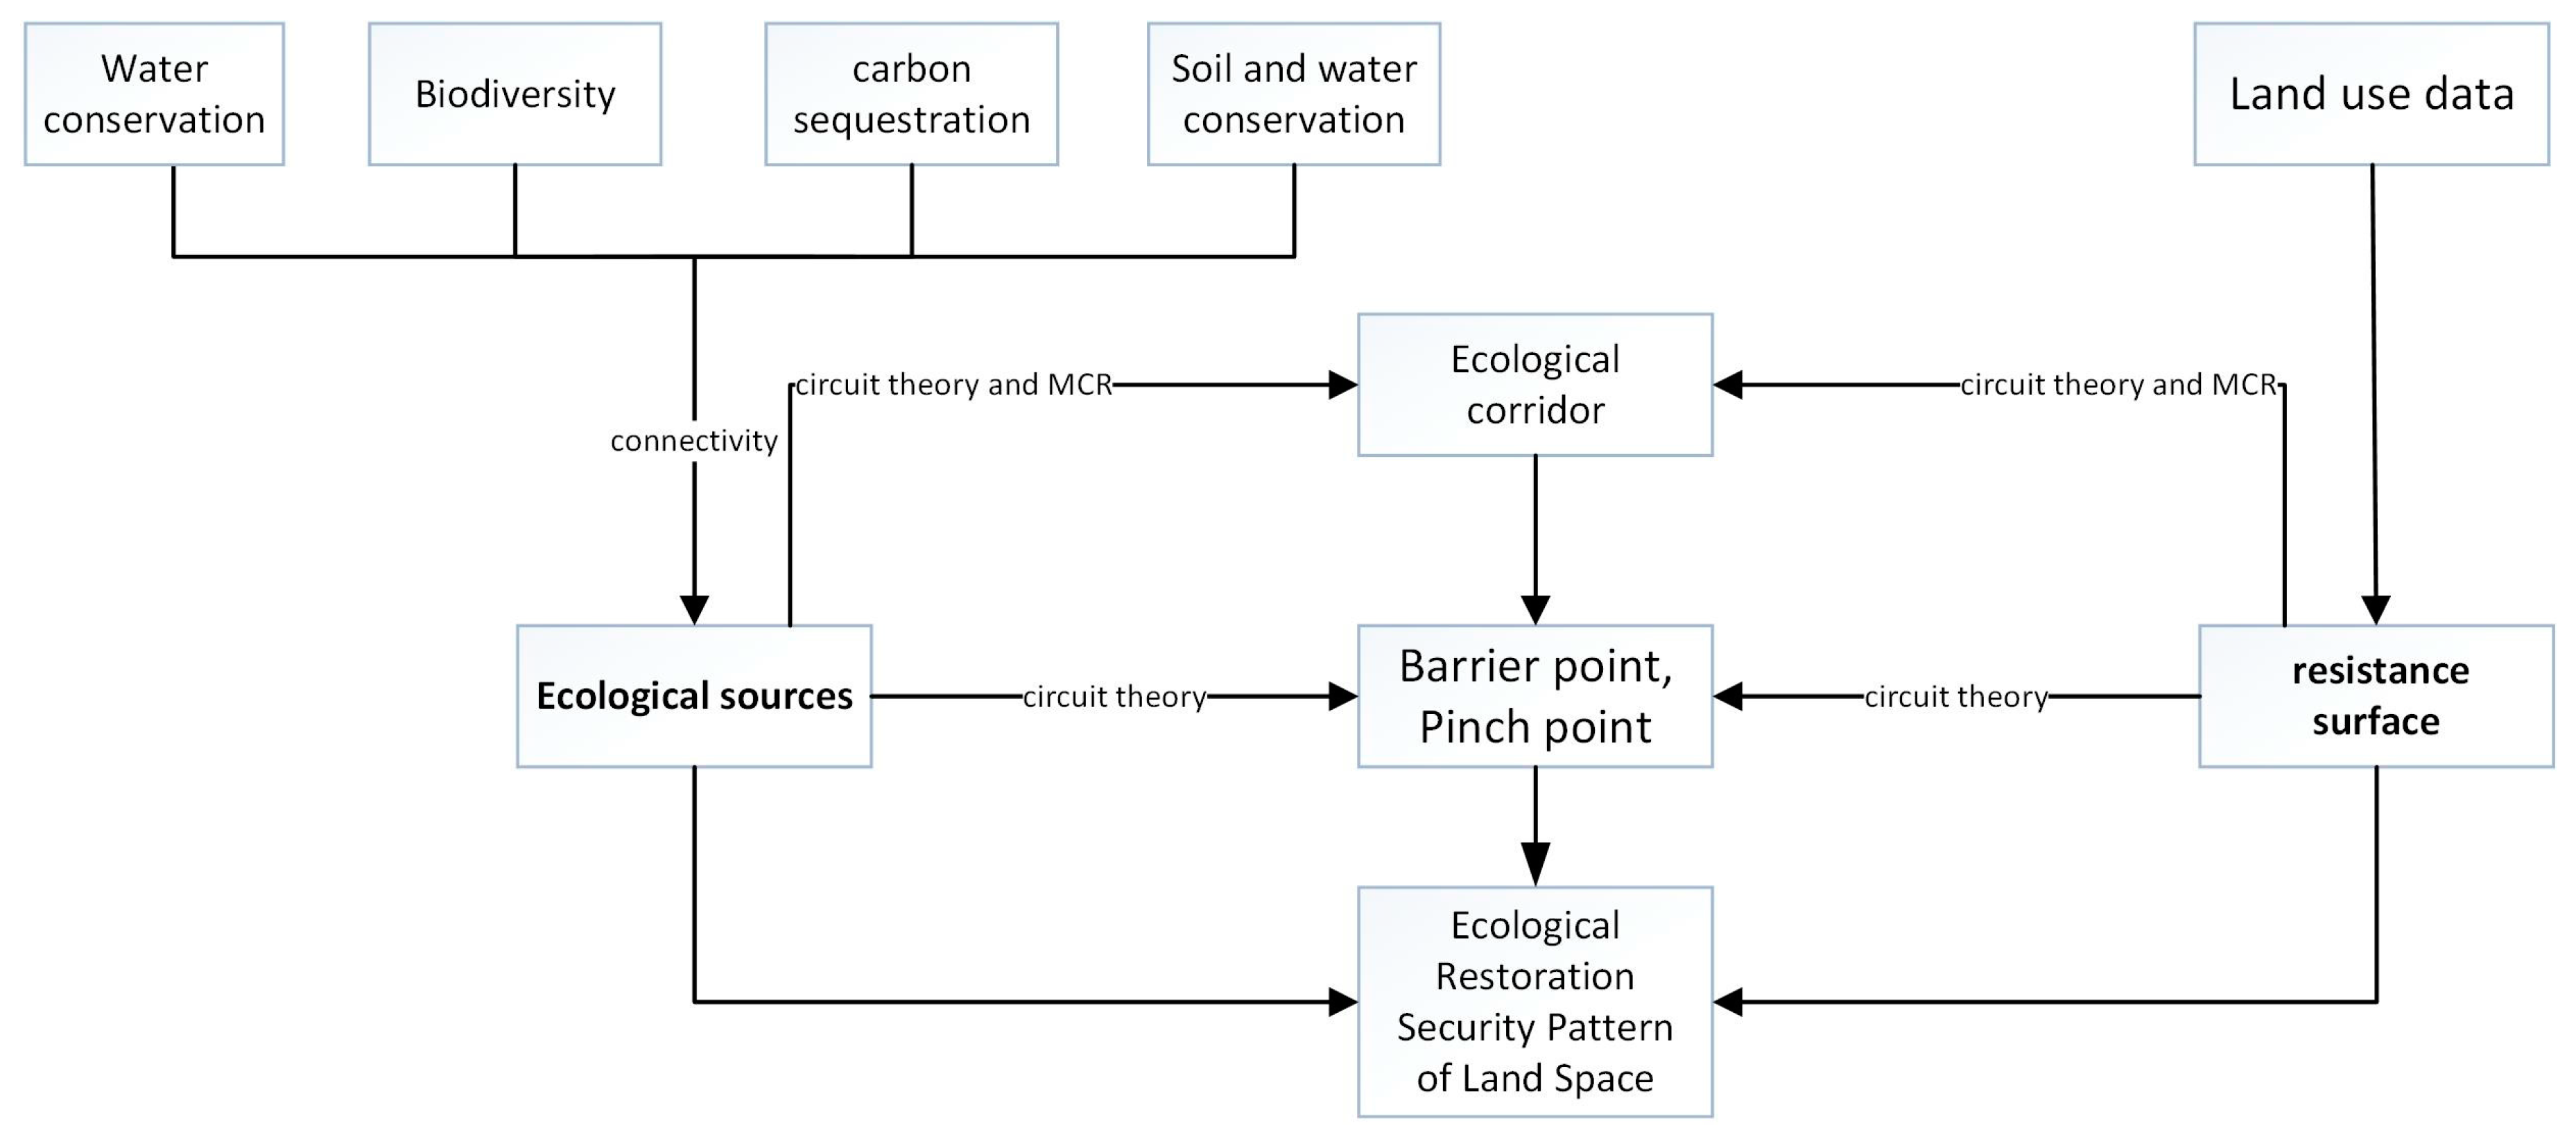
The research methodology comprises three main components, namely, the identification of ecological sources, the development of resistance surfaces, and the recognition of ecological restoration patterns within the terrestrial landscape. The identification of ecological sources is based on a variety of ecosystem services and connectivity. We refer to relevant research to identify the top 1/3 area of ecosystem services for ensuring to achieve 30 × 30 aim [37,38,39,40], and use morphological spatial pattern analysis and calculate the overall connectivity to extract the ecological sources. The resistance surface is constructed using land use data to construct the resistance. Finally, based on resistance surface and ecological sources, the MCR and circuit theory are used to extract important ecological corridors and ecological restoration and protection areas (barrier points, pinch points). Finally, regional ecological security patterns, which contain ecological corridors and restoration protection areas, are constructed (Figure 2).

2.3.1. Ecological Source Identification

Following the definition of previous scholars, the role of the ecological security pattern is the sustainability of ecosystem health and services [2,41]; therefore, when identifying ecological sources, we take into account the significant ecosystem services provided by the YRD [42,43,44]. To create better ecological corridors, connectivity is another factor we take into account. We take into account structural and functional connections in connectedness, which are determined using morphological spatial pattern analysis and landscape connectivity methods, respectively.
  • Water conservation
Water conservation is an important ecosystem service which is of great significance to regional development and ecological environment protection [45]. On an instantaneous scale, water conservation is achieved through vegetation canopy and litter interception, soil water storage and infiltration, runoff, and evapotranspiration processes. On an interannual scale, interception and water storage are ultimately exported to the ecosystem through evapotranspiration and runoff; that is, “water balance”. This study calculates water conservation based on the water balance method [46], and the calculation formula is:
Q = P S R E T × A .
In the formula, Q is water conservation ( m 3 ), P is rainfall ( m ), SR is surface runoff ( m ), and ET is evapotranspiration ( m ).
2.
Soil and water conservation
The assessment of the soil and water conservation service function is conducted through the utilization of the revised soil and water loss equation (RUSLE) [27,47,48]. The calculation formula is:
A c = A p A r = R × K × L S × 1 C × P .
In the formula,  A c  is the average annual soil conservation amount ( t · hm 2 · a 1 ),  A p  is the average potential annual soil erosion,  A r  is the average actual annual soil erosion ( t · hm 2 · a 1 ),  R  is the precipitation and runoff erosivity factor ( MJ · mm · hm 2 · h 1 · a 1 ),  K  is the soil erodibility factor ( t · hm 2 · h · MJ 1 · mm 1 · hm 2 ),  L S  is the terrain factor (dimensionless, where  L  is the slope length factor and  S  is the slope factor),  C  is the vegetation coverage and management factor (dimensionless), and  P  is the factor of water and soil protection measures (dimensionless).
3.
Carbon sequestration service
Ecosystem net primary productivity NPP is selected as the characterization of ecosystem carbon sequestration function [24], and the unit is g/m2.
4.
Biodiversity
The InVEST model assesses habitat quality by integrating landscape type sensitivity and the intensity of external threats. Additionally, it evaluates the biodiversity service function based on the advantages and disadvantages of the habitat quality [49], which effectively indicates the ecosystem’s capacity to provide suitable living conditions for species. Habitat quality serves as a measure of biodiversity status, reflecting the ecosystem’s capability to support organisms. The range of the results generated by the habitat quality module is [0, 1], representing continuous variables. As the value increases, the habitat quality proportionally improves.
The InVEST model evaluates habitat quality primarily by analyzing the associated land use types and the extent and degradation level of specific vegetation or habitat types. This calculation involves the utilization of data on threat factors, threat sources, and land use. The calculation is as follows:
D x j = r = 1 R y = 1 Y r ω r r = 1 R ω r × r y × i r x y × β x × S j r ,
Q x j = H i j × 1 D x y 2 D x y 2 + k 2 .
In the formula,  D x j  is the habitat degradation degree of grid x in habitat type j; r is the threat source; y is the grid number of threat source r ω r  is the weight of the threat factor;  r y    is the stress value of grid y i r x y  is the stress level of threat source r in grid y on grid x can be divided into two types: exponential and linear;  β x  is the accessibility level of the threat source to grid x S j r    is the sensitivity of habitat type j to threat source r  Q x j  is the habitat quality;  H i j  is the habitat suitability; k is the half-saturation parameter, usually 2.5.
Referring to the InVEST model guidebook and related research [50,51,52], and on the basis of considering the actual situation of the study area, threat factors and habitat suitability are determined (Table 1 and Table 2). The maximum stress distance refers to the farthest distance within which each threat source can exert an influence on the study area. The weight represents the significance of the impact on habitat integrity relative to other threat sources, as chosen in the study. The spatial decline type indicates the type of degradation affected by the threat source, which contains linear or exponential influence, which can be either linear or exponential, depending on whether its influence increases steadily or rapidly with distance. In the study, Paddy fields and rural settlements were considered exponential impact types, and dry land, urban land, and other construction land were considered linear impact types.
5.
Morphological Spatial Pattern Analysis
Morphological spatial pattern analysis (MSPA) is an image processing technique employed by Vogt and other researchers to assess, identify, and segment the spatial patterns in raster images. This method is based on mathematical morphology principles such as erosion, expansion, opening operation, and closing operation structure [17,53]. MSPA can reflect the structural connectivity of corridors [54] and is an effective way to analyze ecological networks. Morphological analysis methods designed for geometric description and plaque association can be applied to digital image analysis at various scales [55]. MSPA’s identification is based on a binary map, which divides the map into foreground and background. The foreground is the object of interest, and the background is complementary. In this study, important habitats are considered as the foreground for analysis. Then, the adopted image processing method classifies the foreground into seven pattern classes by shape (referring to core area, bridge, edge, branch, ring, island, and perforation). The core area is a larger habitat patch, which can be used as the basis for ecological source selection [47] (Table 3).
6.
Landscape connectivity
The term “landscape connectivity” describes how easily or inconveniently a landscape allows for the migration of different species within it [56]. Landscape connectedness is a crucial indicator to gauge the ecological process of the landscape [57] and describes the degree to which the environment facilitates or obstructs biological flow. One of the most important aspects of preserving biodiversity and the stability and integrity of ecosystems is maintaining strong connectivity. The probability of connectivity index (PC) can determine the significance of each patch of the landscape to the connectivity of the landscape in addition to reflecting the connectivity of the landscape. At the moment, planning for landscapes uses it extensively. As a basis for assessing the degree, frequency, or flexibility of direct movement of researched species, connectivity is defined [58]. The formula for calculating the PC index is:
P C = i = 1 n j = 1 n a i × a j × p i j A L 2 .
In the formula, n is the total number of habitat nodes in the landscape;  a i  and  a j  are the areas of patch i and patch j, respectively;  A L  is the total area of the study area;  p i j  is the number of all connected paths between patch i and patch j. The possible connectivity index is a representation of the overall connectivity of the landscape at the landscape level. When a patch in the landscape is removed, the landscape structure will be changed, and the connectivity level will change accordingly. The amount of change can be considered as the performance of the importance of the patch in landscape connectivity. Therefore, through the calculation of PC, the important value of each patch in the landscape-to-landscape connectivity can be obtained, which can be used as an analysis of the influence and effect of patches on landscape connectivity. The important value of patch i in the landscape is dPCi (%), which means that when the corresponding patch is removed, the possible connectivity change in the overall landscape and the specific calculation formula is:
d P C i = 100 × P C P C i r e m o v e P C .
In the formula, if all patches are present, PC is the potential connection index of the landscape as a whole.;  P C i r e m o v e  is the possible connectivity index value of the remaining patches to form the landscape after removing patch i. The higher the value of    d P C i , the higher the importance of the patch in the landscape connectivity, and the more obvious the core position of the patch i in the landscape. Connectivity analysis is performed through ArcGIS 10.8 software, plug-in modules Conefor Inputs for ArcGIS 10.x, and Conefor2.6.
In this paper, the four ecosystem services are standardized and added, and the highest 1/3 is taken as the prospect data for MSPA analysis. Landscape connectivity analysis are performed on the data after MSPA analysis. Considering patch radiation and landscape connectivity, this paper reserves patches with an area greater than 20 km2 and dPC equal to or greater than 0.02 as ecological sources.

2.3.2. Ecological Resistance Surfaces and Ecological Corridors

  • Construction of ecological resistance surface
Land use patterns and human activities have a significant impact on the movement of species in horizontal space as well as the flow and transfer of biological fluxes between patches [19,59]. The value of ecological resistance (resistance to the outward expansion of the source area) is mainly affected by land use types and human activities. Referring to related studies [60], this paper sets the resistance value of each land type in the land use data as follows: 1 for forest land, 10 for grassland, 30 for cropland, 50 for water body, 400 for rural residential area, and 500 for urban and other construction land.
2.
Construction of ecological corridors
Ecological corridors are pathways that connect ecological sources [30], and they are now widely used to ensure ecological security. Ecological corridor building can sustain ecosystem services, lessen ecological source fragmentation, and increase ecological source connectedness. The minimum cumulative resistance model takes advantage of the characteristics of species seeking advantages and avoiding disadvantages and calculates the ecological corridor by calculating the minimum path between two patches. Calculated as follows:
M C R = f m i n j = n i = m D i j × R i .
In the formula, MCR is the minimum cumulative resistance value of ecological source patch j spreading to a certain point;  D i j  is the spatial distance of base i that species cross from ecological source j to a certain point in space;  R i  is the impact of patch i on the ecological process or the basic resistance to the movement of species.

2.3.3. Identification of Key Areas for Ecological Restoration of Land Space

Ecological pinch points are places that are crucial for preserving ecology [14,36]. The circuit theory is applied to the identification of ecological pinch points. Iterative operations are used to obtain each node in order to identify ecological pinch points by grounding one node (ecological source) and applying the same current to other nodes (ecological source). The ecological pinch point is defined by the location with the highest cumulative current value over all pixels [24]. Ecological pinch points are unique and feature a high current density. The connection between ecological sources will most likely be severed if this area is degraded or lost; hence, protection should be given top priority. The area with a high current density is the ecological corridor’s weak spot. The interconnectedness of the ecological corridor will also suffer if there is a slight area loss in this region. To detect and choose the “all to one” option for calculation, the research makes use of the Pinchpoint Mapper module in the Linkage Mapping plug-in.
Ecological barrier points are locations where species cannot travel freely across habitat areas. The connectivity between ecological sources can be improved by removing these places [61], and ecological restoration should be carried out. By evaluating the size of the current recovery value after the barrier point is removed, ecological barrier points can be located. This identification method can not only identify the complete barrier point that affects the operation of the ecological flow in the area but also identify the partial barrier area [61,62]. The Barrier Mapper module is utilized in this study to pinpoint the ecological corridor’s barrier locations. The model’s computation mode is set to “Maximum”. Protecting and restoring ecological pinch points and ecological barrier points are crucial methods for enhancing ecosystem functionality. The coordinated protection of both holds significant importance.

3. Results

3.1. Spatial Distribution of Ecosystem Services in the YRD

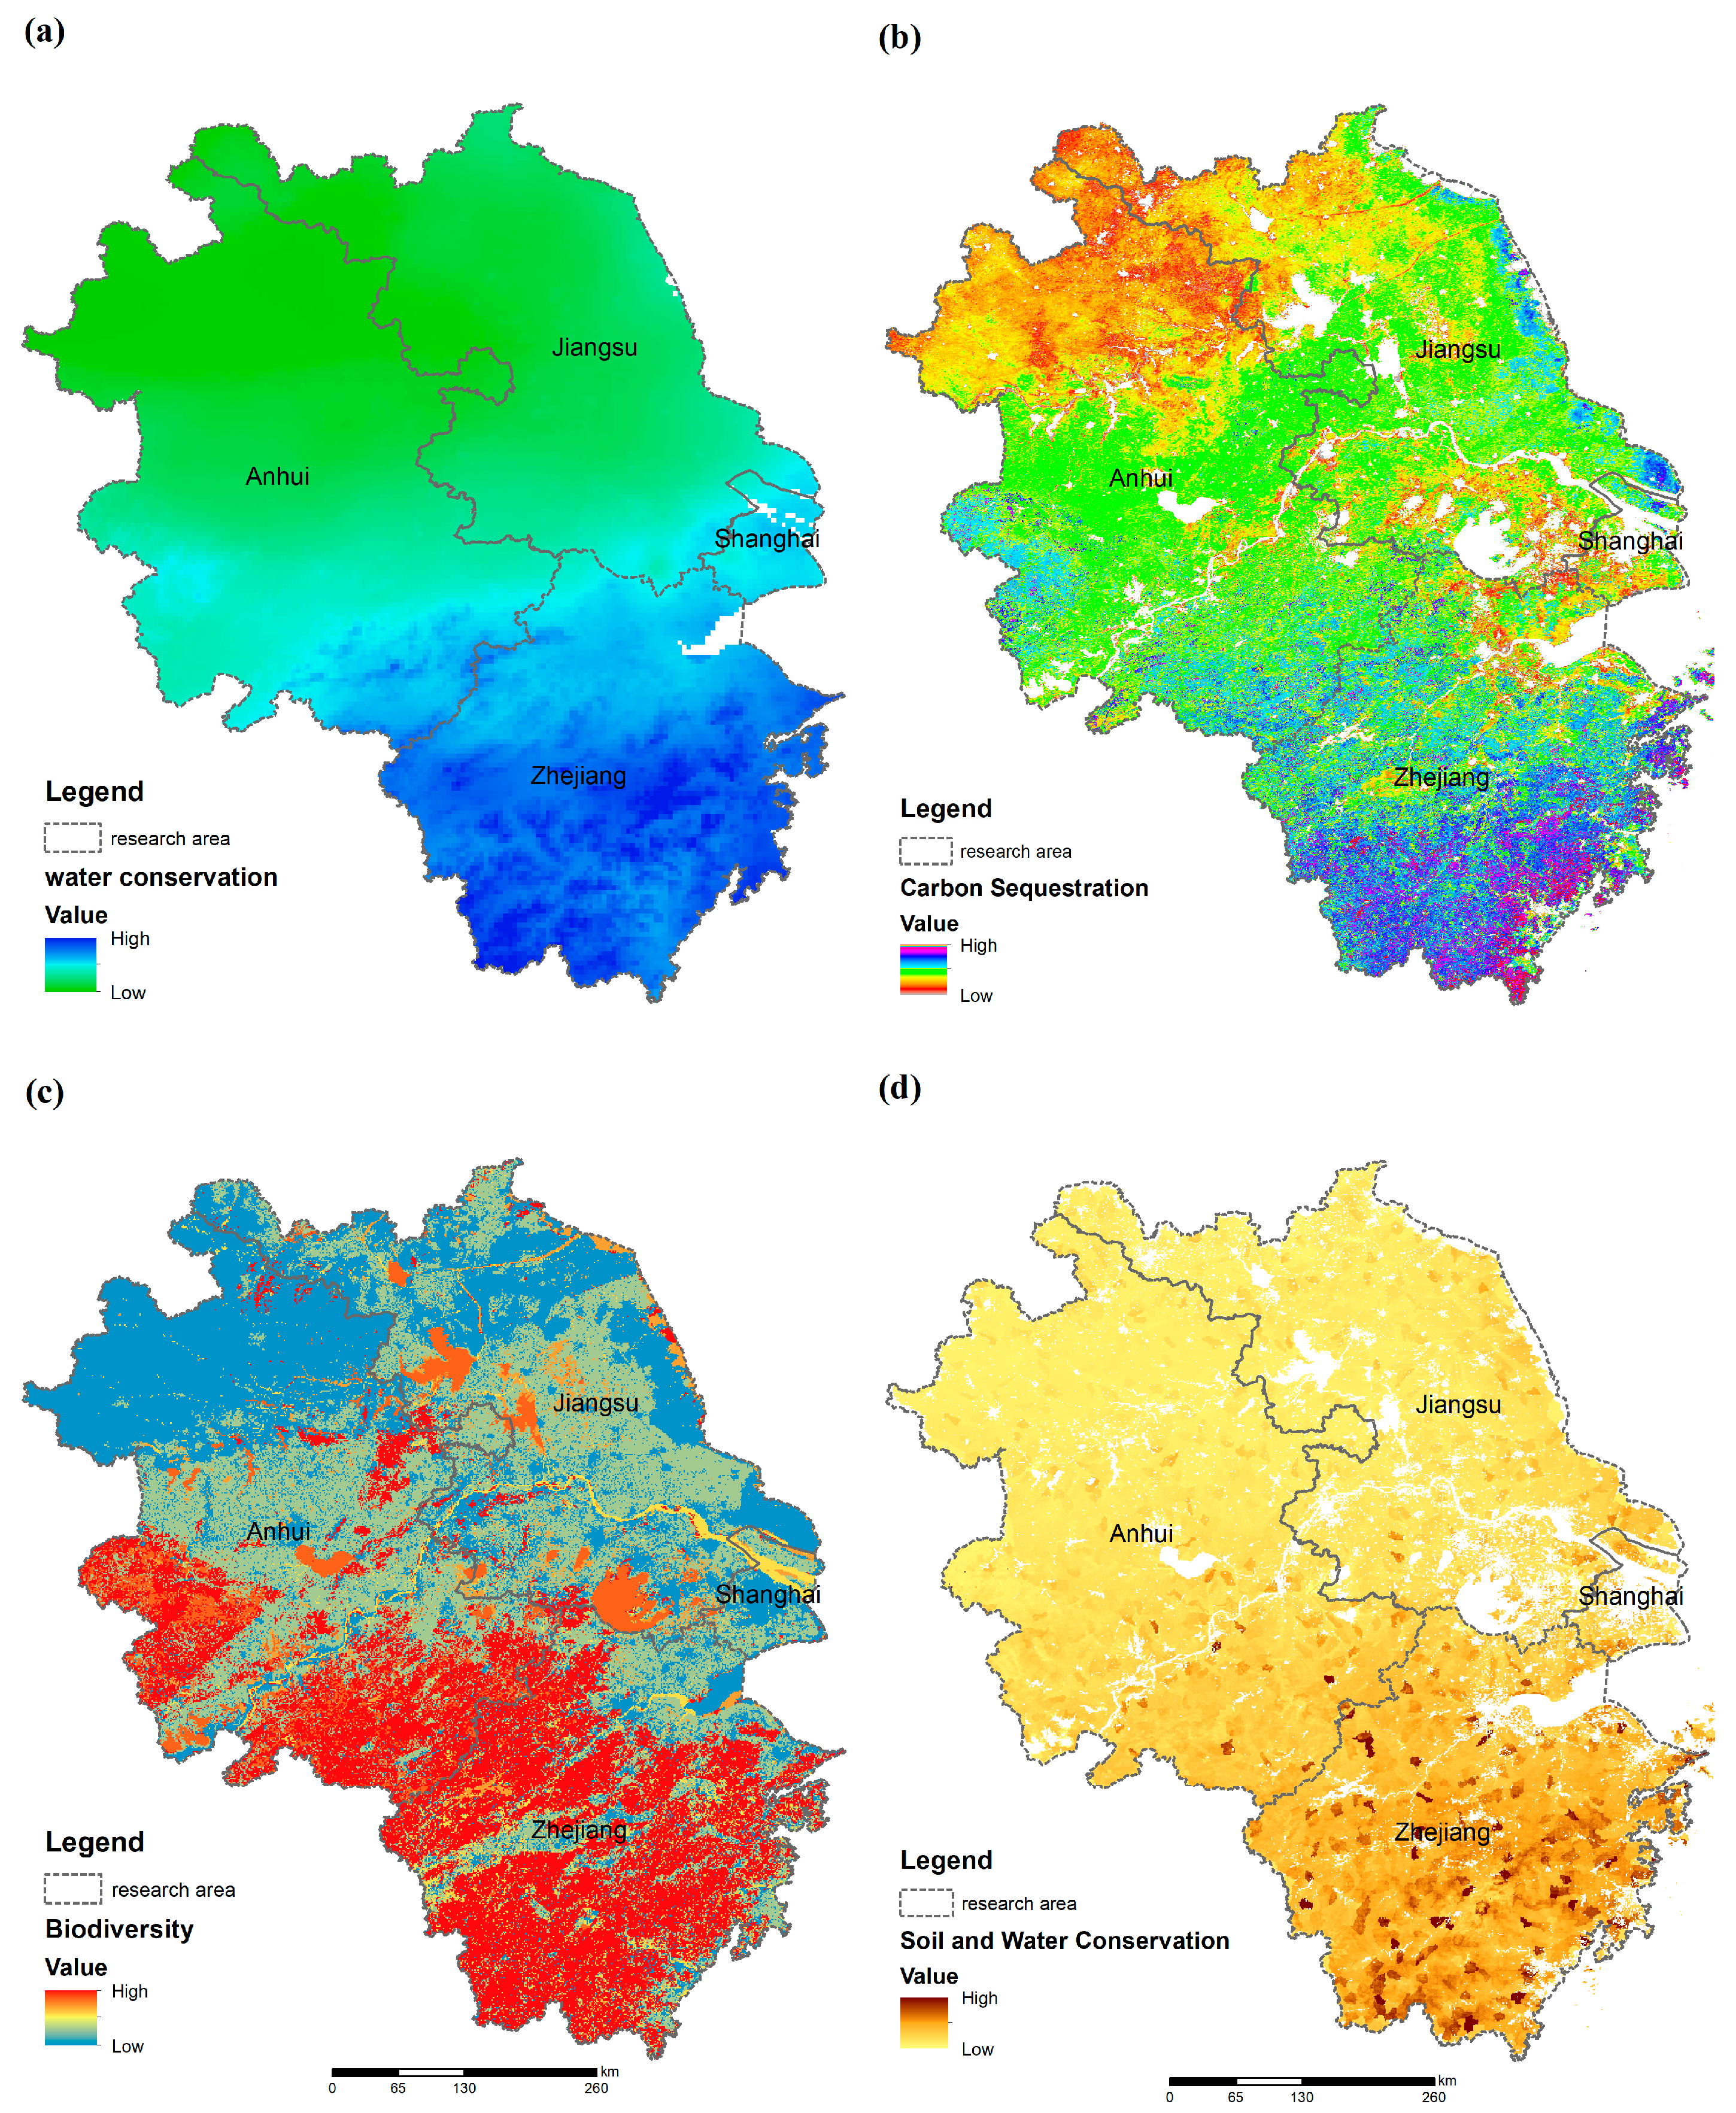
The spatial distribution pattern of various ecosystem services in the study area is shown in Figure 3. Individual ecosystem services are distributed in a way that clearly demonstrates spatial differentiation. While the value of ecological diversity services has a distinct spatial distribution compared to other ecosystem services, the distribution trend is continuous, meaning that the individual ecosystem services in the southeast of the YRD are often higher than those in the northwest.
The distribution of carbon sequestration space in the YRD region has obvious differentiation. The areas with high carbon sequestration areas are mainly distributed in the central and southeastern regions, forests as well as wetlands (Figure 3a). The spatial distribution pattern of water conservation services is similar to that of soil and water conservation services and also shows obvious spatial differentiation in pattern division. The areas with large average water conservation are mainly concentrated in the southeastern part of Zhejiang, while the smaller areas are located in the northwestern part of Anhui and Jiangsu (Figure 3b). The biodiversity services in the study area showed obvious spatial differentiation characteristics, and the values in Zhejiang and southwestern Anhui were higher than those in Jiangsu, Shanghai, and northeastern Anhui. The western and southern parts of the YRD are hilly areas with high biodiversity values (Figure 3c). In terms of water and soil conservation services, there is a very obvious pattern distinction in the study area. The high-value areas of soil conservation services are mainly distributed in Zhejiang, Shanghai, and parts of Jiangsu in the southeast of the YRD. Zhejiang is significantly higher than the average value of the study area. Areas with large slope changes will store a large amount of soil erosion, while the forests on the mountainsides and foothills of the southeastern mountains have stronger soil conservation capabilities (Figure 3d).

3.2. Spatial Distribution of Ecological Sources

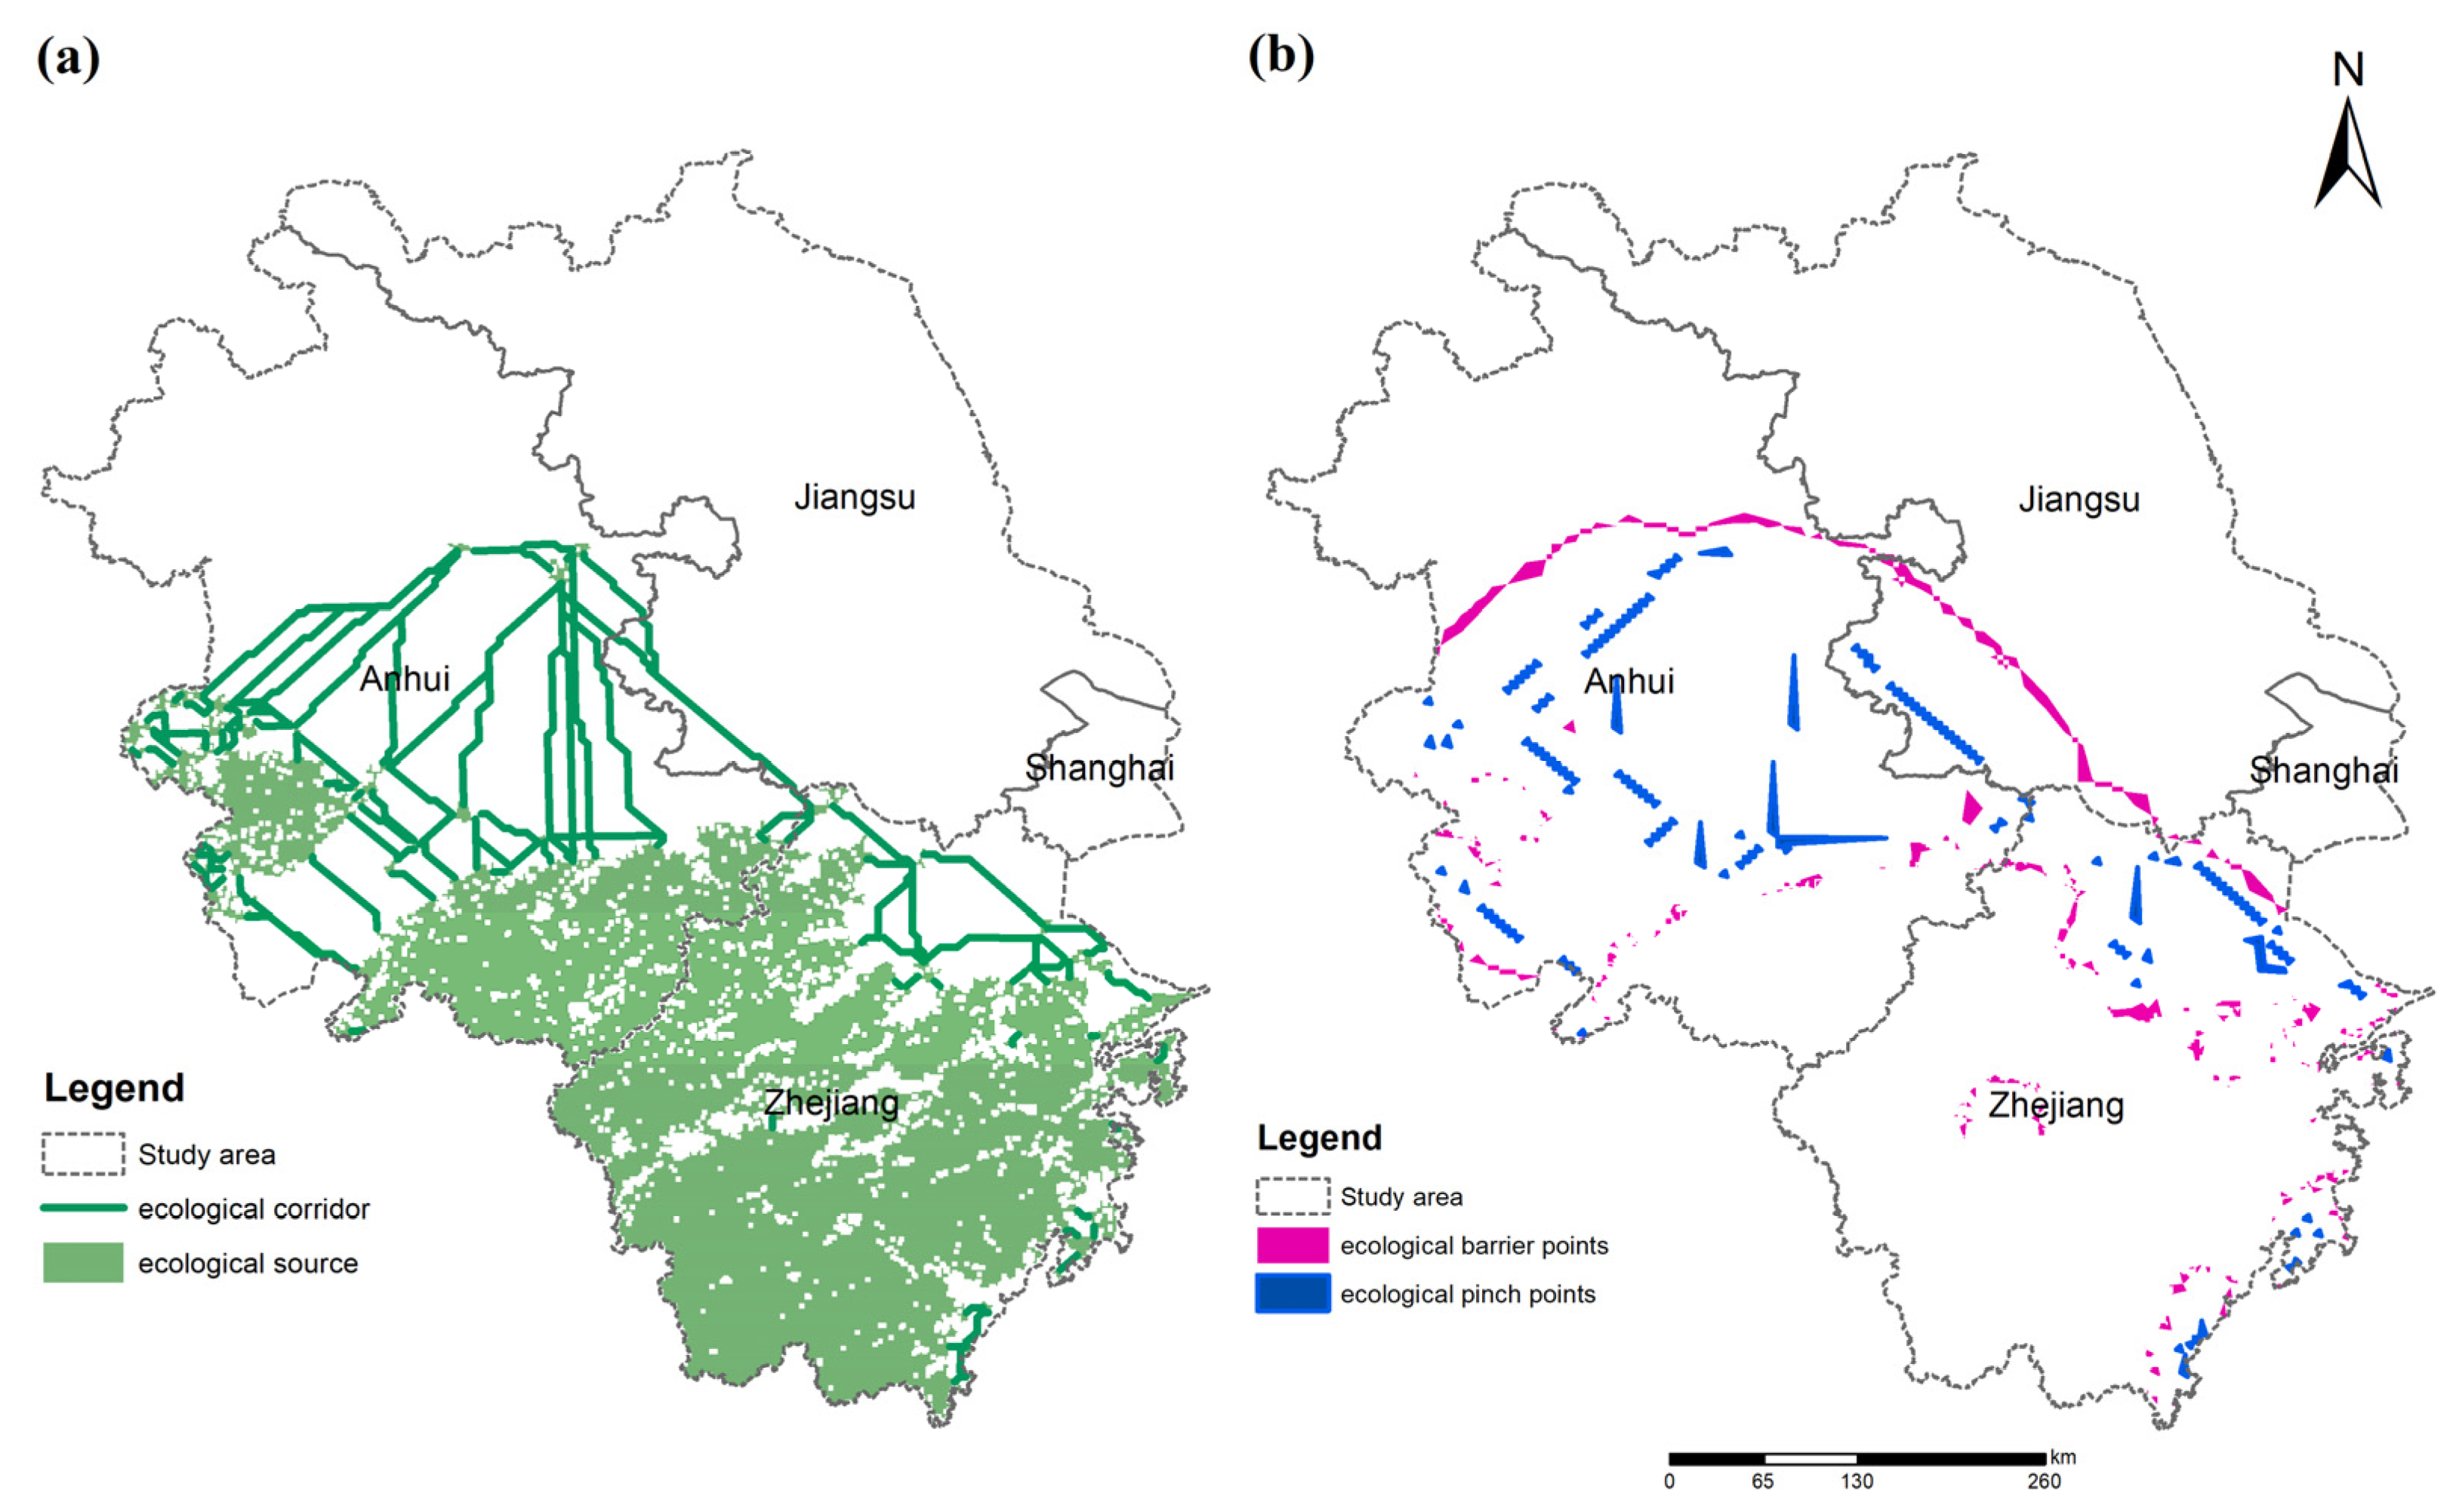
Through analysis, a total of 52 ecological sources were selected in this study, with a total area of 90,821.84 km2. Among them, the average area of the source area is 1746.10 km2, and the area of the largest ecological source area is 81,670.28 km2. As shown in Figure 4, the ecological sources are relatively concentrated, showing the characteristics of “more in the south, less in the north, and concentrated distribution”. The source areas are mainly located in the southern part of the Yangtze River Delta, i.e., the mountainous and riverine areas of Zhejiang Province. In addition, there are many ecological sources in the south and west of Anhui Province but there are no ecological sources in Jiangsu Province and Shanghai City (Figure 4a).

3.3. Resistance Surface and Ecological Corridor Construction

The resistance surface of the YRD was constructed based on land use data. As shown in Figure 4b, Shanghai has a high ecological resistance value, and there are sizable areas of high resistance values in Jiangsu Province. The high-value resistance zones in the YRD are concentrated in urban centers and mountainous terrain. The northeast is where the majority of the areas with strong ecological resistance value are located, while the southwestern hilly region has a low ecological resistance value. Additionally, there are sizable areas with strong ecological resistance values in Anhui’s northern zone and Zhejiang’s coastline region. Based on the ecological resistance surface, the MCR model in ArcGIS10.8 is used to construct ecological corridors to connect ecological sources. As shown in Figure 4a, a total of 113 ecological corridors have been constructed with a total length of 4704.03 km, and the longest ecological corridor is 232.16 km. Most of the ecological corridors overlap with rivers, and the ecological sources are mainly concentrated in the southern part of the YRD. There are fewer ecological corridors in the central and northern regions, which is closely related to the smaller and unevenly distributed patches of ecological sources in the YRD. The constructed ecological corridors are mainly concentrated in Anhui and Zhejiang, where the most ecological corridors are in Anhui (Figure 4b).

3.4. Key Areas for Ecological Restoration of Land Space

Using the Pinchpoint Mapper in the Linkage Mapper Toolkit of ArcGIS10.8 to extract ecological pinch points. According to the circuit theory, the current was injected into the ecological source, and the natural breakpoint method was used to divide it into five categories to extract the strongest one in the area with a strong current, and finally, 141 ecological pinch points were identified with a total area of 2302.77 km2. Ecological pinch points are mainly located in Anhui and Zhejiang, with most areas near ecological corridors. Overlaying the ecological pinch points with the land use data, the main land types of the study ecological pinch points are cropland, grassland and urban areas, and other construction land, which occupy 56.21%, 18.88%, and 15.03% of all land types, respectively. Using the Barrier Mapper in the Linkage Mapper Toolkit of ArcGIS10.8 to extract ecological barrier points. A total of 151 ecological barrier points were identified, with a total area of 5303.43 km2. As shown in Figure 5, ecological barriers are mainly concentrated in areas where ecological sources and ecological corridors are relatively concentrated. Analyzing the land type of ecological barrier points, it was found that the main land type of ecological barrier sites was cropland occupying 49.23% of all land types, while grassland, urban areas, and other construction land occupied 20.68%, 13.65%, and 12.94%, respectively.

4. Discussion

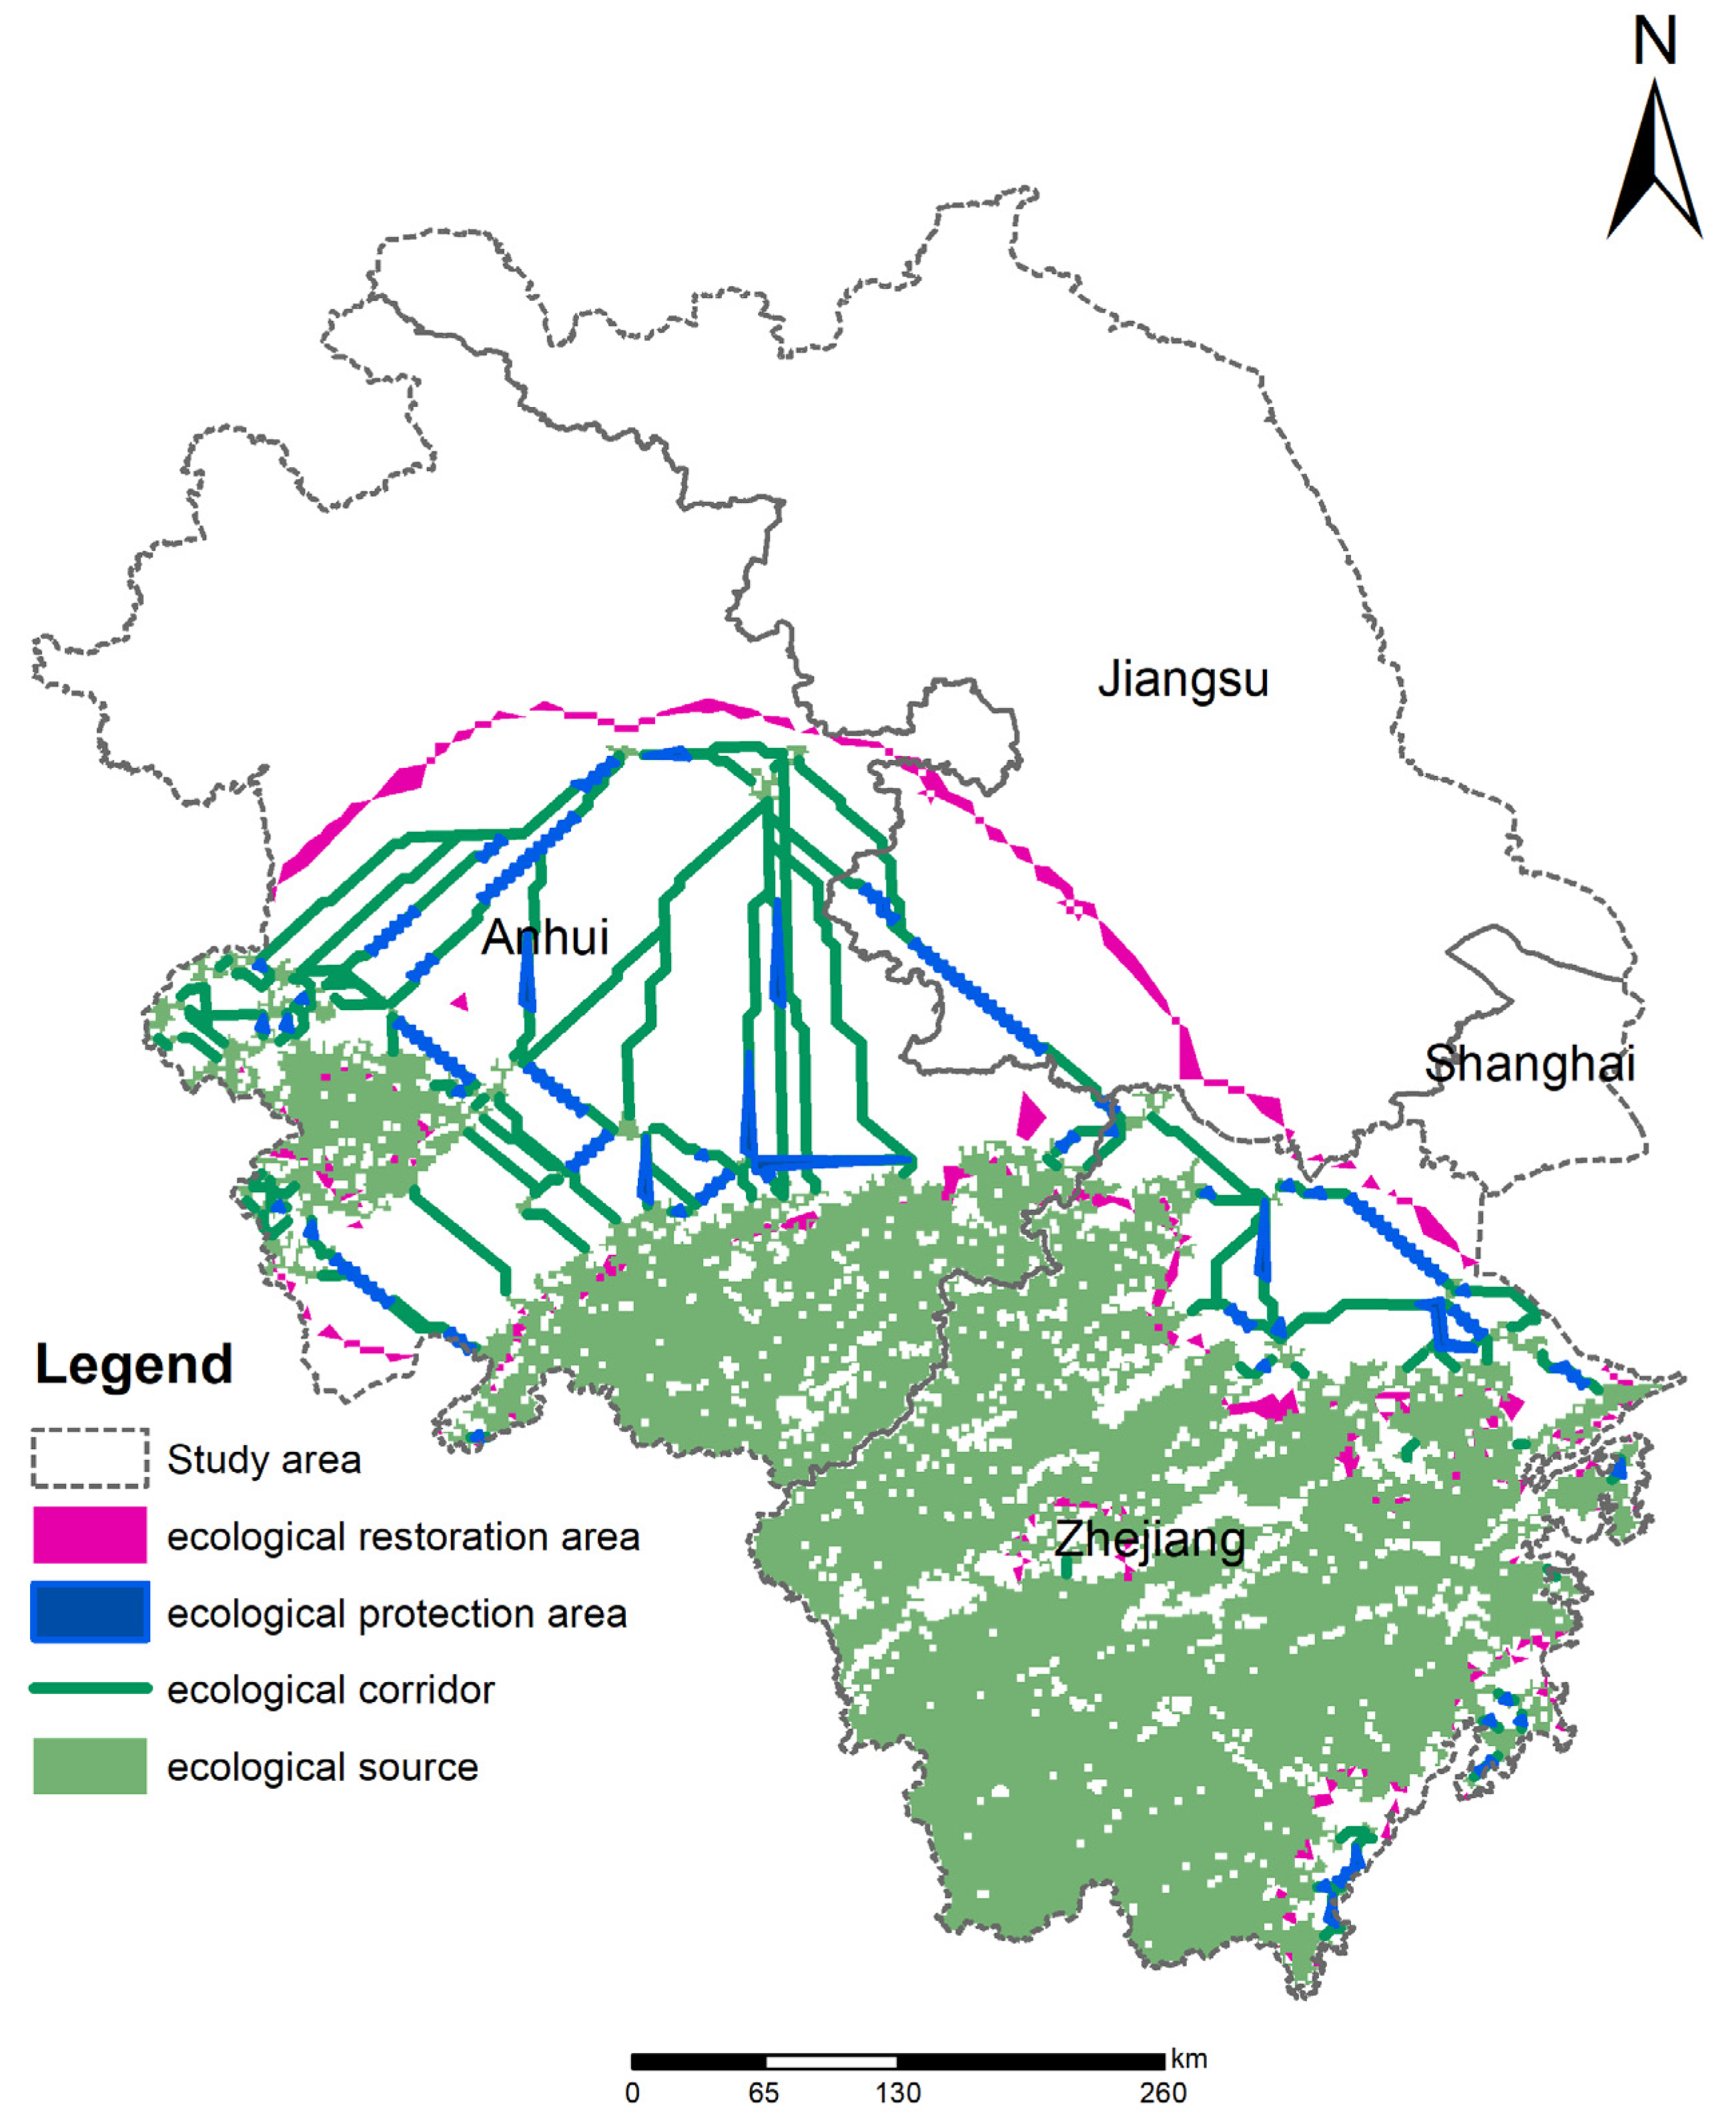
The study analyzes ecosystem services and connectivity in the YRD and uses the MCR model and circuit theory to construct ecological security patterns. According to the identification results, ecological sources are primarily found in the southern region, which is consistent with other investigations [29]. Compared with previous studies that used nature reserves to identify sources and construct ecological security patterns, this study provides a new way to construct ecological sources and ecological security patterns, which can provide references for related research. Compared with the related research [19,63], this study took four different types of ecosystem services into account when choosing its sources and charted their distribution. We evaluated trends in ecosystem services with closely related studies that shared a great deal in common because the ecosystem services in the YRD varied substantially in this study [64]. The heterogeneity of our anthropogenic ecosystem services is closely related to the topography and climate of the YRD region, and the areas with high ecosystem services are mostly concentrated in the mountainous areas of Zhejiang Province. At the same time, MSPA and landscape connectivity analysis were conducted on this basis, which can better reflect the two characteristics of ecological sources as important habitats and important ecological nodes for organisms [12] and can provide the corresponding basis for subsequent studies. For the practical construction of ecological corridors, it can offer a stronger theoretical foundation. Additionally, this study has developed a cross-regional ecological security pattern in comparison to other studies based on regional administrative regions, which can aid in the actual work of the integration of the YRD. Ecological pinch points are categorized as ecological restoration priority regions, whereas ecological barrier points are ecological restoration and protection areas. They create an ecological security pattern along with ecological corridors and source areas, and the preservation of this ecological security pattern is crucial for the health of the local ecosystem. We recommend giving the ecological restoration area priority because it is crucial for improving interactions and exchanges among local ecosystem services. Regarding the ecological protection areas, it should be safeguarded because it is where the current passes, which is very important (Figure 6). In the previous study, it was found that the main land type in the ecological pinch point (ecological protection area) and ecological barrier point (ecological restoration area) is arable land, suggesting that it can be possible to return cropland to forest in the ecological restoration zone and to enhance the habitat quality of the area in the ecological protection zone.
The precision of the ecological sources used for this work is limited due to data constraints. Although the calculated ecosystem services can provide valuable insights, they can only offer a reliable indication of the overall trend. Because different approaches are used to calculate the value of different ecosystem services, their values are also different. Additionally, the configuration of the resistance surface in this study is derived directly from land use information. Despite the fact that various studies altered the resistance surface [20,65], there has been controversy about how to modify it [30]. So, in this instance, we continue to directly assign values using the land use data. However, since this study is based on a macro-scale analysis of ecological safety patterns, it reveals the presence of ecological safety sources distributed across the region, leading to the identification of ecological corridors and areas suitable for ecological restoration and protection. The findings of the method are based on a coarse scale for the exchange and communication of ecosystem services throughout the area. Jiangsu and Shanghai, according to our data, have fewer ecological sources than Anhui and Zhejiang; therefore, they need to be further discovered and built on a smaller scale. Even though our study only performed a large-scale analysis, it can nonetheless serve as a guide for the YRD’s integrated ecological construction. An in-depth examination on a small scale is needed for the development of specific corridors and project engineering in the future. There have been some studies on the succession of ecological corridors and ecological security patterns at various sizes [19], while more research is required for precise implementation when it comes to corridor settings in practice. In addition, many studies have focused on the analysis and research of corridor width. The width settings are also different for different ecological corridors for their service species and purposes, so this work is a complicated one. Due to the focus and limited space of the research questions in this paper, the width of the ecological corridor is not considered, and the research on the width of the ecological corridor has become an important direction worth studying in the future.
The ecological security pattern has attracted the attention of many scholars in recent years, and new research has been cross-derived with different disciplines [20,31,66,67]. However, in contrast to related studies on ecological networks, a stronger theoretical foundation needs further development. Additionally, with urbanization and climate change, scholars need to conduct additional studies and analyses on how ecological safety patterns adapt to these two factors.

5. Conclusions

This study assessed four significant ecosystem services in the YRD and regional ecological security pattern based on the “source-corridor” paradigm. Areas with high degrees of connectedness within regions were examined using MSPA as well as connectivity analysis. The sources were then chosen based on connectedness and ecosystem service functions. The MCR model and circuit theory were then used to diagnose ecological pinch points, ecological barrier points, etc. Next, these tools were used to identify the major ecological protection and restoration areas of the territorial land space in the study area. The corresponding ecological restoration recommendations were then made for each category based on the different ecological statuses and where they are located within the larger regional ecological network. The research found that: (1) the area of identified ecological sources was 90,821.84 km2, and the total length of ecological corridors was 4704.03 km. (2) In total, 141 ecological restoration areas were identified, with a total area of 2302.77 km2; 151 ecological protection areas were identified, with a total area of 5303.43 km2. This study can provide valuable insight into the development of ecological restoration work in the Yangtze River Delta.

Author Contributions

Conceptualization, J.D., Y.‘e.C. and B.L.; methodology, J.D.; software, J.D. and Y.L. (Yinyin Liang); validation, J.D., Y.‘e.C. and B.L.; formal analysis, J.D., Y.‘e.C. and Y.L. (Yeyang Li); investigation, J.D., J.W. and J.T.; resources, J.D., Y.L. (Yinyin Liang) and J.W.; data curation, J.D. and Y.L. (Yinyin Liang); writing—original draft preparation, J.D., B.L. and Y.‘e.C.; writing—review and editing, Y.L. (Yinyin Liang), Y.‘e.C., Y.L. (Yeyang Li), J.W. and J.T.; visualization, J.D.; supervision, Y.‘e.C.; project administration, Y.‘e.C.; funding acquisition, Y.‘e.C. All authors have read and agreed to the published version of the manuscript.

Funding

Shanghai Normal University, under the “2023 Construction of High-level Local Universities First-class Graduate Education Project”.

Institutional Review Board Statement

Not applicable.

Informed Consent Statement

Informed consent was obtained from all subjects involved in the study.

Data Availability Statement

The data presented are available upon request from the corresponding author.

Acknowledgments

Thanks to Xuening Fang and Cheng Long for their valuable advice in writing and revising this paper.

Conflicts of Interest

The authors declare no conflict of interest.

References

  1. Fang, X.; Ma, Q.; Wu, L.; Liu, X. Distributional environmental justice of residential walking space: The lens of urban ecosystem services supply and demand. J. Environ. Manag. 2023, 329, 117050. [Google Scholar]
  2. Peng, J.; Zhao, H.; Liu, Y.; Wu, J. Research progress and prospect on regional ecological security pattern construction. Geogr. Res 2017, 36, 407–419. [Google Scholar]
  3. Fang, X.; Wu, J.; He, C. Assessing human-environment system sustainability based on Regional Safe and Just Operating Space: The case of the Inner Mongolia Grassland. Environ. Sci. Policy 2021, 116, 276–286. [Google Scholar]
  4. Martin, D.M. Ecological restoration should be redefined for the twenty-first century. Restor. Ecol. 2017, 25, 668–673. [Google Scholar] [CrossRef] [PubMed] [Green Version]
  5. Wang, C.; Liu, Y.; Yu, C.; Liu, X. Research progress on the arrangement of territorial ecological restoration. Prog. Geogr. 2021, 40, 1925–1941. [Google Scholar] [CrossRef]
  6. Wortley, L.; Hero, J.M.; Howes, M. Evaluating ecological restoration success: A review of the literature. Restor. Ecol. 2013, 21, 537–543. [Google Scholar] [CrossRef]
  7. Zastrow, M. China’s tree-planting could falter in a warming world. Nature 2019, 573, 474–475. [Google Scholar] [CrossRef] [Green Version]
  8. Yu, K. Security patterns and surface model in landscape ecological planning. Landsc. Urban Plan. 1996, 36, 1–17. [Google Scholar] [CrossRef]
  9. McRae, B.H.; Dickson, B.G.; Keitt, T.H.; Shah, V.B. Using Circuit Theory to Model Connectivity in Ecology, Evolution, and Conservation. Ecology 2008, 89, 2712–2724. [Google Scholar] [CrossRef]
  10. Lu, Z.G.; Li, W.; Wang, Y.D.; Zhou, S.Y. Bibliometric Analysis of Global Research on Ecological Networks in Nature Conservation from 1990 to 2020. Sustainability 2022, 14, 4925. [Google Scholar] [CrossRef]
  11. The President’s Council on Sustainable Development. Towards a Sustainable America: Advancing Prosperity, Opportunity, and a Healthy Environment for the 21st Century; Diane Publishing: Darby, PA, USA, 1999.
  12. Hilty, J.; Worboys, G.L.; Keeley, A.; Woodley, S.; Lausche, B.; Locke, H.; Carr, M.; Pulsford, I.; Pittock, J.; White, J.W. Guidelines for conserving connectivity through ecological networks and corridors. In Best Practice Protected Area Guidelines Series; IUCN: Gland, Switzerland, 2020; Volume 30, p. 122. [Google Scholar]
  13. Hofman, M.P.G.; Hayward, M.W.; Kelly, M.J.; Balkenhol, N. Enhancing conservation network design with graph-theory and a measure of protected area effectiveness: Refining wildlife corridors in Belize, Central America. Landsc. Urban Plan. 2018, 178, 51–59. [Google Scholar]
  14. Duan, J.; Fang, X.; Long, C.; Liang, Y.; Cao, Y.E.; Liu, Y.; Zhou, C. Identification of Key Areas for Ecosystem Restoration Based on Ecological Security Pattern. Sustainability 2022, 14, 15499. [Google Scholar] [CrossRef]
  15. Ramyar, R.; Ackerman, A.; Johnston, D.M. Adapting cities for climate change through urban green infrastructure planning. Cities 2021, 117, 103316. [Google Scholar] [CrossRef]
  16. Pearce, H.; Levine, J.G.; Cai, X.; MacKenzie, A.R. Introducing the Green Infrastructure for Roadside Air Quality (GI4RAQ) Platform: Estimating Site-Specific Changes in the Dispersion of Vehicular Pollution Close to Source. Forests 2021, 12, 769. [Google Scholar] [CrossRef]
  17. Zhang, J.B.; Zhu, H.R.; Zhang, P.Y.; Song, Y.P.; Zhang, Y.; Li, Y.Y.; Rong, T.Q.; Liu, Z.Y.; Yang, D.; Lou, Y.Y. Construction of GI Network Based on MSPA and PLUS Model in the Main Urban Area of Zhengzhou: A Case Study. Front. Environ. Sci. 2022, 10, 878656. [Google Scholar]
  18. Zhang, J.; Feng, X.; Shi, W.; Cui, J.; Peng, J.; Lei, L.; Zhang, J.; Astell-Burt, T.; Jiang, Y.; Ma, J. Health promoting green infrastructure associated with green space visitation. Urban For. Urban Green. 2021, 64, 127237. [Google Scholar] [CrossRef]
  19. Peng, J.; Yang, Y.; Liu, Y.; Hu, Y.N.; Du, Y.; Meersmans, J.; Qiu, S. Linking ecosystem services and circuit theory to identify ecological security patterns. Sci. Total Environ. 2018, 644, 781–790. [Google Scholar] [CrossRef] [PubMed] [Green Version]
  20. Guo, H.; Yu, Q.; Pei, Y.; Wang, G.; Yue, D. Optimization of landscape spatial structure aiming at achieving carbon neutrality in desert and mining areas. J. Clean. Prod. 2021, 322, 129156. [Google Scholar] [CrossRef]
  21. Wu, J.; Zhang, L.; Peng, J.; Feng, Z.; Liu, H.; He, S. The integrated recognition of the source area of the urban ecological security pattern in Shenzhen. Acta Ecol. Sin 2013, 33, 4125–4133. [Google Scholar]
  22. Yang, Y.; Chen, J.; Huang, R.; Feng, Z.; Zhou, G.; You, H.; Han, X. Construction of Ecological Security Pattern Based on the Importance of Ecological Protection-A Case Study of Guangxi, a Karst Region in China. Int. J. Environ. Res. Public Health 2022, 19, 108962. [Google Scholar]
  23. Zuo, Q.; Zhou, Y.; Wang, L.; Li, Q.; Liu, J.Y. Impacts of future land use changes on land use conflicts based on multiple scenarios in the central mountain region, China. Ecol. Indic. 2022, 137, 108743. [Google Scholar] [CrossRef]
  24. Gou, M.M.; Li, L.; Ouyang, S.; Shu, C.; Xiao, W.F.; Wang, N.; Hu, J.W.; Liu, C.F. Integrating ecosystem service trade-offs and rocky desertification into ecological security pattern construction in the Daning river basin of southwest China. Ecol. Indic. 2022, 138, 108845. [Google Scholar] [CrossRef]
  25. Tao, Q.; Gao, G.; Xi, H.; Wang, F.; Cheng, X.; Ou, W.; Tao, Y. An integrated evaluation framework for multiscale ecological protection and restoration based on multi-scenario trade-offs of ecosystem services: Case study of Nanjing City, China. Ecol. Indic. 2022, 140, 108962. [Google Scholar] [CrossRef]
  26. Zhang, Y.L.; Zhao, Z.Y.; Yang, Y.Y.; Fu, B.J.; Ma, R.M.; Lue, Y.H.; Wu, X. Identifying ecological security patterns based on the supply, demand and sensitivity of ecosystem service: A case study in the Yellow River Basin, China. J. Environ. Manag. 2022, 315, 115158. [Google Scholar] [CrossRef]
  27. Jiang, H.; Peng, J.; Dong, J.; Zhang, Z.; Xu, Z.; Meersmans, J. Linking ecological background and demand to identify ecological security patterns across the Guangdong-Hong Kong-Macao Greater Bay Area in China. Landsc. Ecol. 2021, 36, 2135–2150. [Google Scholar] [CrossRef]
  28. Dai, L.; Liu, Y.; Luo, X. Integrating the MCR and DOI models to construct an ecological security network for the urban agglomeration around Poyang Lake, China. Sci. Total Environ. 2021, 754, 141868. [Google Scholar] [CrossRef]
  29. Su, J.; Yin, H.; Kong, F. Ecological networks in response to climate change and the human footprint in the Yangtze River Delta urban agglomeration, China. Landsc. Ecol. 2021, 36, 2095–2112. [Google Scholar] [CrossRef]
  30. Hilty, J.A.; Keeley, A.T.; Merenlender, A.M.; Lidicker, W.Z., Jr. Corridor Ecology: Linking Landscapes for Biodiversity Conservation and Climate Adaptation; Island Press: Washington, DC, USA, 2019. [Google Scholar]
  31. Chen, Y.; Wang, J.L.; Kurbanov, E.; Thomas, A.; Sha, J.M.; Jiao, Y.M.; Zhou, J.C. Ecological security assessment at different spatial scales in central Yunnan Province, China. PLoS ONE 2022, 17, e0270267. [Google Scholar] [CrossRef]
  32. Peng, J.; Zhao, S.; Dong, J.; Liu, Y.; Meersmans, J.; Li, H.; Wu, J. Applying ant colony algorithm to identify ecological security patterns in megacities. Environ. Model. Softw. 2019, 117, 214–222. [Google Scholar] [CrossRef] [Green Version]
  33. Zhao, S.-M.; Ma, Y.-F.; Wang, J.-L.; You, X.-Y. Landscape pattern analysis and ecological network planning of Tianjin City. Urban For. Urban Green. 2019, 46, 126479. [Google Scholar] [CrossRef]
  34. Dong, J.; Peng, J.; Liu, Y.; Qiu, S.; Han, Y. Integrating spatial continuous wavelet transform and kernel density estimation to identify ecological corridors in megacities. Landsc. Urban Plan. 2020, 199, 103815. [Google Scholar] [CrossRef]
  35. Gao, J.; Du, F.; Zuo, L.; Jiang, Y. Integrating ecosystem services and rocky desertification into identification of karst ecological security pattern. Landsc. Ecol. 2021, 36, 2113–2133. [Google Scholar] [CrossRef]
  36. Wu, Y.; Han, Z.; Meng, J.; Zhu, L. Circuit theory-based ecological security pattern could promote ecological protection in the Heihe River Basin of China. Environ. Sci. Pollut. Res. 2022, 30, 27340–27356. [Google Scholar] [CrossRef] [PubMed]
  37. CBD. Zero draft of the post-2020 global biodiversity framework. In Proceedings of the Convention on Biological Diversity, Montreal, QC, Canada, 24–29 August 2020. [Google Scholar]
  38. Xu, H.; Cao, Y.; Yu, D.; Cao, M.; He, Y.; Gill, M.; Pereira, H.M. Ensuring effective implementation of the post-2020 global biodiversity targets. Nat. Ecol. Evol. 2021, 5, 411–418. [Google Scholar] [CrossRef] [PubMed]
  39. Gnacadja, L.; Vidal, A. How can science help to implement the UN Decade on Ecosystem Restoration 2021–2030? Philos. Trans. R. Soc. B Biol. Sci. 2023, 378, 1867. [Google Scholar] [CrossRef] [PubMed]
  40. UN. United Nations Decade on Ecosystem Restoration (2021–2030); United Nations: New York, NY, USA, 2019. [Google Scholar]
  41. Fang, X.; Zhou, B.; Tu, X.; Ma, Q.; Wu, J. “What kind of a science is sustainability science?” An evidence-based reexamination. Sustainability 2018, 10, 1478. [Google Scholar] [CrossRef] [Green Version]
  42. Cai, W.B.; Wu, T.; Jiang, W.; Peng, W.T.; Cai, Y.L. Integrating Ecosystem Services Supply-Demand and Spatial Relationships for Intercity Cooperation: A Case Study of the Yangtze River Delta. Sustainability 2020, 12, 4131. [Google Scholar] [CrossRef]
  43. Gao, J.; Wang, L.C. Embedding spatiotemporal changes in carbon storage into urban agglomeration ecosystem management—A case study of the Yangtze River Delta, China. J. Clean. Prod. 2019, 237, 117764. [Google Scholar] [CrossRef]
  44. Kang, J.M.; Li, C.L.; Zhang, B.L.; Zhang, J.; Li, M.R.; Hu, Y.M. How do natural and human factors influence ecosystem services changing? A case study in two most developed regions of China. Ecol. Indic. 2023, 146, 109891. [Google Scholar] [CrossRef]
  45. Zhang, C.; Xie, G.; Liu, C.; Fan, N.; Wang, X. Evaluation of water conservation of China’s ecosystems based on benchmark. Acta Ecol. Sin 2022, 22, 1–11. [Google Scholar]
  46. Zhou, J.; Gao, J.; Gao, Z.; Yang, W. Analyzing the water conservation service function of the forest ecosystem. Acta Ecol. Sin. 2018, 38, 1679–1686. [Google Scholar]
  47. Zhang, D.; Qu, L.; Zhang, J. Ecological security pattern construction method based on the perspective of ecological supply and demand: A case study of Yangtze River Delta. Acta Ecol. Sin 2019, 39, 7525–7537. [Google Scholar]
  48. Teng, H.F.; Liang, Z.Z.; Chen, S.C.; Liu, Y.; Rossel, R.A.V.; Chappell, A.; Yu, W.; Shi, Z. Current and future assessments of soil erosion by water on the Tibetan Plateau based on RUSLE and CMIP5 climate models. Sci. Total Environ. 2018, 635, 673–686. [Google Scholar] [CrossRef] [PubMed]
  49. Peng, J.; Pan, Y.J.; Liu, Y.X.; Zhao, H.J.; Wang, Y.L. Linking ecological degradation risk to identify ecological security patterns in a rapidly urbanizing landscape. Habitat Int. 2018, 71, 110–124. [Google Scholar] [CrossRef]
  50. Wei, L.; Zhou, L.; Sun, D.Q.; Yuan, B.; Hu, F.N. Evaluating the impact of urban expansion on the habitat quality and constructing ecological security patterns: A case study of Jiziwan in the Yellow River Basin, China. Ecol. Indic. 2022, 145, 109544. [Google Scholar] [CrossRef]
  51. Huang, M.; Yue, W.; Feng, S.; Zhang, J. Spatial-temporal evolution of habitat quality and analysis of landscape patterns in Dabie Mountain area of west Anhui province based on InVEST model. Acta Ecol. Sin 2020, 40, 2895–2906. [Google Scholar]
  52. Sharp, R.; Tallis, H.; Ricketts, T.; Guerry, A.; Wood, S.; Chaplin-Kramer, R.; Nelson, E.; Ennaanay, D.; Wolny, S.; Olwero, N. InVEST 3.2. 0 User’s Guide. In The Natural Capital Project; Stanford University: Stanford, CA, USA, 2018. [Google Scholar]
  53. Vogt, P.; Riitters, K. GuidosToolbox: Universal digital image object analysis. Eur. J. Remote Sens. 2017, 50, 352–361. [Google Scholar] [CrossRef]
  54. Vogt, P.; Riitters, K.H.; Iwanowski, M.; Estreguil, C.; Kozak, J.; Soille, P. Mapping landscape corridors. Ecol. Indic. 2007, 7, 481–488. [Google Scholar] [CrossRef]
  55. Vogt, P.; Ferrari, J.R.; Lookingbill, T.R.; Gardner, R.H.; Riitters, K.H.; Ostapowicz, K. Mapping functional connectivity. Ecol. Indic. 2009, 9, 64–71. [Google Scholar] [CrossRef]
  56. Martinez Pardo, J.; Saura, S.; Insaurralde, A.; Di Bitetti, M.S.; Paviolo, A.; De Angelo, C. Much more than forest loss: Four decades of habitat connectivity decline for Atlantic Forest jaguars. Landsc. Ecol. 2022, 38, 41–57. [Google Scholar] [CrossRef]
  57. Chen, X.; Peng, J.; Liu, Y.; Yang, Y.; Li, G. Constructing ecological security patterns in Yunfu city based on the framework of importance-sensitivity-connectivity. Geogr. Res 2017, 36, 471–484. [Google Scholar]
  58. Saura, S.; Pascual-Hortal, L. A new habitat availability index to integrate connectivity in landscape conservation planning: Comparison with existing indices and application to a case study. Landsc. Urban Plan. 2007, 83, 91–103. [Google Scholar]
  59. Fang, X.; Wu, J. Causes of overgrazing in Inner Mongolian grasslands: Searching for deep leverage points of intervention. Ecol. Soc. 2022, 27, 8. [Google Scholar] [CrossRef]
  60. An, Y.; Liu, S.L.; Sun, Y.X.; Shi, F.N.; Beazley, R. Construction and optimization of an ecological network based on morphological spatial pattern analysis and circuit theory. Landsc. Ecol. 2021, 36, 2059–2076. [Google Scholar] [CrossRef]
  61. McRae, B.H.; Hall, S.A.; Beier, P.; Theobald, D.M. Where to Restore Ecological Connectivity? Detecting Barriers and Quantifying Restoration Benefits. PLoS ONE 2012, 7, e52604. [Google Scholar] [CrossRef] [PubMed]
  62. Leonard, P.B.; Duffy, E.B.; Baldwin, R.F.; McRae, B.H.; Shah, V.B.; Mohapatra, T.K. gflow: Software for modelling circuit theory-based connectivity at any scale. Methods Ecol. Evol. 2017, 8, 519–526. [Google Scholar] [CrossRef] [Green Version]
  63. Dong, J.; Peng, J.; Xu, Z.; Liu, Y.; Wang, X.; Li, B. Integrating regional and interregional approaches to identify ecological security patterns. Landsc. Ecol. 2021, 36, 2151–2164. [Google Scholar] [CrossRef]
  64. Wang, Y.Z.; Gu, X.C.; Yu, H.R. Spatiotemporal Variation in the Yangtze River Delta Urban Agglomeration from 1980 to 2020 and Future Trends in Ecosystem Services. Land 2023, 12, 929. [Google Scholar] [CrossRef]
  65. Brennan, A.; Naidoo, R.; Greenstreet, L.; Mehrabi, Z.; Ramankutty, N.; Kremen, C. Functional connectivity of the world’s protected areas. Science 2022, 376, 1101–1104. [Google Scholar] [CrossRef]
  66. Gao, M.W.; Hu, Y.C.; Bai, Y.P. Construction of ecological security pattern in national land space from the perspective of the community of life in mountain, water, forest, field, lake and grass: A case study in Guangxi Hechi, China. Ecol. Indic. 2022, 139, 108867. [Google Scholar]
  67. Fang, X.; Li, J.; Ma, Q. Integrating green infrastructure, ecosystem services and nature-based solutions for urban sustainability: A comprehensive literature review. Sustain. Cities Soc. 2023, 98, 104843. [Google Scholar] [CrossRef]
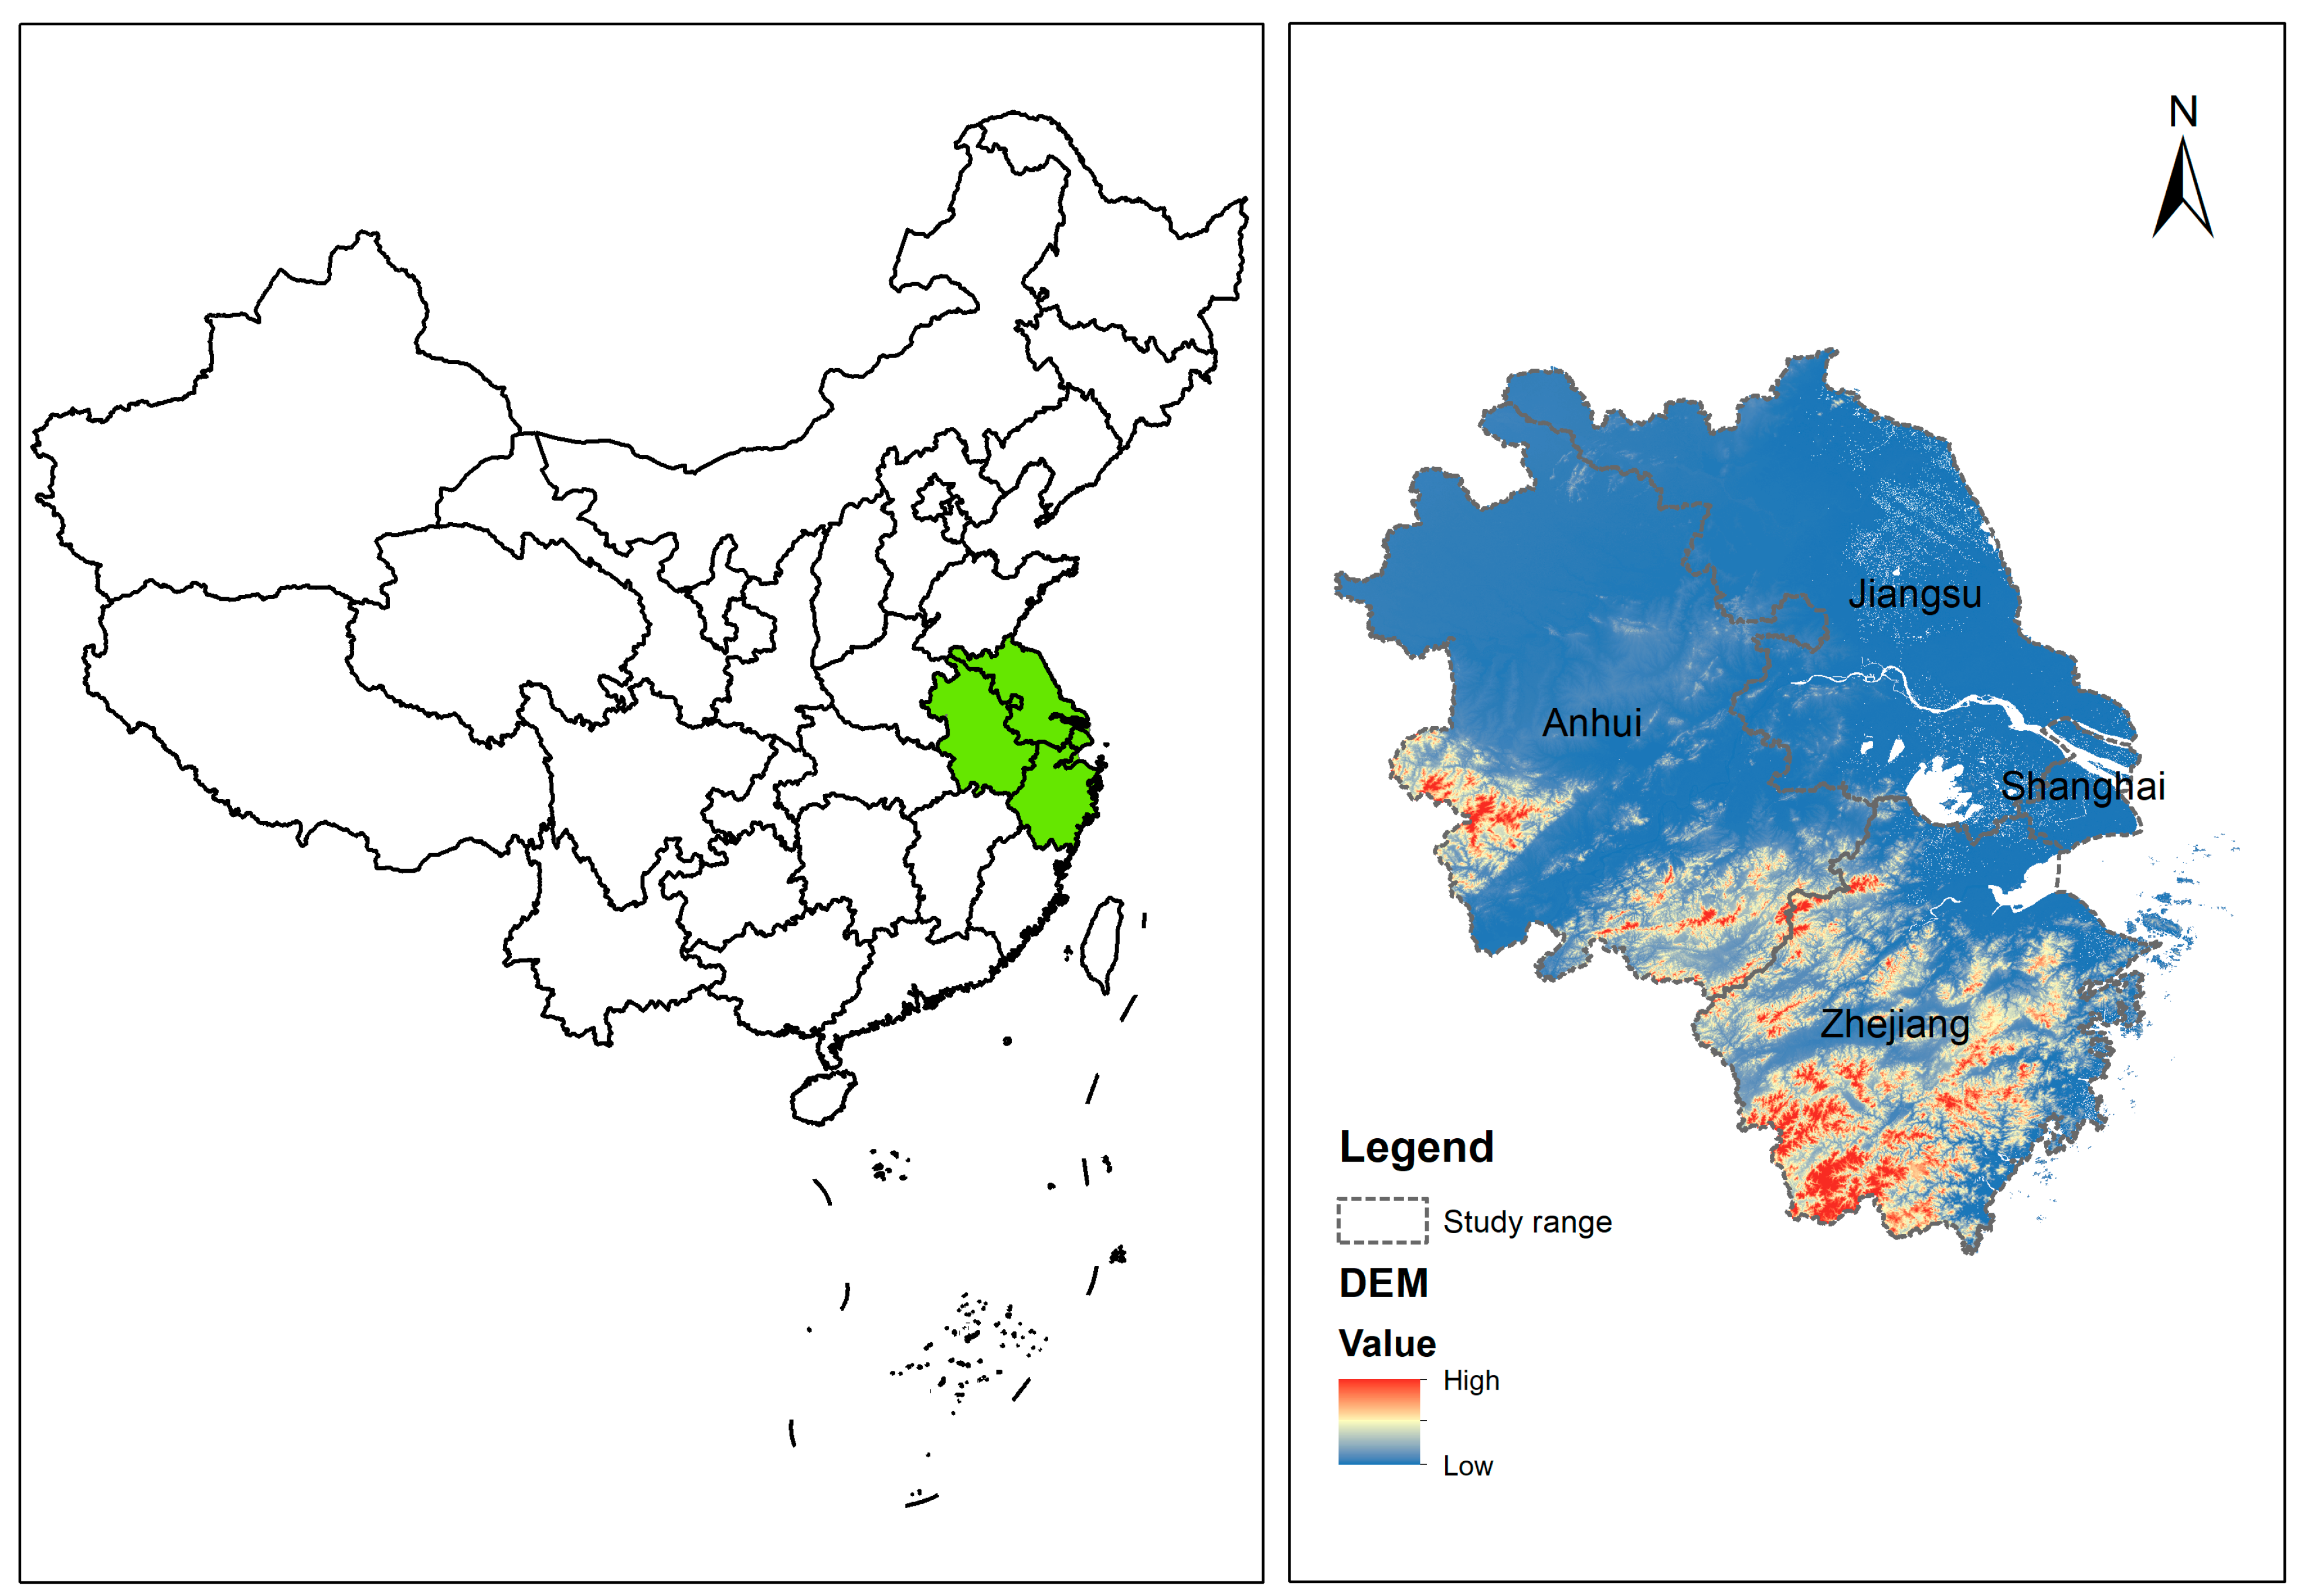
Figure 1. Overview of the research region. The picture on the left shows the location of the Yangtze River Delta in China. The picture on the right is the elevation map of the Yangtze River Delta. The redder the color, the higher the elevation, and the bluer the color, the lower the elevation.
Sustainability 15 12374 g001
Figure 2. Research flow chart.
Sustainability 15 12374 g002
Figure 3. Spatial pattern of carbon sequestration services and water conservation services in the Yangtze River Delta. (a) Spatial patterns of water conservation services. (b) Spatial patterns of carbon sequestration services. (c) Spatial patterns of biodiversity services. (d) Spatial patterns of soil and water conservation services.
Sustainability 15 12374 g003
Figure 4. Distribution map of ecological sources and ecological resistance surfaces. (a) Distribution of ecological sources. (b) Spatial pattern of ecological resistance surface.
Sustainability 15 12374 g004
Figure 5. Ecological key point identification map. (a) Distribution of ecological sources and corridors. (b) Spatial pattern of ecological barrier points and ecological pinch points.
Sustainability 15 12374 g005
Figure 6. Yangtze River Delta ecological security pattern.
Sustainability 15 12374 g006
Table 1. Threat factor attributes. The parameter settings in the table refer to the literature [49,50,51,52].
Threat SourcesMaximum Duress Distance/kmWeightsType of Spatial Recession
Paddy field40.5exponential
dry land10.15linear
urban land30.6linear
rural settlements51exponential
Other construction land20.4linear
Table 2. Sensitivity of land surface to threat factors.
Land Use/Cover TypeHabitat SuitabilityPaddy FieldDry LandUrban LandRural Residential AreaOther Construction Land
Paddy field0.400.10.50.30.2
Dry land0.20.200.50.20.2
Wooded land10.80.810.80.6
Shrubs0.80.40.40.60.40.2
woodland0.60.80.810.80.5
Other woodlands0.60.60.60.90.80.5
High cover grassland0.90.70.70.90.80.6
Medium covered grassland0.70.40.40.60.50.3
Low cover grassland0.50.30.30.60.40.4
River0.60.70.60.80.60.4
Lake0.80.70.60.80.70.5
Reservoir Pond0.70.80.70.70.70.4
Beach0.70.60.60.80.70.5
Urban land000000
Rural residential area000000
Industrial and mining land000000
Sand0.10.20.60.80.70.6
Gobi0.10.10.50.70.70.6
Bare soil0.20.10.50.70.80.7
Hare rock0.30.10.50.80.70.6
Paddy field0.400.10.50.30.2
Dry land0.20.200.50.20.2
Table 3. MSPA landscape types and their implications.
Landscape TypeEcological Meaning
Core areaLarger habitat patches in foreground pixels can provide larger habitats for species, which is of great significance to the protection of biodiversity and is the ecological source of ecological networks.
BridgeThe narrow and long areas connecting the core area represent the corridors connecting the patches in the ecological network, which is of great significance for biological migration and landscape connection.
EdgeIt is the transition area between the core area and the main non-green landscape area.
BranchCorridors connecting the same core area are shortcuts for species migration in the same core area.
RingThe transition area between the core area and the non-green landscape patch, that is, the inner patch edge.
IslandA region connected at only one end to an edge region, bridge region, ring region, or pore.
PerforationIsolated and broken small plaques that are not connected to each other, the degree of connection between the plaques is relatively low, and the possibility of internal material and energy exchange and transmission is relatively small.
Disclaimer/Publisher’s Note: The statements, opinions and data contained in all publications are solely those of the individual author(s) and contributor(s) and not of MDPI and/or the editor(s). MDPI and/or the editor(s) disclaim responsibility for any injury to people or property resulting from any ideas, methods, instructions or products referred to in the content.